

Abstract
Rationale
The leading cause of death in coronavirus disease 2019 (COVID-19) is severe pneumonia, with many patients developing acute respiratory distress syndrome (ARDS) and diffuse alveolar damage (DAD). Whether DAD in fatal COVID-19 is distinct from other causes of DAD remains unknown.
Objective
To compare lung parenchymal and vascular alterations between patients with fatal COVID-19 pneumonia and other DAD-causing etiologies using a multidimensional approach.
Methods
This autopsy cohort consisted of consecutive patients with COVID-19 pneumonia (n = 20) and with respiratory failure and histologic DAD (n = 21; non–COVID-19 viral and nonviral etiologies). Premortem chest computed tomography (CT) scans were evaluated for vascular changes. Postmortem lung tissues were compared using histopathological and computational analyses. Machine-learning-derived morphometric analysis of the microvasculature was performed, with a random forest classifier quantifying vascular congestion (CVasc) in different microscopic compartments. Respiratory mechanics and gas-exchange parameters were evaluated longitudinally in patients with ARDS.
Measurements and Main Results
In premortem CT, patients with COVID-19 showed more dilated vasculature when all lung segments were evaluated (P = 0.001) compared with controls with DAD. Histopathology revealed vasculopathic changes, including hemangiomatosis-like changes (P = 0.043), thromboemboli (P = 0.0038), pulmonary infarcts (P = 0.047), and perivascular inflammation (P < 0.001). Generalized estimating equations revealed significant regional differences in the lung microarchitecture among all DAD-causing entities. COVID-19 showed a larger overall CVasc range (P = 0.002). Alveolar-septal congestion was associated with a significantly shorter time to death from symptom onset (P = 0.03), length of hospital stay (P = 0.02), and increased ventilatory ratio [an estimate for pulmonary dead space fraction (Vd); p = 0.043] in all cases of ARDS.
Conclusions
Severe COVID-19 pneumonia is characterized by significant vasculopathy and aberrant alveolar-septal congestion. Our findings also highlight the role that vascular alterations may play in Vd and clinical outcomes in ARDS in general.
Keywords: COVID-19, ARDS, vasculopathy, vascular congestion, ventilatory ratio
At a Glance Commentary
Scientific Knowledge on the Subject
Several autopsy case series have reported diffuse alveolar damage (DAD) in over 90% of fatal coronavirus disease (COVID-19) cases, and DAD in COVID-19 appears to be associated with increased pulmonary vascular microthrombi but is otherwise indistinguishable DAD due to other causes, on the basis of traditional histologic assessments. Limited radiological reports without pathology correlation have noted abnormalities in regionally dilated pulmonary vessels on computed tomography imaging. Clinical studies on mechanically ventilated patients with COVID-19–associated-ARDS have reported increased ventilatory ratio and hypercapnia, reflecting increases in pulmonary dead space ventilation.
What This Study Adds to the Field
This study combines detailed radiological, histologic, and morphometric analyses to reveal significant vascular changes of the lung microarchitecture in patients with fatal COVID-19 and ARDS, including distinctive alveolar septal congestion, which associates with ventilatory ratio (an estimate for pulmonary dead space fraction), shorter length of hospital stay, and shorter time to death from symptom onset in ARDS in general. This proof-of-concept study provides a microarchitectural basis for future clinical and mechanistic work assessing the role of vasculopathy in dead space ventilation and pathogenesis of COVID-19 and ARDS.
Coronavirus disease 2019 (COVID-19), caused by infection with the novel severe acute respiratory syndrome coronavirus-2 (SARS-CoV-2), has a wide range of clinical manifestations from asymptomatic states to fulminant disease (1). Patients with severe pneumonia can present with acute respiratory distress syndrome (ARDS) and multiorgan dysfunction (2). Several recent descriptive autopsy reports of patients with COVID-19 have identified diffuse alveolar damage (DAD) in over 90% of cases, which appears comparable with the proportion of patients with DAD in other fatal viral infections (3).
Traditional histopathological studies have suggested that DAD caused by COVID-19 appears to be associated with increased microthrombi (4) but is otherwise indistinguishable from DAD due to other causes (3–5). However, a comprehensive, integrative, and quantitative understanding of the effect of SARS-CoV-2 in the lung, particularly the pulmonary vasculature, is still lacking. Here, we use combined radiological, histopathological, and computational analyses (Figure 1) to examine the morphological features and spatial architecture and correlate them with respiratory mechanics and gas-exchange parameters in fatal COVID-19 pneumonia in comparison with other viral and nonviral etiologies of DAD.
Figure 1.
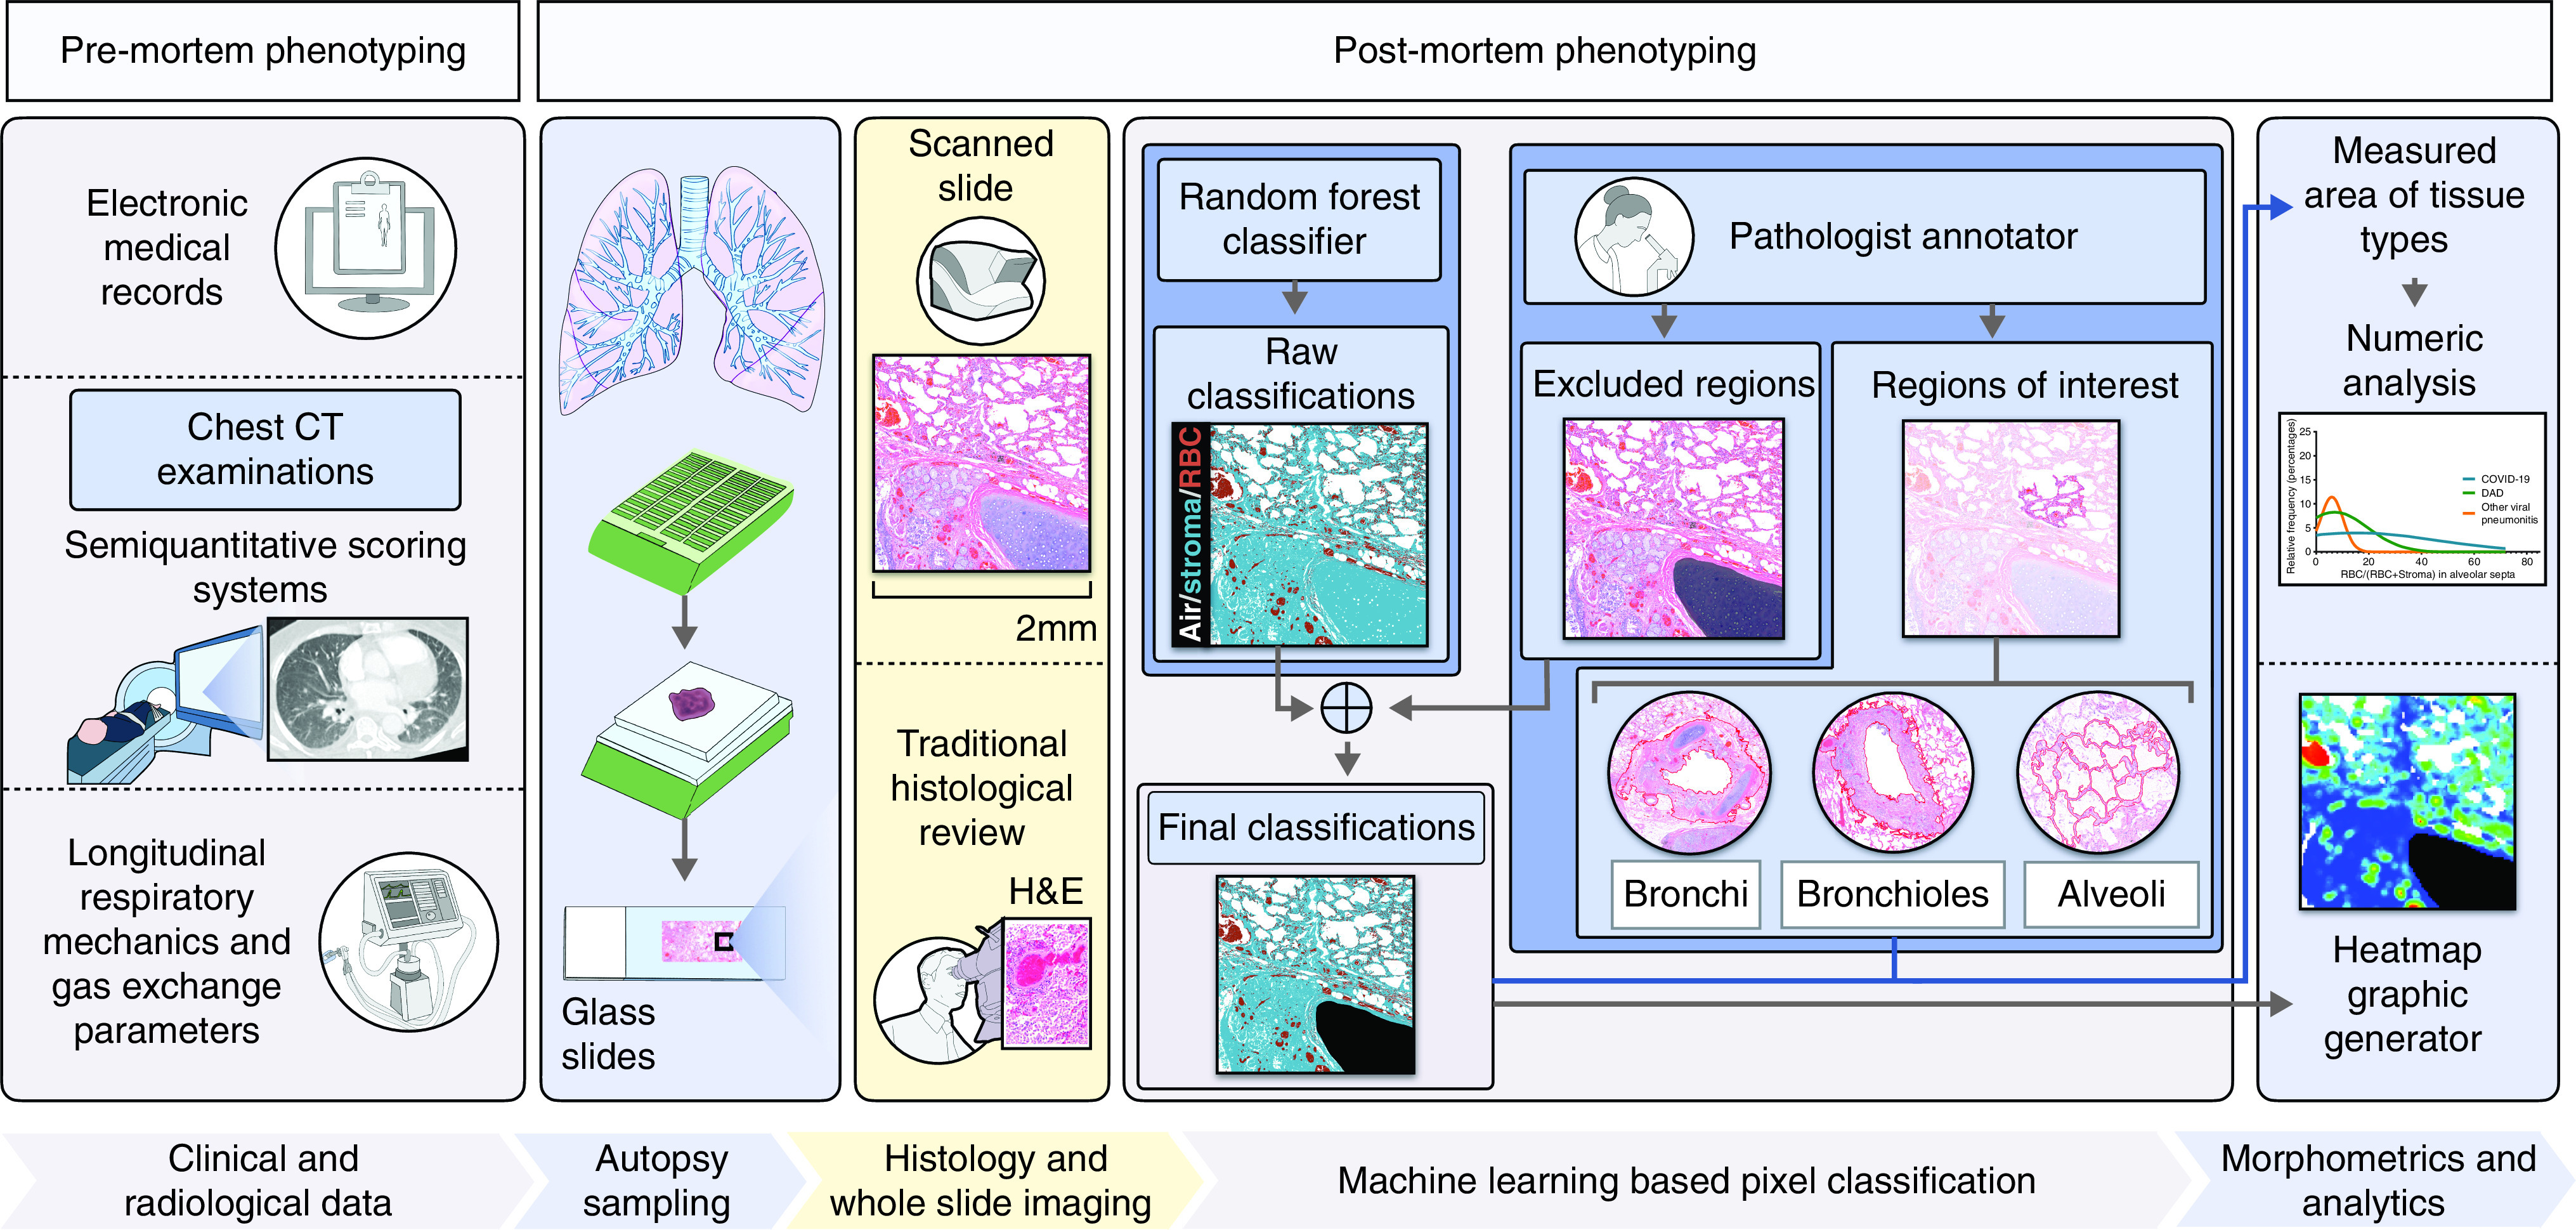
Flow chart showing multidimensional discovery approach using histopathological, computational, and radiological analyses. This research process of uncovering the pathological basis of coronavirus disease (COVID-19)–related lung disease involves a combination of deep clinicopathological phenotyping (comprehensive characterization of clinical cases through radiological and histopathological methods), and morphometric analyses using a random forest pixel classifier identifying the density of red blood cells in the lung microarchitecture. Longitudinal data on respiratory mechanics and gas-exchange parameters in patients meeting the Berlin Definition for acute respiratory disease syndrome (ARDS) (7) were collected and used for clinicopathological correlation. Semiquantitative radiological phenotyping was performed with conventional premortem chest computed tomography (CT) examinations by a thoracic radiologist. Semiquantitative traditional histopathologic phenotyping was performed by two pulmonary pathologists on hematoxylin and eosin (H&E)–stained slides derived from formalin-fixed paraffin-embedded (FFPE) tissue blocks obtained from postmortem lung tissue. The morphometric analysis involved manual annotation of regions of interest within the lung airway tree microarchitecture (and excluded regions) by pathologists. A machine-learning–derived pixel classification labeled each pixel in high-resolution whole slide images as stroma, red blood cell (RBC), or air. The final classification data were then summed over regions of interest to produce detailed quantitative measurements. Further details are provided in the Methods and in the online supplement (Supplemental Methods).
Methods
Study Design and Participants
Twenty consecutive autopsies of patients who died after SARS-CoV-2 infection were performed at the Massachusetts General Hospital in Boston during the peak of the initial COVID-19 surge (March 30, 2020–May 7, 2020). The study was approved by the hospital’s institutional review board. Written informed consent for the autopsy was obtained from next of kin or healthcare proxy as appropriate for all patients. Inclusion criteria included a confirmed diagnosis of SARS-CoV-2 infection by nucleic acid testing on premortem nasopharyngeal swab, along with postmortem assessment confirming COVID-19 as the primary cause of death.
Additionally, a control set of 21 prepandemic autopsies of non–COVID-19 patients with lethal respiratory failure and histologic evidence of DAD was identified for comparison. Of these non–COVID-19 DAD controls, 14 showed DAD of nonviral etiologies, and seven showed DAD from viral infections. Exclusion criteria for all cases included the presence of known preexisting underlying fibrotic interstitial lung disease and age <18 years old. We also excluded cases of primary nonsystemic bacterial or fungal pneumonia, as these tend to have a more neutrophilic/abscess-type histopathological morphology, which is distinct from both virus-associated DAD (including COVID-19–related) and noninfectious etiologies of DAD. Clinical information was obtained from the electronic medical record. Further details, including the etiologies of the non–COVID-19 DAD controls are described in the online supplement (Supplemental Methods; Table E1).
Procedures
Chest imaging
Chest computed tomography (CT) examinations were performed on a subset of patients for routine clinical care, with a slice thickness of 1.25 mm according to standard clinical protocols, and reviewed by a thoracic radiologist blinded to clinical and pathological data. Each segment of the five lung lobes was evaluated for dilated segmental or subsegmental vessels, with a nonseverity score based on the distribution of the vessels as follows: 0 = no dilated vessels, 1 = either dilated peripheral or central vessels, and 2 = dilated central and peripheral vessels. We also calculated a global dilated vessel score, which incorporates information on all the lung segments and is the result of adding all the individual segmental vessel scores in each patient. In addition, lung involvement by mosaic attenuation, ground-glass, or consolidative opacities was semiquantitatively scored. Mosaic attenuation was assessed outside the areas of opacity in morphologically normal lung parenchyma. Further details on the evaluation of these other CT scan findings and the scoring systems that were used in this study are described in the online supplement (Supplemental Methods).
Histology
Lung tissue from patients with COVID-19 was obtained from autopsies completed under a standardized protocol following CDC guidelines (Supplemental Methods; Figure E1). A total of 50 lung formalin-fixed paraffin-embedded tissue blocks per patient were processed and assessed with routine hematoxylin and eosin (H&E)-stained slides. Each H&E-stained slide was semiquantitatively scored for a variety of histologic features by two pulmonary pathologists blinded to clinical and radiological data (Table E2).
Morphometric analysis
From each autopsy, two H&E-stained lung slides were selected by a pathologist and scanned under 80× optical magnification at approximately 8,200 pixels per micron. A random forest classifier was trained and used to label every pixel in each scanned image as belonging in one of three categories: stroma, red blood cell (RBC), or air (Figure 2A; Figures E2–E4). Of note, the classifier does not distinguish between different types of stromal tissue present. Analyses were performed within QuPath (6), which uses the OpenCV library for pixel classification. Regions of interest (ROI) were manually selected by two pathologists using QuPath’s annotation tools and included cartilaginous airways, noncartilaginous airways, and alveolar septa (intra-alveolar space was excluded). The final classification was applied within ROI to produce detailed quantitative measurements within microarchitectural compartments, such that one classifier was used throughout (Figure E5). For example, bronchiolar stroma was defined by pixels designated as stroma within a manually annotated bronchiolar structure. Of note, annotations were not performed within areas of lung infarction and necrosis, areas with extensive intra-alveolar hemorrhage or inflammation, areas of fibrosis, or areas in which the lung microarchitecture was severely disrupted.
Figure 2.

Quantification of vascular congestion in the lung microarchitecture by a machine-learning–derived pixel classification. (A) A side-by-side illustration of the performance of the final classifier, and a corresponding H&E image is depicted. RBCs are indicated in red; stroma, in blue; and air, in white. Morphometric data of the vascular congestion (CVasc) in manually selected regions of interest in highly and minimally congested regions of the lung parenchyma were compared in whole slide images of H&E-stained slides of patients with COVID-19, and diffuse alveolar damage (DAD) of nonviral and viral etiologies. (B) Representative microphotographs of WSIs of H&E-stained slides in minimally and markedly congested regions of contiguous alveoli are presented with their corresponding heatmaps of congestion. Heatmaps were generated by computing the fraction of tissue (stroma or red blood cell) that is blood within circular apertures centered on each grid of points spanning the image.
After microarchitectural segmentation, quantitative data of the classification in ROI were used for morphometrical determination of the vascular congestion (CVasc), which represents the proportion of surface area occupied by (dilated) vascular lumina in specific compartments of the lung parenchyma, defined as:
Where RBCpix and Stromapix are equal to RBC and stroma pixels, respectively.
Morphometric data were obtained from all the ROI manually annotated in whole slide images (WSIs) representing highly and minimally congested regions of the lung parenchyma (Figure 2B). Morphometric data were classified as “intraslide” when obtained within a single WSI and as “interslide” when obtained from all WSIs of each patient. From each autopsy, we also separately designated one individual annotation with the highest CVasc (interslide-MaxCVasc) and the lowest CVasc (interslide-MinCVasc) within each microarchitectural compartment. We calculated the interslide-alveolar-septal CVasc range (interslide-alveolar ΔCongestion) as follows:
Of note, the interslide-alveolar ΔCongestion likely reflects the heterogeneity of alveolar-septal CVasc at the macroscopic level.
We also calculated the arithmetic mean CVasc (AM-alveolar CVasc) per case, which is equal to the average alveolar CVasc value of all manual alveolar-septal annotations per autopsy. Therefore, only one value of AM-alveolar CVasc is generated per autopsy case. Further details of the morphometric analyses are described in the Supplemental Methods.
Pathophysiology in ARDS
Berlin Definition
We retrospectively categorized patients with ARDS by the Berlin Definition (7). Data for categorization were obtained within 24 hours of initiation of invasive mechanical ventilation. Cases were assessed for ARDS by a physician certified in pulmonary disease and critical care medicine.
Respiratory mechanics and gas-exchange parameters
Electronic medical records of patients with ARDS were reviewed for demographic, clinical, and gas-exchange laboratory variables. Hourly data of respiratory mechanics in the last 72 hours before death were also obtained. Gas-exchange laboratory data obtained included: arterial partial pressure of oxygen (PaO2), arterial oxygen saturation (SaO2), spot oxygen saturation (SpO2), partial pressure of carbon dioxide (PaCO2), arterial pH, and arterial bicarbonate. Respiratory mechanics data obtained included: the fraction of inspired oxygen (FiO2), positive end-expiratory pressure (PEEP), peak inspiratory pressure, plateau pressure, tidal volume, total minute ventilation, and respiratory rate.
We used the ventilatory ratio (VR) as a simple surrogate for directly measured pulmonary physiological dead space fraction (Vd), as it can be calculated at the bedside (8, 9) by comparing actual measurements of minute ventilation and PaCO2 with predicted values of minute ventilation and PaCO2, as defined by the following equation:
We also calculated other parameters in each patient, including the PaO2/FiO2 ratio, the SpO2/FiO2 ratio, lung static compliance (Crs), driving pressure, and mechanical power. Further details and the formulas used to calculate these other parameters are described in the Supplemental Methods.
Statistical analyses
Analyses were performed using R (version 4.1.2), Python SciPy v.1.4.1, JMP 16.0 (SAS Institute Inc.), and GraphPad Prism 7.0 (GraphPad Software, Inc.). Further statistical details are described in the Supplemental Methods.
Results
Demographic and clinical characteristics of all patients are presented in Table 1. There were no significant differences in sex, age, body mass index (BMI), place of death, time to death from symptom onset, immunosuppression, anticoagulant or immunosuppressive therapy, and renal replacement therapy between patients with COVID-19 and non–COVID-19 DAD controls. No significant differences in premortem hematocrit values were seen between patients with COVID-19 and controls with DAD (P = 0.091; Figure E6).
Table 1.
Patient Characteristics
| Controls with Non–COVID-19 DAD (n = 21) |
P Value |
|||||
|---|---|---|---|---|---|---|
| Patients with COVID-19 (n = 20) | All (n = 21) |
Non-Viral DAD (n = 14) |
Viral DAD (n = 7) |
Two-group Comparison* | Multigroup Comparisons† | |
| Demographics | ||||||
| Sex, ratio (men:women) | 1.5:1 | 1.6:1 | 1.3:1 | 2.5:1 | 0.55 | 0.81 |
| Age, mean (±SD) | 64.1 (±19.3) | 53.3 (±19.0) | 57.3 (±17.3) | 45.1 (±20.8) | 0.10 | 0.13 |
| BMI, in kg/m2, mean (±SD) | 34.5 (±9.2) | 30.2 (±6.5) | 29.4 (±6.6) | 32.0 (±6.1) | 0.11 | 0.19 |
| Place of death, n (%) | ||||||
| Hospital | 17 (85) | 21 (100) | 14 (100) | 7 (100) | 0.11 | 0.18 |
| Extended care facility | 3 (15) | 0 (0) | 0 (0) | 0 (0) | 0.11 | 0.18 |
| Clinical outcomes | ||||||
| Hospital stay, in days, mean (±SD) | 8.2 (±5.2)‡ | 14.4 (±10.6)§ | 15.9 (±9.4)ǁ | 11.6 (±10) | 0.039¶ | 0.11¶ |
| Time to death from symptom onset, in days, mean (±SD) | 13.9 (±7.7)‡ | 20.0 (±16.6)§ | 20.1 (±12.0)ǁ | 19.7 (±18.7) | 0.17¶ | 0.34¶ |
| ICU admission, n (%) | 13 (76)‡ | 20 (100)§ | 13 (100)ǁ | 7 (100) | 0.04 | 0.07 |
| Clinical characteristics, n (%) | ||||||
| Meets Berlin Definition for ARDS | 11 (65)‡ | 16 (80) | 11 (85)ǁ | 5 (71) | 0.17 | 0.33 |
| Severe pneumonia/ARDS** | 4 (24)‡ | 0 (0)§ | 0 (0)ǁ | 0 (0) | 0.02 | 0.07 |
| Ventilatory support | ||||||
| Invasive mechanical ventilation, n (%) | 13 (76)‡ | 20 (100)§ | 13 (100)ǁ | 7 (100) | 0.01 | 0.02 |
| Intubation length, mean (±SD) | 7.2 (±4.9) | 8.2 (±8.5) | 8.1 (±7.1) | 8.3 (±11.3) | 0.92 | 0.95 |
| ECMO, n (%) | 1 (5) | 3 (14)§ | 1 (8)ǁ | 2 (29) | 0.60 | 0.19 |
| ARDS patients | ||||||
| Nadir, PaO2/FiO2 within 24 h of intubation, mean (±SD) | 139.2 (±73)‡ | 127.5 (±63)§ | 147 (±66.7)ǁ | 84.6 (14.4) | 0.67 | 0.19 |
| Hypoxemia severity within 24 h of intubation, n (%) | ||||||
| Mild | ||||||
| PaO2/FiO2, 201–300 mm Hg | 3 (27) | 3 (19) | 3 (27) | 0 (0) | ||
| SpO2/FiO2, 236–315 mm Hg | ||||||
| Moderate | ||||||
| PaO2/FiO2, 101–200 mm Hg | 3 (27) | 6 (38) | 5 (46) | 1 (20) | 0.81 | 0.28 |
| SpO2/FiO2, 151–235 mm Hg | ||||||
| Severe | ||||||
| PaO2/FiO2, ⩽100 mm Hg | 5 (46) | 7 (44) | 3 (27) | 4 (80) | ||
| SpO2/FiO2, ⩽150 mm Hg | ||||||
| Immunocompromised states, n (%) | ||||||
| Any immunosuppression | 6 (30) | 10 (50)§ | 7 (54)ǁ | 3 (43) | 0.33 | 0.39 |
| Connective tissue or autoimmune disorders | 5 (25) | 5 (25)§ | 2 (15)ǁ | 3 (43) | 1.0 | 0.40 |
| Transplantation, n (%) | ||||||
| Hematopoietic cell | 0 (0) | 3 (15)§ | 3 (23)ǁ | 0 (0) | 0.23 | 0.034 |
| Solid organ | 1 (5) | 1 (5)§ | 0 (0)ǁ | 1 (14) | 1.0 | 0.38 |
| HIV infection | 0 (0) | 1 (5)§ | 1 (8)ǁ | 0 (0) | 1.0 | 0.34 |
| Treatments, n (%) | ||||||
| Anticoagulant agents | ||||||
| Not in anticoagulation | 5 (25) | 5 (25)§ | 3 (23)ǁ | 2 (29) | 1.0 | 0.96 |
| Prophylactic dose | 9 (45) | 4 (20)§ | 4 (31)ǁ | 0 (0) | 0.18 | 0.090 |
| Treatment dose | 6 (30) | 11 (55)§ | 6 (26)ǁ | 5 (71) | 0.20 | 0.068 |
| Immunosuppressive therapy | ||||||
| Any therapy | 14 (70) | 14 (70)§ | 9 (69)ǁ | 5 (71) | 1.0 | 0.99 |
| Corticosteroids | 9 (45) | 14 (70)§ | 9 (69)ǁ | 5 (71) | 0.20 | 0.28 |
| Immune modulators | 14 (70) | 7 (35)§ | 4 (31)ǁ | 3 (43) | 0.056 | 0.075 |
| Other treatments | ||||||
| Renal replacement therapy | 4 (24) | 10 (50) | 6 (46) | 4 (57) | 0.09 | 0.22 |
Definition of abbreviations: ARDS = acute respiratory distress syndrome; BMI = body mass index; COVID-19 = coronavirus disease; DAD = diffuse alveolar damage; ECMO = extracorporeal membrane oxygenation; HIV = human immunodeficiency virus; ICU = intensive care unit.
Data are presented as n (%), ratio, or mean (± standard deviation).
Two-group comparisons were performed between patients with COVID-19 and all controls with non–COVID-19 DAD.
Multigroup comparisons were performed between patients with COVID-19, patients with non-viral DAD, and controls with viral DAD.
n = 17.
n = 20.
n = 13.
The log-rank (Mantel-Cox) test was used to compare the differences in survival distributions of the different subcohorts.
Patients who were not intubated because of goals of care (do-not-intubate [DNI] order) who would have met ARDS criteria once intubated on PEEP and with pathologic evidence consistent with DAD. P values were calculated by Fisher’s exact test, chi-square test, or Mann-Whitney U test.
The number of patients meeting the Berlin Definition for ARDS (7) was not statistically different between patients with COVID-19 and non–COVID-19 DAD controls (P = 0.17), and among those, there were no significant differences in hypoxemia severity within 24 hours of intubation. Patients with COVID-19 had a significantly shorter hospital stay (P = 0.039) and were less likely to be mechanically ventilated than non–COVID-19 DAD controls (P = 0.0034). However, all patients with severe COVID-19 pneumonia (n = 4) who were not mechanically ventilated because of goals of care (do-not-intubate orders) had mild-to-severe hypoxemia and showed pathologic evidence of DAD. Other relevant clinical characteristics and laboratory values are listed in the online supplement (Supplemental Results; Tables E3 and E4).
Premortem Imaging
Premortem full chest CT examinations were available in a subset of patients with COVID-19 (n = 6) and controls with non–COVID-19 DAD (n = 8). The median time from symptom onset to CT imaging did not differ significantly between patients with COVID-19 and controls with non–COVID-19 DAD (P = 0.30; Supplemental Results). We did not find relevant demographic and clinical differences in patients with COVID-19 who had a CT scan performed versus the ones who did not. Controls with non–COVID-19 DAD who had a chest CT scan performed were more likely to be older and to receive a prophylactic dose of anticoagulants than the ones who did not. However, the overall rate of anticoagulation (including the use of full dose of anticoagulation) between both groups of non–COVID-19 patients was not statistically different. Further clinical details of the patients who underwent chest CT examinations are provided in the online supplement (Supplemental Results; Table E5).
Dilated pulmonary vessels were seen in all patients with COVID-19 (n = 6/6), and in all controls with non–COVID-19 DAD except one (n = 7/8), and were scored on the basis of the distribution of the vessels (Figure 3A). Statistically significant differences were seen in six different lung segments when comparing the dilated pulmonary vessel scores of patients with COVID-19 and controls with DAD (Figures 3B and 3C). Additionally, patients with COVID-19 exhibited statistically significant higher mean dilated vessel scores compared with controls with non–COVID-19 DAD (Figure 3D; p = 0.001). The global dilated vessel score was also significantly higher in patients with COVID-19 compared with controls with non–COVID-19 DAD (Figure 3E; patients with COVID-19: 13.5 ± 4.0, controls with DAD: 3.6 ± 2.4, P = 0.001).
Figure 3.
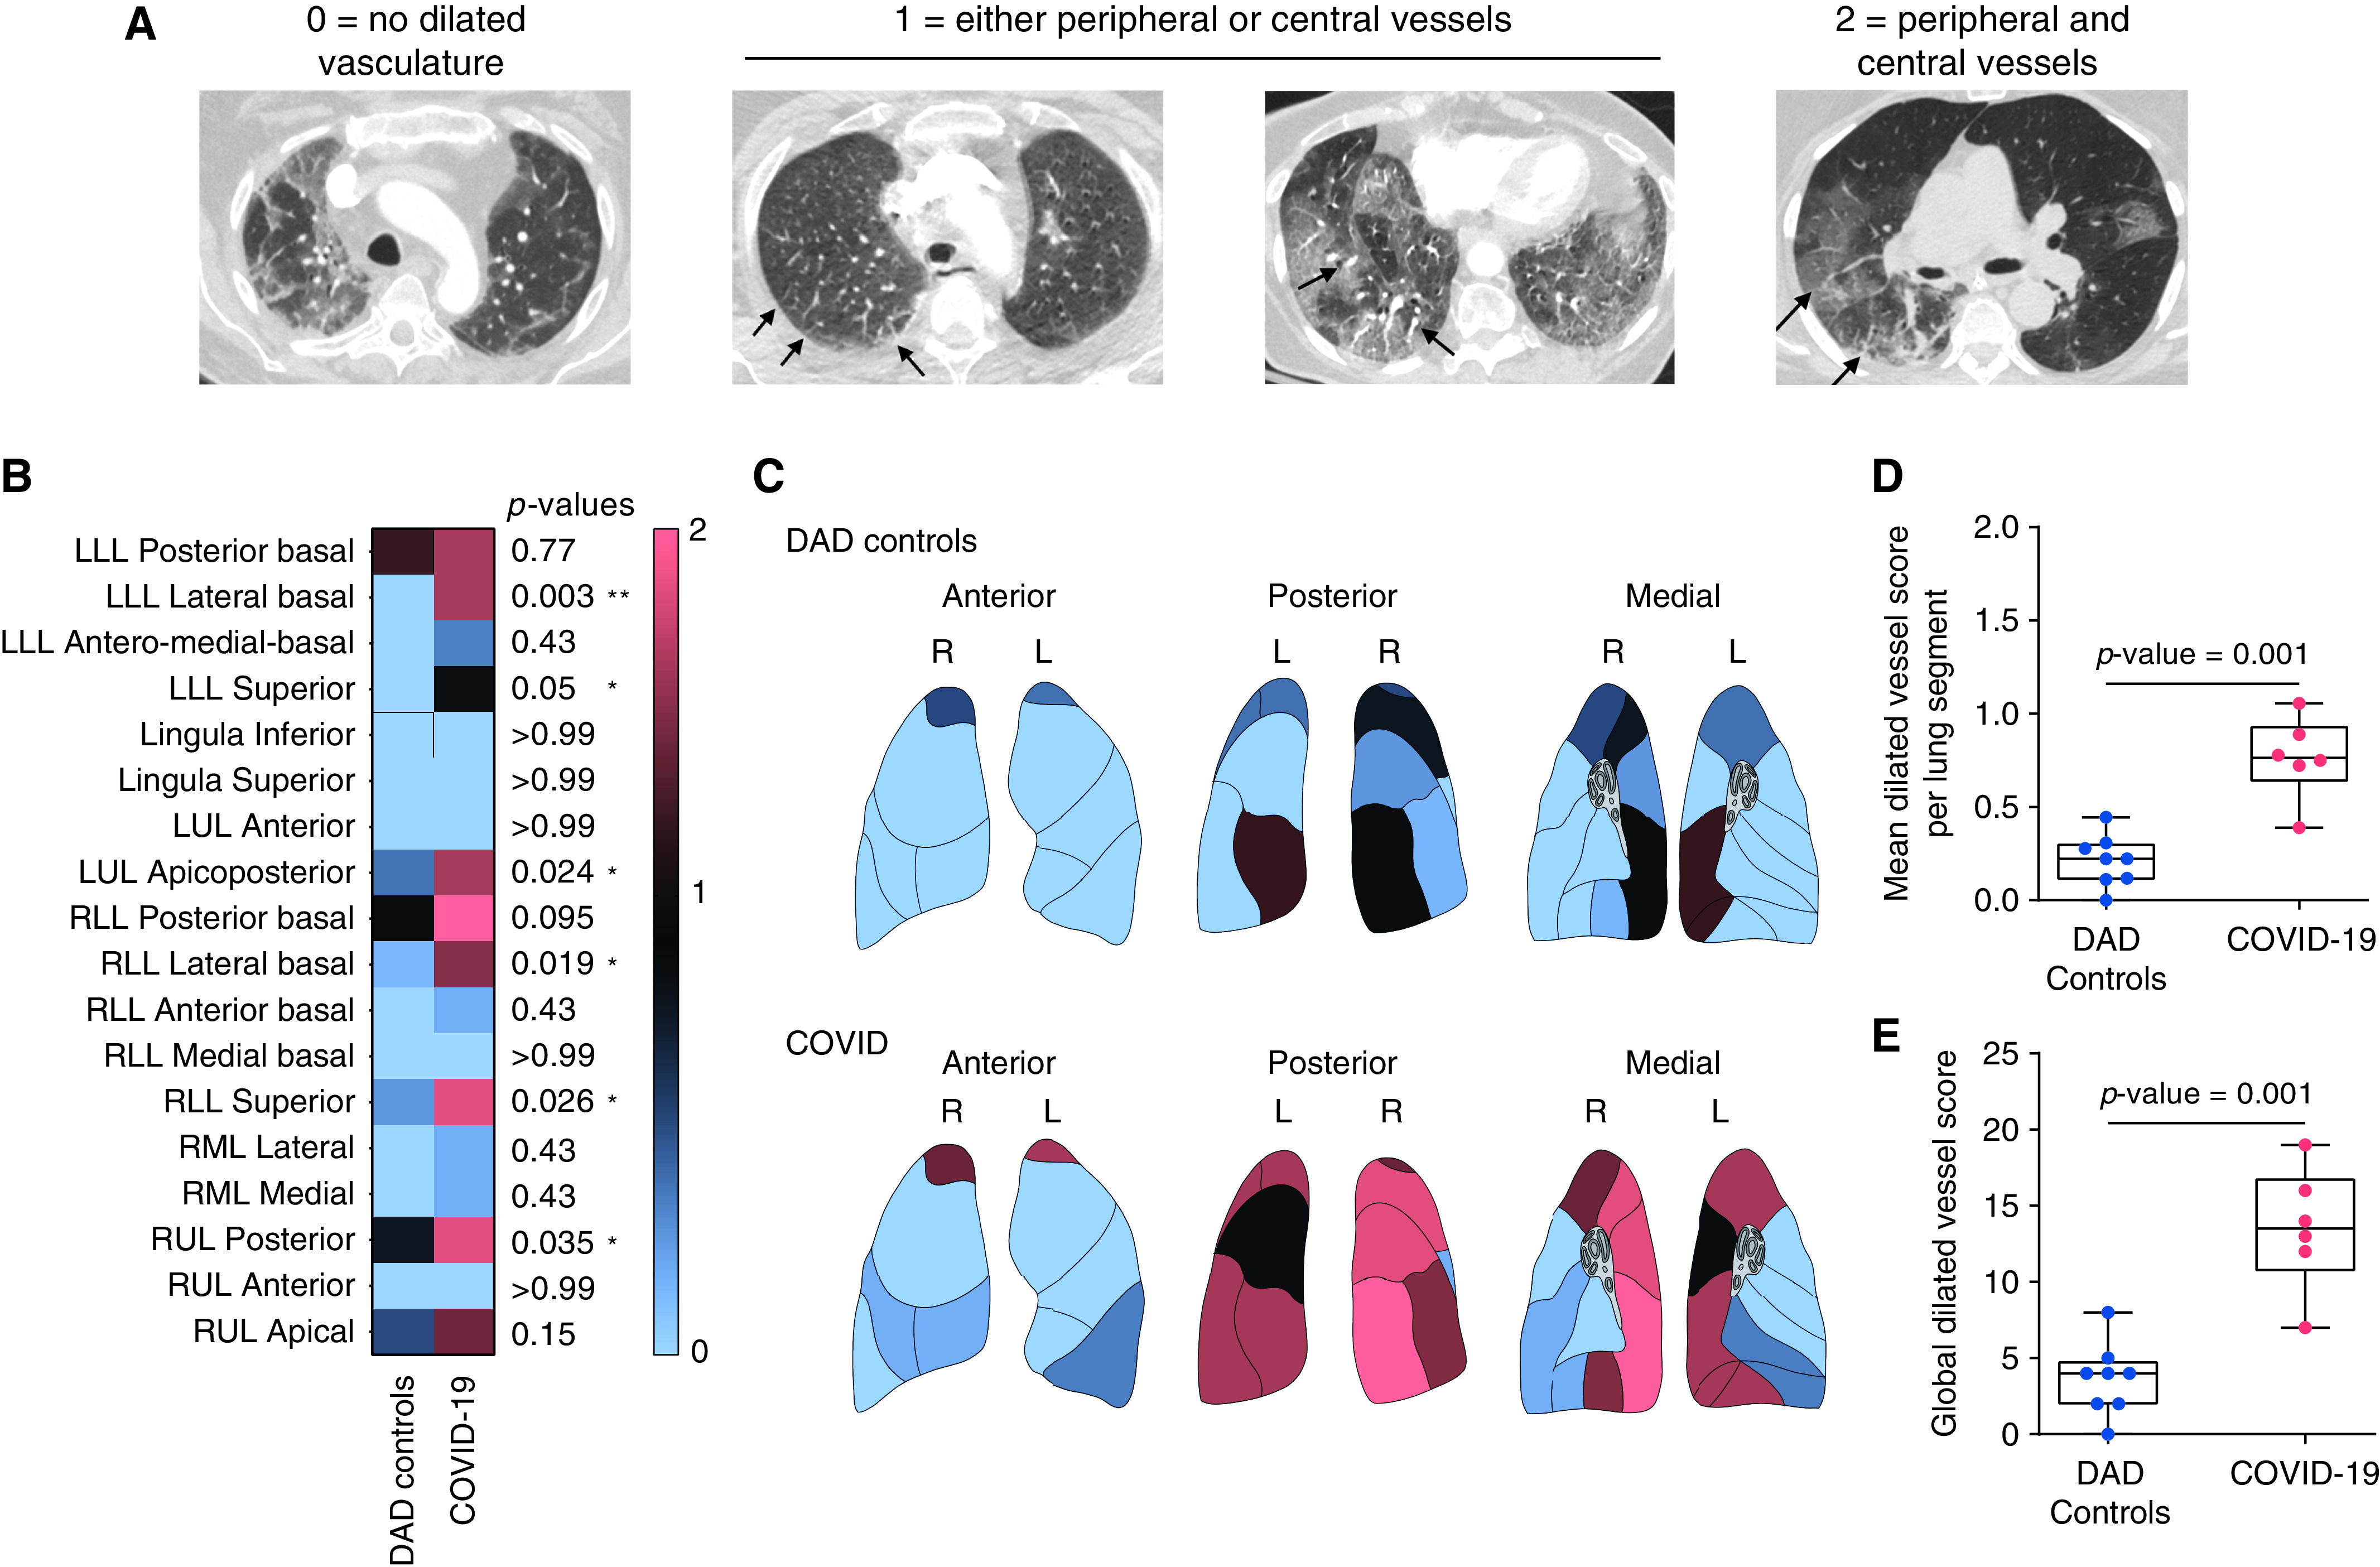
Semiquantitative premortem radiological phenotyping in COVID-19 by chest CT examinations. (A) Each segment of the five lung lobes was evaluated for dilated segmental or subsegmental vessels and scored on the basis of the distribution of the vessels as follows: 0 = no dilated vessels, 1 = either dilated peripheral or central vessels, 2 = dilated central and peripheral vessels. Axial CT images of the chest obtained at lung-window settings show dilated subsegmental pulmonary vessels (arrows), which are engorged and tortuous. The dilated vessels are located within the periphery of the lung (peripheral 1/3 of the lung; second image from the left), within the center of the lung (central 2/3 of the lung; third image from the left), or in both the periphery and the center (fourth image from the left). Significant differences between patients with COVID-19 and controls with non–COVID-19 DAD were seen in six different lung segments: lower lobe (LLL) lateral basal (P = 0.003), LLL superior (P = 0.05), left upper lobe (LUL) apicoposterior (P = 0.024), right lower lobe (RLL) lateral basal (P = 0.019), RLL superior (P = 0.026), and right upper lobe (RUL) posterior (P = 0.035). (B and C) Vessel distribution score is presented in (B) the heat map and (C) lung diagrams for both groups In (B), the first column represents controls with non–COVID-19 DAD, and the second column represents patients with COVID-19. Each row represents an individual lung segment. The scale bar (thin rectangle, right side) indicates the score values in the heatmap and lung diagrams. Blue denotes the minimum score (0), and salmon denotes the maximum score (2). (D) Mean overall segmental distributions of dilated pulmonary vasculature per patient were significantly different among both groups (blue, non–COVID-19 DAD-controls; salmon, COVID-19; P = 0.001). We calculated the global dilated vessel score by adding all the individual segmental vessel scores in each patient. (E) The global dilated vessel score, which incorporates information on all the lung segments, was significantly higher in patients with COVID-19 when compared with controls with non-COVID-19 DAD (blue, non-COVID-19 DAD; salmon, COVID-19; P = 0.001). The boxes reflect the interquartile range, and the whiskers indicate the range down to the minimum and up to the maximum value. Each individual value as a point is superimposed on the graph. Individual groups were compared using the Mann-Whitney U test.
Among other imaging features, mosaic attenuation in areas of apparently normal lung parenchyma on a conventional chest CT lung window (Hounsfield units: −500 to 1,000) was also more extensive in patients with COVID-19 compared with that in non–COVID-19 DAD controls when evaluated by a semiquantitative scoring system (P < 0.02; Supplemental Results; Figures E7 and E8). Notably, cardiac measurements on CT imaging (Figure E9) or cardiac function measured by echocardiography did not differ significantly between patients with COVID-19 and non–COVID-19 DAD controls (Table E6).
Histologic Findings
Full histologic details are shown in Table 2 and in the Supplemental Results. Overall histologic assessment indicated that all patients with COVID-19 had features of DAD, with most of them (13/20) having features of mixed acute and organizing DAD. Aggregate measurements over each lung lobe showed bilateral disease in 19 (95%) patients and at least focal involvement of all lobes in 17 (85%) patients. Similarly, controls with viral DAD showed extensive and diffuse findings across all lobes, but controls with non–viral DAD showed more patchy/focal involvement. No disease group differences in DAD stage were found (P = 0.42).
Table 2.
Summary of Histopathologic Characteristics
| Histopathologic Characteristics | Patients with COVID-19 (n = 20) |
Controls with Non-Viral DAD-Controls (n = 14) |
Controls with Viral DAD (n = 7) | P Value* |
|---|---|---|---|---|
| Overall assessment, n/n | ||||
| Diffuse alveolar damage | 20/20 | 14/14 | 7/7 | |
| Acute DAD | 3/20 | 2/14 | 3/7 | |
| Acute and organizing/fibrosing DAD | 16/20 | 12/14 | 4/7 | 0.42 |
| Organizing DAD | 1/20 | 0/14 | 0/7 | |
| Microscopic distribution of disease | ||||
| Median number of slides examined, n (range) | 46 (40–50) | 5 (4–12) | 6 (5–10) | |
| Right upper lobe | 19/20 | 10/14 | 7/7 | |
| Right middle lobe | 19/20 | 9/14 | 7/7 | .. |
| Right lower lobe | 19/20 | 5/14 | 7/7 | |
| Left upper lobe | 18/20 | 8/14 | 7/7 | |
| Left lower lobe | 18/20 | 9/14 | 6/7 | |
| Intra-alveolar processes | ||||
| Hyaline membranes | ||||
| None | 1/20 | 0/14 | 0/7 | |
| Focal/patchy | 11/20 | 7/14 | 4/7 | 0.86 |
| Moderate/extensive | 8/20 | 7/14 | 3/7 | |
| Reactive pneumocytes | ||||
| None | 1/20 | 2/14 | 1/7 | |
| Focal/patchy | 12/20 | 6/14 | 2/7 | 0.60 |
| Moderate/extensive | 7/20 | 6/14 | 4/7 | |
| Intra-alveolar giant cells | ||||
| None | 9/20 | 10/14 | 4/7 | |
| Focal/patchy | 9/20 | 4/14 | 3/7 | 0.44 |
| Moderate/extensive | 2/20 | 0/14 | 0/7 | |
| Alveolar macrophages | ||||
| None | 1/20 | 1/14 | 1/7 | |
| Focal/patchy | 6/20 | 2/14 | 4/7 | 0.25 |
| Moderate/extensive | 13/20 | 11/14 | 2/7 | |
| Alveolar hemorrhage | ||||
| None | 6/20 | 5/14 | 1/7 | |
| Focal/patchy | 12/20 | 4/14 | 2/7 | 0.093 |
| Moderate/extensive | 2/20 | 5/14 | 4/7 | |
| Alveolar edema | ||||
| None | 5/20 | 12/14 | 7/7 | |
| Focal/patchy | 11/20 | 2/14 | 0/7 | <0.001 |
| Moderate/extensive | 5/20 | 0/14 | 0/7 | |
| Fibrosis | ||||
| Organizing fibrosis | ||||
| None | 3/20 | 2/14 | 3/7 | |
| Focal/patchy | 12/20 | 7/14 | 2/7 | 0.45 |
| Moderate/extensive | 5/20 | 5/14 | 2/7 | |
| Established fibrosis | ||||
| None | 17/20 | 12/14 | 6/7 | |
| Focal/patchy | 3/20† | 2/14† | 1/7† | 0.99 |
| Moderate/extensive | 0/20 | 0/14 | 0/7 | |
| Inflammation | ||||
| Interstitial | ||||
| None | 1/20 | 6/14 | 2/7 | |
| Focal/patchy | 16/20 | 7/14 | 2/7 | 0.019 |
| Moderate/extensive | 3/20 | 1/14 | 3/7 | |
| Perivascular inflammation | ||||
| None | 5/20 | 14/14 | 6/7 | |
| Focal/patchy | 14/20 | 0/14 | 1/7 | <0.001 |
| Moderate/extensive | ||||
| Vascular alterations | ||||
| Capillary congestion and CHL | ||||
| No or limited capillary dilatation | 3/20 | 7/14 | 4/7 | |
| Diffuse capillary dilatation ± rare CHL | 12/20 | 7/14 | 3/7 | 0.043† |
| Diffuse capillary dilatation + multifocal CHL | 5/20 | 0/14 | 0/7 | |
| Microthrombi | ||||
| None | 1/20 | 5/14 | 2/7 | |
| Focal/patchy | 19/20 | 8/14 | 5/7 | 0.09 |
| Moderate/extensive | 0/20 | 1/14 | 0/7 | |
| Pulmonary thromboemboli | ||||
| None | 10/20 | 14/14 | 6/7 | |
| Focal/patchy | 10/20 | 0/14 | 1/7 | 0.0038 |
| Moderate/extensive | 0/20 | 0/14 | 0/7 | |
| Pulmonary infarct | ||||
| None | 12/20 | 13/14 | 4/7 | |
| Focal/patchy | 8/20 | 1/14 | 2/7 | 0.047 |
| Moderate/extensive | 0/20 | 0/14 | 1/7 | |
| Other findings | ||||
| Squamous metaplasia | ||||
| None | 10/20 | 9/14 | 4/7 | |
| Focal/patchy | 8/20 | 5/14 | 1/7 | 0.26 |
| Moderate/extensive | 2/20 | 0/14 | 2/7 | |
| Bronchopneumonia | ||||
| None | 7/20 | 12/14 | 5/7 | |
| Focal/patchy | 10/20 | 2/14 | 1/7 | 0.039 |
| Moderate/extensive | 3/20 | 0/14 | 1/7 | |
Definition of abbreviations: CHL = Capillary hemangiomatosis-like changes; COVID-19 = coronavirus disease; DAD = diffuse alveolar damage.
P values were calculated by the Fisher’s exact test, and the chi-square test.
The focal, established fibrosis is related to pre-existing conditions, including sarcoidosis and smoking-related interstitial fibrosis; not associated with the current disease.
Most patients with COVID-19 showed multiple intra-alveolar processes, including: hyaline membranes (n = 19/20), reactive pneumocytes (n = 19/20), intra-alveolar giant cells (n = 11/20), accumulation of intra-alveolar macrophages (n = 19/20), alveolar hemorrhage (n = 14/20), and alveolar edema (n = 16/20). The controls with non–COVID-19 DAD showed similar degrees of most of these histologic features, but with a significant decrease in alveolar edema (controls with non–viral DAD: P = 0.001; controls with viral DAD: P = 0.002; overall: P < 0.001; Figure 4A). Additionally, patients with COVID-19 were more likely to have superimposed bronchopneumonia than controls with non–viral DAD (P = 0.012; Figure 4B) but not more than controls with viral DAD (P = 0.20). Controls with viral DAD were more likely to show alveolar hemorrhage than COVID-19 (P = 0.035).
Figure 4.

(A–G) Histopathological phenotyping in COVID-19. H&E-stained slides from lung tissue of patients with COVID-19 showed multiple distinctive histologic features and vascular abnormalities that were more frequently found in the lung microarchitecture of patients with COVID-19 than in controls with non–COVID-19 DAD, including (A) alveolar edema (P < 0.001; white stars), (C) interstitial inflammation (P = 0.019; dashed thin line), (D) perivascular inflammation (P < 0.001; dashed thick line), (E) pulmonary infarcts (P = 0.047; arrowheads denote necrotic alveolar septa), (F) capillary congestion with and without capillary hemangiomatosis-like changes (P = 0.043; thin arrows), and (G) pulmonary thromboemboli (P = 0.0038). (B) Additionally, patients with COVID-19 were more likely to show evidence of superimposed bronchopneumonia than controls with non–viral DAD (B) (P=0.012; black stars), but not more than controls with viral DAD (P = 0.20). (G) A full-slide heatmap generated from a whole-slide image from a patient with COVID-19 depicts a thromboembolus interdigitating in a large pulmonary artery and highlights different layers of RBCs, platelets, and fibrin (thick black arrows denote different pixel densities within the arterial thromboembolus, which indicates organization) that are laid down in the vessel and form the characteristic “lines of Zahn.” Full-slide blood concentration heatmap was generated by computing the fraction of tissue (stroma or red blood cell; 35% tissue threshold) that is blood within 80-μm circular apertures centered on each grid of points spanning the image.
Most patients with COVID-19 had at least focal organizing fibrosis (n = 17/20), but established fibrosis attributed to COVID-19 was not seen in any of the cases. COVID-19 lungs showed focal interstitial inflammation (n = 19/20; Figure 4C), and perivascular inflammation (n = 15/20; Figure 4D). The controls with non-COVID-19 DAD showed similar degrees of organizing fibrosis but, overall, less interstitial inflammation (controls with non–viral DAD: P = 0.027; controls with viral DAD: P = 0.039; overall: P = 0.019) and perivascular inflammation (controls with non–viral DAD: P < 0.0001; controls with viral DAD: P = 0.019; overall: P < 0.001).
Microthrombi were identified at least focally in most patients with COVID-19 (n = 19/20). Patients with COVID-19 were more likely to have microthrombi than controls with non–viral DAD (P = 0.03) but not more than controls with viral DAD (P = 0.088). Larger pulmonary thromboemboli were also identified (n = 10/20), often with associated pulmonary infarcts (n = 8/20). The presence of pulmonary infarcts (Figure 4E), diffuse capillary dilatation with/without capillary hemangiomatosis-like changes (CHL; Figure 4F), and pulmonary thromboemboli (Figure 4G) in patients with COVID-19 was significant compared with its presence in all controls with non–COVID-19 DAD (Ps = 0.0038, 0.047, and 0.043, respectively) and in controls with non–viral DAD (Ps = 0.0016, 0.033, and 0.029, respectively), but not in controls with viral DAD (Ps = 0.098, 0.22, and 0.06, respectively). Notably, multifocal CHL in multiple sections were only seen in patients with COVID-19.
Microarchitectural Morphometric Analysis
In COVID-19, the mean interslide-MaxCVasc was significantly increased when compared with the mean interslide-MinCVasc in alveolar septa (P < 0.0001) and noncartilaginous airways (P < 0.0001), but not in the cartilaginous airways (P = 0.27; Figure 5A). No significant differences between interslide-MaxCVasc and interslide-MinCVasc of different ROI were found in other disease entities, except the alveolar-septal compartment in controls with non-viral DAD (P < 0.0001) (Figures 5B and 5C).
Figure 5.
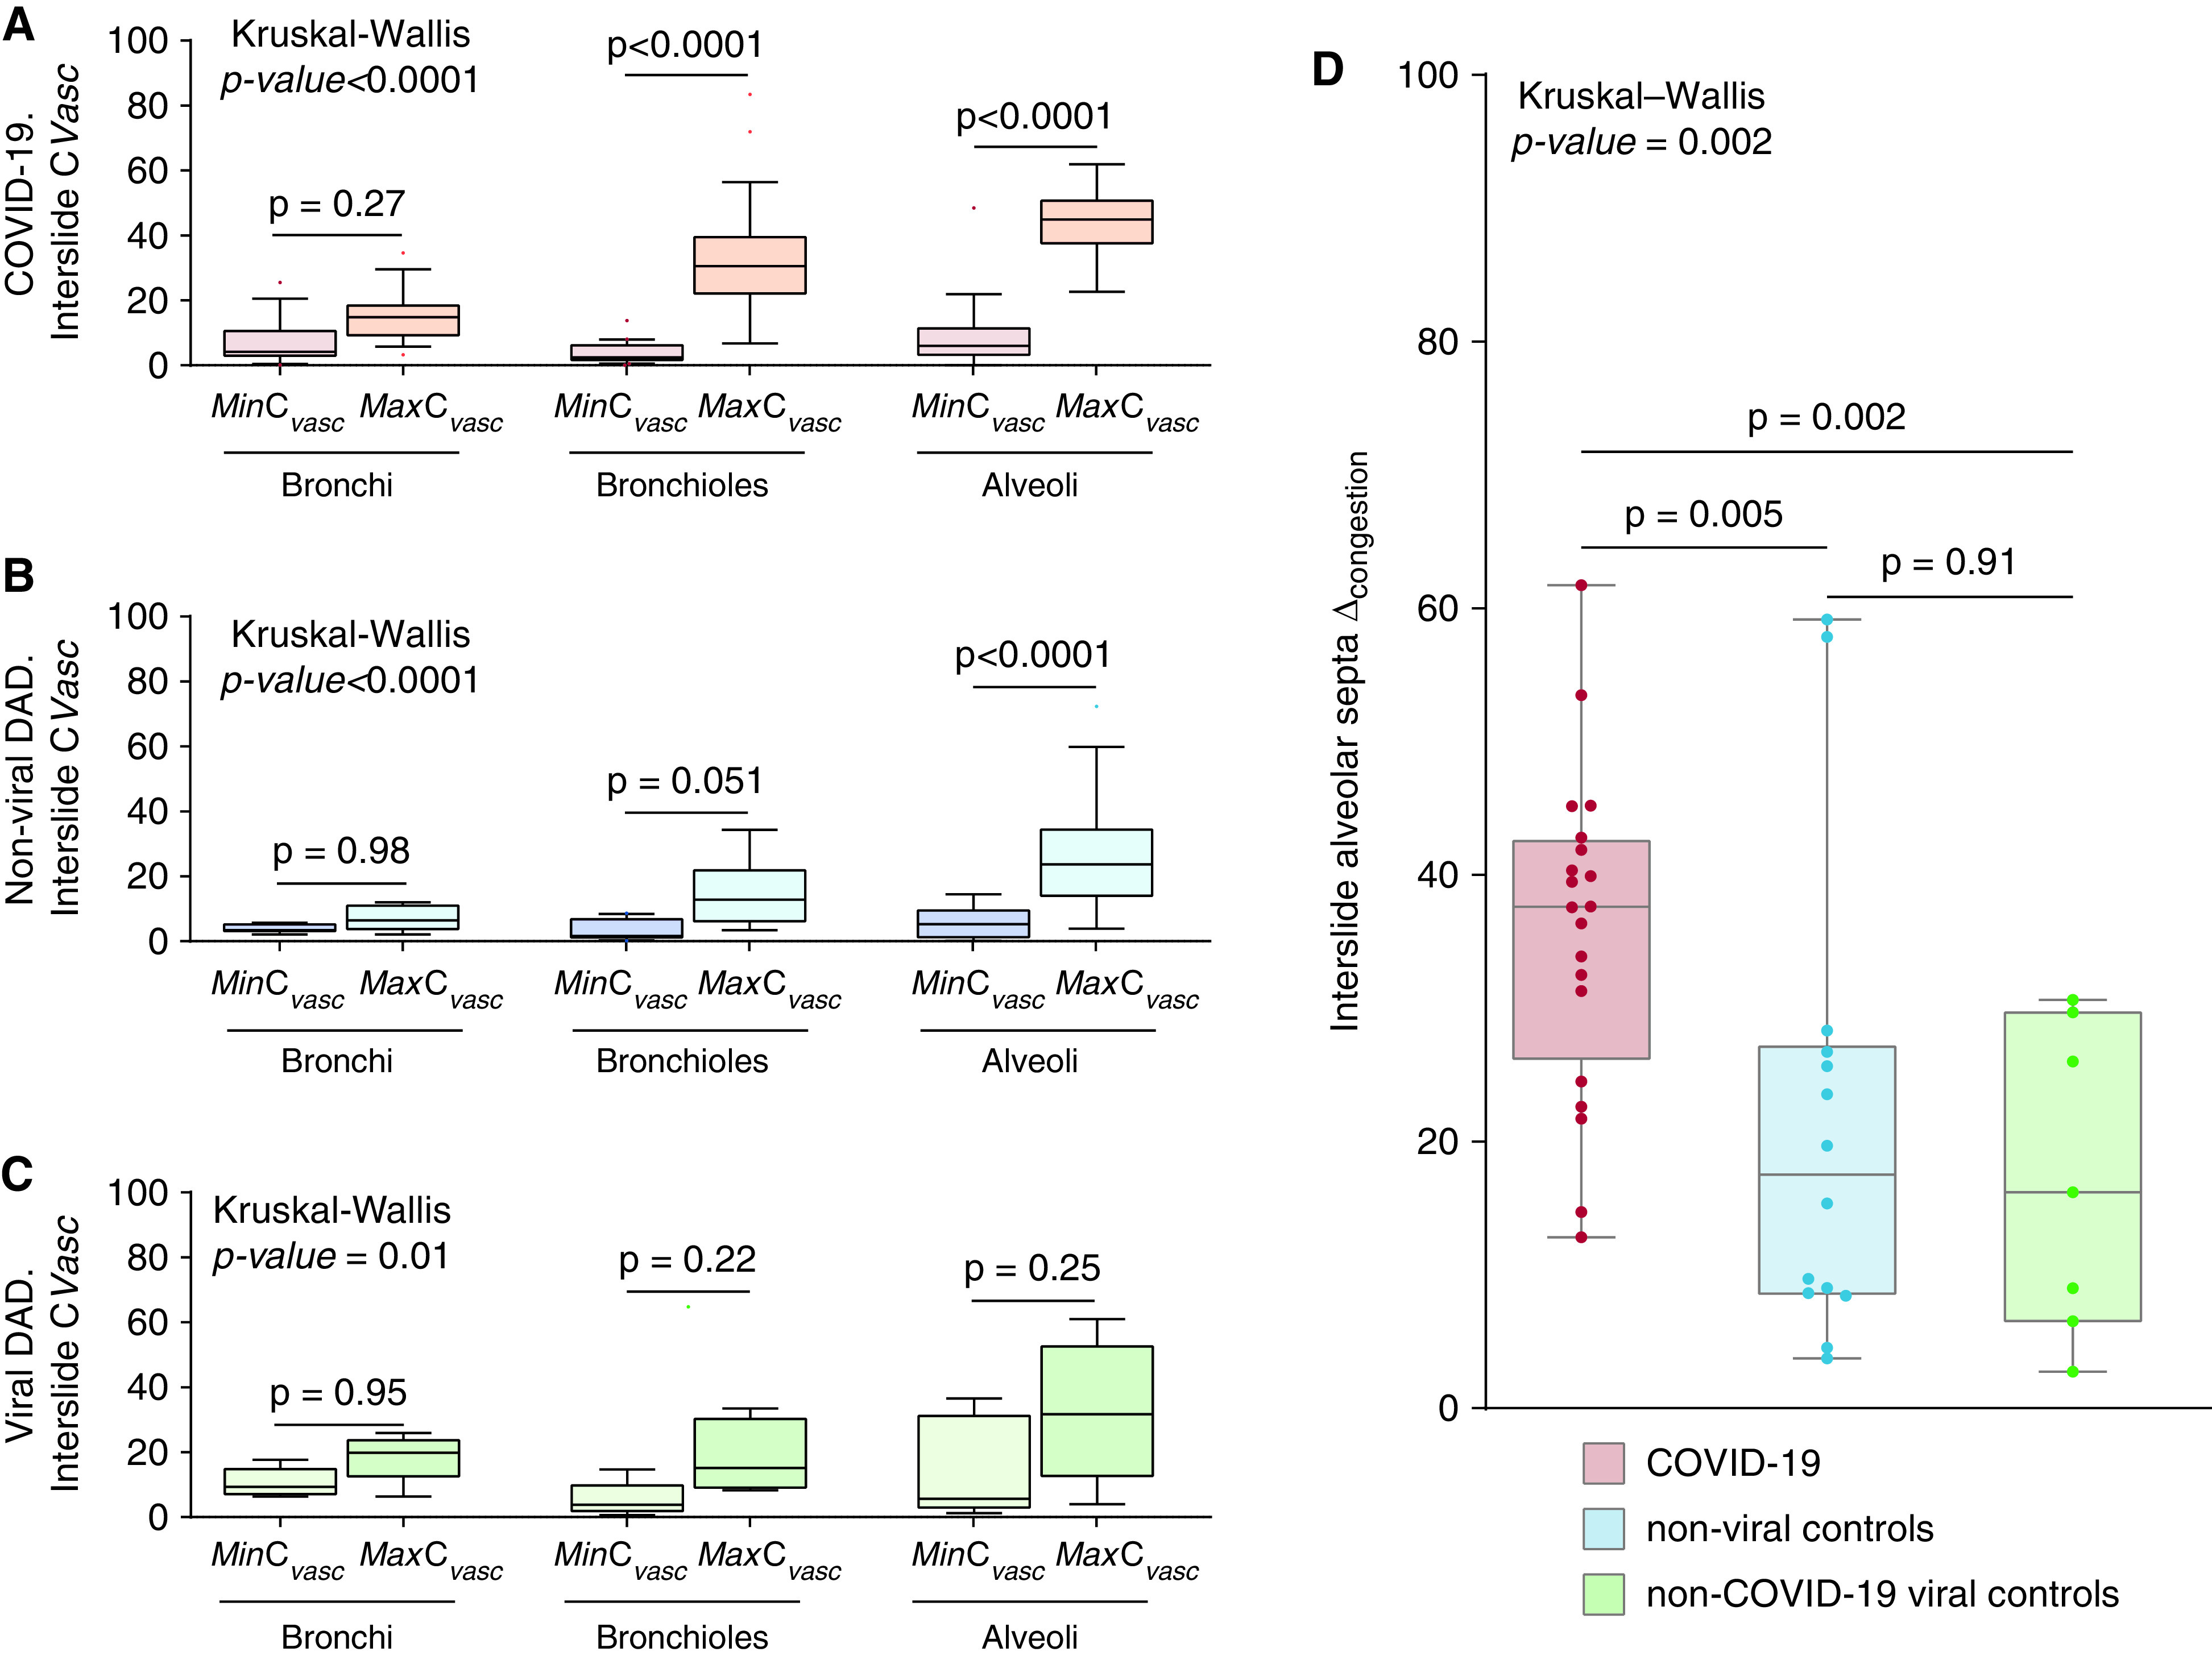
Morphometric determination of vascular congestion in regions of interest of the lung microarchitecture. Manually annotated regions of interest on different microanatomic compartments of the airway tree were chosen for morphometric analyses. Regions of interest on the airway tree included cartilaginous airways, noncartilaginous airways, and alveolar septa. Multiple annotations corresponding to these three different regions of interest were performed in different H&E-stained lung slides of autopsies from patients with COVID-19 and DAD of nonviral and viral etiologies. (A–C) In each patient, and in each different region of interest, values for the annotation showing the maximum CVasc (interslide-MaxCVasc) and the annotation showing the minimum CVasc (interslide-MinCVasc) were selected and compared in patients with (A) COVID-19, (B) non–viral DAD, and (C) viral DAD etiologies. Each Tukey box contains the value of one single annotation per patient. The interslide-MinCVasc annotations (red = MinCVasc COVID-19; dark blue = MinCVasc non–viral DAD; light green = MinCVasc viral DAD) and the interslide-MaxCVasc annotations (orange = MaxCVasc COVID-19; light blue = MaxCVasc non–viral DAD; dark green = MaxCVasc viral DAD) are grouped by compartment in different Tukey boxes, as indicated in the x axis. Tukey’s boxes reflect the interquartile range, and the whiskers indicate the range (up to 1.5 times the interquartile range). Singular points denote outliers. (D) The vascular congestion range (interslide-alveolar Δcongestion), defined as the difference between the individual annotation with the highest CVasc (interslide-MaxCVasc) and the the individual annotation with the lowest CVasc (interslide-MinCVasc) within the alveolar septa compartment, was calculated using all interslide annotations of contiguous alveoli per autopsy from patients with COVID-19 (red) and DAD of nonviral (light blue) and viral (dark green) etiologies. In (D), all boxes reflect the interquartile range, and the whiskers indicate the range down to the minimum and up to the maximum value. Each individual value as a point is superimposed on the graph. The Kruskal-Wallis test, with Dunn’s post hoc test, was used to compare more than two independent groups of equal or different sample sizes. Individual groups were compared using Mann-Whitney U test.
We then used generalized estimating equations (GEE) to account for repeated measurements of all the intraslide CVasc values determined in patients from the three etiologic groups (patients with COVID-19, controls with non–viral DAD, and controls with viral DAD) within the three different ROI (Table 3). The CVasc of cartilaginous airways in highly congested areas was significantly higher in patients with COVID-19 when compared with controls with non–viral DAD (P = 0.0024), but not when compared with controls with viral DAD (P = 0.33). However, in minimally congested areas of the lung, patients with COVID-19 had a significantly lower CVasc of cartilaginous airways when compared with controls with viral DAD (P < 0.0001), but without statistically significant differences when compared with controls with non–viral DAD (P = 0.7). The CVasc of noncartilaginous airways in highly congested areas was significantly higher in patients with COVID-19 when compared with non–viral DAD controls (P < 0.0001) and controls with viral DAD (P =–0.0095). However, no statistically significant differences in CVasc of noncartilaginous airways were seen between etiologic groups in minimally congested areas (P = 0.57). When evaluating the alveolar septa, patients with COVID-19 had significantly higher alveolar CVasc in highly congested areas of the lung when compared with controls with non–viral DAD (P < 0.0001), but not when compared with controls with viral DAD (P = 0.14). No statistically significant differences in alveolar CVasc were seen between etiologic groups in minimally congested areas of the lung (P = 0.21).
Table 3.
Generalized Estimating Equations of Morphometric CVasc Data in Different Microarchitectural Compartments among Different Disease Entities
| Group | Estimate | SE | P Value |
|---|---|---|---|
| Cartilaginous airways | |||
| Highly congested areas | <0.001*** | ||
| Patients with COVID-19 | ref | — | |
| Controls with non-viral DAD | −7.81 | 2.57 | 0.0024** |
| Controls with viral DAD | 3.92 | 4.04 | 0.33 |
| Minimally congested areas | <0.001*** | ||
| Patients with COVID-19 (reference) | ref | — | |
| Controls with non-viral DAD | 0.529 | 1.39 | 0.7 |
| Controls with viral DAD | 8.245 | 2.08 | <0.001*** |
| Noncartilaginous airways | |||
| Highly congested areas | <0.001*** | ||
| Patients with COVID-19 (reference) | ref | ||
| Controls with non-viral DAD | −13.70 | 2.45 | <0.001*** |
| Controls with viral DAD | −9.72 | 3.75 | 0.0095** |
| Minimally congested areas | 0.57 | ||
| Patients with COVID-19 (reference) | ref | ||
| Controls with non-viral DAD | −1.82 | 2.72 | |
| Controls with viral DAD | 2.37 | 3.90 | |
| Alveolar septa | |||
| Highly congested areas | <0.001*** | ||
| Patients with COVID-19 (reference) | ref | — | |
| Controls with non-viral DAD | −20.58 | 3.99 | <0.001*** |
| Controls with viral DAD | −11.01 | 7.53 | 0.14 |
| Minimally congested areas | 0.21 | ||
| Patients with COVID-19 (reference) | ref | ||
| Controls with non-viral DAD | −5.02 | 3.20 | |
| Controls with viral DAD | 1.24 | 6.65 | |
Definition of abbreviations: COVID-19 = coronavirus disease; DAD = diffuse alveolar damage; ref = reference.
**P ⩽ 0.01 and ***P ⩽ 0.001.
In patients with COVID-19, there was a significantly increased interslide-alveolar ΔCongestion compared with controls with non–viral DAD and those with viral DAD (non–viral DAD: P = 0.005; viral DAD: P = 0.002; overall: P = 0.002; Figure 5D). No differences in spatial heterogeneity were seen between etiologic groups (Supplemental Results; Figure E10). In patients with COVID-19, the standard deviation of the interslide CVasc was significantly higher in noncartilaginous airways and alveolar septa when compared with the other etiologic groups (Figure E11).
In addition, we performed GEE model analyses to test whether corticosteroid treatment would be associated with different morphometric indices of CVasc. Our models did not show any statistically significant effect of corticosteroid use in the CVasc of the three different compartments (Table E7).
Association of CVasc with Histologic Findings
We also used GEE analyses to account for repeated measurements of all the intraslide CVasc values determined in patients with COVID-19 to identify associations with histological findings present at the slide level (Table 4). The models evaluated three different parameters of vascular congestion: the mean-intraslide-alveolar CVasc (average of all alveolar annotations within a single slide of a patient), the intraslide-alveolar MaxCVasc, and the intraslide-alveolar MinCVasc.
Table 4.
Generalized Estimating Equations of Morphometric CVasc Data in Histological Slides from Patients with COVID-19 with Different Histological Findings
| Histological Group | Wald Test P Value | Estimate | SE | P Value |
|---|---|---|---|---|
| Mean Intraslide alveolar CVasc | ||||
| Model: phases of lung injury | <0.001*** | |||
| Acute DAD (reference) | ref | — | ||
| Acute lung injury | 16.30 | 2.93 | <0.001*** | |
| Acute and organizing DAD | −0.14 | 3.99 | 0.97 | |
| Predominantly organizing DAD | −23.48 | 2.66 | <0.001*** | |
| Model: microthrombi | — | |||
| Absent (reference) | ref | — | ||
| Present | −14.74 | 5.39 | 0.0063** | |
| Model: Capillary hemangiomatosis-like changes | — | |||
| Absent (reference) | ref | — | ||
| Present | 13.60 | 3.62 | <0.001*** | |
| Intraslide alveolar MaxCVasc | ||||
| Model: Phases of lung injury | <0.001*** | |||
| Acute DAD (reference) | ref | — | ||
| Acute lung injury | 18.20 | 3.04 | <0.001*** | |
| Acute and organizing DAD | −0.29 | 4.10 | 0.94 | |
| Predominantly organizing DAD | −27.65 | 2.85 | <0.001*** | |
| Model: Microthrombi | — | |||
| Absent (reference) | ref | — | ||
| Present | −14.44 | 5.63 | 0.01* | |
| Model: Capillary hemangiomatosis-like changes | — | |||
| Absent (reference) | ref | — | ||
| Present | 13.27 | 3.73 | <0.001*** | |
| Intraslide alveolar MinCVasc | ||||
| Model: Phases of lung injury | <0.001*** | |||
| Acute DAD (reference) | ref | — | ||
| Acute Lung Injury | 13.69 | 2.98 | <0.001*** | |
| Acute and Organizing DAD | −0.32 | 4.06 | 0.94 | |
| Predominantly organizing DAD | −19.90 | 2.62 | <0.001*** | |
| Model: Microthrombi | — | |||
| Absent (reference) | ref | — | ||
| Present | −13.17 | 5.36 | 0.014* | |
| Model: Capillary hemangiomatosis-like changes | — | |||
| Absent (reference) | ref | — | ||
| Present | 12.75 | 3.51 | <0.001*** | |
Definition of abbreviations: COVID-19 = coronavirus disease; DAD = diffuse alveolar damage.
P ⩽ 0.05, **P ⩽ 0.01, and ***P ⩽ 0.001.
Lung injury in each H&E slide was classified into early acute lung injury (ALI; without hyaline membrane formation), acute DAD, acute and organizing DAD, and predominantly organizing DAD. Statistically significant differences in mean intraslide-alveolar CVasc (Wald test, P < 0.001), intraslide-alveolar MaxCVasc (Wald test, P < 0.001), and intraslide-alveolar MinCVasc (Wald test, P < 0.001) were identified among different phases of lung injury. Similarly, we found statistically significant differences in measures of alveolar CVasc in different phases of lung injury in the controls with DAD (Table E8). Specifically, acute DAD showed significantly lower congestion than ALI (mean intraslide-alveolar CVasc: P < 0.0001; intraslide-alveolar MaxCVasc: P < 0.0001; intraslide-alveolar MinCVasc: P < 0.0001) and higher congestion than organizing DAD (mean-intraslide-alveolar CVasc: P < 0.0001; intraslide-alveolar MaxCVasc: P < 0.0001; intraslide-alveolar MinCVasc: P < 0.0001), but without statistically significant differences in congestion when compared with acute and organizing DAD (mean intraslide-alveolar CVasc: P = 0.97; intraslide-alveolar MaxCVasc: P = 0.94, intraslide-alveolar MinCVasc: P = 0.94).
When analyzing the relationship between alveolar-septal CVasc and histologic features found in the vicinity of the slides by GEE analyses, the presence of microthrombi was significantly associated with lower alveolar vascular congestion (mean intraslide-alveolar CVasc: P = 0.0063; intraslide-alveolar MaxCVasc: P = 0.010, intraslide-alveolar MinCVasc: P = 0.014), whereas the presence of CHL (⩾3 foci) was significantly associated with higher alveolar vascular congestion (mean intraslide-alveolar CVasc: P < 0.0001; intraslide-alveolar MaxCVasc: P < 0.0001; intraslide-alveolar MinCVasc: P < 0.0001). We analyzed alveolar CVasc patterns in association with other histological findings, including the presence of focal bronchopneumonia, numerous intra-alveolar macrophages, and hyaline membranes. However, we did not find any association between the three indices of alveolar CVasc and those parameters. Of note, a human-blinded classification of the overall vascular congestion in a H&E-slide showed a statistically significant association with alveolar CVasc (mean intraslide-alveolar CVasc: P < 0.0001; intraslide-alveolar MaxCVasc: P < 0.0001; intraslide-alveolar MinCVasc: P < 0.0001) (Table E9). Statistically significant differences in measures of intraslide-alveolar CVasc were also identified among different lung lobes in patients with COVID-19 (Table E10) and controls with DAD (Table E11).
Respiratory Mechanics and Gas Exchange
A total of 27 patients in our cohort met the Berlin Definition for ARDS (7). When analyzing the clinical severity in these patients (using a single cross-sectional datapoint), we did not find statistically significant differences between different entities within 24 hours of intubation (Table 1).
We analyzed the longitudinal changes in gas-exchange laboratory variables and respiratory mechanics patients with ARDS and who were not treated with extracorporeal membrane oxygenation (n = 25). The cohorts of patients with COVID-19–associated ARDS, non–viral ARDS, and viral ARDS who were not on extracorporeal membrane oxygenation were well balanced, except for the fact that patients with COVID-19–associated ARDS were more likely to have a higher body mass index. Differences in intubation length when comparing the three groups were also noted, but no significant differences between time to death from symptom onset and length of hospital stay were found. No differences in immunosuppression, hypoxemia severity, and treatments were seen (Table E12).
We used GEE analyses to longitudinally assess hourly changes in respiratory mechanics and gas-exchange parameters during the last 72 hours before death in patients with ARDS. Changes among different entities are presented in the online supplement (Supplemental Results; Figure E12; and Tables E13–E15). Although the assessments in our cohort were limited because of the small number of each subcohort (10 patients with COVID-19–associated-ARDS, 10 patients with non–viral-ARDS, and five patients with viral-ARDS), PaO2/FiO2 ratios significantly differed between patients with COVID-19–associated ARDS and controls with non–COVID-19 ARDS (non–viral ARDS: P = 0.029; viral ARDS: P < 0.0001). VR differed significantly between patients with COVID-19–associated ARDS and controls with non–COVID-19 ARDS (non–viral ARDS: P = 0.0019; viral ARDS: P = 0.0075). Crs in COVID-19–associated ARDS did not statistically differ from that in non–COVID-19 ARDS (non–viral ARDS: P = 0.062; viral ARDS: P = 0.82). Driving pressure (DP) was significantly higher in non–viral ARDS compared with that in COVID-19–associated ARDS (P = 0.0013), but no differences were found between COVID-19–associated ARDS and viral-associated ARDS (P = 0.44). No significant differences in mechanical power (MP) between COVID-19–associated ARDS and non–COVID-19 ARDS were found (non–viral ARDS: P = 0.1; viral ARDS: P = 0.84). There were no significant changes in respiratory mechanics and gas-exchange parameters over time, except for VR and MP, which significantly increased in all ARDS patients (Ps = 0.0024 and 0.0054, respectively).
Using Ward’s hierarchical clustering, we identified three clusters of patients with ARDS showing differences in AM-alveolar CVasc (Supplemental Results; Figure E13; Table E16). Patients in cluster 1 had the highest AM-alveolar CVasc, VR, and MP and the shortest time to death from symptom onset (P = 0.02), but with relatively low DP, preserved Crs, and intermediate values for the PaO2/FiO2 ratio when compared with patients from the other clusters.
Relationship between CVasc, VR, and Other Respiratory and Gas-Exchange Parameters
The individual relationship between measured AM-alveolar CVasc and VR before death in 25 subjects with ARDS was statistically significant and closely fitted a linear regression (R2 = 0.17) (Figure 6A). An ANOVA showed that this relationship was statistically significant (P = 0.043). Linear regression analyses between AM-alveolar CVasc and five other variables (VR, MP, Crs, PaO2/FiO2 ratio, and DP) included in our hierarchical clustering analysis did not show any statistically significant associations (Table E17).
Figure 6.
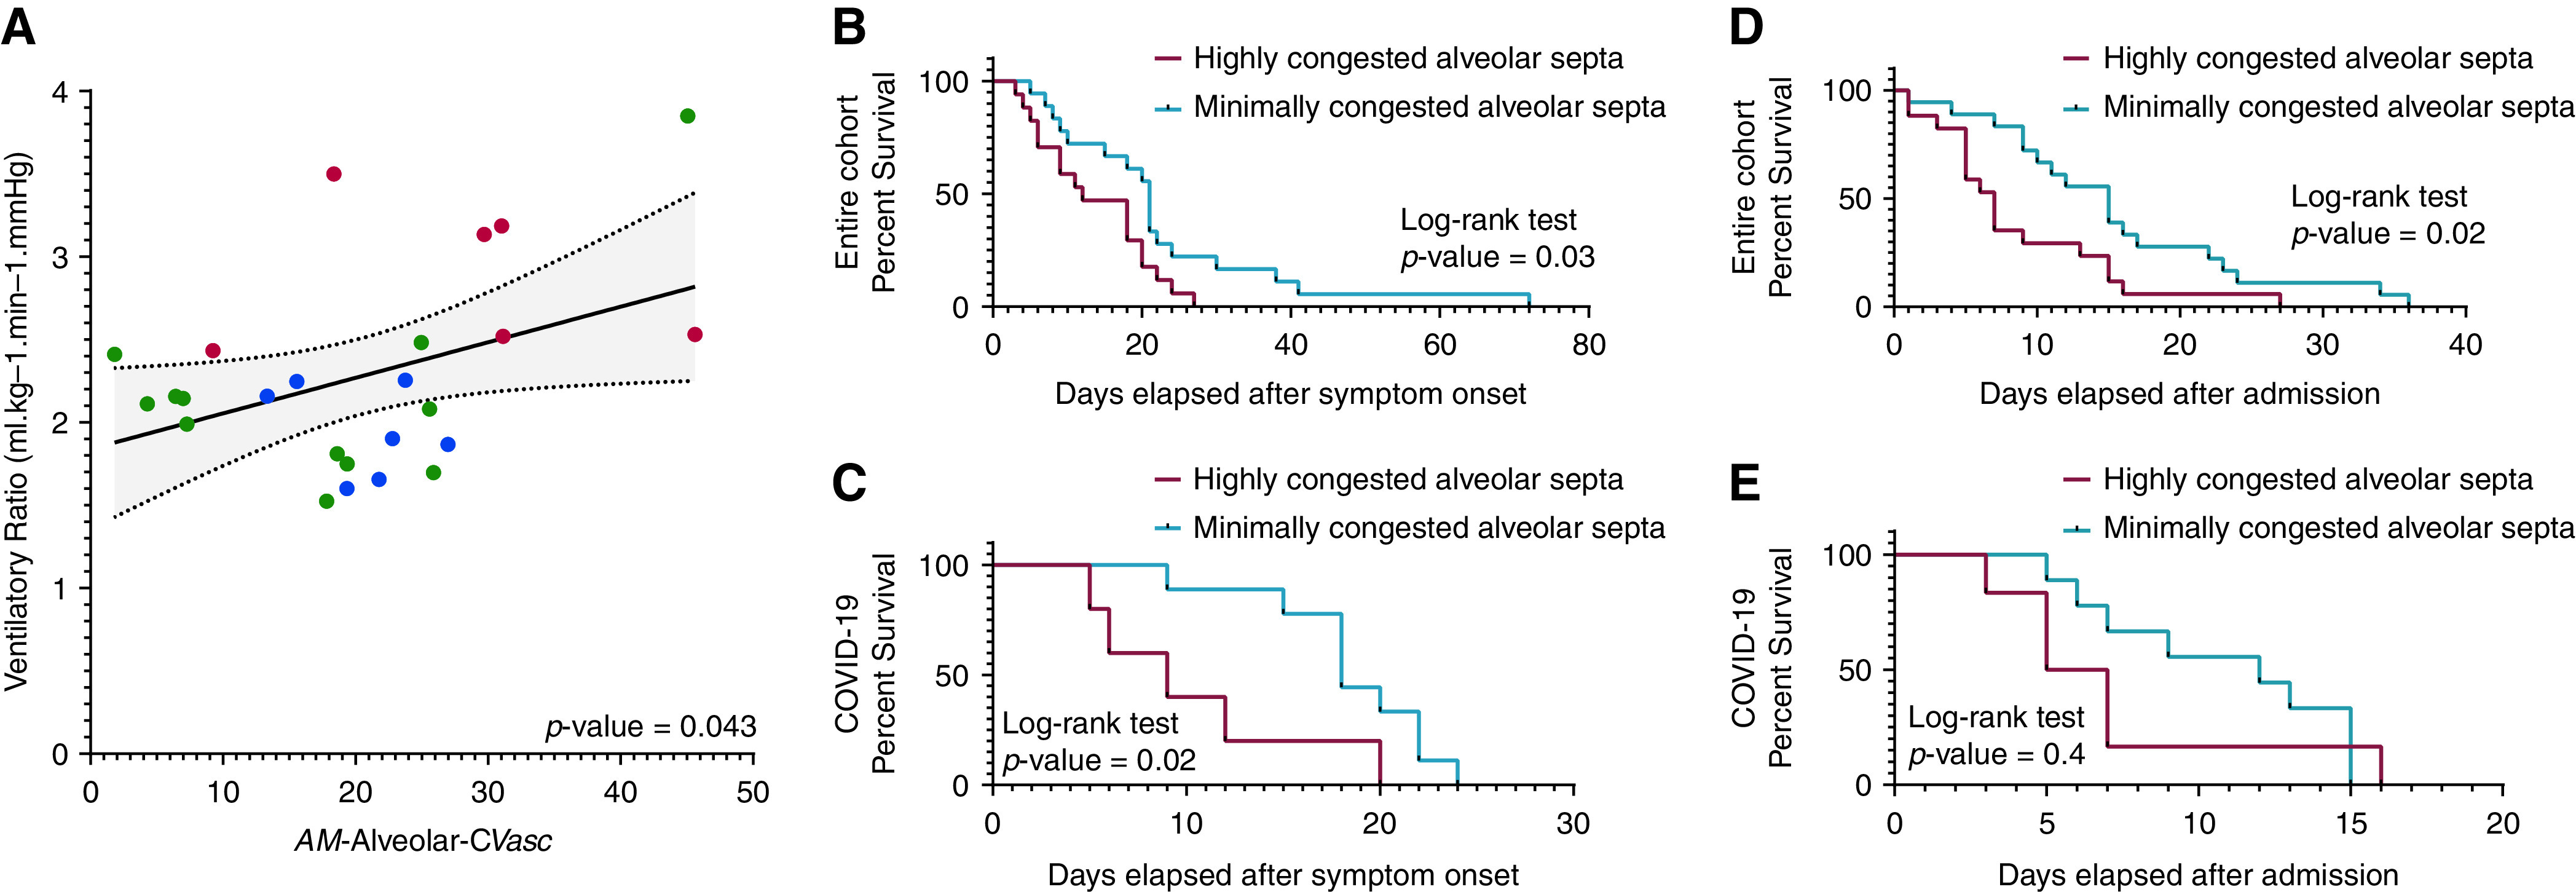
Vascular congestion, ventilatory ratio (VR), time to death from symptom onset, and hospital stay. The arithmetic mean CVasc in alveolar septa (AM-alveolar CVasc) tended to mirror the mean VR in each cluster. (A) The individual relationship between measured AM-alveolar CVasc and VR in all 25 subjects with ARDS was statistically significant and fitted a linear regression (P = 0.043; R2 = 0.17). The slope ΔCVasc/ΔVR was computed as ratio of overall change in CVasc to overall change in VR (estimate ± SE) was 7.76 ± 3.6%/[minute ventilation(milliliters/minutes) × PaCO2 (mm Hg)]. Singular points are indicated, in color, by the corresponding clusters with differences in AM-alveolar CVasc to which the patients belong (red = cluster 1; green = cluster 2; blue = cluster 3; for details, see Supplemental Results; Figure E13). We stratified patients with COVID-19 and all patients of the study into two groups on the basis of the median AM-alveolar CVasc of the COVID-19 cohort (median = 25.3%) or the entire cohort (median = 21.5%), respectively: patients with an AM-alveolar CVasc less than the median AM-alveolar CVasc of the cohort (“minimally congested alveolar septa”) or patients with a mean AM-alveolar CVasc equal to or greater than the median AM-alveolar CVasc of the cohort (“highly congested alveolar septa”). Differences in time to death from symptom onset and length of hospital stay in patients with COVID-19 or all patients of the study classified as having minimally or highly congested alveolar septa were estimated using the Kaplan-Meier method. The resulting Kaplan-Meier curves were compared using a log-rank test. (B–E) Statistically significant differences in time to death from symptom onset were found when comparing patients with minimally versus highly congested alveolar septa (B) in the entire cohort (P = 0.03) and (D) in the COVID-19 cohort (P = 0.02). Differences in length of hospital stay were statistically significant (C) in all patients of the study with minimally versus highly congested alveolar septa (P = 0.02) but not (E) in patients with COVID-19 (P = 0.4).
Association of CVasc with Time to Death and Length of Hospital Stay
We stratified all patients on the basis of the median AM-alveolar CVasc of the entire cohort (median = 21.5%). Patients whose individual AM-alveolar CVasc was lower than the median AM-alveolar CVasc (minimally congested alveolar septa) had a median time to death from symptom onset of 21 days, whereas patients whose AM-alveolar CVasc was equal to or greater than the median AM-alveolar CVasc (highly congested alveolar septa) had a median time to death from symptom onset of 12 days (log-rank test, P = 0.03; Figure 6B). Patients with minimally congested alveolar septa had a median length of hospital stay of 15 days, whereas patients with highly congested alveolar septa had a median length of hospital stay of 7 days (log-rank test, P = 0.02; Figure 6C).
We stratified patients with COVID-19 on the basis of the median AM-alveolar CVasc of the COVID-19 cohort (median = 25.3%). Patients with COVID-19 with minimally congested alveolar septa had a median time to death from symptom onset of 18 days, whereas patients with COVID-19 with highly congested alveolar septa had a median time to death from symptom onset of 9 days (log-rank test P = 0.02; Figure 6D). Patients with COVID-19 with minimally congested alveolar septa had a median length of hospital stay of 12 days, whereas patients with COVID-19 with highly congested alveolar septa had a median length of hospital stay of 6 days (log-rank test P = 0.4; Figure 6E).
We also performed Cox proportional hazard model analyses to test whether the association of AM-alveolar CVasc and clinical outcomes (time to death and length of hospital stay) would be affected by different clinical variables of the cohort, including age, sex, corticosteroid therapy, and ARDS status. After testing five models that included different combinations of all these variables, the association of AM-alveolar CVasc with time to death and length of hospital stay remained essentially unchanged and statistically significant for the entire ARDS cohort but not for the COVID-19 subcohort (Table 5).
Table 5.
Cox Proportional Hazard Models Testing the Association between Categories of AM-alveolar CVasc (Patients with Highly or Minimally Congested Alveolar Septa) and Clinical Outcomes (Time to Death from Symptom Onset and Length of hospital Stay)
| Entire Cohort (n = 37) |
COVID-19 Subcohort (n = 17) |
|||||||
|---|---|---|---|---|---|---|---|---|
| Parameter | Hazard Ratio | 95% CI | P Value | Parameter | Hazard Ratio | 95% CI | P Value | |
| Models testing time to death from symptom onset, days | ||||||||
| Unadjusted | 0.85 | 2.34 | 1.16–4.73 | 0.018* | 0.28 | 1.32 | 0.37–4.66 | 0.67 |
| Adjusted for: | ||||||||
| Age and sex | 0.91 | 2.49 | 1.21–5.09 | 0.013* | −0.14 | 0.87 | 0.21–3.67 | 0.85 |
| Age, sex, and corticosteroid use | 0.79 | 2.21 | 1.09–4.51 | 0.029* | −0.24 | 0.79 | 0.17–3.60 | 0.76 |
| Age, sex, and ARDS status | 0.95 | 2.59 | 1.26–5.34 | 0.0097** | −0.12 | 0.89 | 0.19–4.05 | 0.88 |
| Age, sex, corticosteroid use, and ARDS status | 0.87 | 2.39 | 1.15–4.94 | 0.019* | −0.02 | 0.98 | 0.20–4.71 | 0.98 |
| Models testing length of hospital stay, days | ||||||||
| Unadjusted | 0.90 | 2.46 | 1.24–4.88 | 0.0097** | 0.75 | 2.13 | 0.59–7.64 | 0.25 |
| Adjusted for: | ||||||||
| Age and sex | 1.04 | 2.83 | 1.39–5.75 | 0.0041** | 0.4 | 1.50 | 0.34–6.52 | 0.59 |
| Age, sex, and corticosteroid use | 1.21 | 3.35 | 1.58–7.09 | 0.0016** | 0.67 | 1.96 | 0.39–9.97 | 0.42 |
| Age, sex, and ARDS status | 1.07 | 2.90 | 1.41–5.98 | 0.0038** | 0.51 | 1.66 | 0.35–7.77 | 0.52 |
| Age, sex, corticosteroid use, and ARDS status | 1.21 | 3.35 | 1.58–7.10 | 0.0016** | 0.60 | 1.83 | 0.34–9.69 | 0.48 |
Definition of abbreviations: AM = arithmetic mean; ARDS = acute respiratory distress syndrome; CI = confidence interval; COVID-19 = coronavirus disease.
P ⩽ 0.05 and **P ⩽ 0.01.
Discussion
In this study, we highlighted that the lung pathology of fatal COVID-19 is characterized by distinct lung vascular abnormalities that differentiate the disease from other etiologies of DAD, including increased differential CVasc of the alveolar septa, increased peribronchiolar CVasc in highly congested areas, perivascular inflammation, multifocal CHL, pulmonary thromboemboli, and pulmonary infarcts. Furthermore, our morphometric analyses gave evidence of the contribution that vascular alterations (as opposed to overdistension) make to changes in the VR—and, possibly, in Vd in ARDS, regardless of etiology—and identified AM-alveolar CVasc as a novel histologic correlate of VR in all cases of ARDS.
A histologic review revealed significant differences in the prevalence of histologic findings between patients with COVID-19 and controls with non–COVID-19 DAD. Some of these findings have been reported in other studies (3–5). However, to our knowledge, our semiquantitative assessment involves the most extensive sampling protocol performed in COVID-19 autopsies to date (up to 50 lung sections per autopsy, 10 sections each lobe) and thorough comparison with matched cases of fatal viral and non–viral DAD. These findings suggest that, in comparison with other DAD-causing etiologies, COVID-19 is characterized by significant vascular derangements. Interestingly, we did not find significant differences in alveolar CVasc and in the presence of microthrombi between patients with COVID-19 and controls with viral DAD. Therefore, thrombosis may be a common pathophysiologic pathway for pulmonary viral infections (10), although elucidation of specific differences between viral etiologies warrants further investigation.
In addition, we found significant differences in vascular congestion of the vasa vasorum of the conducting airways between patients with COVID-19 and those with other viral infections, which is also regionally different within areas of high or minimal congestion. McGonagle et al. have hypothesized that other respiratory viruses may show predilection for proximal airway involvement, which can lead to vascular alterations in the vicinity of larger airways (10). In fact, in this study, we demonstrated that non–COVID-19 viral infections showed a significantly higher bronchial CVasc in minimally congested areas when compared with COVID-19, but conversely, COVID-19 showed higher bronchiolar CVasc in areas of high congestion. The implications of this are uncertain but may have consequences that are not yet understood (11).
Premortem CT scans demonstrated that vascular findings were already present before death. These findings are in line with our postmortem findings. We noted extensive abnormalities in regionally dilated subsegmental pulmonary vessels, showing increased branching and tortuosity on CT imaging. The distribution of dilated vessels was significantly different in patients with COVID-19 and controls with non–COVID-19 DAD, with patients with COVID-19 demonstrating vessel dilatation predominately in the posterior and basilar lungs with both peripheral and nonperipheral distributions. We measured vessel dilation in a semiquantitative manner, because software packages that quantify total pulmonary vascular area on chest CT imaging are proprietary and can only be used in a subset of chest CT protocols (e.g., thin-section noncontrast CT). Although our semiquantitative vessel score may be limited, as it was arbitrarily created, multiple radiological studies without pathological correlation have shown similar results (11–18). Additionally, our GEE analyses of histologic data revealed regional lobar differences in alveolar CVasc, which was decreased in the more anteriorly located right middle lobe and in the left upper lobe, compared with the left lower lobe (Table E10).
The clinical implications of vessel dilation in COVID-19 are still uncertain. However, these pre- and postmortem regional perfusion abnormalities are consistent with findings from other studies (19, 20) and could be related to improved oxygenation with high PEEP (2) and/or prone positioning in patients with COVID-19 (21, 22). As the response to these therapies is not unique to COVID-19, the improved oxygenation may be mainly due to recruitment (23, 24). However, gravitational forces may also contribute, as proning has already been shown (to some extent) to decrease ventral moderate-to-severe Vd and increase dorsal moderate-to-severe Vd in COVID-19 (19).
In our cohort, patients with COVID-19 had higher scores of mosaic attenuation in areas of apparently normal lung parenchyma (Supplemental Results; Figure E7). Mosaic attenuation can be caused by small vessel pathology or small airway disease with air trapping, and it is commonly regarded as a sign of variable regional perfusion (25). As our study lacks expiratory imaging, we cannot definitively distinguish between these causes. However, other studies have noted the presence of peripheral, segmental, or regional perfusion abnormalities on dual-energy CT in COVID-19 (15–17, 26–29), providing evidence that vascular pathology may play a role in causing the mosaic attenuation patterns that we observed. Moreover, some of these studies have detected perfusion abnormalities in both damaged and apparently normal lung parenchyma, suggesting that vascular alterations in COVID-19 may occur in the entire lung parenchyma (17, 29). Using our machine-learning derived pixel classification, we demonstrated that patients with COVID-19 have an increase in the alveolar-CVasc range (interslide-alveolar Δcongestion) compared with controls with non–COVID-19 DAD, which might indicate regional changes in perfusion that could correspond to mosaic attenuation on CT imaging.
Physiological dead space is an important predictor of adverse outcomes in patients with ARDS (30). Consistent with prior observations in patients with COVID-19–associated ARDS (19, 31), our longitudinal analysis of the VR before death (used as an estimate for Vd), suggested a significant increase in all cases of ARDS (Table E14). We demonstrated a novel positive correlation between AM-alveolar CVasc and VR in patients with ARDS (Figure 6), which suggests that premortem vascular alterations in the alveolar septa may have played a key role in the clinical course of patients with severe disease, signaled through an increase in Vd.
In patients with ARDS due to SARS-CoV-2 infection, increased VR has been observed in patients with elevated D-dimer levels (32), suggesting that direct pulmonary vascular thrombotic dysfunction is mechanistic in the increase in physiological Vd. However, physiological Vd may also be increased in ventilator-induced lung injury by excessive application or heterogenous distribution of PEEP. As we did not find an individual association between MP or DP with AM-alveolar CVasc (Table E17), or longitudinal changes (mean and slope) in MP during the last 72 hours of life between ARDS subgroups, the pathological changes and differences in AM-alveolar CVasc found in this study may not be attributed to differences in mechanical ventilation. Therefore, the association between AM-alveolar CVasc and VR may add detailed mechanistic evidence of the direct association between direct pulmonary vascular dysfunction in ARDS and Vd.
Furthermore, our hierarchical clustering analysis identified an ARDS cluster with high VR, increased AM-alveolar CVasc, and relatively preserved Crs in the setting of low DP, which consisted of patients with COVID-19–associated ARDS and viral-associated ARDS. This cluster showed a statistically significant shorter time to death from symptom onset, highlighting a plausible clinically relevant relationship between increased AM-alveolar CVasc and Vd, regardless of ARDS etiologies. Larger multi-institutional cohorts are needed to validate these findings.
Our study is limited by the fact that we did not measure directly physiological Vd. However, direct assessment of physiological dead space requires specialized equipment to measure exhaled carbon dioxide (33, 34); consequently, it has been underutilized in the acute clinical setting. Furthermore, the VR has been validated in ARDS cohorts showing an association with adverse clinical outcomes and good correlation with directly measured physiological Vd (9, 31).
Consistent with prior studies (32, 35), our histological and hierarchical clustering analyses suggested that COVID-19–associated ARDS may not be monolithic in pathobiology. Indeed, patients demonstrated a spectrum of pulmonary pathophenotypes, ranging from predominant pulmonary vascular dysfunction (with relatively higher ventilation to perfusion) to interalveolar filling (with relatively lower ventilation to perfusion). Furthermore, in agreement with Panwar et al. (35), Crs showed a wide range of longitudinal values among all patients with ARDS (Figure E12) and appeared to have a lack of relationship with the degree of hypoxemia (Figure E13).
In our cohort, AM-alveolar CVasc was significantly associated with shorter time to death and length of hospital stay in ARDS. Increases in alveolar CVasc were also seen in the association with earlier stages of lung injury (ALI and acute DAD) in patients with COVID-19 and in controls with DAD (Tables 4 and E8), suggesting the presence of temporal heterogeneity governing the degree of CVasc in cases of respiratory failure. As the chronology of histological lesions has been related to the duration of ARDS in a prior autopsy cohort (36), it is plausible to think that AM-alveolar CVasc may be tightly related to the phase of lung injury. However, principal-component analyses suggested that the stage of lung injury only contributed to a minimum amount of the variance in our system (Figures E14 and E15), likely because the overall histologic assessment showed that most of our cases had mixed features of acute and organizing DAD. Therefore, the relationship between phase of lung injury and AM-alveolar CVasc deserves further investigation. We found an association of microthrombi with lower intraslide-alveolar CVasc. Conversely, CHL were associated with higher values of intraslide-alveolar CVasc. As both microthrombi and neovascularization possibly alter the blood flow in the lung microvasculature, the increased incidence of CHL in conjunction with microthrombosis in COVID-19 may be responsible for the differences in vascular congestion. Ackermann et al. have shown a potential role of angiogenesis in COVID-19 when compared with influenza (37). However, further studies are needed to determine whether CHL represent a primary angiogenetic process due to viral infection or compensatory capillary proliferation secondary to microthrombosis.
Important limitations of this study include its single-center observational design, small and selective cohorts, differences in number of H&E-slides evaluated in different disease types, and the retrospective nature contributing to missing data. Furthermore, CT had been used for specific imaging indications, including unexplained clinical worsening per American College of Radiology guidelines, possibly introducing selection bias toward more severe disease. However, we did not find relevant clinical differences in patients who had a CT scan performed compared with the ones who did not have one (Table E5). In addition, the vascular findings on CT identified in this study have been observed in larger cohorts (12–14, 18) with a range of mild to severe disease.
Additionally, our random tissue sampling technique of the lung (Supplemental Methods) did not include a square grid to obtain samples. As this technique may not be considered systematic (38), it may be subject to an operator-dependent bias. Further, we did not measure total lung volume in our cohort, and measurements of surface areas without normalization for total lung volume are considered subject to bias. However, our novel morphometric index (CVasc) does not describe the absolute surface area occupied by RBC pixels but is rather defined as the proportion of the surface area of the annotated compartment occupied by RBC pixels.
Although only two slides were used for the morphometric analysis to define an individual lung’s interslide variability in each case, these represented the least congested and the most congested lung sections selected by a board-certified pathologist who reviewed all the H&E-stained slides of each autopsy. Three GEE models showed that the human-blinded classification of the overall vascular congestion per slide was significantly associated with different measures of CVasc (Supplemental Results). For instance, in a GEE model evaluating mean intraslide-alveolar CVasc, when a slide was classified as highly congested by a pathologist, the mean intraslide-alveolar CVasc was 23.82 times higher when compared with slides classified as minimally congested by a pathologist (P < 0.001). Therefore, our morphometric analyses can be considered accurate for the determination of vascular congestion heterogeneity.
We only included cases before the approval of some COVID-19–specific drug therapies (e.g., remdesivir). Therefore, our pathological findings can be considered unconfounded by their pleiotropic effects. Because REMAP-CAP (39) and other studies have suggested that corticosteroids other than dexamethasone are similarly beneficial for COVID-19, we hypothesized that their use could be associated with changes in CVasc. Although an association between corticosteroid use and different morphometric indices of CVasc was not seen, our study is inappropriate for this analysis because of its nonrandomized and retrospective nature. Future studies should investigate whether corticosteroid administration may alter the progression of the vasculopathy and vascular congestion in COVID-19 and DAD in general.
Conclusions
In summary, our detailed clinicopathological, radiological, and morphometric analyses in fatal COVID-19 highlight significant vasculopathy in the lung microarchitecture, including alveolar septal congestion, which is associated with shorter time to death and increased VR. Our study provides objective grounds for future clinical, mechanistic and biomarker-driven work assessing the role that vasculopathy plays in COVID-19, ARDS in general, and pulmonary dead space ventilation.
Acknowledgments
Acknowledgment
Analysis of patient autopsy material was reviewed and approved by the Partners Human Research IRB (Protocol #: 2020P001146).
Footnotes
Supported by Internal Sundry and the Vickery-Colvin Award from the Department of Pathology, Massachusetts General Hospital.
Author Contributions: All authors contributed to the acquisition of the work. J.A.V., A.R.S., M.M.-K., C.F.H., and J.R.S. conceived of the study, delineated the hypothesis, and designed the study. J.A.V., C.F.H., M.M.-K., A.R.S., and Y.L. were members of the primary analysis and writing group. J.A.V., J.R.S., A.R.S., G.A.A., and M.M.-K. made final decisions regarding case selection and inclusion. J.R.S., J.A.V., L.B., B.B., S.N.C., C.K.H., T.L.H., B.H., S.J., M.S.M., and D.J.S. performed the autopsies. J.A.V. and C.F.H. provided domain knowledge for classifier development. G.A.E. developed the pixel classifier. J.A.V., C.F.H., G.A.E., M.A.G., M.T., and M.A.M. conducted the analyses of morphometric data. A.J.A. and E.M. were involved in slide scanning. M.M.-K., A.R.S., and J.A.V. performed histologic assessment. B.P.L. and M.C.P. performed radiologic assessment. J.A.V., Y.L., S.P., A.R.S., M.A.G., C.F.H., M.T., K.K., M.A.M., and R.B.C. conducted statistical analyses. L.R.B., E.S.R., B.D.M., G.A.A., C.C.H., Y.P.H., J.A.B., A.L., L.P.H., V.M.P., and S.E.T. gave clinicopathological advice for study conceptualization. J.A.V., C.F.H., G.A.E., M.A.G., G.A.A., Y.L., B.P.L., A.R.S., and M.M.-K. checked data extraction. J.A.V., A.R.S., M.M.-K., C.F.H., M.A.G., S.P., and Y.L. had full access to all materials and results and created the tables and figures. All writing committee members (J.A.V., C.F.H., M.M.-K., and A.R.S.) helped revise the drafted version before and after circulation to collaborators. All authors read and edited the drafted manuscript for important intellectual content and assisted in data interpretation. All authors approved the final version of the manuscript.
This article has an online supplement, which is accessible from this issue’s table of contents at www.atsjournals.org.
Originally Published in Press as DOI: 10.1164/rccm.202109-2150OC on June 7, 2022
Author disclosures are available with the text of this article at www.atsjournals.org.
References
- 1. Wiersinga WJ, Rhodes A, Cheng AC, Peacock SJ, Prescott HC. Pathophysiology, transmission, diagnosis, and treatment of coronavirus disease 2019 (COVID-19): a review. JAMA . 2020;324:782–793. doi: 10.1001/jama.2020.12839. [DOI] [PubMed] [Google Scholar]
- 2. Berlin DA, Gulick RM, Martinez FJ. Severe Covid-19. N Engl J Med . 2020;383:2451–2460. doi: 10.1056/NEJMcp2009575. [DOI] [PubMed] [Google Scholar]
- 3. Hariri LP, North CM, Shih AR, Israel RA, Maley JH, Villalba JA, et al. Lung histopathology in coronavirus disease 2019 as compared with severe acute respiratory sydrome and H1N1 influenza: a systematic review. Chest . 2021;159:73–84. doi: 10.1016/j.chest.2020.09.259. [DOI] [PMC free article] [PubMed] [Google Scholar]
- 4. Satturwar S, Fowkes M, Farver C, Wilson AM, Eccher A, Girolami I, et al. Postmortem findings associated with SARS-CoV-2: systematic review and meta-analysis. Am J Surg Pathol . 2021;45:587–603. doi: 10.1097/PAS.0000000000001650. [DOI] [PMC free article] [PubMed] [Google Scholar]
- 5. Konopka KE, Nguyen T, Jentzen JM, Rayes O, Schmidt CJ, Wilson AM, et al. Diffuse alveolar damage (DAD) resulting from coronavirus disease 2019 infection is morphologically indistinguishable from other causes of DAD. Histopathology . 2020;77:570–578. doi: 10.1111/his.14180. [DOI] [PMC free article] [PubMed] [Google Scholar]
- 6. Bankhead P, Loughrey MB, Fernández JA, Dombrowski Y, McArt DG, Dunne PD, et al. QuPath: open source software for digital pathology image analysis. Sci Rep . 2017;7:16878. doi: 10.1038/s41598-017-17204-5. [DOI] [PMC free article] [PubMed] [Google Scholar]
- 7. ARDS Definition Task Force; Ranieri VM. Rubenfeld GD. Thompson BT. Ferguson ND. Caldwell E. Fan E. et al. Acute respiratory distress syndrome: the Berlin Definition. JAMA . 2012;307:2526–2533. doi: 10.1001/jama.2012.5669. [DOI] [PubMed] [Google Scholar]
- 8. Sinha P, Fauvel NJ, Singh S, Soni N. Ventilatory ratio: a simple bedside measure of ventilation. Br J Anaesth . 2009;102:692–697. doi: 10.1093/bja/aep054. [DOI] [PubMed] [Google Scholar]
- 9. Sinha P, Calfee CS, Beitler JR, Soni N, Ho K, Matthay MA, et al. Physiologic analysis and clinical performance of the ventilatory ratio in acute respiratory distress syndrome. Am J Respir Crit Care Med . 2019;199:333–341. doi: 10.1164/rccm.201804-0692OC. [DOI] [PMC free article] [PubMed] [Google Scholar]
- 10. McGonagle D, Bridgewood C, Meaney JFM. A tricompartmental model of lung oxygenation disruption to explain pulmonary and systemic pathology in severe COVID-19. Lancet Respir Med . 2021;9:665–672. doi: 10.1016/S2213-2600(21)00213-7. [DOI] [PMC free article] [PubMed] [Google Scholar]
- 11. Ackermann M, Tafforeau P, Wagner WL, Walsh CL, Werlein C, Kühnel MP, et al. The bronchial circulation in COVID-19 pneumonia. Am J Respir Crit Care Med . 2022;205:121–125. doi: 10.1164/rccm.202103-0594IM. [DOI] [PMC free article] [PubMed] [Google Scholar]
- 12. Poschenrieder F, Meiler S, Lubnow M, Zeman F, Rennert J, Scharf G, et al. Severe COVID-19 pneumonia: perfusion analysis in correlation with pulmonary embolism and vessel enlargement using dual-energy CT data. PLoS One . 2021;16:e0252478. doi: 10.1371/journal.pone.0252478. [DOI] [PMC free article] [PubMed] [Google Scholar]
- 13. Patel BV, Arachchillage DJ, Ridge CA, Bianchi P, Doyle JF, Garfield B, et al. Pulmonary angiopathy in severe COVID-19: physiologic, imaging, and hematologic observations. Am J Respir Crit Care Med . 2020;202:690–699. doi: 10.1164/rccm.202004-1412OC. [DOI] [PMC free article] [PubMed] [Google Scholar]
- 14. Lv H, Chen T, Pan Y, Wang H, Chen L, Lu Y. Pulmonary vascular enlargement on thoracic CT for diagnosis and differential diagnosis of COVID-19: a systematic review and meta-analysis. Ann Transl Med . 2020;8:878. doi: 10.21037/atm-20-4955. [DOI] [PMC free article] [PubMed] [Google Scholar]
- 15. Ridge CA, Desai SR, Jeyin N, Mahon C, Lother DL, Mirsadraee S, et al. Dual-energy CT pulmonary angiography (DECTPA) quantifies vasculopathy in severe COVID-19 pneumonia. Radiol Cardiothorac Imaging . 2020;2:e200428. doi: 10.1148/ryct.2020200428. [DOI] [PMC free article] [PubMed] [Google Scholar]
- 16. Idilman IS, Telli Dizman G, Ardali Duzgun S, Irmak I, Karcaaltincaba M, Inkaya AC, et al. Lung and kidney perfusion deficits diagnosed by dual-energy computed tomography in patients with COVID-19-related systemic microangiopathy. Eur Radiol . 2021;31:1090–1099. doi: 10.1007/s00330-020-07155-3. [DOI] [PMC free article] [PubMed] [Google Scholar]
- 17. Grillet F, Busse-Coté A, Calame P, Behr J, Delabrousse E, Aubry S. COVID-19 pneumonia: microvascular disease revealed on pulmonary dual-energy computed tomography angiography. Quant Imaging Med Surg . 2020;10:1852–1862. doi: 10.21037/qims-20-708. [DOI] [PMC free article] [PubMed] [Google Scholar]
- 18. Lang M, Som A, Carey D, Reid N, Mendoza DP, Flores EJ, et al. Pulmonary vascular manifestations of COVID-19 pneumonia. Radiol Cardiothorac Imaging . 2020;2:e200277. doi: 10.1148/ryct.2020200277. [DOI] [PMC free article] [PubMed] [Google Scholar]
- 19. Perier F, Tuffet S, Maraffi T, Alcala G, Victor M, Haudebourg AF, et al. Effect of positive end-expiratory pressure and proning on ventilation and perfusion in COVID-19 acute respiratory distress syndrome. Am J Respir Crit Care Med . 2020;202:1713–1717. doi: 10.1164/rccm.202008-3058LE. [DOI] [PMC free article] [PubMed] [Google Scholar]
- 20. Zarantonello F, Andreatta G, Sella N, Navalesi P. Prone position and lung ventilation and perfusion matching in acute respiratory failure due to COVID-19. Am J Respir Crit Care Med . 2020;202:278–279. doi: 10.1164/rccm.202003-0775IM. [DOI] [PMC free article] [PubMed] [Google Scholar]
- 21. Coppo A, Bellani G, Winterton D, Di Pierro M, Soria A, Faverio P, et al. Feasibility and physiological effects of prone positioning in non-intubated patients with acute respiratory failure due to COVID-19 (PRON-COVID): a prospective cohort study. Lancet Respir Med . 2020;8:765–774. doi: 10.1016/S2213-2600(20)30268-X. [DOI] [PMC free article] [PubMed] [Google Scholar]
- 22.COVID-19 Treatment Guidelines Panel. Bethesda, MD: National Institutes of Health; 2022. https://www.covid19treatmentguidelines.nih.gov/ [PubMed] [Google Scholar]
- 23. Guérin C, Reignier J, Richard JC, Beuret P, Gacouin A, Boulain T, et al. PROSEVA Study Group Prone positioning in severe acute respiratory distress syndrome. N Engl J Med . 2013;368:2159–2168. doi: 10.1056/NEJMoa1214103. [DOI] [PubMed] [Google Scholar]
- 24. Brunin Y, Despres C, Pili-Floury S, Besch G. Lung recruiting effect of prone positioning in spontaneously breathing patients with COVID-19 assessed by electrical impedance tomography. Am J Respir Crit Care Med . 2021;204:476–477. doi: 10.1164/rccm.202008-3044IM. [DOI] [PMC free article] [PubMed] [Google Scholar]
- 25. Worthy SA, Müller NL, Hartman TE, Swensen SJ, Padley SP, Hansell DM. Mosaic attenuation pattern on thin-section CT scans of the lung: differentiation among infiltrative lung, airway, and vascular diseases as a cause. Radiology . 1997;205:465–470. doi: 10.1148/radiology.205.2.9356630. [DOI] [PubMed] [Google Scholar]
- 26. Lang M, Som A, Mendoza DP, Flores EJ, Reid N, Carey D, et al. Hypoxaemia related to COVID-19: vascular and perfusion abnormalities on dual-energy CT. Lancet Infect Dis . 2020;20:1365–1366. doi: 10.1016/S1473-3099(20)30367-4. [DOI] [PMC free article] [PubMed] [Google Scholar]
- 27. Som A, Lang M, Little B. Pulmonary vascular pathology in Covid-19. N Engl J Med . 2020;383:887. doi: 10.1056/NEJMc2022068. [DOI] [PubMed] [Google Scholar]
- 28. Si-Mohamed S, Chebib N, Sigovan M, Zumbihl L, Turquier S, Boccalini S, et al. In vivo demonstration of pulmonary microvascular involvement in COVID-19 using dual-energy computed tomography. Eur Respir J . 2020;56:2002608. doi: 10.1183/13993003.02608-2020. [DOI] [PMC free article] [PubMed] [Google Scholar]
- 29. Santamarina MG, Boisier Riscal D, Beddings I, Contreras R, Baque M, Volpacchio M, et al. COVID-19: what iodine maps from Perfusion CT can reveal—a prospective cohort study. Crit Care . 2020;24:619. doi: 10.1186/s13054-020-03333-3. [DOI] [PMC free article] [PubMed] [Google Scholar]
- 30. Nuckton TJ, Alonso JA, Kallet RH, Daniel BM, Pittet JF, Eisner MD, et al. Pulmonary dead-space fraction as a risk factor for death in the acute respiratory distress syndrome. N Engl J Med . 2002;346:1281–1286. doi: 10.1056/NEJMoa012835. [DOI] [PubMed] [Google Scholar]
- 31. Liu X, Liu X, Xu Y, Xu Z, Huang Y, Chen S, et al. Ventilatory ratio in hypercapnic mechanically ventilated patients with COVID-19–associated acute respiratory distress syndrome. Am J Respir Crit Care Med . 2020;201:1297–1299. doi: 10.1164/rccm.202002-0373LE. [DOI] [PMC free article] [PubMed] [Google Scholar]
- 32. Grasselli G, Tonetti T, Protti A, Langer T, Girardis M, Bellani G, et al. collaborators Pathophysiology of COVID-19-associated acute respiratory distress syndrome: a multicentre prospective observational study. Lancet Respir Med . 2020;8:1201–1208. doi: 10.1016/S2213-2600(20)30370-2. [DOI] [PMC free article] [PubMed] [Google Scholar]
- 33. Raymond LW. The alveolar air equation abbreviated. Chest . 1978;74:675–676. doi: 10.1378/chest.74.6.675. [DOI] [PubMed] [Google Scholar]
- 34. Morales-Quinteros L, Schultz MJ, Bringué J, Calfee CS, Camprubí M, Cremer OL, et al. MARS Consortium Estimated dead space fraction and the ventilatory ratio are associated with mortality in early ARDS. Ann Intensive Care . 2019;9:128. doi: 10.1186/s13613-019-0601-0. [DOI] [PMC free article] [PubMed] [Google Scholar]
- 35. Panwar R, Madotto F, Laffey JG, van Haren FMP. Compliance phenotypes in early acute respiratory distress syndrome before the COVID-19 pandemic. Am J Respir Crit Care Med . 2020;202:1244–1252. doi: 10.1164/rccm.202005-2046OC. [DOI] [PMC free article] [PubMed] [Google Scholar]
- 36. Thille AW, Esteban A, Fernández-Segoviano P, Rodriguez JM, Aramburu JA, Vargas-Errázuriz P, et al. Chronology of histological lesions in acute respiratory distress syndrome with diffuse alveolar damage: a prospective cohort study of clinical autopsies. Lancet Respir Med . 2013;1:395–401. doi: 10.1016/S2213-2600(13)70053-5. [DOI] [PubMed] [Google Scholar]
- 37. Ackermann M, Verleden SE, Kuehnel M, Haverich A, Welte T, Laenger F, et al. Pulmonary vascular endothelialitis, thrombosis, and angiogenesis in Covid-19. N Engl J Med . 2020;383:120–128. doi: 10.1056/NEJMoa2015432. [DOI] [PMC free article] [PubMed] [Google Scholar]
- 38. Hsia CC, Hyde DM, Ochs M, Weibel ER, ATS/ERS Joint Task Force on Quantitative Assessment of Lung Structure An official research policy statement of the American Thoracic Society/European Respiratory Society: standards for quantitative assessment of lung structure. Am J Respir Crit Care Med . 2010;181:394–418. doi: 10.1164/rccm.200809-1522ST. [DOI] [PMC free article] [PubMed] [Google Scholar]
- 39. Angus DC, Derde L, Al-Beidh F, Annane D, Arabi Y, Beane A, et al. Writing Committee for the REMAP-CAP Investigators Effect of hydrocortisone on mortality and organ support in patients with severe COVID-19: the REMAP-CAP COVID-19 corticosteroid domain randomized clinical trial. JAMA . 2020;324:1317–1329. doi: 10.1001/jama.2020.17022. [DOI] [PMC free article] [PubMed] [Google Scholar]