

Abstract
Rationale
Environmental threats and poorly controlled asthma disproportionately burden Black people. Some have attributed this to socioeconomic or biologic factors; however, racism, specifically historical redlining, a U.S. discriminatory mortgage lending practice in existence between the 1930s and the 1970s, may have actuated and then perpetuated poor asthma-related outcomes.
Objectives
To link historical redlining (institutional racism) to contemporary environmental quality– and lung health–related racial inequity.
Methods
Leveraging a broadly recruited asthma registry, we geocoded 1,034 registry participants from Pittsburgh/Allegheny County, Pennsylvania, to neighborhoods subjected to historical redlining, as defined by a 1930s Home Owners’ Loan Corporation (HOLC) map. Individual-level clinical/physiologic data, residential air pollution, demographics, and socioeconomic factors provided detailed characterization. We determined the prevalence of uncontrolled and/or severe asthma and other asthma-related outcomes by HOLC (neighborhood) grade (A–D). We performed a stratified analysis by self-identified race to assess the distribution of environmental and asthma risk within each HOLC grade.
Measurements and Main Results
The registry sampling overall reflected Allegheny County neighborhood populations. The emissions of carbon monoxide, filterable particulate matter <2.5 μm, sulfur dioxide, and volatile organic compounds increased across HOLC grades (all P ⩽ 0.004), with grade D neighborhoods encumbered by the highest levels. The persistent, dispersive socioenvironmental burden peripherally extending from grade D neighborhoods, including racialized access to healthy environments (structural racism), supported a long-term impact of historical/HOLC redlining. The worst asthma-related outcomes, including uncontrolled and/or severe asthma (P < 0.001; Z = 3.81), and evidence for delivery of suboptimal asthma care occurred among registry participants from grade D neighborhoods. Furthermore, elevated exposure to filterable particulate matter <2.5 μm, sulfur dioxide, and volatile organic compound emissions (all P < 0.050) and risk of uncontrolled and/or severe asthma (relative risk [95% confidence interval], 2.30 [1.19, 4.43]; P = 0.009) demonstrated inequitable distributions within grade D neighborhood boundaries, disproportionately burdening Black registry participants.
Conclusions
The racist practice of historical/HOLC redlining profoundly contributes to long-term environmental and asthma-related inequities in Black adults. Acknowledging the role racism has in these outcomes should empower more specific and novel interventions targeted at reversing these structural issues.
Keywords: asthma, racism, redlining, pollution, environment
At a Glance Commentary
Scientific Knowledge on the Subject
The impact of historical redlining on individual metrics of lung health—asthma (including related healthcare use and comorbid conditions), pulmonary function, and medication use—is unclear, with previous studies primarily based on ecological models that lack contextualization.
What This Study Adds to the Field
Historical redlining perpetuates poor environmental quality and may contribute to worsening asthma through the impact of long-standing institutional racism on neighborhoods.
The distribution of asthma-related mortality and morbidity remains inequitable among U.S. racial groups and is unacceptably high in U.S. Black people (1). Although investigators have posited multiple explanations, consistent geospatial coclustering of indicators of poor environmental quality and lung health in predominately Black neighborhoods strongly suggests that disproportionate exposure to air pollution contributes to asthma-related health inequities (2–4). The convergence of sociopolitical factors integrated over generations of racism contributes to the imbalanced distribution of environmental hazards and socioeconomic factors influencing health in U.S. Black communities, which could precipitate poor asthma outcomes and related disparities (4–17).
Historical redlining, a discriminatory mortgage lending practice and form of institutional racism, helped to legitimize U.S. racial segregation (8, 17). During the 1930s, the Home Owners’ Loan Corporation (HOLC) generated a four-tiered grading system for appraising mortgage applications in >200 U.S. metropolitan areas, including Pittsburgh/Allegheny County, Pennsylvania (Figure 1) (18). The HOLC deemed grade A/green neighborhoods the “best” and grade D/red neighborhoods as “hazardous” for mortgage lending. The neighborhood proportion of Black families inversely correlated with HOLC-perceived appraisal value such that, in many cities such as Pittsburgh, Black applicants experienced financial blacklisting, or redlining, over decades (8, 10, 17).
Figure 1.

Historical/Home Owners’ Loan Corporation redlining map of Pittsburgh/Allegheny County, Pennsylvania, from 1935 (18). Reprinted by permission from Reference 18.
Although evidence supports a long-term effect of historical/HOLC redlining (institutional racism) on toxic environments, the lingering impact on individual health remains unclear (7, 9, 11, 13–16). Some have suggested relationships between historical HOLC boundaries and a higher prevalence of present-day indicators of poor health, including asthma and other lung conditions (13, 16, 19–23). Yet, individual-level contextualization (demographic; socioenvironmental; occupational; and smoking, medical, and family history) with detailed matching physiologic/clinical data is specifically lacking in a majority of the previous studies, which predominately used ecological models.
We used an established asthma registry to address these gaps and support a link between historical/HOLC redlining (institutional racism), the environment, and lung health (asthma). We hypothesized that historical HOLC grade D neighborhoods contain modern areas characterized by the worst environmental quality and asthma-related outcomes. First, we determined if imbalanced neighborhood distributions of current environmental risks and worsened asthma are associated with historical/HOLC redlining. We then performed a stratified analysis by self-identified race to evaluate the distribution of worsened environmental risk and asthma-related outcomes among registry participants within each HOLC grade.
Methods
We first described the longitudinal impact of historical/HOLC redlining (institutional racism) on higher levels of pollution/emitters in grade D neighborhoods (beginning in the 1930s), and then addressed the current associations and/or correlations with asthma-related health outcomes in the past 15 years. A digitized, historical/HOLC redlining map of Pittsburgh/Allegheny County, Pennsylvania, illustrates the study area (see the online supplement and Figure 1) (18).
Asthma Registry
The University of Pittsburgh Asthma and Environmental Lung Health Institute@UPMC established an asthma-focused research registry in 2007 (database accessed on February 9, 2021). The registry used broad strategies to recruit participants (see the online supplement). Enrollment included the collection of standardized cross-sectional asthma-related health questionnaires and spirometric data, including FEV1, FVC, FEV1/FVC ratio, and reversibility (percentage). Registry participants with a >20–pack-year smoking history were excluded to minimize inclusion of patients with primary chronic obstructive pulmonary disease. Asthma cases were defined by research registry enrollment and either physician-diagnosed asthma or current asthma medication use.
Environmental Indicators and Community Characteristics
Geocoded data on stationary or point emission sources of industrial/commercial air pollutants (located in U.S. Environmental Protection Agency region 3) reported over the registry enrollment period by the National Emissions Inventory (NEI) every third year (2008, 2011, 2014, 2017) were accessed online (24). A 1-km buffer circumscribing historical HOLC polygons/neighborhood boundaries, derived from the digitized historical/HOLC redlining map of Pittsburgh/Allegheny County, was applied to select industrial/commercial (stationary or point) emitters of carbon monoxide (CO), filterable particulate matter <2.5 μm (PM2.5), nitrogen oxide, sulfur dioxide (SO2), and volatile organic compounds (VOCs) within/nearby historical HOLC boundaries in Allegheny County (Figure 1, Table 1) (18). Selected industrial/commercial (stationary or point) emitters were allocated to the nearest historical HOLC neighborhood-associated polyline using proximity analysis. To generate HOLC grade emission estimates, the emissions assigned to each historical HOLC neighborhood were summed by respective HOLC grade for each NEI year to generate 4 points per pollutant. In addition, historical environmental quality (semiquantitative analyses of appraisal text associated with the historical/HOLC redlining map from 1935 and land-use data based on satellite imagery from 1992); contemporary neighborhood-level socioenvironmental factors (centroid-based analyses of community data derived from the 2010 American Census Survey, filterable PM2.5 emissions from 2011/all NEI years, and modeled ambient PM2.5 levels from 2011); and proxies for transportation-related pollution exposure, specifically nonresidential (primary and secondary) road density, railroad density, and active waterway proximity (based on 2010 Topologically Integrated Geographic Encoding and Referencing centerlines) were evaluated (see the online supplement) (Table 1).
Table 1.
Environmental Indicators
| Indicator | Definition/Description (Data Coverage Year) |
|---|---|
| Industrial/commercial pollution emissions (stationary or point sources) |
1. Total filterable PM2.5 emissions (2008, 2011, 2014, 2017) 2. Total NOX emissions (2008, 2011, 2014, 2017) 3. Total SO2 emissions (2008, 2011, 2014, 2017) 4. Total CO emissions (2008, 2011, 2014, 2017) 5. Total VOCs emissions (2008, 2011, 2014, 2017) |
| Transportation-related pollution proxy | 1. Primary road density (2010) 2. Secondary road density (2010) 3. Railroad density (2010) 4. Proximity (0.5 km) to active waterway (2010) |
| Other | 1. Environmental quality terms in historical/HOLC redlining map appraisal text (1935) 2. Land use data by satellite imagery (1992) 3. Ambient PM2.5 (annual average) by combination of modeled air quality and air monitor data (2011) |
Definition of abbreviations: CO = carbon monoxide; HOLC = Home Owners’ Loan Corporation; NOx = nitrogen oxide; PM2.5 = particulate matter <2.5 μm; SO2 = sulfur dioxide; VOCs = volatile organic compounds.
Registry Participants and Contemporary Asthma-related Outcomes
The same buffered polygon-based approach with proximity analysis as described above was applied to identify 1,034 of the 1,668 adult registry participants eligible for geocoding who lived within/nearby one of the historical HOLC neighborhoods studied (enrolled between 2007 and 2020) (see Figure E1 in the online supplement). To generate HOLC grade asthma-related outcome estimates, the relevant data from registry participants were aggregated from all historical HOLC neighborhoods for a given HOLC grade. Uncontrolled and/or severe asthma, a composite variable based on symptoms, exacerbations, and pulmonary function as defined by Global Initiative for Asthma guidelines, was selected as the primary asthma-related outcome (Table 2) (25). In addition, secondary asthma-related outcomes were selected and binned into categories: clinical, asthma medication, comorbid conditions, nonasthma pharmacologic management, and physiologic/spirometry (Table 2). Using linear regression and study population parameters, FEV1 and FVC (in liters) were both adjusted for age (centered), height (centered), and sex assigned at birth to generate quintiles and study population–normalized predicted values (percent). FEV1/FVC was adjusted for age (centered). There were no race normalizations applied. For comparison, predicted FEV1 and FVC (percent) were also calculated using Global Lung Function Initiative (GLI) equations for other/mixed race (a composite equation based on White, African American, and North and South East Asian individuals) (26). Asthma specialist care was evaluated as an exploratory outcome (Table 2). See the online supplement for additional details regarding missing data, other variables/outcomes, and related calculations.
Table 2.
Asthma-related Outcomes with Summary of Definitions/Descriptions and Missing Data
| Outcome Type | Outcome Bin | Outcome Description/Definition | Not Missing | Missing |
|---|---|---|---|---|
| Primary | Uncontrolled and/or severe asthma | 1. Exacerbation-prone asthma and at least one of the following: a. Bottom quintile of age-, sex-, and height-normalized FEV1 values b. Bottom quintile of age-normalized FEV1/FVC values c. Symptomatic asthma and at least one daily puff of SABA d. Symptomatic asthma and at least one missed day(s) because of asthma |
990 | 44 |
| Secondary | Clinical | 1. Exacerbation-prone asthma | 988 | 46 |
| 2. Symptomatic asthma | 989 | 45 | ||
| 3. Asthma medication boosts | 1,030 | 4 | ||
| 4. At least one missed day(s) because of asthma | 957 | 77 | ||
| Asthma medication | 1. Daily SABA use (puffs) | 1,003 | 31 | |
| 2. Current high-dose ICS | 1,013 | 21 | ||
| 3. Current ICS/long-acting β-agonist inhaler use | 1,013 | 21 | ||
| 4. Current leukotriene receptor antagonist use | 1,010 | 24 | ||
| 5. Current oral steroid use | 1,013 | 21 | ||
| 6. Current anti-IgE therapy | 1,007 | 27 | ||
| Comorbid conditions | 1. Current anxiety | 1,014 | 20 | |
| 2. Current depression | 1,014 | 20 | ||
| 3. Current diabetes | 1,014 | 20 | ||
| 4. Current GERD | 1,014 | 20 | ||
| 5. Current hypertension | 1,013 | 21 | ||
| 6. Current obstructive sleep apnea | 1,014 | 20 | ||
| Nonasthma pharmacologic management | 1. Current anxiety and current anxiety medication use | 1,012 | 22 | |
| 2. Current depression and current depression medication use | 1,011 | 23 | ||
| 3. Current diabetes and current diabetes medication use | 1,015 | 19 | ||
| 4. Current GERD and current GERD medication use | 1,008 | 26 | ||
| 5. Current hypertension and current hypertension medication use | 1,011 | 23 | ||
| 6. Current nasal allergies and current nasal steroid use | 1,008 | 26 | ||
| Physiologic/spirometry | 1. FEV1 (% predicted value) | 937 | 97 | |
| 2. FVC (% predicted value) | 937 | 97 | ||
| 3. FEV1/FVC | 937 | 97 | ||
| 4. Reversibility (%) | 931 | 103 | ||
| Exploratory | Asthma specialist care | 1. Current nasal allergies | 1,012 | 22 |
| 2. Current eczema | 1,007 | 27 | ||
| 3. History of AIT and/or anti-IgE therapy | 1,006 | 28 | ||
| 4. Identification of asthma specialist care | 1,034 | 0 |
Definition of abbreviations: AIT = allergen immunotherapy; GERD = gastroesophageal reflux disease; ICS = inhaled corticosteroids; SABA = short-acting β-agonist.
Stratified Analyses
For self-identified racial categories exhibiting an imbalanced distribution across HOLC grades, stratified analyses by self-identified race were preplanned to investigate the distribution of historical/HOLC redlining-associated, asthma-related outcomes within each HOLC grade. Accordingly, registry participants were localized to a single historical HOLC neighborhood. Stratified analyses by self-identified race for demographic/characteristic and environmental indicators provided contextualization. For stratified comparisons of environmental indicators by self-identified race, emitters of relevant industrial/commercial air pollutant components (reported by NEI) were linked to a single historical HOLC neighborhood, and then the total emission were summed by historical HOLC neighborhood for each NEI year (unit is metric tons per NEI year). The emission rate (both nonnormalized and normalized to the average emission rate over the NEI period) for the historical HOLC neighborhood and the NEI year corresponding to the registry participant’s residential address and year of enrollment, respectively, were used to estimate individual exposures.
Statistics
Registry participants’ demographics/characteristics were compared using Kruskal-Wallis tests (χ2 approximation) with post hoc Dunn tests, Mann-Whitney tests, Pearson’s χ2 tests, or nominal logistic regression. Spearman’s rho correlations with post hoc Dunn tests or Cochran-Armitage tests for trend were used to assess monotonicity/asymmetry across HOLC grades with respect to environmental indicators, specifically if the ordinal structure grades A to D correlated with scaling environmental quality. This ordinal structure was applied to asthma-related outcome assessment using Spearman’s rho correlations or Cochran-Armitage tests for trend, specifically to detect any asthma-related outcomes displaying monotonic HOLC grade distribution and correlation with environmental quality. After initial analyses by HOLC grade, P values for asthma-related outcomes were adjusted for all covariates, except race, that displayed imbalance across HOLC grades using stepwise ordinal logistic regression (physiologic covariates were loaded in the model before nonphysiologic covariates) (Table 3). For the preplanned stratified analysis, environmental indicators and asthma-related outcomes were compared using Mann-Whitney tests or calculating relative risk (RR) with 95% confidence interval (95% CI). Bootstrapping with replacement (2,500 iterations) was performed to estimate the 95% CI for Spearman’s rho correlations. Exact tests were performed as appropriate. Median tests were substituted for nonparametric tests (Kruskal-Wallis or Mann-Whitney tests) if >33% of ranks were tied and due to a single value/zero. Unless Bonferroni corrections were applied, P < 0.050 indicated statistical significance (see the online supplement).
Table 3.
Registry Participant Demographics/Characteristics
| Characteristics | Grade A (n = 81) |
Grade B (n = 377) |
Grade C (n = 400) |
Grade D (n = 176) |
P Value, Test Statistic |
|---|---|---|---|---|---|
| Year of enrollment, median [IQR]*† | 2014 | 2016 | 2016 | 2016 | P = 0.009, χ2 = 11.5 |
| [2012, 2017] | [2012, 2018] | [2013, 2018] | [2012, 2017] | ||
| Age, yr, median [IQR]*‡ | 39 | 35 | 34 | 42 | P = 0.014, χ2 = 10.6 |
| [26.5, 59] | [26, 52] | [26, 50.8] | [30, 55] | ||
| Height, cm, median [IQR]* | 168.3 | 165.1 | 167.3 | 167.1 | P = 0.179, χ2 = 4.91 |
| [160.1, 177.3] | [160.0, 172.0] | [160.0, 175.0] | [160.6, 173.7] | ||
| Assigned female sex at birth, n/N (%)§ | 55/81 | 293/377 | 291/400 | 132/176 | P = 0.205, χ2 = 4.59 |
| (68%) | (78%) | (73%) | (75%) | ||
| Self-identified race‖ | P <0.001, χ2 = 83.9 | ||||
| Asian or Indigenous peoples of Oceania, n/N (%)¶ | 3/81 | 17/377 | 5/400 | 3/176 | P = 0.027, χ2 = 8.85 |
| (4%) | (5%) | (1%) | (2%) | ||
| Black, n/N (%)§ | 7/81 | 82/377 | 123/400 | 87/176 | P <0.001, χ2 = 62.3 |
| (9%) | (22%) | (31%) | (49%) | ||
| Indigenous peoples of North America, n/N (%)¶ | 0/81 | 0/377 | 1/400 | 2/176 | P = 0.186, χ2 = 5.71 |
| (0%) | (0%) | (<1%) | (1%) | ||
| White, n/N (%)§ | 62/81 | 250/377 | 250/400 | 76/176 | P <0.001, χ2 = 36.3 |
| (77%) | (66%) | (61%) | (43%) | ||
| Some other race or no self-identification, n/N (%)¶ | 4/81 | 9/377 | 11/400 | 2/176 | P = 0.317, χ2 = 3.42 |
| (5%) | (2%) | (3%) | (1%) | ||
| Multiracial, n/N (%)§ | 5/81 | 19/377 | 15/400 | 6/176 | P = 0.615, χ2 = 1.80 |
| (6%) | (5%) | (4%) | (3%) | ||
| Hispanic or Latino ethnicity, n/N (%)¶ | 4/81 | 16/377 | 18/400 | 4/176 | P = 0.591, χ2 = 1.84 |
| (5%) | (4%) | (5%) | (2%) | ||
| Access to opportunity and capital, n/N (%)§ | 49/74 | 189/362 | 188/391 | 73/173 | P = 0.004, χ2 = 13.3 |
| (66%) | (52%) | (48%) | (42%) | ||
| Health insurance type, n/N (%)‖ | P <0.001, χ2 = 37.7 | ||||
| Private | 61/81 | 231/377 | 237/400 | 82/176 | |
| (75%) | (61%) | (59%) | (47%) | ||
| Medicaid | 6/81 | 72/377 | 93/400 | 63/176 | |
| (7%) | (19%) | (23%) | (36%) | ||
| Medicare | 3/81 | 19/377 | 16/400 | 12/176 | |
| (4%) | (5%) | (4%) | (7%) | ||
| Uninsured | 5/81 | 31/377 | 31/400 | 10/176 | |
| (6%) | (8%) | (8%) | (6%) | ||
| Self-pay or other | 6/81 | 25/377 | 23/400 | 9/176 | |
| (7%) | (7%) | (6%) | (5%) | ||
| Educational attainment (some college or higher), n/N (%)§ | 70/75 | 313/365 | 316/392 | 146/173 | P = 0.028, χ2 = 9.10 |
| (93%) | (86%) | (81%) | (84%) | ||
| Current employment outside the home, n/N (%)§ | 59/76 | 269/365 | 252/393 | 100/175 | P = 0.018, χ2 = 10.0 |
| (78%) | (74%) | (64%) | (57%) | ||
| Known occupational risk, n/N (%)§ | 8/76 | 19/365 | 15/393 | 12/175 | P = 0.084, χ2 = 6.64 |
| (11%) | (5%) | (4%) | (7%) | ||
| 10–20 pack-years smoking history, n/N (%)¶ | 2/74 | 13/356 | 15/380 | 13/171 | P = 0.191, χ2 = 5.35 |
| (3%) | (4%) | (4%) | (8%) | ||
| Early-onset asthma, n/N (%)§ | 35/76 | 188/364 | 201/387 | 79/171 | P = 0.447, χ2 = 2.66 |
| (46%) | (52%) | (52%) | (46%) | ||
| History of chronic rhinosinusitis with nasal polyps, n/N (%)§ | 9/77 | 32/369 | 30/393 | 10/175 | P = 0.397, χ2 = 2.97 |
| (12%) | (9%) | (8%) | (6%) | ||
| History of chronic rhinosinusitis without nasal polyps, n/N (%)§ | 41/77 | 221/368 | 226/393 | 101/175 | P = 0.708, χ2 = 1.39 |
| (53%) | (60%) | (58%) | (58%) | ||
| Family history of asthma, n/N (%)§ | 42/77 | 220/364 | 216/384 | 100/170 | P = 0.616, χ2 = 1.79 |
| (55%) | (60%) | (56%) | (59%) | ||
| Family history of allergies or hay fever, n/N (%)§ | 57/77 | 245/361 | 263/384 | 115/171 | P = 0.734, χ2 = 1.28 |
| (74%) | (68%) | (68%) | (67%) |
Definition of abbreviation: IQR = interquartile range.
Bold font indicates statistical significance (after Bonferroni correction, if applicable). Italicized font indicates loss of statistical significance after Bonferroni correction.
P value (overall) calculated using the Kruskal-Wallis test.
Grade A versus Grade C post hoc Dunn test: P = 0.005, Z = −3.34; grade A versus grade D post hoc Dunn test: P = 0.045, Z = −2.69.
Grade D versus grade C post hoc Dunn test: P = 0.015, Z = 3.03.
P value (overall) calculated using the Pearson’s χ2 test.
P value (overall) calculated using nominal logistic regression.
P value (overall) calculated using Fisher’s exact test.
Results
Pittsburgh/Allegheny County Historical HOLC Neighborhoods
The study area included only the 111 out of 114 historical HOLC neighborhoods (grade A, n = 11/11; grade B, n = 27/27; grade C, n = 41/42; grade D, n = 32/34) confined to/included within Allegheny County (see the online supplement and Figure 1) (18). Grade A neighborhoods showed the smallest areal representation (21 km2) on the historical/HOLC redlining map of Allegheny County/Pittsburgh, followed by grades D (89 km2), B (103 km2), and then C (115 km2) neighborhoods. Grade A neighborhoods did not share any borders with grade D neighborhoods, whereas grade D neighborhoods most commonly bordered grade C neighborhoods. Grades B and C neighborhoods shared borders with all HOLC grades (Figure E2). Thus, A and D HOLC grades were considered neighborhood extremes for analysis.
Longitudinal Relationship of Historical/HOLC Redlining with Environmental Quality
Beginning with 1935 appraisal texts from the historical/HOLC redlining map of Allegheny County/Pittsburgh, abundant use of terms to describe grade D neighborhoods, such as “mills,” “smoke,” “flood,” “industry,” “dust,” and others, strongly indicated poor environmental quality as historical/HOLC redlining practices commenced (Table E1, Figure E3). Nearly 60 years later, disproportionately high percentages of industrial/commercial- and transportation-related land use coverage persisted in grade D neighborhoods relative to other historical HOLC neighborhoods in 1992 (Figure E4). Thus, poor environmental quality, specifically toxic/industrial rather than residential zoning, continued years later within grade D neighborhoods, even after deindustrialization (steel industry collapse). These effects continued ∼30 years forward within/nearby grade D neighborhoods with the highest total emissions of CO, filterable PM2.5, SO2, and VOCs (but not nitrogen oxide, grades A to D monotonicity, ρ = 0.82; P < 0.001; grade A vs. grade D, P = 0.034 > α; Z = 2.17) from stationary or point industrial/commercial sources observed over most of the enrollment period from 2008 to 2019 (Figure 2A). Ambient PM2.5 (in 2011) similarly increased monotonically across HOLC grades, with A to D grade directionality (ρ = 0.21 [0.01, 0.39]; P = 0.029). Despite similar nonresidential road densities (primary, P = 0.244, χ2 = 5.28; secondary, P = 0.137, χ2 = 5.49) across HOLC grades, grade D neighborhoods had the highest railroad density and active waterway proximity (shipping pollution proxy) (Figure 2B).
Figure 2.

Grade D neighborhoods contain the worst indicators of environmental quality, including the highest emissions of filterable particulate matter <2.5 μm (PM2.5), sulfur dioxide (SO2), volatile organic compounds (VOCs), and carbon monoxide (CO) over the study period (National Emissions Inventory year, circle = 2008; square = 2011; triangle = 2014; diamond = 2017) (A), as well as the highest railroad density and closest proximity to active waterways (B). P values were calculated by Cochran-Armitage test for trend or Spearman’s rho correlations with post hoc Dunn test.
Racialization and Diffusion of Grade D Neighborhood-associated Factors
Text from the historical/HOLC redlining map of Pittsburgh/Allegheny County suggested the exclusion of Black people from non–grade D neighborhoods in 1935, with persistent segregation to 2010 as supported by grade D neighborhood–based census tract centroid analysis (Figures E5 and E6). Supporting a broader impact of historical/HOLC redlining, increased distance from grade D neighborhood boundaries not only correlated with decreased ambient PM2.5 levels but also increased mortgage housing tenure and decreased neighborhood deprivation, an index for estimating structural racism generated from 10 highly correlated indicators of socioeconomic status (SES) with good internal reliability (Cronbach’s α = 0.88) (see the online supplement and Figure E6). Filterable PM2.5 emissions also decreased with distance from grade D neighborhood boundaries, in parallel with ambient PM2.5 levels (Table E2). Mortgage tenure, neighborhood deprivation, and both emitted (filterable) and ambient PM2.5 levels displayed spatial correlation with the percentage Black population by census tract, consistent with racialized access to wealth acquisition and healthy environments (structural racism) (Table E2).
Demographics/Characteristics of Registry Participants Living in Historical HOLC Neighborhoods
The 1,034 registry participants represented the geographic regions of Pittsburgh/Allegheny County well, and their distribution was similar to that of the overall population composition within historical HOLC neighborhoods (Figure 3, Table 3, Table E3). The differences are consistent with the epidemiologic prevalence of adult asthma (overall older, more female individuals, and more Black people). Most registry participants resided in grade C neighborhoods, consistent with the overall population distribution (Table 3). Registry participants from grade A neighborhoods had a slightly earlier median year of enrollment than others, and registry participants recruited via public transit/bus advertisements (n = 19/1,034) almost exclusively resided in grade B (42%) or grade D (47%) neighborhoods (Table 3, Table E4). Otherwise, no further differences at the enrollment or recruitment level existed. Registry participants had a similar age range across HOLC grades, although those from grade D neighborhoods were slightly older than those from grade C neighborhoods (Table 3). Black registry participants showed increasing representation from grades A to D neighborhoods, consistent with historical (1935) and contemporary population estimates of areas corresponding to historical HOLC boundaries (Figure 3, Figure E5, Table 3). Differences in SES-related indicators, specifically the distribution of income-restrictive health insurance, reflected increased access to opportunity and capital in grade A neighborhoods (Table 3). No other demographic/characteristic differences, including history of smoking or vaping (P = 0.266, χ2 = 3.96), existed (see the online supplement) (Table 3).
Figure 3.

Comparison of area estimates of population size and percentage Black race based on asthma registry sampling (upper graph) and census sampling (lower graph) from Allegheny County neighborhoods subjected to historical/Home Owners’ Loan Corporation (HOLC) redlining demonstrates population-level similarities. The darker bars correspond to the left y-axis, and the lighter bars correspond to the right y-axis. In the lower graph, the lighter bars represent medians with interquartile ranges.
Relationship of Historical/HOLC Redlining to Asthma-related Outcomes
Primary Outcome
Registry participants from grade D neighborhoods reported a higher prevalence of uncontrolled and/or severe asthma, which overall fitted a monotonic trend increasing in prevalence from grades A to D neighborhoods (Figure 4A).
Figure 4.
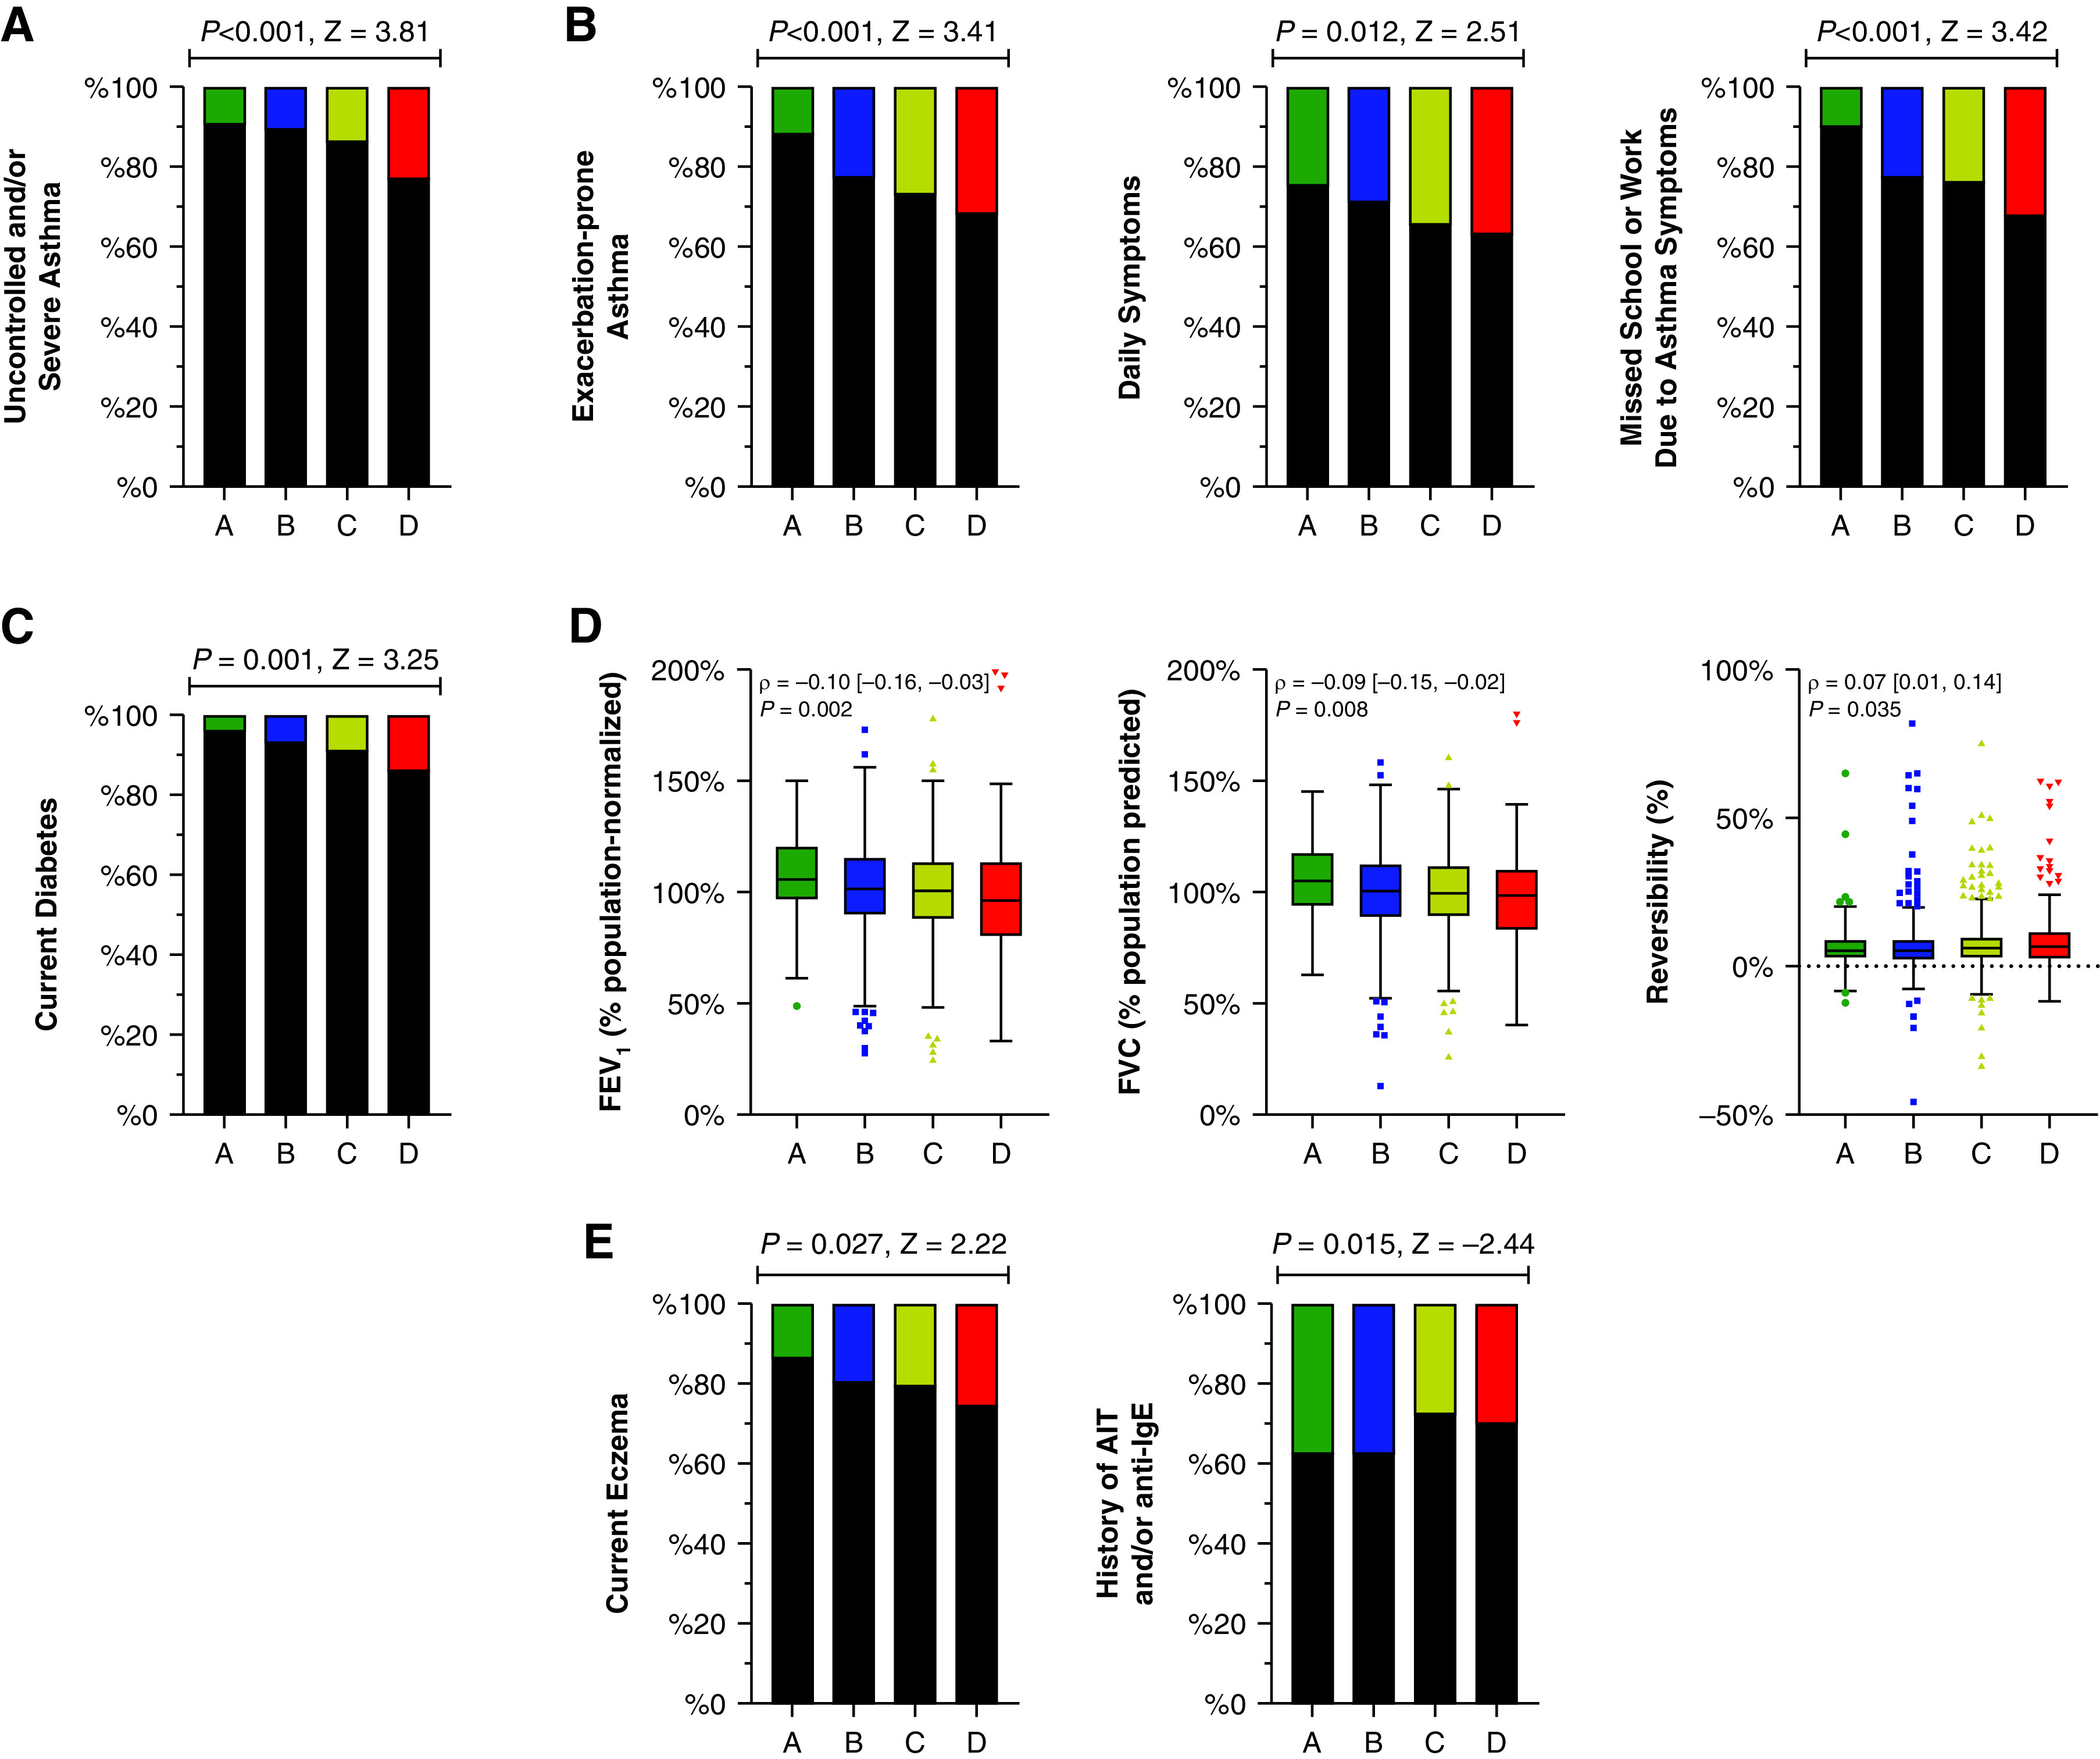
Registry participants from grade D neighborhoods show the most evidence for uncontrolled and/or severe asthma (stacked bar graphs; black = no; colors = yes) (A), secondary clinical outcomes (stacked bar graphs; black = no; colors = yes) (B), current diabetes (general health indicator; stacked bar graphs; black = no; colors = yes) (C), spirometric measurements (Tukey plots) (D), and exploratory outcomes (stacked bar graphs; black = no; colors = yes) (E). P values were calculated by Cochran-Armitage test for trend or Spearman’s rho correlations. AIT = allergen immunotherapy.
Secondary Outcomes
Clinical
Registry participants from grade D neighborhoods reported the highest rates of exacerbation-prone asthma and symptomatic asthma, which demonstrated monotonic increasing trends from grades A to D neighborhoods (Figure 4B). Not surprisingly, the frequency of missed (school or work) days because of asthma (but not multiple asthma medication boosts; P = 0.017 > α; Z = 2.40) demonstrated a similar relationship (Figure 4B).
Asthma Medication
Despite this evidence of increasing presence of poorly controlled asthma and more frequent daily short-acting β-agonist use from grades A to D, registry participants reported no parallel trends for increasing use of add-on therapy (Table E5).
Comorbid Conditions and Nonasthma Pharmacologic Management
The prevalence of current diabetes trended higher from grades A to D neighborhoods but not any other comorbid condition or the pharmacologic management of any of the comorbid conditions (Figure 4C, Tables E6 and E7).
Physiologic/Spirometry
Adjusting spirometric values resulted in no departure from regression assumptions. Study population–normalized FEV1 and FVC (but not FEV1/FVC; ρ = 0.03; P = 0.339) demonstrated significant monotonic trends, decreasing with grade A to D directionality (Figure 4D). Study population–normalized FEV1 (ρ = 0.91 [0.90, 0.93]; P < 0.001) and FVC (ρ = 0.89 [0.87, 0.91]; P < 0.001) strongly correlated with predicted values using the GLI equations for other/mixed race individuals. Consequently, FEV1 and FVC normalized using GLI equations for other/mixed race resulted in the same decreasing monotonic trend across HOLC grades (Figure E7). Variation in reversibility, not traditionally race normalized, also fitted a monotonic trend, increasing from grades A to D neighborhoods (Figure 4D).
Exploratory Outcomes
The prevalence of current eczema (but not early-onset asthma or current nasal allergies) trended higher from grades A to D neighborhoods (Figure 4E, Table 3, Table E6). There was no increasing trend in identification of asthma specialist care from grades A to D neighborhoods (P = 0.062; Z = −1.87), despite accumulating evidence for worsening asthma control in the same grade A to D direction. There was also a lower history of allergen immunotherapy and/or anti-IgE therapy (the only asthma biologic available for the full enrollment period) in grade D neighborhoods, which reflected either less exposure to asthma specialist care (required to implement both therapies) or less optimal asthma care once referred (Figure 4E).
Covariate Adjustment
The described relationships between HOLC grade and all asthma-related outcomes persisted after stepwise adjustment for age, then year of enrollment, and finally access to opportunity and capital (Table E8). P values for spirometric volumes by HOLC grade were not readjusted for age, because there was initial population-based adjustment for age, height, and sex assigned at birth.
Stratified Analyses by Self-identified Race
Primary Outcome within Each HOLC Grade
No Black registry participant living in a grade A neighborhood had uncontrolled and/or severe asthma (n = 0/7). In grade B neighborhoods, Black and White (referent) registry participants were not differentially at risk for uncontrolled asthma (RR [95% CI], 1.41 [0.71, 2.79]; P = 0.323). However, Black relative to White registry participants were at a higher risk of uncontrolled and/or severe asthma living in both grade C (RR [95% CI], 3.71 [2.11, 6.52]; P < 0.001) and grade D neighborhoods (Figure 5A).
Figure 5.
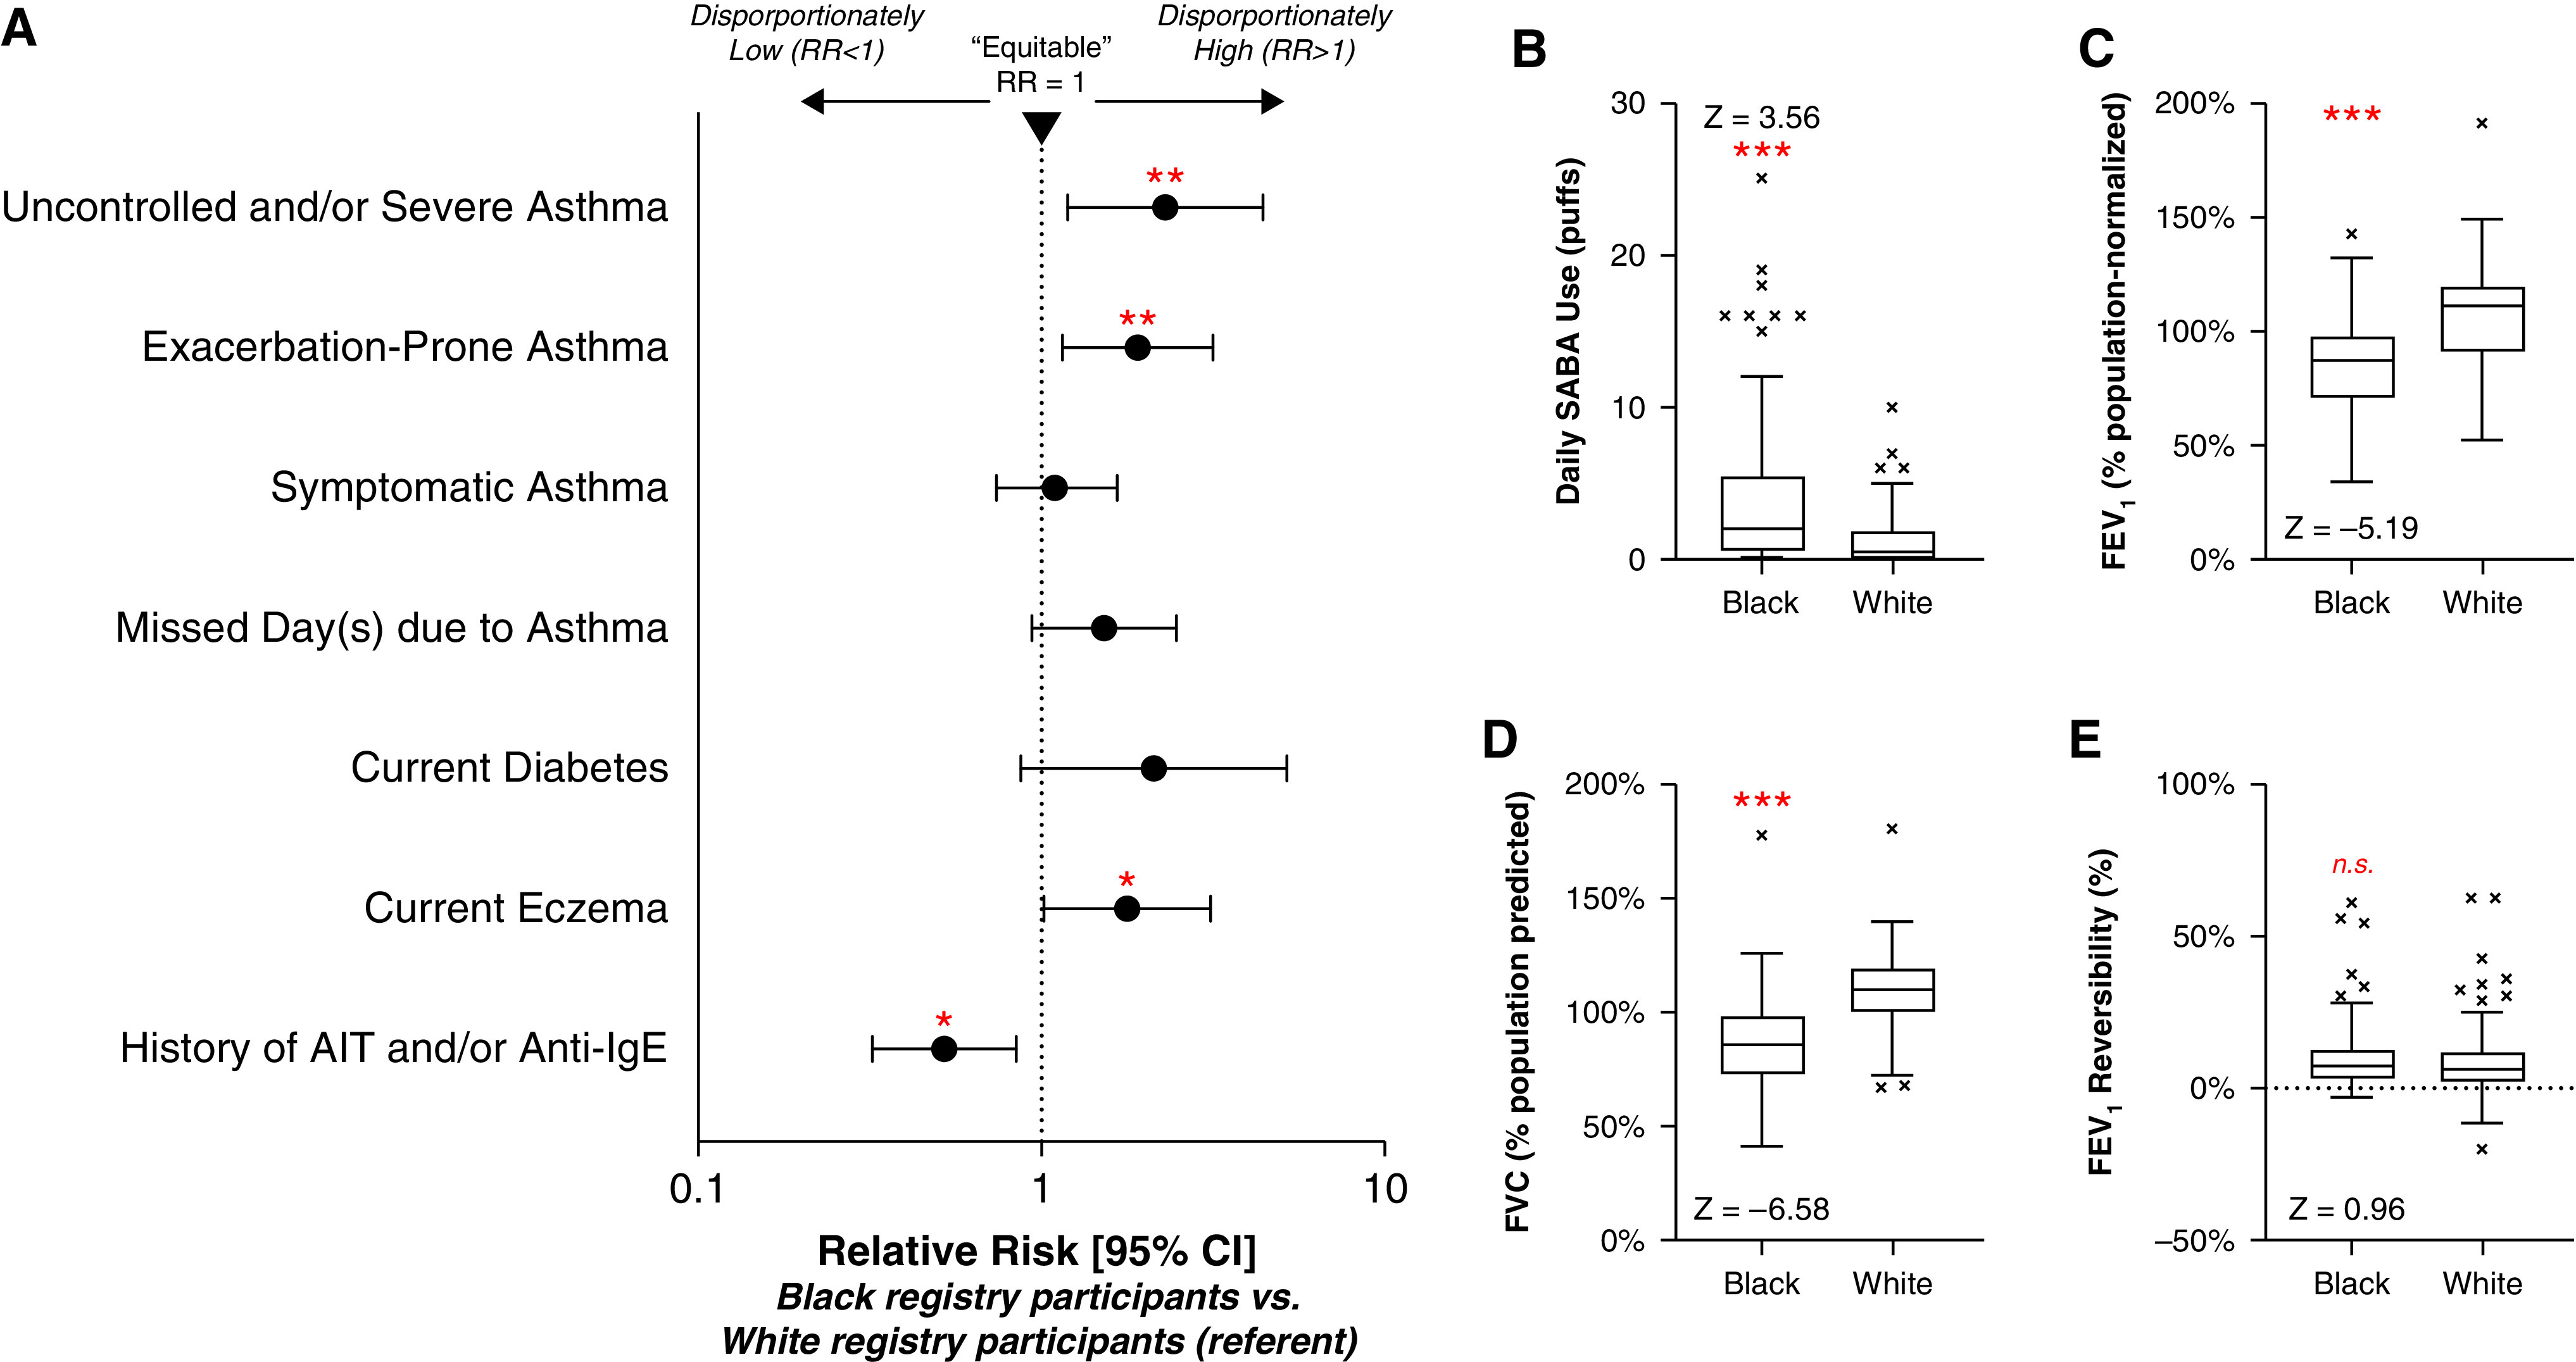
Forest plot (relative risk [RR], 95% confidence interval [CI]) of categorical asthma-related outcomes (A) and Tukey plots of daily short-acting β-agonist (SABA) use (B), FEV1 (C), FVC (D), and FEV1 reversibility (E) depicting the inequitable distribution of worsened asthma among Black and White registry participants with residence in grade D neighborhoods. The outcomes/measurements shown demonstrated significant, monotonic trends with grades A to D neighborhood directionality in the initial analyses. P values were calculated by RR (95% CI) and Mann-Whitney test (*P < 0.05; **P < 0.01; ***P < 0.001). AIT = allergen immunotherapy.
Environmental Indicators and Demographics/Characteristics in Grades C and D Neighborhoods
Black compared with White registry participants living in grade D neighborhoods experienced significantly higher emission rates of filterable PM2.5, SO2, and VOCs but not higher emitted CO or exposure to transportation-related pollution proxies (active waterways, P = 0.057; χ2 = 3.63; railroad track density, P = 0.003; Z = −3.02) (Table 4). Differences in neighborhood-level pollution emissions were not observed between Black and White registry participants living in grade C neighborhoods (Table E9). Although few demographic/characteristic differences existed between Black and White registry participants living in grade D neighborhoods, Black compared with White registry participants living in grade C neighborhoods were older and differed by characteristics not addressed through covariate adjustment (known occupational risk, family history of allergies or hay fever) (Tables E10 and E11). Accordingly, subsequent analyses focused exclusively on registry participants living in grade D neighborhoods.
Table 4.
Stratified Analysis: Comparison of Neighborhood Emissions among Black and White Registry Participants Living in Grade D Neighborhoods
| Nonnormalized |
Normalized to Average Emission Rate (over Study Period) |
|||||
|---|---|---|---|---|---|---|
| Black | White | P Value, Test Statistic | Black | White | P Value, Test Statistic | |
| CO* | 1.46 | 0.02 | P = 0.102, | 0.91 | <0.01 | P = 0.134, |
| [0, 38.88] | [0, 31.58] | χ2 = 2.67 | [0, 0.98] | [0, 0.91] | χ2 = 2.24 | |
| Filterable PM2.5* | 1.01 | <0.01 | P = 0.072, | 0.75 | <0.01 | P = 0.002, |
| [0, 1.65] | [0, 1.64] | χ2 = 3.23 | [0, 1.28] | [0, 1.02] | χ2 = 9.26 | |
| SO2* | 0.42 | <0.01 | P = 0.262, | 0.89 | 0.01 | P = 0.017, |
| [0, 2.44] | [0, 0.58] | χ2 = 1.26 | [0, 1.37] | [0, 0.88] | χ2 = 5.72 | |
| VOCs* | 9.51 | 0.47 | P = 0.004, | 0.94 | 0.06 | P = 0.047, |
| [0, 18.94] | [0, 12.84] | χ2 = 8.31 | [0, 1.09] | [0, 0.98] | χ2 = 3.96 | |
Definition of abbreviations: CO = carbon monoxide; PM2.5 = particulate matter <2.5 μm; SO2 = sulfur dioxide; VOCs = volatile organic compounds.
Bold font indicates statistical significance. Data are presented as median [interquartile range] neighborhood emission rates (metric tons per National Emissions Inventory year) of CO, filterable PM2.5, SO2, and VOCs.
P value calculated with the median test.
Secondary and Exploratory Outcomes in Grade D Neighborhoods
Supporting clinically worse asthma, Black compared with White registry participants in grade D neighborhoods reported more exacerbation-prone asthma and greater daily short-acting β-agonist use, but not more symptomatic asthma, and also exhibited lower study population–normalized FEV1 and FVC with no difference in reversibility (or FEV1/FVC, P = 0.498; Z = 0.68) (Figures 5A–5E). These differences in FEV1 (GLI, P < 0.001; Z = −5.37) and FVC (GLI, P < 0.001; Z = −6.51) were maintained using GLI equations for other/mixed race. Black compared with White registry participants also reported a higher prevalence of current eczema (Figure 5A). Despite similar rates of identification of asthma specialist care (White, 16%; Black, 24%; P = 0.212; χ2 = 1.56), Black compared with White registry participants less commonly reported receiving allergen immunotherapy and/or anti-IgE therapy (Figure 5A).
Discussion
Neighborhood context influences human health and underpins many U.S. racial health inequities (6). Investigators previously reported relationships between historical/HOLC redlining and worsening health, including increased asthma-related emergency department visits using broad public health database studies (13, 16, 19–23). Our well-characterized asthma registry–derived study goes beyond population-based approaches to demonstrate that racism (rather than race), acting as an overarching socioenvironmental risk factor, appears to worsen asthma morbidity (and mortality) in Black people. Importantly, drawing on our representative asthma population resident in all four grades of historical HOLC neighborhoods of a typical postindustrial, Rust Belt county (Allegheny County, Pennsylvania), we directly linked the racist lending practices detailed >80 years ago to the maintenance of poor environmental quality present in the most redlined/grade D neighborhoods today. This link between these neighborhood environmental inequities and institutional racism further associated with the worst asthma-related outcomes.
Previous studies predominately used ecological modeling and/or provided minimal matching clinical/physiologic data and patient contextualization, preventing extrapolation to the individual (13, 16, 19–23). In addition, studies using poorly operationalized outcomes (emergency department visits without knowledge of steroid bursts) may simply capture healthcare access or insurance type rather than truly measure more severe disease (27, 28). Analysis of data from a broadly based yet comprehensive asthma registry, unobtainable using a random-dialing approach, in a population-stable Rust Belt city such as Pittsburgh afforded a unique opportunity to evaluate the long-term impact of the racist policy of redlining on a common disease (asthma). In fact, more than 90% of registry participants underwent pre- and post-bronchodilator pulmonary function testing at the enrollment visit, contributing to the detailed patient characterization. Thus, the present study blends the best of convenience methods and random community sampling with the enhanced granularity of individual-level matching registry data with extensive contextualization, greatly extending the scant literature describing the impact of institutional racism on lung health.
Historical/HOLC redlining (institutional racism) likely worsens health in many ways, including producing and reinforcing pollution inequity (7, 9, 11, 13–16). Investigators have linked high PM2.5 exposure in particular to racial pollution inequity, as reflected here in grade D neighborhoods having the highest proportion of Black registry participants coupled with the disproportionate burden of pollution exposure borne by Black registry participants within grade D neighborhoods (2, 4). Air pollution augments asthmatic structural changes and type 2 inflammation, reinforces IgE sensitization, disrupts skin barriers to enhance allergen reactivity, and/or dampens antiviral immunity, potentially worsening asthma exacerbations (29–33). Air pollution components can also oxidatively damage airway epithelial cell membranes (34). We linked greater numbers of asthma exacerbations and uncontrolled and/or severe asthma cases within grade D neighborhood boundaries to multiple indicators of poor environmental quality, including the highest emitted (filterable) and ambient PM2.5 and waterway/shipping pollution exposure. Correspondingly, investigators have reported an association between residential exposure to shipping pollution and self-reported eczema among adults with asthma (35). In our study, Black registry participants from grade D neighborhoods reported a higher prevalence of current eczema, typically associated with high serum IgE levels (36). Whether this environmentally linked increase in eczema contributes to the higher serum IgE levels in Black compared with White adults with asthma remains to be determined (37).
Unsurprisingly, but consistent with a persistent effect of redlining/institutional racism, historical HOLC neighborhood borders circumscribed communities in modern-day Allegheny County pervaded by racialized access to healthy environments and wealth accumulation (7–10, 15). Specifically, centroid-based neighborhood analysis demonstrated a diffusion of historical/HOLC redlining-associated socioenvironmental effects as the distance from grade D neighborhoods borders increased (Figure E6, Table E2). Our data suggest that preventing loans to people in grade D neighborhoods limited residential and nontoxic development and instead promoted continued or increased industrial/commercial development. Considering the age of the study population, historical/HOLC redlining could have both inter- and transgenerational epigenetic consequences that could have differentially increased severe asthma risk of the current registry participants (38, 39). Mechanisms could include increasing in utero/early-life environmental toxicant exposure during critical pregnancy windows of the original/subsequent generation subjected to HOLC mortgage discrimination and/or influencing personal SES and wealth acquisition for three or four preceding generations (40, 41). Although SES does not robustly contribute to regional differences in pulmonary function, low SES could constrain neighborhood choice, creating barriers to pollution avoidance over several generations (42). Alternatively, racist covenants could have similarly posed residential restrictions for families (8, 17). Local sociopolitical factors could further create contemporary pollution hotspots within historically redlined neighborhoods, reinforcing racial pollution inequity (4, 5, 7–9, 11–13).
On the one hand, SES could modify healthcare access through barriers related to geographic accessibility, affordability, and work absences/sick leave (among other factors), subsequently contributing to poor asthma control (6, 27). Our data, on the other hand, suggest that registry participants in grade D neighborhoods, especially Black registry participants, receive lower asthma-related healthcare quality after accessing health care. This is demonstrated by less evidence for severity-related up-titration of medications and also less opportunity for advanced care after referral, which may reflect interpersonal bias between asthma providers and patients (43, 44). Considering the high proportion of grade D neighborhood registry participants with Medicaid coverage, which traditionally confers easy access to specialty health care, the differences in the experienced asthma-related care in grade D neighborhoods raise alarm.
Although biological and psychosocial/psychological stressors could lead to the worsened asthma-related outcomes through poorly understood mechanisms among Black adults, one must distinguish stress resulting from racism, including generations of racial housing/mortgage discrimination, from traditionally pathologized forms of stress (45). Conflating these promotes racial gaslighting, normalizes racism, and likens racism to a challenge that one should be able to overcome in an empowering or positive way, rather than attempting to reverse the actual structural cause of the stress, as one would with other environmental sources.
Our data support a substantial contribution from higher exposures to pollution to worsened asthma-related outcomes, which could drive inter- or transgenerational epigenetic effects (related to racism-associated environmental inequities) rather than genetic effects on pulmonary function (38, 46). Reversibility, a marker of asthma not traditionally subjected to race normalization, also increased according to HOLC grade for mortgage discrimination in association with poor air quality. This supports environmental effects on pulmonary function due to institutional racism as compared with race-based effects. Importantly, social norms and contexts inform racial categories, which exhibit dynamism and lack true biological meaning (47, 48).
Current guidelines encourage using GLI equations for spirometric normalization by race or “race norming” (26, 49). However, there is increasing realization that race norming is inappropriate. For example, the equations used for Black individuals are derived exclusively from U.S. Black/African American individuals and poorly model expected pulmonary function in non-U.S. African populations (26, 50, 51). Furthermore, these equations are based on the assumption that Black people have pulmonary function different from that of age-, height-, and sex-matched White people. Thus, using population-based race-norming spirometric volumes continues to uphold medical racism. When applied to interpretation of threshold values, these equations still accentuate racial health inequity due to underdiagnosis and undertreatment, potentially restricting access to medical resources amongst Black but not White patients and perhaps partially explaining the lack of up-titration of treatment/specialist care observed in this study (47, 48). Finally, race norming continues to ascribe biological value to race using pseudoscientific and nonoperational criteria, obfuscating the contribution of racism and related environmental inequities to lung health. In fact, nonnormalized data are now reported to better represent clinical disease than race-normalized values, supporting the use of age, height, and sex alone for spirometric normalization (52–54). Asthma investigators, clinicians, and health officials should consider alternative methodologies, such as a lower limit of normal obtained from population/race-unadjusted quintiles or eliminating race-based normalization.
Additional implementable action items emerge from these data, which link both environmental and health inequities to overarching generations of institutional racism. Micro-level interventions to address these inequities, which ignore the macro-level etiology, are not likely to improve outcomes. Societal reparations to Black communities, which close wealth gaps, reallocate environmental autonomy, and remediate pollution sources, could have greater impact, improving lung volumes through rising living standards over multiple generations, as has been reported previously (55, 56). Clinical efforts to enhance and diversify referrals to asthma specialists, prioritize community needs, engage in antiracism, and eliminate race-based inequity in asthma treatment could further improve outcomes.
Limitations
Our study has some limitations, including the lack of residential history and information on social capital, transportation and mobility challenges, and exposure to violence (interpersonal, state sanctioned/police) (27, 57–59). However, Allegheny County, uniquely compared with other metropolitan areas, has had low population mobility and a regional topography rendering neighborhoods geographically distinct (10, 60). In addition, despite the Rust Belt nature of Pittsburgh, the majority of the people in the registry reported no additional exposure to occupational threats, strengthening the general environmental impact of residential pollution exposure on asthma that we observed. Despite small sample sizes for Black registry participants in grade A neighborhoods as well as the total number of participants included in the preplanned stratified analysis, our sampling has a distribution similar to the corresponding area in Allegheny County. Air pollution travels across distance, and emission measurements may not reflect individual exposures. Finally, as with any observational study, we cannot draw causal conclusions. However, our study design allowed matching of geographic/residential information with individual-level matching clinical/physiologic data, generally superior to previous, contextually limited ecological studies.
Conclusion
In conclusion, we provide strong evidence that historical HOLC grade D neighborhood boundaries demarcate communities scarred by institutional racism, including persistently poor air quality and the worst asthma. Recognizing the overarching impact of these racism-based effects on worsening health outcomes should lead to better ways to improve them.
Footnotes
Supported by the NIH (National Institute of Allergy and Infectious Diseases grant R01 AI145406-02, National Institute of Environmental Health Sciences grant F30 ES033557-01), the Dellenback Fund, and the School of Public Health, University of Pittsburgh.
Author Contributions: Conception and design: A.J.S., S.E.W.; analysis and interpretation: A.J.S., S.E.W.; drafting the manuscript for important intellectual content: A.J.S., S.E.W.
This article has an online supplement, which is accessible from this issue’s table of contents at www.atsjournals.org.
Originally Published in Press as DOI: 10.1164/rccm.202112-2707OC on May 25, 2022
Author disclosures are available with the text of this article at www.atsjournals.org.
References
- 1. Pennington E, Yaqoob ZJ, Al-Kindi SG, Zein J. Trends in asthma mortality in the United States: 1999 to 2015. Am J Respir Crit Care Med . 2019;199:1575–1577. doi: 10.1164/rccm.201810-1844LE. [DOI] [PMC free article] [PubMed] [Google Scholar]
- 2. Bell ML, Ebisu K. Environmental inequality in exposures to airborne particulate matter components in the United States. Environ Health Perspect . 2012;120:1699–1704. doi: 10.1289/ehp.1205201. [DOI] [PMC free article] [PubMed] [Google Scholar]
- 3.Fleischman L, Franklin M.2017.
- 4. Tessum CW, Apte JS, Goodkind AL, Muller NZ, Mullins KA, Paolella DA, et al. Inequity in consumption of goods and services adds to racial-ethnic disparities in air pollution exposure. Proc Natl Acad Sci USA . 2019;116:6001–6006. doi: 10.1073/pnas.1818859116. [DOI] [PMC free article] [PubMed] [Google Scholar]
- 5.United Church of Christ. 1987.
- 6. Williams DR, Collins C. Racial residential segregation: a fundamental cause of racial disparities in health. Public Health Rep . 2001;116:404–416. doi: 10.1093/phr/116.5.404. [DOI] [PMC free article] [PubMed] [Google Scholar]
- 7.Taylor DE. Toxic communities: environmental racism, industrial pollution, and residential mobility. New York, NY: New York University Press; 2014. [Google Scholar]
- 8.Rothstein R. The color of law: a forgotten history of how our government segregated America. New York, NY: Liveright Publishing; 2017. [Google Scholar]
- 9. Grove M, Ogden L, Pickett S, Boone C, Buckley G, Locke DH, et al. The legacy effect: understanding how segregation and environmental injustice unfold over time in Baltimore. Ann Am Assoc Geogr . 2018;108:524–537. [Google Scholar]
- 10. Rutan DQ, Glass MR. The lingering effects of neighborhood appraisal: evaluating redlining’s legacy in Pittsburgh. Prof Geogr . 2018;70:339–349. [Google Scholar]
- 11. Retzlaff R. Interstate highways and the civil rights movement: the case of I-85 and the Oak Park neighborhood in Montgomery, Alabama. J Urban Aff . 2019;41:930–959. [Google Scholar]
- 12.Taylor K-Y. Race for profit: how banks and the real estate industry undermined black homeownership. Chapel Hill, NC: University of North Carolina Press; 2019. [Google Scholar]
- 13. Yi H, Kreuter UP, Han D, Güneralp B. Social segregation of ecosystem services delivery in the San Antonio region, Texas, through 2050. Sci Total Environ . 2019;667:234–247. doi: 10.1016/j.scitotenv.2019.02.130. [DOI] [PubMed] [Google Scholar]
- 14. Hoffman JS, Shandas V, Pendleton N. The effects of historical housing policies on resident exposure to intra-urban heat: a study of 108 US urban areas. Climate (Basel) . 2020;8:12. [Google Scholar]
- 15. Namin S, Xu W, Zhou Y, Beyer K. The legacy of the Home Owners’ Loan Corporation and the political ecology of urban trees and air pollution in the United States. Soc Sci Med . 2020;246:112758. doi: 10.1016/j.socscimed.2019.112758. [DOI] [PubMed] [Google Scholar]
- 16. Nardone A, Casey JA, Morello-Frosch R, Mujahid M, Balmes JR, Thakur N. Associations between historical residential redlining and current age-adjusted rates of emergency department visits due to asthma across eight cities in California: an ecological study. Lancet Planet Health . 2020;4:e24–e31. doi: 10.1016/S2542-5196(19)30241-4. [DOI] [PMC free article] [PubMed] [Google Scholar]
- 17. Ware L. Plessy’s legacy: the government’s role in the development and perpetuation of segregated neighborhoods. RSF . 2021;7:92–109. [Google Scholar]
- 18.Nelson RK, Winling L, Marciano R, Connolly N, Ayers EL, et al. https://dsl.richmond.edu/panorama/redlining/
- 19. Krieger N, Wright E, Chen JT, Waterman PD, Huntley ER, Arcaya M. Cancer stage at diagnosis, historical redlining, and current neighborhood characteristics: breast, cervical, lung, and colorectal cancers, Massachusetts, 2001–2015. Am J Epidemiol . 2020;189:1065–1075. doi: 10.1093/aje/kwaa045. [DOI] [PMC free article] [PubMed] [Google Scholar]
- 20. Diaz A, O’Reggio R, Norman M, Thumma JR, Dimick JB, Ibrahim AM. Association of historic housing policy, modern day neighborhood deprivation and outcomes after inpatient hospitalization. Ann Surg . 2021;274:985–991. doi: 10.1097/SLA.0000000000005195. [DOI] [PubMed] [Google Scholar]
- 21. Li M, Yuan F. Historical redlining and resident exposure to COVID-19: a study of New York City. Race Soc Probl . 2022;14:85–100. doi: 10.1007/s12552-021-09338-z. [DOI] [PMC free article] [PubMed] [Google Scholar]
- 22. Mujahid MS, Gao X, Tabb LP, Morris C, Lewis TT. Historical redlining and cardiovascular health: the Multi-Ethnic Study of Atherosclerosis. Proc Natl Acad Sci USA . 2021;118:e2110986118. doi: 10.1073/pnas.2110986118. [DOI] [PMC free article] [PubMed] [Google Scholar]
- 23. Lee EK, Donley G, Ciesielski TH, Gill I, Yamoah O, Roche A, et al. Health outcomes in redlined versus non-redlined neighborhoods: a systematic review and meta-analysis. Soc Sci Med . 2022;294:114696. doi: 10.1016/j.socscimed.2021.114696. [DOI] [PubMed] [Google Scholar]
- 24.U.S. Evironmental Protection Agency. https://www.epa.gov/air-emissions-inventories/national-emissions-inventory-nei [PubMed]
- 25.Global Initiative for Asthma (GINA) 2019.
- 26. Quanjer PH, Stanojevic S, Cole TJ, Baur X, Hall GL, Culver BH, et al. ERS Global Lung Function Initiative Multi-ethnic reference values for spirometry for the 3–95-yr age range: the global lung function 2012 equations. Eur Respir J . 2012;40:1324–1343. doi: 10.1183/09031936.00080312. [DOI] [PMC free article] [PubMed] [Google Scholar]
- 27. Hoffmann RL, Rohrer WM, III, South-Paul JE, Burdett R, Watzlaf VJ. The effects of barriers on health related quality of life (HRQL) and compliance in adult asthmatics who are followed in an urban community health care facility. J Community Health . 2008;33:374–383. doi: 10.1007/s10900-008-9108-6. [DOI] [PubMed] [Google Scholar]
- 28. Fitzpatrick AM, Gillespie SE, Mauger DT, Phillips BR, Bleecker ER, Israel E, et al. Racial disparities in asthma-related health care use in the National Heart, Lung, and Blood Institute’s Severe Asthma Research Program. J Allergy Clin Immunol . 2019;143:2052–2061. doi: 10.1016/j.jaci.2018.11.022. [DOI] [PMC free article] [PubMed] [Google Scholar]
- 29. Huss-Marp J, Eberlein-König B, Breuer K, Mair S, Ansel A, Darsow U, et al. Influence of short-term exposure to airborne Der p 1 and volatile organic compounds on skin barrier function and dermal blood flow in patients with atopic eczema and healthy individuals. Clin Exp Allergy . 2006;36:338–345. doi: 10.1111/j.1365-2222.2006.02448.x. [DOI] [PubMed] [Google Scholar]
- 30. Bleck B, Tse DB, Curotto de Lafaille MA, Zhang F, Reibman J. Diesel exhaust particle-exposed human bronchial epithelial cells induce dendritic cell maturation and polarization via thymic stromal lymphopoietin. J Clin Immunol . 2008;28:147–156. doi: 10.1007/s10875-007-9149-0. [DOI] [PMC free article] [PubMed] [Google Scholar]
- 31. Noah TL, Zhou H, Zhang H, Horvath K, Robinette C, Kesic M, et al. Diesel exhaust exposure and nasal response to attenuated influenza in normal and allergic volunteers. Am J Respir Crit Care Med . 2012;185:179–185. doi: 10.1164/rccm.201103-0465OC. [DOI] [PMC free article] [PubMed] [Google Scholar]
- 32. Bowatte G, Lodge CJ, Knibbs LD, Lowe AJ, Erbas B, Dennekamp M, et al. Traffic-related air pollution exposure is associated with allergic sensitization, asthma, and poor lung function in middle age. J Allergy Clin Immunol . 2017;139:122–129.e1. doi: 10.1016/j.jaci.2016.05.008. [DOI] [PubMed] [Google Scholar]
- 33. Montgomery MT, Sajuthi SP, Cho SH, Everman JL, Rios CL, Goldfarbmuren KC, et al. Genome-wide analysis reveals mucociliary remodeling of the nasal airway epithelium induced by urban PM2.5. Am J Respir Cell Mol Biol . 2020;63:172–184. doi: 10.1165/rcmb.2019-0454OC. [DOI] [PMC free article] [PubMed] [Google Scholar]
- 34. Corteselli EM, Gold A, Surratt J, Cui T, Bromberg P, Dailey L, et al. Supplementation with omega-3 fatty acids potentiates oxidative stress in human airway epithelial cells exposed to ozone. Environ Res . 2020;187:109627. doi: 10.1016/j.envres.2020.109627. [DOI] [PMC free article] [PubMed] [Google Scholar]
- 35. Montnemery P, Nihlén U, Göran Löfdahl C, Nyberg P, Svensson A. Prevalence of self-reported eczema in relation to living environment, socio-economic status and respiratory symptoms assessed in a questionnaire study. BMC Dermatol . 2003;3:4. doi: 10.1186/1471-5945-3-4. [DOI] [PMC free article] [PubMed] [Google Scholar]
- 36. Boos AC, Hagl B, Schlesinger A, Halm BE, Ballenberger N, Pinarci M, et al. Atopic dermatitis, STAT3- and DOCK8-hyper-IgE syndromes differ in IgE-based sensitization pattern. Allergy . 2014;69:943–953. doi: 10.1111/all.12416. [DOI] [PubMed] [Google Scholar]
- 37. Gamble C, Talbott E, Youk A, Holguin F, Pitt B, Silveira L, et al. Racial differences in biologic predictors of severe asthma: data from the Severe Asthma Research Program. J Allergy Clin Immunol . 2010;126:1149–56.e1. doi: 10.1016/j.jaci.2010.08.049. [DOI] [PMC free article] [PubMed] [Google Scholar]
- 38. Gregory DJ, Kobzik L, Yang Z, McGuire CC, Fedulov AV. Transgenerational transmission of asthma risk after exposure to environmental particles during pregnancy. Am J Physiol Lung Cell Mol Physiol . 2017;313:L395–L405. doi: 10.1152/ajplung.00035.2017. [DOI] [PMC free article] [PubMed] [Google Scholar]
- 39. Lodge CJ, Bråbäck L, Lowe AJ, Dharmage SC, Olsson D, Forsberg B. Grandmaternal smoking increases asthma risk in grandchildren: a nationwide Swedish cohort. Clin Exp Allergy . 2018;48:167–174. doi: 10.1111/cea.13031. [DOI] [PubMed] [Google Scholar]
- 40. Sternthal MJ, Coull BA, Chiu YH, Cohen S, Wright RJ. Associations among maternal childhood socioeconomic status, cord blood IgE levels, and repeated wheeze in urban children. J Allergy Clin Immunol . 2011;128:337–45.e1. doi: 10.1016/j.jaci.2011.05.008. [DOI] [PMC free article] [PubMed] [Google Scholar]
- 41. Hsu H-HL, Chiu Y-HM, Coull BA, Kloog I, Schwartz J, Lee A, et al. Prenatal particulate air pollution and asthma onset in urban children. Identifying sensitive windows and sex differences. Am J Respir Crit Care Med . 2015;192:1052–1059. doi: 10.1164/rccm.201504-0658OC. [DOI] [PMC free article] [PubMed] [Google Scholar]
- 42. Duong M, Islam S, Rangarajan S, Teo K, O’Byrne PM, Schünemann HJ, et al. PURE-BREATH Study Investigators Global differences in lung function by region (PURE): an international, community-based prospective study. Lancet Respir Med . 2013;1:599–609. doi: 10.1016/S2213-2600(13)70164-4. [DOI] [PubMed] [Google Scholar]
- 43. Okelo SO, Wu AW, Merriman B, Krishnan JA, Diette GB. Are physician estimates of asthma severity less accurate in black than in white patients? J Gen Intern Med . 2007;22:976–981. doi: 10.1007/s11606-007-0209-1. [DOI] [PMC free article] [PubMed] [Google Scholar]
- 44. Johnson SB, Gordon BJ, Jennings JM, Bair-Merritt MH, Adler NE, Okelo SO. Pediatric pulmonologists’ perceptions of family socioeconomic status in asthma care. Pediatr Allergy Immunol Pulmonol . 2014;27:120–125. doi: 10.1089/ped.2014.0357. [DOI] [PMC free article] [PubMed] [Google Scholar]
- 45. Pieterse AL, Carter RT. An examination of the relationship between general life stress, racism-related stress, and psychological health among black men. J Couns Psychol . 2007;54:101–109. [Google Scholar]
- 46. Accordini S, Calciano L, Johannessen A, Benediktsdóttir B, Bertelsen RJ, Bråbäck L, et al. Prenatal and prepubertal exposures to tobacco smoke in men may cause lower lung function in future offspring: a three-generation study using a causal modelling approach. Eur Respir J . 2021;58:2002791. doi: 10.1183/13993003.02791-2020. [DOI] [PMC free article] [PubMed] [Google Scholar]
- 47. Bhakta NR, Kaminsky DA, Bime C, Thakur N, Hall GL, McCormack MC, et al. Addressing race in pulmonary function testing by aligning intent and evidence with practice and perception. Chest . 2022;161:288–297. doi: 10.1016/j.chest.2021.08.053. [DOI] [PMC free article] [PubMed] [Google Scholar]
- 48. Ramsey NB, Apter AJ, Israel E, Louisias M, Noroski LM, Nyenhuis SM, et al. Deconstructing the way we use pulmonary function test race-based adjustments. J Allergy Clin Immunol Pract . 2022;10:972–978. doi: 10.1016/j.jaip.2022.01.023. [DOI] [PubMed] [Google Scholar]
- 49. Graham BL, Steenbruggen I, Miller MR, Barjaktarevic IZ, Cooper BG, Hall GL, et al. Standardization of spirometry 2019 update. An official American Thoracic Society and European Respiratory Society technical statement. Am J Respir Crit Care Med . 2019;200:e70–e88. doi: 10.1164/rccm.201908-1590ST. [DOI] [PMC free article] [PubMed] [Google Scholar]
- 50. Masekela R, Hall GL, Stanojevic S, Sartorius B, MacGinty R, Saad HB, et al. An urgent need for African spirometry reference equations: the Paediatric and Adult African Spirometry study. Int J Tuberc Lung Dis . 2019;23:952–958. doi: 10.5588/ijtld.18.0442. [DOI] [PubMed] [Google Scholar]
- 51. Smith S-J, Gray DM, MacGinty RP, Hall GL, Stanojevic S, Mphahlele R, et al. Choosing the better Global Lung Initiative 2012 equation in South African population groups. Am J Respir Crit Care Med . 2020;202:1724–1727. doi: 10.1164/rccm.202005-2085LE. [DOI] [PMC free article] [PubMed] [Google Scholar]
- 52. Baugh AD, Shiboski S, Hansel NN, Ortega V, Barjakteravic I, Barr RG, et al. Reconsidering the utility of race-specific lung function prediction equations. Am J Respir Crit Care Med . 2022;205:819–829. doi: 10.1164/rccm.202105-1246OC. [DOI] [PMC free article] [PubMed] [Google Scholar]
- 53. Elmaleh-Sachs A, Balte P, Oelsner EC, Allen NB, Baugh A, Bertoni AG, et al. Race/ethnicity, spirometry reference equations, and prediction of incident clinical events: the Multi-Ethnic Study of Atherosclerosis (MESA) Lung Study. Am J Respir Crit Care Med . 2022;205:700–710. doi: 10.1164/rccm.202107-1612OC. [DOI] [PMC free article] [PubMed] [Google Scholar]
- 54. McCormack MC, Balasubramanian A, Matsui EC, Peng RD, Wise RA, Keet CA. Race, lung function, and long-term mortality in the National Health and Nutrition Examination Survey III. Am J Respir Crit Care Med . 2022;205:723–724. doi: 10.1164/rccm.202104-0822LE. [DOI] [PubMed] [Google Scholar]
- 55. Coates T-N. The case for reparations. Atlantic . 2014 [Google Scholar]
- 56. Ip MSM, Karlberg EM, Karlberg JPE, Luk KDK, Leong JCY. Lung function reference values in Chinese children and adolescents in Hong Kong. I. Spirometric values and comparison with other populations. Am J Respir Crit Care Med . 2000;162:424–429. doi: 10.1164/ajrccm.162.2.9905057. [DOI] [PubMed] [Google Scholar]
- 57. Gupta RS, Zhang X, Sharp LK, Shannon JJ, Weiss KB. The protective effect of community factors on childhood asthma. J Allergy Clin Immunol . 2009;123:1297–304.e2. doi: 10.1016/j.jaci.2009.03.039. [DOI] [PMC free article] [PubMed] [Google Scholar]
- 58. Sewell AA, Jefferson KA. Collateral damage: the health effects of invasive police encounters in New York City. J Urban Health . 2016;93:42–67. doi: 10.1007/s11524-015-0016-7. [DOI] [PMC free article] [PubMed] [Google Scholar]
- 59. Wang E, Simmons B, Holm KE, Alam R, Wamboldt FS. Intimate partner violence and adult asthma morbidity: a population-based study. J Allergy Clin Immunol Pract . 2021;9:4300–4309.e7. doi: 10.1016/j.jaip.2021.06.023. [DOI] [PubMed] [Google Scholar]
- 60.Muller EK, Tarr JA, Collins TM, Coleman M, Houston D, Clay K, et al. Making industrial Pittsburgh modern: environment, landscape, transportation, and planning. Pittsburgh, PA: University of Pittsburgh Press; 2019. [Google Scholar]