Abstract
We propose a single-lead ECG-based heart rate variability (HRV) analysis algorithm to quantify autonomic nervous system activity during meditation. Respiratory sinus arrhythmia (RSA) induced by breathing is a dominant component of HRV, but its frequency depends on an individual’s breathing speed. To address this RSA issue, we designed a novel HRV tachogram decomposition algorithm and new HRV indices. The proposed method was validated by using a simulation, and applied to our experimental (mindfulness meditation) data and the WESAD open-source data. During meditation, our proposed HRV indices related to vagal and sympathetic tones were significantly increased (p < 0.000005) and decreased (p < 0.000005), respectively. These results were consistent with self-reports and experimental protocols, and identified parasympathetic activation and sympathetic inhibition during meditation. In conclusion, the proposed method successfully assessed autonomic nervous system activity during meditation when respiration influences disrupted classical HRV. The proposed method can be considered a reliable approach to quantify autonomic nervous system activity.
Subject terms: Biomarkers, Health care, Biomedical engineering
Introduction
Due to the increase in the number of mental disorders, various mental healthcare therapies (e.g., psychotherapy, digital therapeutics, and meditation) have been widely used to improve emotional wellness1. Over the past few decades, mindfulness meditation has drawn much attention because of its benefits, such as emotion regulation, increased awareness, and improved cognitive performance2–4, and it has been clinically used to reduce chronic pain, sleep disturbance, anxiety, distress, and depression5–7. Many neuroscientific studies have investigated changes in the brain during meditation2, and the activation of several brain regions, such as the frontopolar cortex, sensory cortex, insula, hippocampus, anterior cingulate cortex, mid-cingulate cortex, and orbitofrontal cortex, has been observed8. These brain regions are related to meta-awareness, body awareness, memory processes, and emotion regulation. In particular, the insular and mid-cingulate cortices play central roles in the central autonomic network, which controls the activity of parasympathetic and sympathetic nerves9. Through this neurological pathway, it seems that body relaxation is induced during meditation.
As a technology-based therapy, biofeedback via a wearable device has been developed10. Biofeedback devices help users carry out a therapeutic protocol (e.g., meditation) by means of their physiological signals as feedback. Electroencephalogram-based neurofeedback training is a representative biofeedback therapy that is used to treat various mental disorders, such as insomnia, anxiety, depression, and addiction11. On the other hand, electroencephalogram-based digital meditation was proposed to enhance attention and working memory12,13. Although neurofeedback treatment shows various clinical effects, an electroencephalogram sensor is inconvenient. Recently, a new modality called skin sympathetic nerve activity has been developed to noninvasively observe the activity of sympathetic nerves14,15. It can be simply recorded from the high frequency component (500–1000 Hz) of an analog electrocardiogram (ECG), but it is very vulnerable to motion artifacts due to its weak amplitude16,17. Because it is easy to measure ECG signals with a high signal-to-noise ratio in daily life, heart rate variability (HRV)-based biofeedback training is drawing attention18,19. In this study, we propose a single-lead ECG-based HRV analysis algorithm to investigate the changes in vagal and sympathetic tones during meditation (see Fig. 1).
Figure 1.
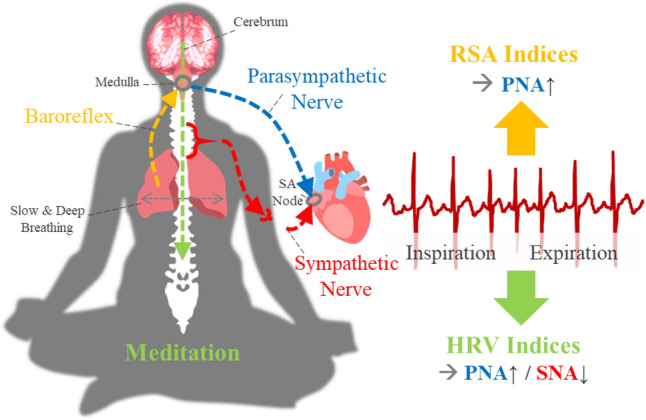
Meditation and single-lead ECG.
ECG based cardiopulmonary coupling analysis and HRV analysis have been used to assess psychiatric conditions. Cardiopulmonary coupling analysis measures the synchronization between the heartbeat interval and respiration by using the spectral coherence, cross entropy and phase locking value (PLV)20–22. This synchronization phenomenon is called respiratory sinus arrhythmia (RSA), which is the modulation of efferent parasympathetic nerves caused by baroreflexes (arterial baroreflex, lung stretch reflex, and Bainbridge reflex) during the inspiration phase23–26. RSA is affected by the tidal volume and respiratory rate (RR)27–29, and its quantity reflects sleep quality and apnea20,22. To capture other neurophysiological changes, HRV is widely used, and its frequency analysis reflects the balance between vagal and sympathetic tones. The former shows a fast response, and the latter dominates the low-frequency band of HRV and seems to be independent of the baroreflex30.
Meditation (or relaxation) training leads to parasympathetic activation and sympathetic inhibition, and it is supported by several modalities, such as muscle sympathetic nerve activity31, functional MRI2, and electroencephalogram32. Some HRV studies on meditation also reported an increase in high-frequency power32–35, which indicates vagal tone, but other studies showed the opposite results36–40. These contradictory results seem to be due to the influence of RSA. When the RR < 0.15 Hz, the RSA component moves from the high- to low-frequency region, and then the low- and high-frequency powers can be overestimated and underestimated, respectively28. Hence, the fluctuation of an individual’s RR led to significant variation in HRV analysis41, and there was no report on the identification of cardiac sympathetic inhibition during meditation.
To separate the RSA effect and other autonomic nervous system activities in HRV analysis, various decomposition algorithms have been utilized, such as independent component analysis42, adaptive noise cancellers43, autoregressive moving average with exogenous input model (ARMAx)44, and orthogonal subspace projection (OSP)45,46. The adaptive noise canceller, ARMAx, and OSP share the same algorithmic structure, with OSP exhibiting the best performance45. Even though these algorithms significantly enhance the reliability of HRV, they assume a linear relationship between the RSA component and a respiration signal, while in reality the relationship is nonlinear47. As an alternative, a notch filter with a Gaussian bell shape (Gauss) was employed, but it assumed that the instantaneous RR is constant48. In this study, to overcome the nonlinearity and nonstationarity of RSA, we proposed a novel HRV tachogram decomposition algorithm, and new HRV indices to quantify vagal and sympathetic tones during meditation (see Fig. 2).
Figure 2.

Overall structure of the proposed method.
The proposed method is described in the “Materials and methods” section. We compared the performance of decomposition algorithms using simulation, and observed the changes in the vagal and sympathetic tones during meditation through real ECG data in “Results” section. In “Discussion” section, the results are discussed.
Materials and methods
Since HRV reflects the balance of the autonomic nervous system, HRV analysis is frequently used to assess stress and psychiatric conditions. The first step of HRV analysis is QRS detection on the ECG. In this study, we bandpass filtered an ECG with 0.5–50 Hz by a 3rd-order Butterworth, and we employed the Pan-Tompkins algorithm to detect R-peaks of the ECG49. The interval between successive R-peaks (RRI) is accumulated over a predefined time window. In this study, we adopted a 5 min time window for short-term HRV analysis. To detect ectopic beats and incorrect peaks, we calculated the k-th derivative of the instantaneous heart rate (HR)50 as follows:
| 1 |
where Rk is the k-th R-peak. When an HR’k was greater than a predefined threshold, Rk was excluded from the HRV analysis, and the corrected R-peaks were double-checked by human experts. Because the RRI is sampled at irregular time points (heartbeats), the RRI must be converted into an evenly sampled time series for frequency analysis. A uniformly sampled signal of the RRI, called a tachogram, was reconstructed using cubic spline interpolation, and we resampled the tachogram to 4 Hz, as in previous studies44–46. For precise HRV analysis, it is necessary to distinguish the cardiac vagal tone modulated by respiration and other autonomic nervous system activities. Hence, we consider the original tachogram xRAW as follows:
| 2 |
where xRSA and xR-f are the RSA and RSA-free tachograms, respectively. xR-f is obtained by removing xRSA from xRAW. The tachogram decomposition algorithm will be described in the next subsection. In this study, since we focus on the tachogram decomposition algorithm, we adopt only frequency domain HRV indices.
ECG-derived respiration
To measure the respiration signal, various sensors have been utilized, such as a pressure transducer and a thermistor. These sensors provide accurate information but are both expensive and inconvenient to wear. As an alternative, several algorithms to estimate the respiration signal from biomedical signals, such as photoplethysmogram and ECG, have been proposed51–54. In this study, we employed an ECG-derived respiration (EDR) algorithm that captures the change in electrical impedance and the cardiac vector according to chest expansion. Here, we briefly review 4 frequently used EDR algorithms: EDRA (R-wave amplitude), EDRQR (Q-R slope), EDRRS (R-S slope) and EDRSR (slope range). Each EDR algorithm uses a respiration-related sample r(i) at the i-th heartbeat as follows:
EDRA: rA(i) = R-peak amplitude
EDRQR: rQR(i) = steepest ascent slope on Q-R wave
EDRRS: rRS(i) = steepest descent slope on R-S wave
EDRSR: rSR(i) = rQR(i) − rRS(i)
By interpolating the respiration-related samples, the EDR signal is generated. The overall procedure is explained in detail in51.
Tachogram decomposition
Previous algorithms
To decompose raw tachogram xRAW into xRSA and xR-f, various algorithms have been proposed, such as Gauss, ARMAx and OSP. Both the ARMAx and OSP algorithms assume xRSA as follows:
| 3 |
where RESP is a respiratory basis matrix. The trajectory matrix46 or wavelet coefficients45 of EDR have been utilized as the RESP matrix. In this study, the trajectory matrix was employed for the RESP. We assigned 3 s to the lag size of the trajectory matrix of the ARMAx, while the lag size of OSP was set to the minimum value between the minimum description length and the Akaike information criterion, with a maximum lag of 10 s. The RSA-free tachogram is estimated as follows:
| 4 |
The ARMAx and the OSP are described in44–46 in detail. As another tachogram decomposition algorithm, a notch filter with Gaussian bell shape (Gauss) was proposed. Its magnitude-squared frequency response is:
| 5 |
where θ represents the notch frequency and corresponds to the average RR. α and β are fitting parameters and it can be computed from the spectrum of xRAW by using a least square method. The filtered signal will be , and is acquired by subtracting from xRAW. The overall procedure of Gauss is described in48.
Proposed algorithm
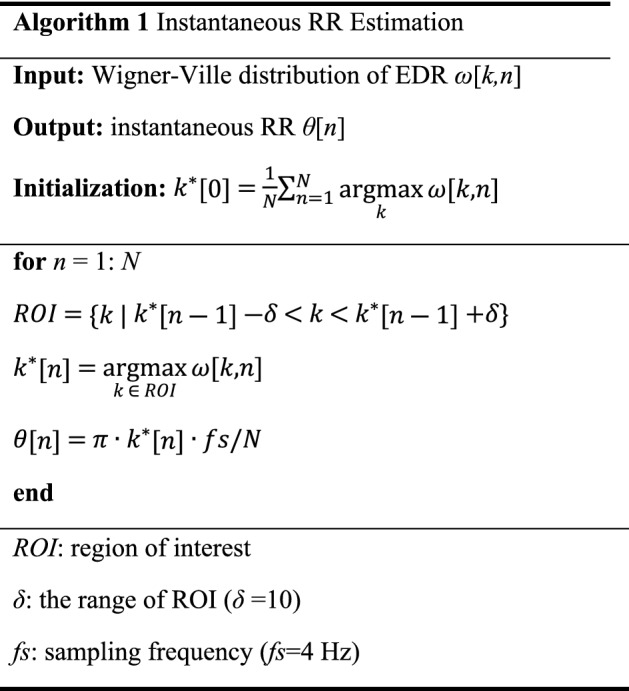
Based on the synchronization between the frequency of xRSA and the instantaneous RR, we designed a novel tachogram decomposition algorithm. Because it has a zero-phase response, we call it the zero-phase line enhancer (ZLE). The ZLE can be interpreted as an adaptive filter without phase distortion55. As shown in Fig. 3, the ZLE has two parts: (a) instantaneous RR estimation and (b) time-variant forward–backward IIR notch filtering. To estimate the instantaneous RR, we employed a smoothed pseudo Wigner–Ville distribution of the EDR signal56,57 as follows:
| 6 |
where N represents the length of the EDR (N = 5 min∙60∙4 Hz). g[] and v[] are the time and frequency windows, respectively; a Kaiser window (γ = 20) was employed for g[] and v[]. From the time–frequency representation ω[k, n], we estimated the instantaneous RR θ[n] by using a recursive algorithm to minimize the problem of outliers. The maximum point among frequency bins adjacent to θ[n-1] was assigned to θ[n], as described in Algorithm 1.
Figure 3.
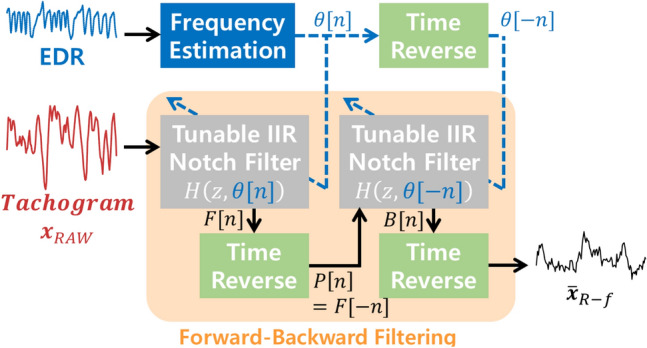
Tachogram decomposition process of ZLE. The ZLE is composed of (a) instantaneous RR θ[n] estimation and (b) time-variant forward–backward IIR notch filtering.
The frequency component of xRAW corresponding to the instantaneous RR θ[n] will be xRSA, and the ZLE removes xRSA by means of a tunable IIR notch filter58 as follows:
| 7 |
where r is the pole-zero contraction factor, which determines the stop band. When r is closer to 1, the frequency response of the notch filter becomes narrower. We set r to 0.93, and then the stop band of H(z, θ[n]) is 0.047 Hz. As shown in Fig. 3, the time-variant forward–backward IIR notch filtering performs four sequential steps: 1—forward IIR notch filtering, 2—time reversal, 3—backward IIR notch filtering, and 4—time reversal. The zero-phase response can be explained in the z-domain as follows:
| 8 |
| 9 |
| 10 |
| 11 |
where F(z) and B(z) mean forward- and backward-filtered signals, respectively. P(z) represents the time-reversed F(z). The filter output is the estimated RSA-free tachogram , and the RSA tachogram is estimated as follows:
| 12 |
RSA indices
RSA has been utilized as a measure of cardiac vagal function. RSA can be quantified by cardiopulmonary coupling analysis. In this study, we utilized the PLV22,39,59. The PLV is broadly used to measure a phase interaction between two signals and is defined as follows:
| 13 |
where φ1(n) and φ2(n) represent the phases of the respiration signal (or EDR) and tachogram xRAW, respectively. The phases are calculated by a Hilbert transform. As another measure for RSA, the extent of RSA (RSAE)27,39,60 was calculated by the median value of RRI variation (longest RRI—shortest RRI) within each breathing cycle as follows:
| 14 |
| 15 |
where RRIk represents the subset of RRIs within the k-th breathing cycle. max and min are maximum and minimum functions, respectively. K indicates the number of breaths taken in the time window (5 min). Because RSAE is based on the RRI, the unit of RSAE is ms.
HRV indices
In HRV analysis, the power spectrum of xRAW is segmented into low-frequency (0.04–0.15 Hz) and high-frequency (0.15–0.4 Hz) bands, and each band power is called LF (low frequency) and HF (high frequency)61. HF is regarded as an index for vagal tone, and LF reflects both sympathetic and vagal tones. To quantify sympathetic tone, LF/HF is generally used. Since these HRV indices were insufficient to cover the aforementioned RSA issue, it is necessary to simultaneously use both power spectra of and ; Subscripts R-f and RSA were used to distinguish each band power (: LFR-f and HFR-f, : LFRSA and HFRSA). To assess sympathovagal balance, Varon et al. designed an HRV index SBU based on the separated band powers46 as follows:
| 16 |
Since xRSA and HFR-f purely indicate vagal tone but LFR-f is related to both vagal and sympathetic tones, we proposed the new HRV indices related to vagal (Eq. 17) and sympathetic (Eq. 18) tones as follows:
| 17 |
| 18 |
We employed Welch’s method to compute the power spectra.
Simulation
To compare the tachogram decomposition algorithms, we designed a simulated tachogram . First, to cover various situations, we considered three respiration types as follows:
| 19 |
| 20 |
where , the derivative of , means the simulated RR. ①, ②, and ③ represent the frequencies of a sine wave (0.15 Hz), linear chirp (0.04–0.4 Hz), and sinusoidal frequency modulated signal (0.04–0.4 Hz). Since not only the frequency but also the amplitude of the tachogram is modulated by RR27–29, we devised an amplitude modulation function for the simulated RSA component . Specifically, because the amplitude of the tachogram with respect to RR in29 was skewed to the right, we utilized the gamma distribution function as the amplitude modulation function m() as follows:
| 21 |
| 22 |
where Г(α) is the gamma function. α and β are shape and rate parameters (α = 2, β = 15). Note that when is constant the amplitude modulation function m() becomes constant. On the other hand, as the simulated RSA-free tachogram R-f, we employed white Gaussian noise as follows:
| 23 |
where is the variance of the white Gaussian noise. We adjusted so that the power ratio of RSA and R-f was equal (0 dB), and then the simulated tachogram RAW was given by their summation.
| 24 |
For rigorous comparison, we performed Monte Carlo simulation with 1000 independent simulations.
Database
To investigate the changes in HRV indices according to the tachogram decomposition algorithms during meditation, we utilized two real ECG databases: mindfulness meditation data and WESAD data.
Mindfulness meditation data
We collected a single-lead ECG and a respiration signal from 8 male and 8 female subjects (age = 28.5 ± 4.2 years) during mindfulness meditation. All subjects were novice meditators who had engaged in meditation within 1–2 times. All subjects rested for 10 min and then performed mindfulness meditation for 40 min under the guidance of a meditation teacher. During mindfulness meditation, subjects were guided to maintain awareness of their breathing and sensations without judgment. Breathing speed was not restricted. All subjects closed their eyes and remained in a sitting position to minimize motion artifacts in the ECG. They completed a visual analog scale (VAS) for stress, tension, and concentration before and after mindfulness meditation. Each ECG was measured by a wearable ECG patch (EP200, Life Science Technology®, Seoul, Korea), and the sampling rate was 250 Hz. The reference respiration signal was recorded by a respiratory transducer (RSPEC-R, Biopac®, California, USA) with a sampling rate of 250 Hz. We used the reference respiration signal to evaluate EDR and measure vital signs and RSA indices, and we employed EDR for the tachogram decomposition algorithms. Informed consent was obtained from all subjects, and the institutional review board of the Korea Institute of Science and Technology (KIST) approved all procedures in this study (KIST-2019-015, July. 19, 2019). Informed consent was obtained from all participants prior to the experiment, and all experiments were conducted in strict accordance with KIST ethics guidelines and the declaration of Helsinki.
WESAD data
We used open-source data (WESAD, Wearable Stress and Affect Detection) to verify the proposed method in a public domain. This dataset contains the ECGs of 15 subjects (age = 27.5 ± 2.4 years), and its sampling rate is 700 Hz. The experimental protocol consisted of four different affective states (neutral, stress, amusement, meditation), and each emotion was mapped onto a two-dimensional affective space (arousal and valence) by using self-reports (SAM, Self-Assessment Manikins). The WESAD data are described in detail in62.
Statistical evaluation
Since the simulation was performed with white Gaussian noise, ANOVA and t tests were used to compare the tachogram decomposition algorithms. In the case of real data (mindfulness meditation and WESAD data), nonparametric statistical tests were utilized because the number of subjects was not large. Specifically, the Wilcoxon signed rank test was employed when the two groups had the same sample size, and the Mann–Whitney U test was used otherwise. We defined p < 0.000005 as statistically significant. To depict the distribution, we utilized a box plot where the top and bottom boxes represent the 75th and 25th percentiles, and the center, top, and bottom lines represent the 50th, 90th, and 10th percentiles, respectively.
Results
Simulation
For each simulation type (RR: constant, linear function, and sinusoidal function), we calculated the Pearson correlation coefficient and root mean square error (RMSE) between R-f and R-f of the tachogram decomposition algorithms (Gauss, ARMAx, OSP, and ZLE). Figure 4 depicts the box plots of correlation coefficients and RMSEs ((a): a sine wave, (b): linear chirp, and (c): sinusoidal frequency modulated signal). For each simulation type, we conducted one-way ANOVA with Bonferroni correction to compare four algorithms (Gauss, ARMAx, OSP, and ZLE), and significant differences (p < 0.000005) were observed in both the Pearson correlation coefficients and RMSEs for all simulation types. For pairwise comparisons, post hoc tests were performed by using paired t tests, and all algorithm comparisons showed significant differences (p < 0.000005). The OSP showed the lowest RMSE and highest correlation coefficient when the simulated RR was constant (see Fig. 4a), but the ZLE had the lowest RMSE and highest correlation coefficient for other RR types (see Fig. 4b,c). It is notable that ZLE was robust to the fluctuation of instantaneous RR but contrastively Gauss did not work well in time-varying RR.
Figure 4.
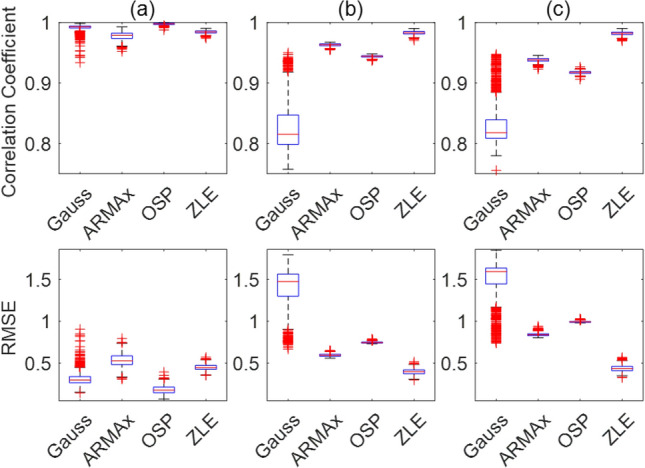
Correlation coefficient and RMSE between simulated and filtered (simulated RR: (a) constant, (b) linear function, and (c) sinusoidal function).
EDR evaluation
We evaluated the performance of the aforementioned EDRs (EDRA, EDRQR, EDRRS, and EDRSR) by using the reference respiration signal of the mindfulness meditation data. Because there was a phase difference between EDR and reference respiration signal, we utilized two measures that were not significantly affected by the phase difference. One is the PLV between each EDR and the reference respiration signal, and the other is the mean absolute error (MAE) between RRs calculated by each EDR and the reference respiration signal. The PLV and MAE reflect the similarity of phases and the accuracy of RR estimation, respectively. As shown in Table 1, EDRSR showed the best performance as in previous study51, so we employed EDRSR in the following analysis.
Table 1.
EDR evaluation.
| Meditation phase | EDRA | EDRQR | EDRRS | EDRSR |
|---|---|---|---|---|
| PLV | 0.7136 | 0.7389 | 0.7323 | 0.7410 |
| MAE (Hz) | 1.2927 | 0.8934 | 0.9700 | 0.8689 |
PLV and MAE between the reference respiration signal and each EDR (EDRA, EDRQR, EDRRS, and EDRSR). PLV and MAE indicate the phase synchronization and RR estimation error, respectively.
Mindfulness meditation data
Before applying the tachogram decomposition algorithms, we observed the effect of mindfulness meditation through various measures: VAS for stress, RSA indices, and vital signs. First, we confirmed the stress reduction after meditation through the VAS for stress (5.35 ± 1.77 → 2.47 ± 1.01). Second, we calculated the vital signs and RSA indices with 5 min intervals, and their box plots are depicted in Fig. 5. The horizontal lines represent the median values of the (a) HR, (b) RR, (c) RSAE, and (d) PLV. As meditation progressed, vital signs (HR and RR) decreased, and both the RSAE and PLV increased. To assess the changes in the HR, RR, RSAE and PLV, we performed statistical tests for these indices between the rest and meditation phases with the Mann–Whitney U test. Statistically significant differences (p < 0.000005) were observed in the instantaneous RR and RSAE. For each tachogram decomposition algorithm (ARMAx, OSP, and ZLE), we calculated Pearson correlation coefficients between xRAW and R-f, and their box plots and median values are shown in Fig. 6 (green boxes and dotted line: Gauss, blue boxes and dashed line: ARMAx, yellow boxes and dash dotted line: OSP, and red boxes and solid line: ZLE). A higher correlation coefficient indicates that R-f is less filtered or less distorted.
Figure 5.
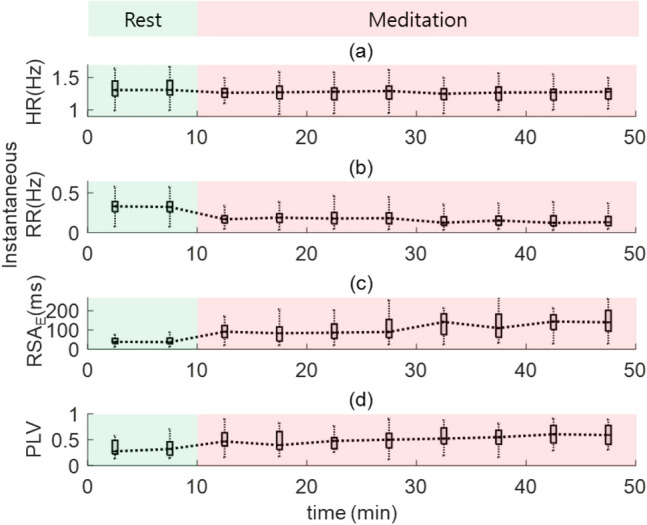
Vital signs (HR and RR) and RSA indices (RSAE and PLV) for mindfulness meditation. Box plots of (a) HR, (b) RR, (c) RSAE, and (d) PLV.
Figure 6.
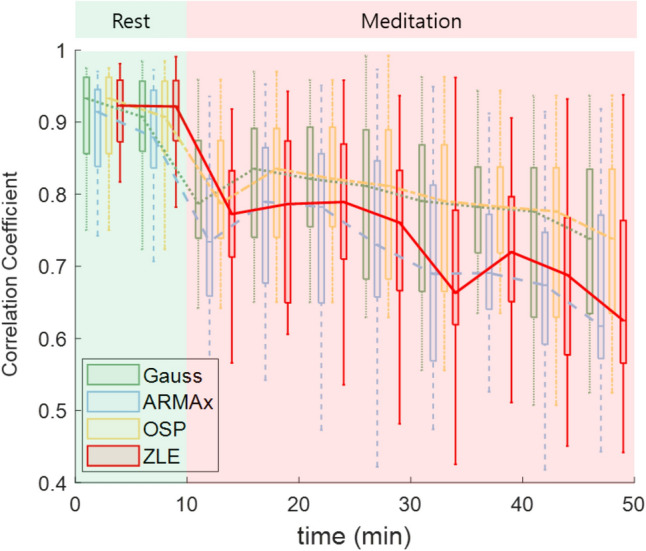
Correlation coefficient between raw tachogram (xRAW) and each RSA-free tachogram (R-f); R-f of Gauss (green boxes and dotted line); R-f of ARMAx (blue boxes and dashed line); R-f of OSP (yellow boxes and dash-dotted line); R-f of ZLE (red boxes and solid line).
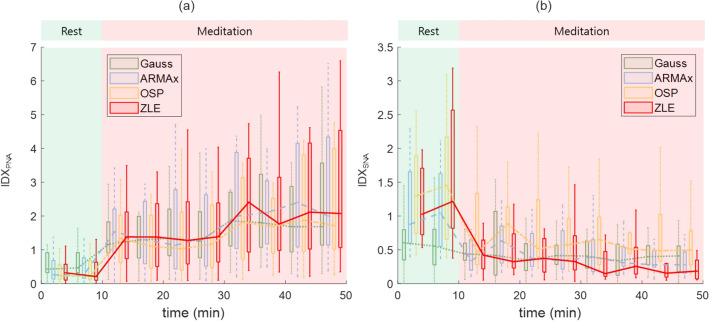
We computed the power spectra of tachograms and calculated HRV indices. Figure 7 shows the box plots and median values of the proposed HRV indices: (a) IDXPNA and (b) IDXSNA. The boxes and lines represent (a) IDXPNAs and (b) IDXSNAs of Gauss (green boxes and dotted line), ARMAx (blue boxes and dashed line), OSP (yellow boxes and dash-dotted line), and ZLE (red boxes and solid line). To assess the trend of the HRV indices, we divided each record (50 min) into 1 rest phase and 4 meditation phases of equal length (10 min) and then compared the rest and each meditation phase by using a Wilcoxon’s two-sample signed rank test (see Table 2). Table 2 depicts the mean and standard deviation of HRV indices. HF and IDXPNA are the HRV indices for vagal tone, and other indices (LF/HF, SBU and IDXSNA) indicate sympathetic tone. No statistically significant differences were observed in HFs, but all IDXPNAs of ZLE were significantly increased during meditation (p < 0.000005). Unlike ZLE, IDXPNAs of previous tachogram decomposition algorithms did not significantly decrease at 20–30 min. For the HRV indices related to sympathetic tone, the LF/HF of the raw tachogram (xRAW) significantly increased at 30–50 min, which seems to be caused by RSA, but all SBUs and IDXSNAs of ZLE were significantly diminished (see Fig. 7; Table 2). Although, after 40 min, all SBUs and IDXSNAs of all algorithms except for Gauss were significantly decreased, but no statistically significant differences were observed in most SBUs and IDXSNAs of previous tachogram decomposition algorithms (Gauss, ARMAx, and OSP).
Figure 7.
Changes in proposed HRV indices ((a): IDXPNA and (b): IDXSNA) during mindfulness meditation. Gauss (green boxes and dotted line); ARMAx (blue boxes and dashed line); OSP (yellow boxes and dash-dotted line); ZLE (red boxes and solid line).
Table 2.
Mean ± standard deviation of HRV indices (HF, IDXPNA, LF/HF, SBU, and IDXSNA).
| HRV index | Tachogram decomposition algorithm | Rest (baseline) | 10–20 min | 20–30 min | 30–40 min | 40–50 min |
|---|---|---|---|---|---|---|
| HF | – | 0.325 ± 0.356 | 0.453 ± 0.518 | 0.427 ± 0.465 | 0.456 ± 0.239 | 0.350 ± 0.351 |
| IDXPNA | Gauss | 0.572 ± 0.386 | 1.590 ± 1.266 | 1.741 ± 1.674 | 2.642 ± 2.795 | 2.479 ± 2.172 |
| ARMAx | 0.445 ± 0.400 | 1.718 ± 1.389 | 1.921 ± 1.960 | 2.825 ± 2.890 | 3.033 ± 2.718 | |
| OSP | 0.396 ± 0.376 | 1.498 ± 1.299 | 1.668 ± 1.797 | 2.368 ± 2.616 | 2.593 ± 2.540 | |
| ZLE | 0.392 ± 0.354 | 1.760 ± 1.567 | 1.866 ± 1.842 | 2.924 ± 3.229 | 3.056 ± 2.771 | |
| LF/HF | – | 2.793 ± 2.231 | 8.570 ± 12.101 | 9.234 ± 10.387 | 13.545 ± 10.691 | 17.384 ± 17.838 |
| SBU | Gauss | 1.850 ± 2.219 | 1.039 ± 0.994 | 0.864 ± 0.856 | 0.549 ± 0.450 | 0.629 ± 0.638 |
| ARMAx | 1.629 ± 1.315 | 0.675 ± 0.528 | 0.952 ± 1.736 | 0.609 ± 0.640 | 0.490 ± 0.490 | |
| OSP | 3.067 ± 5.087 | 1.230 ± 1.092 | 2.142 ± 5.996 | 1.476 ± 2.142 | 0.899 ± 0.866 | |
| ZLE | 4.016 ± 9.224 | 0.614 ± 0.481 | 0.626 ± 0.650 | 0.498 ± 0.704 | 0.402 ± 0.610 | |
| IDXSNA | Gauss | 0.611 ± 0.431 | 0.526 ± 0.409 | 0.454 ± 0.312 | 0.394 ± 0.276 | 0.433 ± 0.289 |
| ARMAx | 1.155 ± 0.778 | 0.559 ± 0.407 | 0.779 ± 1.375 | 0.515 ± 0.486 | 0.421 ± 0.369 | |
| OSP | 1.561 ± 1.233 | 0.874 ± 0.637 | 1.464 ± 3.729 | 1.027 ± 1.278 | 0.706 ± 0.618 | |
| ZLE | 1.745 ± 1.732 | 0.489 ± 0.332 | 0.497 ± 0.486 | 0.406 ± 0.506 | 0.336 ± 0.470 |
Bold text represents a statistically significant difference between rest and each meditation phase (p < 0.000005). HF and IDXPNA are the HRV indices for vagal tone, and other indices (LF/HF, SBU and IDXSNA) indicate sympathetic tone. In all meditation phases, all IDXPNAs of ZLE were significantly increased, and statistically significant decreases were observed in all SBUs and IDXSNAs of ZLE.
WESAD data
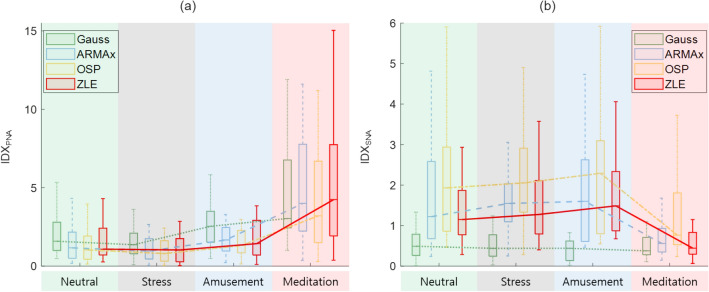
The WESAD data contains ECGs with 4 affective states: neutral, stress, amusement, and meditation. The SAM self-reports showed that the lowest arousal scores (2.3 ± 1.4) occurred in the meditation state. As shown in Fig. 8, the RSA indices (RSAE and PLV) and vital signs (HR and RR) had the highest and lowest values in the meditation state, respectively. For HR, RR, RSAE and PLV, we performed statistical tests between the neutral and meditation states by using Mann–Whitney U tests. Statistically significant differences (p < 0.000005) were observed in all comparisons except HR. This is similar to the results of the previous subsection. Figure 9 depicts the box plots and median values of the proposed HRV indices: (a) IDXPNA and (b) IDXSNA. The boxes and lines depict (a) IDXPNAs and (b) IDXSNAs of Gauss (green boxes and dotted line), ARMAx (blue boxes and dashed line), OSP (yellow boxes and dash-dotted line), and ZLE (red boxes and solid line). We evaluated the change between the neutral and other emotions of the HRV indices by using the Mann–Whitney U test. The mean and standard deviation of HRV indices are shown in Table 3. No statistically significant differences were observed in HFs, but IDXPNA of ARMAx and ZLE significantly increased during meditation, in parallel with the RSA indices. Similar to the results of the previous subsection, SBU and IDXSNA of the ZLE significantly (p < 0.000005) decreased during meditation, but no statistically significant differences were observed in SBU and IDXSNA of other decomposition algorithms (Gauss, ARMAx and OSP) as shown in Fig. 9 and Table 3.
Figure 8.
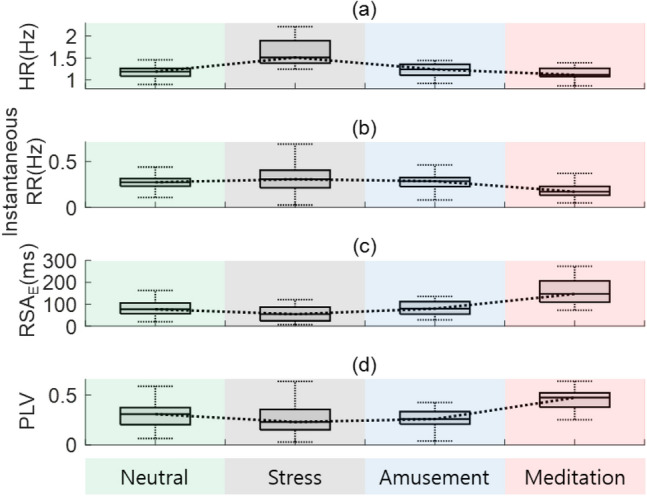
Vital signs (HR and RR) and RSA indices (RSAE and PLV) for 4 affective states. Box plots of (a) HR, (b) instantaneous RR, (c) RSAE, and (d) PLV.
Figure 9.
Changes in HRV indices ((a): IDXPNA and (b): IDXSNA) of tachogram decomposition algorithms according to 4 affective states. Gauss (green boxes and dotted line); ARMAx (blue boxes and dashed line); OSP (yellow boxes and dash-dotted line); ZLE (red boxes and solid line).
Table 3.
Mean ± standard deviation of HRV indices (HF, IDXPNA, LF/HF, SBU, and IDXSNA).
| HRV index | Tachogram decomposition algorithm | Neutral (baseline) | Stress | Amusement | Meditation |
|---|---|---|---|---|---|
| HF | – | 1.376 ± 1.546 | 1.062 ± 1.691 | 1.325 ± 1.425 | 2.287 ± 2.131 |
| IDXPNA | Gauss | 2.306 ± 1.971 | 1.781 ± 1.699 | 2.972 ± 2.062 | 5.075 ± 4.252 |
| ARMAx | 1.672 ± 1.623 | 1.394 ± 1.712 | 1.930 ± 1.619 | 5.834 ± 5.562 | |
| OSP | 1.521 ± 1.527 | 1.242 ± 1.600 | 1.679 ± 1.483 | 5.051 ± 5.222 | |
| ZLE | 1.731 ± 1.609 | 1.395 ± 1.551 | 2.049 ± 1.975 | 5.776 ± 5.131 | |
| LF/HF | – | 2.897 ± 2.142 | 3.909 ± 3.856 | 5.173 ± 4.474 | 4.971 ± 5.749 |
| SBU | Gauss | 1.275 ± 1.168 | 1.385 ± 1.686 | 1.273 ± 2.146 | 0.943 ± 0.741 |
| ARMAx | 5.746 ± 9.775 | 4.194 ± 3.190 | 6.431 ± 9.649 | 1.235 ± 1.225 | |
| OSP | 10.621 ± 19.805 | 9.131 ± 9.516 | 15.591 ± 26.228 | 2.684 ± 3.565 | |
| ZLE | 2.640 ± 1.671 | 37.599 ± 112.521 | 4.267 ± 4.604 | 0.809 ± 0.660 | |
| IDXSNA | Gauss | 0.533 ± 0.388 | 0.631 ± 0.577 | 0.523 ± 0.625 | 0.539 ± 0.476 |
| ARMAx | 1.897 ± 1.624 | 1.725 ± 1.051 | 1.820 ± 1.431 | 0.830 ± 0.722 | |
| OSP | 2.235 ± 1.813 | 2.184 ± 1.237 | 2.473 ± 2.169 | 1.477 ± 1.829 | |
| ZLE | 1.477 ± 0.969 | 1.872 ± 1.595 | 2.195 ± 2.393 | 0.610 ± 0.490 |
Bold text represents a statistically significant difference between neutral and other affective states (p < 0.000005). HF and IDXPNA are the HRV indices related to vagal tone, and other indices (LF/HF, SBU and IDXSNA) indicate sympathetic tone. In meditation state, IDXPNAs of ARMAx and ZLE showed significant increases, and statistically significant decreases were observed in SBUs and IDXSNAs of ZLE.
Discussion
The tachogram of HRV consists of various oscillations caused by complicated interactions between the heart and brain. In particular, the oscillation caused by RSA often forms most of the raw tachogram xRAW. For the precise quantification of autonomic nervous system activity, it is necessary to decompose the raw tachogram into RSA and RSA-free tachograms. In this study, we proposed the novel tachogram decomposition algorithm (ZLE) and new HRV indices (IDXPNA and IDXSNA). We evaluated the performance of the proposed method through simulations, mindfulness meditation data, and WESAD data.
RSA, which is a synchrony between the heartbeat interval and breathing, reflects cardiac vagal control. To quantify RSA, we employed the PLV and RSAE. Although the RSAE and PLV capture different features (phase interaction and RRI variation), these indices increased during meditation (see Figs. 6, 9) as in previous study39, which indicates parasympathetic activation. In HRV analysis, all IDXPNAs of ZLE showed significant increases in contrast to HFs (see Tables 2, 3), and IDXPNA appeared to be better than HF in identifying parasympathetic activation.
Sympathetic inhibition during meditation is supported not only by literature but also by experimental analysis. Breathing meditation and slow breathing have been reported to improve pulmonary gas exchange performance63 and lower blood pressure64, galvanic skin response65 and muscle sympathetic nerve activity66–68. Reductions in vital signs (HR and RR) and self-report scores (stress and arousal) were also observed during meditation in our experiments, as shown in Figs. 6 and 9. Despite much evidence for sympathetic inhibition, the LF/HF of the classical HRV was noticeably increased during meditation35–40 (see Tables 2, 3); it seems to be due to the influence of RSA. To cancel the interference of RSA, C. Varon et al. suggested SBU46 and we proposed IDXSNA. Although SBU (LFR-f/(LFRSA + HFRSA)) is similar to IDXSNA (LFR-f/(LFRSA + HFRSA + HFR-f)), IDXSNA includes RSA-free vagal tone information (HFR-f). Since RSA is insufficient to represent a whole cardiac vagal tone69, the proposed IDXSNA can be considered a more reasonable index to quantify sympathetic tone. In real meditation data, both SBU and IDXSNA of ZLE successfully identified sympathetic inhibition, and it may be the first report on the identification of cardiac sympathetic inhibition during meditation. As a result, both SBU and IDXSNA appear to be more reliable than classical LF/HF to identify sympathetic inhibition.
ARMAx and OSP share the same scheme, which finds a weight vector (w = (RESPT∙RESP)−1RESP∙X) and subtracts RSA from the original tachogram xRAW45. When the RESP is the trajectory matrix of EDR, the ARMAx and OSP can be interpreted as adaptive noise cancellers with a least square solution; then, the EDR and the RSA component (xRSA) can be regarded as a noise reference signal and true noise, respectively. The algorithm performance is determined by a linear correlation between xRSA and the EDR70, but their true relationship is nonlinear47. Specifically, both the amplitude and frequency of the original tachogram are modulated by the RR and tidal volume27–29, and such modulations cannot be expressed by a linear transform of EDR. As an alternative, Gauss was suggested, which assumes paced respiration48, but instantaneous RR generally changes with time. In the simulation, previous decomposition algorithms (Gauss, ARMAx, and OSP) performed well when RR was constant, but their performance was insufficient in time-varying RR. However, ZLE was robust to the fluctuations of simulated RR (see Fig. 4). Note that abrupt changes in RR often occur during breathing meditation. In fact, the HRV indices (IDXPNA, SBU, and IDXSNA) of ZLE certainly identified both parasympathetic activation and sympathetic inhibition during meditation when no statistically significant differences were observed in some IDXPNAs and most IDXSNA of both ARMAx and OSP (see Tables 2, 3). Therefore, the ZLE seems to be the most reliable tachogram decomposition algorithm when RR dynamically changes.
Despite the promising performance of the proposed ZLE and HRV indices, they have limitations. First, if some oscillation of the RSA-free tachogram (xR-f) overlaps with the stop band of the notch filter in the frequency domain, then the corresponding oscillation will be suppressed. This filtering loss can be observed through the correlation coefficient between xRAW and R-f when the influence of RSA was small (e.g., resting state). As shown in Fig. 6, the loss of ZLE seems to be insignificant. Second, the proposed method did not identify sympathetic activation. In the stress state, sympathetic nerves are activated, but none of the SBUs or IDXSNAs show a significant increase. In future works, we plan to advance the proposed method for stress assessment.
Conclusions
To precisely assess autonomic nervous system activity, we proposed a novel tachogram decomposition algorithm (ZLE) and new HRV indices (IDXPNA and IDXSNA). ZLE clearly decomposed xRAW into RSA and R-f, and IDXPNA and IDXSNA identified parasympathetic activation and sympathetic inhibition during meditation, respectively. This study may be the first report on the identification of cardiac sympathetic inhibition during meditation (or slow breathing). Although the overlapping issue of the ZLE still remains, the ZLE was more robust than previous tachogram decomposition algorithms (Gauss, ARMAx and OSP) when RR dynamically fluctuates. Since the proposed approach requires only a single-lead ECG, we expect that it will be used in various fields, such as the internet of Medical Things (IoMT), digital healthcare, digital meditation, and digital therapeutics.
Acknowledgements
This research was supported in part by the Korea Medical Device Development Fund Grant funded by the MSIT (the Ministry of Science and ICT, the Ministry of Trade, Industry and Energy, the Ministry of Health & Welfare, the Ministry of Food and Drug Safety) (1711138169, KMDF KMDF_PR_20200901_0100), the Smart HealthCare Program (www.kipot.or.kr) funded by the Korean National Police Agency (KNPA, Korea) (Development and commercialization of police officer’s life-log acquisition and stress/health management system through artificial intelligence based on big data analysis/220222M03030), the National Research Council of Science and Technology (NST) Grant by the Korea Government (MSIT) (No. CAP-18015-000), and the Technology Innovation Program (20014477, Development of noncontact AI health monitoring system based on multimodal sensors) funded by the Ministry of Trade, Industry & Energy (MOTIE, Korea).
Author contributions
Conceptualization, I.Y.; methodology, C.P.; data acquisition and analysis, C.P.; interpretation, C.P., I.Y., S.H.; writing original draft preparation, C.P.; supervision, I.Y., S.H. All authors reviewed the manuscript.
Data availability
The datasets used and/or analysed during the current study available from the corresponding author on reasonable request.
Competing interests
The authors declare no competing interests.
Footnotes
Publisher's note
Springer Nature remains neutral with regard to jurisdictional claims in published maps and institutional affiliations.
Contributor Information
Inchan Youn, Email: iyoun@kist.re.kr.
Sungmin Han, Email: han0318@kist.re.kr.
References
- 1.Kutz I, Borysenko JZ, Benson H. Meditation and psychotherapy: A rationale for the integration of dynamic psychotherapy, the relaxation response, and mindfulness meditation. Am. J. Psychiatry. 1985;142:1–8. doi: 10.1176/ajp.142.1.1. [DOI] [PubMed] [Google Scholar]
- 2.Tang YY, Hölzel BK, Posner MI. The neuroscience of mindfulness meditation. Nat. Rev. Neurosci. 2015;16:213–225. doi: 10.1038/nrn3916. [DOI] [PubMed] [Google Scholar]
- 3.Wu R, et al. Brief mindfulness meditation improves emotion processing. Front. Neurosci. 2019;13:1074. doi: 10.3389/fnins.2019.01074. [DOI] [PMC free article] [PubMed] [Google Scholar]
- 4.Eberth J, Sedlmeier P. The effects of mindfulness meditation: A meta-analysis. Mindfulness (N Y) 2012;3:174–189. doi: 10.1007/s12671-012-0101-x. [DOI] [Google Scholar]
- 5.Salmon P, et al. Mindfulness meditation in clinical practice. Cogn. Behav. Pract. 2004;11:434–446. doi: 10.1016/S1077-7229(04)80060-9. [DOI] [Google Scholar]
- 6.Carlson LE, Ursuliak Z, Goodey E, Angen M, Speca M. The effects of a mindfulness meditation-based stress reduction program on mood and symptoms of stress in cancer outpatients: 6-month follow-up. Support. Care Cancer. 2001;9:112–123. doi: 10.1007/s005200000206. [DOI] [PubMed] [Google Scholar]
- 7.Winbush NY, Gross CR, Kreitzer MJ. The effects of mindfulness-based stress reduction on sleep disturbance: a systematic review. Explore J. Sci. Health. 2007;3:585–591. doi: 10.1016/j.explore.2007.08.003. [DOI] [PubMed] [Google Scholar]
- 8.Fox KCR, et al. Is meditation associated with altered brain structure? A systematic review and meta-analysis of morphometric neuroimaging in meditation practitioners. Neurosci. Biobehav. Rev. 2014;43:48–73. doi: 10.1016/j.neubiorev.2014.03.016. [DOI] [PubMed] [Google Scholar]
- 9.Beissner F, Meissner K, Bär KJ, Napadow V. The autonomic brain: An activation likelihood estimation meta-analysis for central processing of autonomic function. J. Neurosci. 2013;33:10503–10511. doi: 10.1523/JNEUROSCI.1103-13.2013. [DOI] [PMC free article] [PubMed] [Google Scholar]
- 10.Hunkin H, King DL, Zajac IT. Wearable devices as adjuncts in the treatment of anxiety-related symptoms: A narrative review of five device modalities and implications for clinical practice. Clin. Psychol. Sci. Pract. 2019;26:e12290. doi: 10.1111/cpsp.12290. [DOI] [Google Scholar]
- 11.Brandmeyer T, Delorme A. Meditation and neurofeedback. Front. Psychol. 2013;4:688. doi: 10.3389/fpsyg.2013.00688. [DOI] [PMC free article] [PubMed] [Google Scholar]
- 12.Ziegler DA, et al. Closed-loop digital meditation improves sustained attention in young adults. Nat. Hum. Behav. 2019;3:746–757. doi: 10.1038/s41562-019-0611-9. [DOI] [PMC free article] [PubMed] [Google Scholar]
- 13.Acabchuk RL, Simon MA, Low S, Brisson JM, Johnson BT. Measuring meditation progress with a consumer-grade EEG device: Caution from a randomized controlled trial. Mindfulness (N Y) 2021;12:68–81. doi: 10.1007/s12671-020-01497-1. [DOI] [Google Scholar]
- 14.Xing Y, et al. An artifact-resistant feature SKNAER for quantifying the burst of skin sympathetic nerve activity signal. Biosensors. 2022;12:355. doi: 10.3390/bios12050355. [DOI] [PMC free article] [PubMed] [Google Scholar]
- 15.Zhang Y, et al. Dynamics of cardiac autonomic responses during hemodialysis measured by heart rate variability and skin sympathetic nerve activity: the impact of interdialytic weight gain. Front. Physiol. 2022;13:909. doi: 10.3389/fphys.2022.890536. [DOI] [PMC free article] [PubMed] [Google Scholar]
- 16.Xing Y, et al. Design and evaluation of an autonomic nerve monitoring system based on skin sympathetic nerve activity. Biomed. Signal. Process Control. 2022;76:103681. doi: 10.1016/j.bspc.2022.103681. [DOI] [Google Scholar]
- 17.Kusayama T, et al. Simultaneous noninvasive recording of electrocardiogram and skin sympathetic nerve activity (neuECG) Nat. Protoc. 2020;15:1853–1877. doi: 10.1038/s41596-020-0316-6. [DOI] [PubMed] [Google Scholar]
- 18.Goessl VC, Curtiss JE, Hofmann SG. The effect of heart rate variability biofeedback training on stress and anxiety: a meta-analysis. Psychol. Med. 2017 doi: 10.1017/S0033291717001003. [DOI] [PubMed] [Google Scholar]
- 19.Deschodt-Arsac V, Lalanne R, Spiluttini B, Bertin C, Arsac LM. Effects of heart rate variability biofeedback training in athletes exposed to stress of university examinations. PLoS One. 2018;13:e0201388. doi: 10.1371/journal.pone.0201388. [DOI] [PMC free article] [PubMed] [Google Scholar]
- 20.Thomas RJ, Mietus JE, Peng C-K, Goldberger AL. An electrocardiogram-based technique to assess cardiopulmonary coupling during sleep. Sleep. 2005;28:1151–1161. doi: 10.1093/sleep/28.9.1151. [DOI] [PubMed] [Google Scholar]
- 21.Zhao L, Yang L, Su Z, Liu C. Cardiorespiratory coupling analysis based on entropy and cross-entropy in distinguishing different depression stages. Front. Physiol. 2019;10:359. doi: 10.3389/fphys.2019.00359. [DOI] [PMC free article] [PubMed] [Google Scholar]
- 22.Niizeki K, Saitoh T. Association between phase coupling of respiratory sinus arrhythmia and slow wave brain activity during sleep. Front. Physiol. 2018;9:1338. doi: 10.3389/fphys.2018.01338. [DOI] [PMC free article] [PubMed] [Google Scholar]
- 23.DeBoer RW, Karemaker JM, Strackee J. Hemodynamic fluctuations and baroreflex sensitivity in humans: A beat-to-beat model. Am. J. Physiol. Heart Circ. Physiol. 1987;253:25. doi: 10.1152/ajpheart.1987.253.3.H680. [DOI] [PubMed] [Google Scholar]
- 24.Triedman JK, Saul JP. Blood pressure modulation by central venous pressure and respiration: Buffering effects of the heart rate reflexes. Circulation. 1994;89:169–179. doi: 10.1161/01.CIR.89.1.169. [DOI] [PubMed] [Google Scholar]
- 25.Taha BH, Simon PM, Dempsey JA, Skatrud JB, Iber C. Respiratory sinus arrhythmia in humans: An obligatory role for vagal feedback from the lungs. J. Appl. Physiol. 1995;78:638–645. doi: 10.1152/jappl.1995.78.2.638. [DOI] [PubMed] [Google Scholar]
- 26.Piepoli M, et al. Origin of respiratory sinus arrhythmia in conscious humans: An important role for arterial carotid baroreceptors. Circulation. 1997;95:1813–1821. doi: 10.1161/01.CIR.95.7.1813. [DOI] [PubMed] [Google Scholar]
- 27.Hirsch JA, Bishop B. Respiratory sinus arrhythmia in humans: How breathing pattern modulates heart rate. Am. J. Physiol. Heart Circ. Physiol. 1981;10:620–629. doi: 10.1152/ajpheart.1981.241.4.H620. [DOI] [PubMed] [Google Scholar]
- 28.Brown TE, Beightol LA, Koh J, Eckberg DL. Important influence of respiration on human R–R interval power spectra is largely ignored. J. Appl. Physiol. 1993;75:2310–2317. doi: 10.1152/jappl.1993.75.5.2310. [DOI] [PubMed] [Google Scholar]
- 29.Song HS, Lehrer PM. The effects of specific respiratory rates on heart rate and heart rate variability. Appl. Psychophysiol. Biofeedback. 2003;28:13–23. doi: 10.1023/A:1022312815649. [DOI] [PubMed] [Google Scholar]
- 30.Cooley RL, et al. Evidence for a central origin of the low-frequency oscillation in RR-interval variability. Circulation. 1998;98:556–561. doi: 10.1161/01.CIR.98.6.556. [DOI] [PubMed] [Google Scholar]
- 31.Park J, Lyles RH, Bauer-Wu S. Mindfulness meditation lowers muscle sympathetic nerve activity and blood pressure in African-American males with chronic kidney disease. Am. J. Physiol. Regul. Integrat. Comp. Physiol. 2014;307:R93–R101. doi: 10.1152/ajpregu.00558.2013. [DOI] [PMC free article] [PubMed] [Google Scholar]
- 32.Tang YY, et al. Central and autonomic nervous system interaction is altered by short-term meditation. Proc. Natl. Acad. Sci. USA. 2009;106:8865–8870. doi: 10.1073/pnas.0904031106. [DOI] [PMC free article] [PubMed] [Google Scholar]
- 33.Krygier JR, et al. Mindfulness meditation, well-being, and heart rate variability: A preliminary investigation into the impact of intensive vipassana meditation. Int. J. Psychophysiol. 2013;89:305–313. doi: 10.1016/j.ijpsycho.2013.06.017. [DOI] [PubMed] [Google Scholar]
- 34.Azam MA, Katz J, Mohabir V, Ritvo P. Individuals with tension and migraine headaches exhibit increased heart rate variability during post-stress mindfulness meditation practice but a decrease during a post-stress control condition—a randomized, controlled experiment. Int. J. Psychophysiol. 2016;110:66–74. doi: 10.1016/j.ijpsycho.2016.10.011. [DOI] [PubMed] [Google Scholar]
- 35.Sakakibara M, Takeuchi S, Hayano J. Effect of relaxation training on cardiac parasympathetic tone. Psychophysiology. 1994;31:223–228. doi: 10.1111/j.1469-8986.1994.tb02210.x. [DOI] [PubMed] [Google Scholar]
- 36.Toro-Velasco C, Arroyo-Morales M, Fernández-de-las-Peñas C, Cleland JA, Barrero-Hernández FJ. Short-term effects of manual therapy on heart rate variability, mood state, and pressure pain sensitivity in patients with chronic tension-type headache: a pilot study. J. Manipulat. Physiol. Ther. 2009;32:527–535. doi: 10.1016/j.jmpt.2009.08.011. [DOI] [PubMed] [Google Scholar]
- 37.Léonard A, Clément S, Kuo C-D, Manto M. Changes in heart rate variability during heartfulness meditation: a power spectral analysis including the residual spectrum. Front. Cardiovasc. Med. 2019;6:62. doi: 10.3389/fcvm.2019.00062. [DOI] [PMC free article] [PubMed] [Google Scholar]
- 38.Phongsuphap S, Pongsupap Y, Chandanamattha P, Lursinsap C. Changes in heart rate variability during concentration meditation. Int. J. Cardiol. 2008;130:481–484. doi: 10.1016/j.ijcard.2007.06.103. [DOI] [PubMed] [Google Scholar]
- 39.Cysarz D, Büssing A. Cardiorespiratory synchronization during Zen meditation. Eur. J. Appl. Physiol. 2005;95:88–95. doi: 10.1007/s00421-005-1379-3. [DOI] [PubMed] [Google Scholar]
- 40.Delgado-Pastor LC, Perakakis P, Subramanya P, Telles S, Vila J. Mindfulness (Vipassana) meditation: Effects on P3b event-related potential and heart rate variability. Int. J. Psychophysiol. 2013;90:207–214. doi: 10.1016/j.ijpsycho.2013.07.006. [DOI] [PubMed] [Google Scholar]
- 41.Bernardi L, et al. Effects of controlled breathing, mental activity and mental stress with or without verbalization on heart rate variability. J. Am. Coll. Cardiol. 2000;35:1462–1469. doi: 10.1016/S0735-1097(00)00595-7. [DOI] [PubMed] [Google Scholar]
- 42.Tiinanen, S., Tulppo, M. & Seppänen, T. RSA component extraction from heart rate signal by independent component analysis. In 36th Annual Computers in Cardiology Conference (CinC) 161–164 (IEEE, 2009).
- 43.Tiinanen S, Tulppo M, Seppänen T. Reducing the effect of respiration in baroreflex sensitivity estimation with adaptive filtering. IEEE Trans. Biomed. Eng. 2008;55:51–59. doi: 10.1109/TBME.2007.897840. [DOI] [PubMed] [Google Scholar]
- 44.Choi J, Gutierrez-Osuna R. Removal of respiratory influences from heart rate variability in stress monitoring. IEEE Sens. J. 2011;11:2649–2656. doi: 10.1109/JSEN.2011.2150746. [DOI] [Google Scholar]
- 45.Widjaja D, Caicedo A, Vlemincx E, Van Diest I, Van Huffel S. Separation of respiratory influences from the tachogram: A methodological evaluation. PLoS One. 2014;9:101713. doi: 10.1371/journal.pone.0101713. [DOI] [PMC free article] [PubMed] [Google Scholar]
- 46.Varon C, et al. Unconstrained estimation of HRV indices after removing respiratory influences from heart rate. IEEE J. Biomed. Health Inform. 2019;23:2386–2397. doi: 10.1109/JBHI.2018.2884644. [DOI] [PubMed] [Google Scholar]
- 47.Kontaxis S, Lázaro J, Gil E, Laguna P, Bailón R. Assessment of quadratic nonlinear cardiorespiratory couplings during tilt-table test by means of real wavelet biphase. IEEE Trans. Biomed. Eng. 2019;66:187–198. doi: 10.1109/TBME.2018.2821182. [DOI] [PubMed] [Google Scholar]
- 48.Lenis G, et al. Separating the effect of respiration on the heart rate variability using Granger’s causality and linear filtering. Biomed. Signal Process. Control. 2017;31:272–287. doi: 10.1016/j.bspc.2016.07.014. [DOI] [Google Scholar]
- 49.Pan J, Tompkins WJ. A real-time QRS detection algorithm. IEEE Trans. Biomed. Eng. 1985;32:230–236. doi: 10.1109/TBME.1985.325532. [DOI] [PubMed] [Google Scholar]
- 50.Mateo J, Laguna P. Analysis of heart rate variability in the presence of ectopic beats using the heart timing signal. IEEE Trans. Biomed. Eng. 2003;50:334–343. doi: 10.1109/TBME.2003.808831. [DOI] [PubMed] [Google Scholar]
- 51.Varon C, et al. A comparative study of ECG-derived respiration in ambulatory monitoring using the single-lead ECG. Sci. Rep. 2020;10:1–14. doi: 10.1038/s41598-020-62624-5. [DOI] [PMC free article] [PubMed] [Google Scholar]
- 52.Lazaro, J., Alcaine, A., Gil, E., Laguna, P. & Bailon, R. Electrocardiogram derived respiration from QRS slopes. In Proceedings of the Annual International Conference of the IEEE Engineering in Medicine and Biology Society, EMBS 3913–3916 (2013). 10.1109/EMBC.2013.6610400. [DOI] [PubMed]
- 53.Lazaro J, et al. Electrocardiogram derived respiratory rate using a wearable armband. IEEE Trans. Biomed. Eng. 2020;20:1. doi: 10.1109/tbme.2020.3004730. [DOI] [PubMed] [Google Scholar]
- 54.Park C, Lee B. Real-time estimation of respiratory rate from a photoplethysmogram using an adaptive lattice notch filter. Biomed. Eng. Online. 2014;13:170. doi: 10.1186/1475-925X-13-170. [DOI] [PMC free article] [PubMed] [Google Scholar]
- 55.Park C, Shin H, Lee B. Blockwise PPG enhancement based on time-variant zero-phase harmonic notch filtering. Sensors (Switzerland) 2017;17:25. doi: 10.3390/s17040860. [DOI] [PMC free article] [PubMed] [Google Scholar]
- 56.Hernando A, et al. Inclusion of respiratory frequency information in heart rate variability analysis for stress assessment. IEEE J. Biomed. Health Inform. 2016;20:1016–1025. doi: 10.1109/JBHI.2016.2553578. [DOI] [PubMed] [Google Scholar]
- 57.Shui P-L, Shang H-Y, Zhao Y-B. Instantaneous frequency estimation based on directionally smoothed pseudo-Wigner-Ville distribution bank. IET Radar. Sonar Navig. 2007;1:317. doi: 10.1049/iet-rsn:20060123. [DOI] [Google Scholar]
- 58.Mitra S. Digital Signal Processing: A Computer-Based Approach. 4. Mcgraw-Hill; 2011. [Google Scholar]
- 59.Aydore S, Pantazis D, Leahy RM. A note on the phase locking value and its properties. Neuroimage. 2013;74:231–244. doi: 10.1016/j.neuroimage.2013.02.008. [DOI] [PMC free article] [PubMed] [Google Scholar]
- 60.Pitzalis MV, et al. Effect of respiratory rate on the relationships between RR interval and systolic blood pressure fluctuations: A frequency-dependent phenomenon. Cardiovasc. Res. 1998;38:332–339. doi: 10.1016/S0008-6363(98)00029-7. [DOI] [PubMed] [Google Scholar]
- 61.Malik M. Heart rate variability. Ann. Noninvasive Electrocardiol. 1996;1:151–181. doi: 10.1111/j.1542-474X.1996.tb00275.x. [DOI] [Google Scholar]
- 62.Schmidt, P., Reiss, A., Duerichen, R., Marberger, C. & Van Laerhoven, K. Introducing WESAD, a multimodal dataset for wearable stress and affect detection. In Proceedings of the 20th ACM International Conference on Multimodal Interaction 400–408 (ACM, 2018).
- 63.Bernardi L, et al. Effect of breathing rate on oxygen saturation and exercise performance in chronic heart failure. Lancet. 1998;351:1308–1311. doi: 10.1016/S0140-6736(97)10341-5. [DOI] [PubMed] [Google Scholar]
- 64.Grossman E, Grossman A, Schein MH, Zimlichman R, Gavish B. Breathing-control lowers blood pressure. J. Hum. Hypertens. 2001;15:263–269. doi: 10.1038/sj.jhh.1001147. [DOI] [PubMed] [Google Scholar]
- 65.Singh Y, Sharma R, Talwar A. Immediate and long-term effects of meditation on acute stress reactivity, cognitive functions, and intelligence. Altern. Ther. Health. 2012;18:46–53. [PubMed] [Google Scholar]
- 66.Oneda B, Ortega KC, Gusmão JL, Araújo TG, Mion D. Sympathetic nerve activity is decreased during device-guided slow breathing. Hypertens. Res. 2010;33:708–712. doi: 10.1038/hr.2010.74. [DOI] [PubMed] [Google Scholar]
- 67.Harada D, et al. Slow and deep respiration suppresses steady-state sympathetic nerve activity in patients with chronic heart failure: from modeling to clinical application. Am. J. Physiol. Heart Circ. Physiol. 2014;307:H1159–H1168. doi: 10.1152/ajpheart.00109.2014. [DOI] [PubMed] [Google Scholar]
- 68.Fonkoue IT, et al. Acute effects of device-guided slow breathing on sympathetic nerve activity and baroreflex sensitivity in posttraumatic stress disorder. Am. J. Physiol. Heart Circ. Physiol. 2018;315:H141–H149. doi: 10.1152/ajpheart.00098.2018. [DOI] [PMC free article] [PubMed] [Google Scholar]
- 69.Kollai M, Mizsei G. Respiratory sinus arrhythmia is a limited measure of cardiac parasympathetic control in man. J. Physiol. 1990;424:329–342. doi: 10.1113/jphysiol.1990.sp018070. [DOI] [PMC free article] [PubMed] [Google Scholar]
- 70.Widrow B, et al. Adaptive noise cancelling: Principles and applications. Proc. IEEE. 1975;63:1692–1716. doi: 10.1109/PROC.1975.10036. [DOI] [Google Scholar]
Associated Data
This section collects any data citations, data availability statements, or supplementary materials included in this article.
Data Availability Statement
The datasets used and/or analysed during the current study available from the corresponding author on reasonable request.


