

Abstract

Pomegranate (Punica granatum L.) is a well-known source of bioactive phenolic compounds such as ellagitannins, anthocyanins, and flavanols. Punicalagin, one of the main constituents of pomegranate, needs to be biodegraded by bacteria to yield metabolites of medicinal interest. In this work, we tested 30 lactic acid bacteria (LAB) and their capacity to transform punicalagin from a punicalagin-rich pomegranate extract into smaller bioactive molecules, namely, ellagic acid and urolithins. These were identified and quantified by high-performance liquid chromatography-electrospray ionization tandem mass spectrometry (HPLC-ESI-MS2). Further, we evaluated the molecular mechanism governing this transformation through label-free comparative MS-based proteomics. All tested LAB strains were capable of transforming punicalagin into ellagic acid, while the biosynthesis of urolithins was not observed. Proteomic analysis revealed an increase of generic transglycosylases that might have a hydrolytic role in the target phenolic molecule, coupled with an increase in the quantity of ATP-binding cassette (ABC) transporters, which might play a relevant role in transporting the resulting byproducts in and out of the cell.
Keywords: lactic acid bacteria, ellagic acid, urolithin, punicalagin, proteomics, metabolomics
Introduction
The human gastrointestinal tract (GIT) represents one of the largest interfaces between the host and external pathogens, which impose a threat to human health. The collection of bacteria, archaea, and eukarya colonizing the GIT is known as gut microbiota. In healthy individuals, Gram-negative Proteobacteria and Bacteroidetes and Gram-positive Firmicutes are the most representative ones among eubacteria.1 Microbes colonize human hosts immediately after birth. However, the gut microbiota is not a static ecosystem as it can be changed depending on lifestyle, diet, infections, exposure to antibiotics, or surgical interventions.2 Alteration of the bowel microbiota composition of prevailing bacterial groups with negative physiological impact is called dysbiosis and could have devastating consequences on human health.3 Many diseases have been related to a damaged microbiota status in the gut, including type 2 diabetes (T2D), allergies, nonalcoholic fatty liver disease (NAFLD), obesity, and inflammatory bowel diseases (IBD).4
Probiotics are, by definition, “living microorganisms that, when administered in adequate amounts, confer a health benefit on the host”.4 Microorganisms with probiotic properties commonly used as dietary supplements belong to the genera Lactobacillus and Bifidobacterium. The scientific literature is full of examples on how dietary supplementation with probiotic bacteria has a protective effect against the onset of some of the aforementioned diseases. Regarding T2D, probiotics have recently shown their benefits when administered in either animals5,6 or humans,7 strengthening gut barrier function, reshaping gut microbiota composition, and lowering proinflammatory cytokines, such as interleukin (IL)-6, IL-8, and tumor necrosis factor (TNF)-α, while increasing anti-inflammatory ones like IL-10 and IL-4.
The administration of VSL#3, a probiotic mixture consisting of Streptococcus salivarius subsp. thermophilus, Lacticaseibacillus casei, Lactiplantibacillus plantarum, Lactobacillus acidophilus, Lactobacillus delbrueckii subsp. bulgaricus, Bifidobacterium longum, Bifidobacterium infantis, and Bifidobacterium breve, coupled with the current antibiotic 5-aminosalicylates (5-ASA), to individuals suffering from ulcerative colitis (UC), was proven to be effective in both induction and maintenance of the remission of the disease.8 Probiotics have also been found to alleviate symptom severity in patients suffering from irritable bowel syndrome (IBS) when compared with placebo groups.9
Polyphenols are present in a wide range of plant foods. Their impact on human health is documented through a variety of bioactivities, including their ability to function as prebiotics and reshape gut microbiota into a healthier one.10,11 Among those plant foods, pomegranate (Punica granatum) has attracted extensive interest due to its phytochemical components (i.e., ellagitannins, gallotannins, and anthocyanins) and their assorted bioactivities.12 When compared to control or placebo, research has shown an increase in the population of the genera Lactobacillus and Bifidobacterium when pomegranate polyphenols were administered,13 which emphasizes the effect of dietary polyphenolics as prebiotic compounds. A research study has shown the beneficial effects of pomegranate consumption, either as peel extract or juice, achieving effective results in diminishing oxidation in lipids and proteins.14 This antioxidant capacity is highly correlated with the quantity and the type of polyphenols found in pomegranate. The richer the fruit part is in punicalagin, the greater the antioxidative potential it is endowed with.15
Punicalagin is a natural component in pomegranate and belongs to the family of ellagitannins. The biological interest of punicalagins arises from being the precursor of ellagic acid (EA) and other smaller bioactive phenolic compounds. Enzymes involved in ellagitannin hydrolysis are known as tannases. After hydrolysis by tannase enzymes, the released intermediate compound undergoes a spontaneous lactonization to form ellagic acid.16 In turn, this can be transformed into a variety of smaller molecules called urolithins, which could have a huge positive impact on health as an antioxidant16 and as a gut barrier function enhancer.17 At this point, the biotransformation of punicalagin into smaller compounds is key. Two bacteria from the Eggerthellaceae family named Gordonibacter urolithinfaciens and Gordonibacter pamelaeae are able to produce urolithins from ellagitannins.18 Urolithin produced by these species is an intermediate to other isoforms that have more bioactivity. It has been recently described as a bacteria isolated from human gut belonging to the same family, named as Ellagibacter isourolithinifaciens, with the ability to metabolize ellagic acid into isourolithin A.19 Research has demonstrated the capacity of a strain of L. plantarum to produce ellagic acid from pomegranate juice (PJ) in a 5-day window20 and a 24 h window.21 In this research, the antioxidant capacity has also been proven. Yet, the current knowledge on the capacity of lactic acid bacteria (LAB) to degrade punicalagin is scarce, and the underlying molecular mechanisms implicated in the interaction between the phytochemical and these probiotic bacteria are unknown.
The purpose of the present study was to assess the ability of selected probiotic bacteria to degrade punicalagin into bioactive compounds and identify the underlying molecular mechanisms by studying the proteome of the bacteria exposed to the phytochemicals present in a nutritional supplement extracted from pomegranate.
Materials and Methods
Chemicals and Reagents
De Man, Rogosa and Sharpe broth medium (MRS) was purchased from CondaLab (Spain). All chemicals used in high-performance liquid chromatography (HPLC) were liquid chromatography/mass spectrometry (LC/MS) Grade from Fisher Scientific. Trypsin and ProteaseMAX for proteomic digestion were purchased from PROMEGA. Punicalagin (A + B) mixture was acquired from PhytoLab GmbH & Co. KG (Germany). Reagents were acquired from Scharlab (Spain), ThermoFisher or Acros Organics. Ellagic acid and urolithin standards were purchased from Sigma-Aldrich. Urolithin A has a purity of ≥97%, and urolithin B has a purity of ≥95%. A commercial food supplement of punicalagin-rich extract (Punicalagina granatum plus+) was provided by Antioxidantes del Mediterráneo S.L. (Spain). The pomegranate powder had 300 mg of punicalagin per gram of product.
Bacterial Cultures
LAB used in this assay were isolated and characterized from ripened cheese and dry-cured fermented sausages.22 In a preliminary study, 30 of these strains, listed in Table 1, were tested under physiological conditions (37 °C and 5% CO2) in MRS to assess their viability under usual cell culture conditions for further experiments. Bacteria were kept at −80 °C until their use. To revitalize sterilized bacteria, MRS was previously prepared following the manufacturer’s recommended procedure.
Table 1. Nomenclature of Bacteria Tested.
| bacterial strains tested | |
|---|---|
| L. plantarum | L. plantarum |
| Lacticaseibacillus paracasei | Enterococcus faecium |
| Latilactobacillus sakei | Leuconostoc mesenteroides |
| Enterococcus hirae | Lactococcus lactis |
| L. garvieae subsp. garvieae | L. casei |
| E. faecium | E. faecium |
| L. casei | L. sakei |
| L. sakei | L. paracasei |
| E. faecium | L. lactis subsp. cremoris |
| E. faecium | E. faecium |
| L. casei | Enterococcus durans |
| E. durans | L. sakei |
| L. casei | L. mesenteroides |
| L. paracasei | L. lactis subsp. cremoris |
Experimental Setting
Once bacteria were fully revitalized in MRS broth (after 24 h), each one was exposed to a commercial punicalagin-rich dietary supplement (Punicalagina granatum plus+, Antioxidantes del Mediterráneo S.L., Spain) at a final concentration of punicalagin of 30 μg/mL MRS. To assess the biodegradation of punicalagin by the bacteria, four different types of experimental units were incubated in the same conditions: C1: MRS, C2: MRS with punicalagin, B + P: MRS with bacteria and punicalagin, and B: MRS with bacteria and without punicalagin. For this preliminary test, two replicates (n = 2) of each bacterium were made. While a comparison of B + P vs B would indicate whether bacteria were implicated in the formation of punicalagin byproducts, additional controls and C2 were considered to (i) check the occurrence of the bioactive compounds in the MRS (C1) and (ii) assess the potential degradation of punicalagin into the compounds of interest in the set conditions by chemical mechanisms (no implication of bacteria). The samples from all experimental units were collected after 24 h incubation to analyze the occurrence and concentration of punicalagin byproducts (ellagic acid and urolithins) by the analytical procedure described in due course.
After screening the 30 initial bacterial strains, 10 of them were selected and retested in triplicate (n = 3) based on their bioactivity shown in the first assay. The molecular mechanisms implicated in the biodegradation of punicalagin by label-free MS-based proteomics were investigated in three strains among these last 10 strains. These bacteria were selected among those displaying a more intense activity in the biodegradation of punicalagin. Bacteria eventually selected were L. plantarum 89, L. paracasei 116, and E. faecium 126. For proteomic analyses, each bacterium was incubated in the presence (B + P) and in the absence (B) of the punicalagin product in quintuplicate (n = 5).
Phenolic Content Extraction
At sampling times, bacteria were centrifuged (15 min at room temperature at 7197g, Eppendorf 5430 centrifuge), and supernatants were treated for the extraction of phenolic compounds following the procedure described by Delgado et al.23 with some modifications. The QuEChERS methodology was applied using a mixture of equal volumes of diethyl ether and ethyl acetate (1:1, v/v). Phase partitioning was conducted using 0.4 g of NaCl and 1.6 g of anhydrous MgSO4 (both from Scharlab S.L.). The mixture was shaken vigorously by hand and centrifuged (5 min at room temperature at 2630g, Orto Alresa Digtor 21R). After the extraction, the organic phase was collected (1 mL), filtered through 0.22 μm, and allowed to evaporate naturally overnight in a laminar flow cabinet in complete darkness.
Dried extracts of phenolic compounds were resuspended in the same volume of water/acetonitrile 50:50.
Analysis of Phenolic Compounds
The mixture of phenolics from extractions was separated in a Dionex UltiMate 3000 RSLCnano system (ThermoFisher) with the following program: 0–3 min (10% B, isocratic), 3–3.1 min (35% B, increasing), 3.1–12 min (98% B, increasing), 12–14 min (98% B, isocratic), 14–14.1 min (10% B, decreasing), and 14.1–15 min (10% B, isocratic). The total run time was 15 min. The flow was set at 300 μL/min, and mobile phases (Fisher Scientific) were A, Optima HPLC-MS grade water, and B, Optima HPLC-MS grade acetonitrile, both with 0.1% Optima HPLC-MS grade formic acid. The column used was C18 Accucore Aq (150 mm × 2.1 mm, 2.6 μm, ThermoFisher).
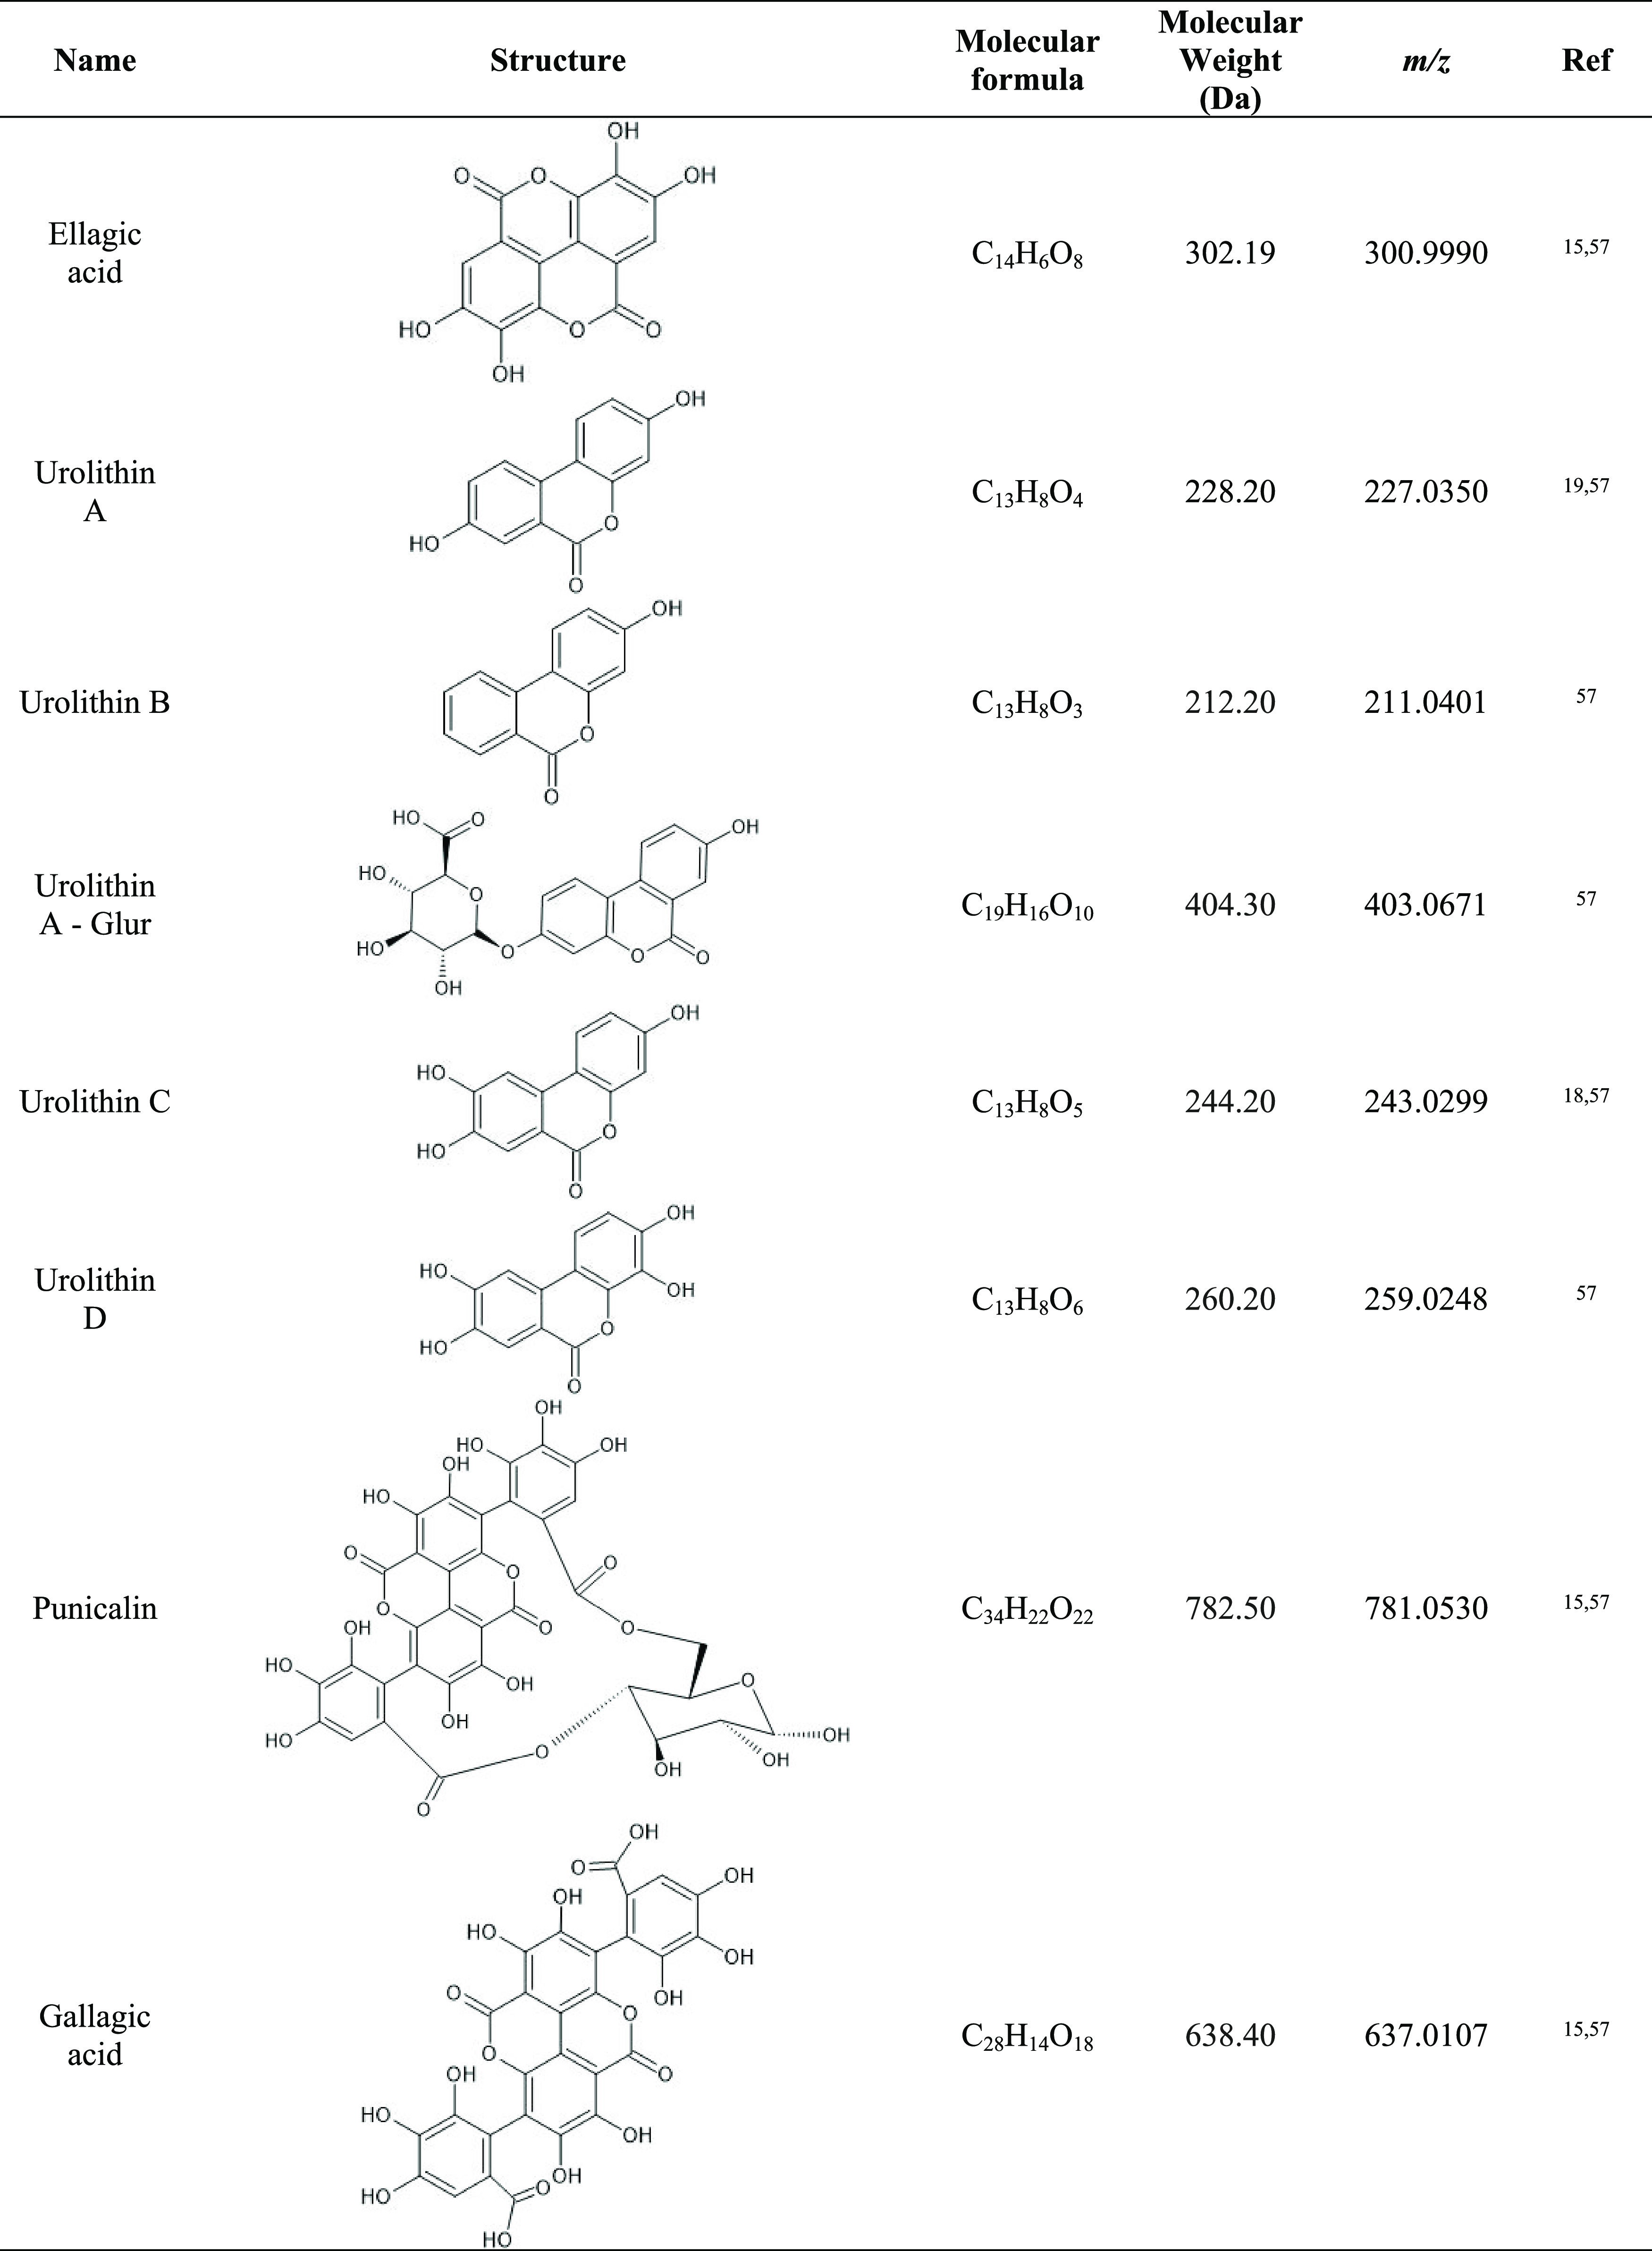
Identification was made on a high-resolution HPLC-MS Q-Exactive Plus. First, an MS scan range set between 200 and 1100 m/z with a resolution of 70 000 full width at half-maximum (FWHM) in full-scan mode was applied. In addition to full-scan mode, extracted ion chromatogram (EIC) of specific chemical species reported in the literature, to be specific biodegradation products of punicalagin, was specifically searched (Table 2). Standard compounds from punicalagin, EA, and urolithins A and B were run and subjected to MS2 for positive identification (m/z—fragmentation pattern) of such compounds in the experimental samples. These analyses allowed us to obtain the retention time, as well as the molecular weight, which we confirmed on the database (PubChem). The tentative identification of other urolithins (specifically urolithin C and D), punicalin, and gallagic acid (also punicalagin degradation byproducts) was performed by searching for the ions shown in Table 2. Figure S1 shows the EIC for punicalagin, EA, and both urolithin A and B. Quantification of punicalagin, ellagic acid, and urolithins was made using calibration curves for each compound using standards (Sigma-Aldrich) in the same chromatographic and MS conditions as the experimental samples. Concentrations of species in such curves ranged from 1 to 100 μg/L for urolithins A and B and from 1 to 5000 μg/L for ellagic acid.
Table 2. Punicalagin Byproducts Searched in Samples15,18,19,57.
Proteomic Analysis
Proteomic analysis was carried out according to the following protocol. Lysates were resuspended in phosphate buffer saline (PBS) and mixed with 5 μL of Laemmli loading dye buffer [Tris HCL 0.125 M, sodium dodecyl sulfate (SDS) 4% (w/v), glycerol 20% (v/v), 2-mercaptoethanol 10% (v/v), and bromophenol blue 0.004% (w/v)] and then were added to each sample. After 1 h of sonication in a Branson sonifier 250 bath (Emerson, Spain) to lysate cells, the samples were run in sodium dodecyl sulfate polyacrylamide gel electrophoresis (SDS-PAGE) 4% stacking/12% separating phases. When the proteins reached the separating phase, the run was stopped, and the gel was left to stain in Coomassie blue overnight. On the next day, destaining and washing procedures were done, and subsequently, the bands were picked up and cut into 1 mm3 pieces for in-gel digestion.24 After being trimmed, reduction and alkylation steps were performed. The former was carried out by adding a freshly prepared mix of 50 mM ammonium bicarbonate and 1,4-dithiothreitol (DTT) for 20 min at 56 °C. The latter was executed right after and consisted of the addition of a freshly prepared mix of iodoacetamide (IAA) and 50 mM ammonium bicarbonate, allowing the reaction to take place in absolute darkness for 15 min at room temperature. After that, proteins were digested into peptides using a mixture of proteaseMAX (Promega) and sequencing-grade trypsin (Promega). To achieve maximum effectiveness, the samples were left 1 h at 50 °C following the manufacturer’s instructions.
The resultant peptides, resuspended in loading buffer (water/acetonitrile 98:2 (v/v), 0.05% trifluoroacetic acid) for analysis, were sonicated in a water bath for 5 min and centrifuged at 12 700g for 15 min at room temperature right before setting them into conic vials for LC-MS/MS Orbitrap. Loading buffer was used to mimic the same conditions as the UHPLC method for proteomic analysis starts.
Label-Free Quantitative Proteomic Analyses
Mobile phases (Fisher Scientific) used were A, Optima HPLC-MS grade water, and B, Optima HPLC-MS grade acetonitrile, both with 0.1% Optima HPLC-MS grade formic acid. The column used was HPLC Acclaim PepMap 100 C18 (500 mm × 0.075 mm × 2 μm). Peptides were eluted with the following gradient, starting at 2% AcN: 0–3.1 min (8% B, increasing), 3.1–240 min (30% B, increasing), 240–241 min (90% B, increasing), 241–246 min (90% B, isocratic), 246–247 min (2% B, decreasing), and 247–277 min (2%, isocratic, equilibration phase). The total run time was 277 min. The flow was set at 0.300 μL/min.
Mass spectrometry was accomplished in the data-dependent mode. Data were collected using a Top15 method for MS/MS scans.25 Parameters were set as follows: spray voltage of 1.8 kV, capillary temperature of 300 °C, 390–1700 m/z for a full-scan mass range, and a resolution of 70 000 units.
Spectral normalization and comparative proteome abundance and data analysis were conducted using MaxQuant software.26
A Q-Exactive Plus mass spectrometer coupled to a Dionex Ultimate 3000 RSLCnano (Thermo Scientific, Waltham, MA) was used to analyze around 2 μg from each digest. Comparative proteome abundance and data analysis were carried out using MaxQuant software (version 1.6.15.0; https://www.maxquant.org/download_asset/maxquant/latest), and Perseus (v.1.6.15.0) was used to organize the data and perform statistical analysis. Carbamidomethylation of cysteines was set as a fixed modification; oxidation of methionines and acetylation of N-terminals were set as variable modifications. Database searching was performed against E. faecium, L. plantarum, or L. paracasei protein databases (www.uniprot.org). The FASTA files used were as follows: E. faecium—Taxon ID 1352 (https://www.uniprot.org/proteomes/UP000005269); L. plantarum (strain ATCC BAA-793/NCIMB 8826/WCFS1)—Taxon ID 220668 (https://www.uniprot.org/proteomes/UP000000432); L. paracasei (strain ATCC 334/BCRC 17002/CCUG 31169/CIP 107868/KCTC 3260/NRRL B-441)—Taxon ID 3219677 (https://www.uniprot.org/proteomes/UP000001651). The maximum peptide/protein false discovery rates (FDRs) were set to 1% based on a comparison to a reverse database. The LFQ algorithm was used to generate normalized spectral intensities and infer relative protein abundance.26 Proteins were identified with at least two peptides, and those proteins that matched to a contaminant database or the reverse database were removed and proteins were only retained in the final analysis if they were detected in at least two replicates from at least one treatment. Quantitative analysis was performed using a t-test to compare the B + P group with the B group. The qualitative analysis was also performed to detect proteins that were found in at least three replicates of a given treated group but were undetectable in the comparison B group and vice versa. All proteins satisfying one of the two aforementioned criteria are identified as “discriminating proteins”.
Gene Ontology Analysis
For enrichment analysis, the proteins were evaluated through ClueGO v.2.5.7.27 To define the term–term interrelations and functional groups based on shared genes between the terms, the Kappa score was established at 0.4. Three GO terms and 4% of genes covered were set as the minimum requirement to be selected. Deep search on the database (NCBI) searching for proteins with the same weight as the ones named by “extracellular glycosylase”, “cell-wall hydrolase”, “peptidoglycan hydrolase”, “uncharacterized protein”, etc., looking for most accurate proteins with a given biological function.
Statistical Analysis
When comparing ellagic acid productions by a variety of LAB in the presence of a punicalagin extract, we quantified each replicate and obtained an average with standard deviation. Analysis of variance (ANOVA) was applied to test the ability of bacteria to produce EA and urolithins from punicalagin. We also carried out a t-test to assess their significance vs C2 (MRS with extract).
The same data treatment was performed with the results of urolithin B since it is the only quantifiable urolithin above 1 μg/L.
For veracity treatment, we filtered out all of the nonsignificant proteins according to the p-value set for the software. The p-value was corrected by Bonferroni step-down and set as p ≤ 0.05.
Results and Discussion
Biotransformation of Punicalagin by Selected Probiotic Bacteria
The culture medium where the LAB were incubated (C1 group) had a low quantity of EA (∼4 μg/L) that could plausibly be derived from trace plant ingredients. The addition of the punicalagin-rich pomegranate extract to the medium (C2) increased the concentration of EA up to 54.21 μg/L. The incubation of the LAB in the culture medium led to concentrations of EA between 9.11 and 49.38 μg/L. The combination of the punicalagin-rich supplement with the LAB under study (B + P group) led, in all cases, to significantly increased levels of EA compared to experimental units with the medium (C1), extract (C2), or the bacteria (B groups), alone (p < 0.05, Table 3). The accretion of EA in these experimental units was, in fact, highly remarkable, with such concentrations increasing between 25 and 18 times as compared to the concentration of EA found in the pomegranate extract. These results show the clear implication of LAB under study in the production of EA from its precursor, punicalagin. The biodegradation pathway previously reported by other authors28 is depicted in Figure 1. According to this mechanism, punicalagin would first be degraded to hexahydroxydiphenic acid (MW: 338.22 Da) and punicalin (MW: 782.5 Da) by hydrolysis. The former would spontaneously lactonize to ellagic acid (MW: 302.19 Da), and the latter would undergo another hydrolysis to form glucose (MW: 180.16 Da) and gallagic acid (MW: 638.39 Da). It is worth highlighting that other species such as complex tannins and gallocatechins could also have contributed to yielding ellagic acid in the present experiment. Yet, a detailed analysis of the extract revealed that punicalagin was, by far, the most abundant species in the pomegranate extract (31.13 mg/100 mg of powder), while other compounds were a minority, such as other ellagitannins (4.53 mg/100 mg powder) and anthocyanidins (0.04 mg/100 mg powder). Catechins were not detected in the present extract, neither by DAD nor by MS. It is therefore reasonable to consider that most of the ellagic acid was produced from punicalagin. The production of ellagic acid from precursors via acid hydrolysis could also have occurred, but the pH of the reaction media was monitored during the entire assay and never dropped below 4, far from the required acidic conditions for the chemical hydrolysis of punicalagin (∼2).
Table 3. Influence of Selected Lactic Acid Bacteria on the Concentrations of Ellagic Acid and Urolithins (Means ± Standard Deviation) in MRS Supplemented with 30 μg/mL Punicalagin after 24 h of Incubation at 37 °Ca.
| sample | short name | urolithin A content (μg/L) | urolithin B content (μg/L) | ellagic acid content (μg/L) |
|---|---|---|---|---|
| culture medium (MRS) | C1 | <1 | <1 | 4.30d ± 5.34 |
| culture medium + extract | C2 | <1 | <1 | 54.21c ± 17.78 |
| E. faecium 37 | 37_P | <1 | <1 | 1000.92b ± 116.74 |
| L. paracasei 74 | 74_P | <1 | <1 | 1401.06a ± 324.24 |
| L. plantarum 89 | 89_P | <1 | <1 | 1125.01ab ± 315.14 |
| L. casei 116 | 116_P | <1 | <1 | 1053.67ab ± 213.54 |
| E. faecium 126 | 126_P | <1 | <1 | 1115.34ab ± 164.98 |
| L. paracasei 185 | 185_P | <1 | <1 | 1063.33ab ± 374.75 |
| L. sakei 195 | 195_P | <1 | <1 | 979.74b ± 153.92 |
| L. casei 246 | 246_P | <1 | <1 | 1047.36ab ± 145.42 |
| L. plantarum 284 | 284_P | <1 | <1 | 1179.99ab ± 331.22 |
| L. plantarum 295 | 295_P | <1 | <1 | 1349.04a ± 385.20 |
Culture medium (MRS, C1) and MRS plus punicalagin extract (C2) are used as controls. Different letters denote significant differences between means.
Figure 1.

Proposed mechanisms of the bacterial utilization of punicalagin according to the proteomics study and following the fragmentation pattern proposed for this molecule as previously described by other authors.28
Although it has been poorly studied, the ability of LAB to produce ellagic acid from plant ellagitannin sources has already been documented. Tannin acyl hydrolase has been proposed to be the enzyme responsible for that biotransformation. The production of this hydrolase has been tested among a wide range of species isolated from grape must and wine, with L. plantarum being the only one with the ability to produce this enzyme.29 In line with this finding, other authors found that L. plantarum was able to produce EA from ellagitannins, enhancing, as a result, the antioxidant action of such phytochemicals in vitro, when recreating gastrointestinal conditions (37 °C, for 3 h)30 and alongside MRS (30 °C, 5 days).20,21
Pomegranate derivatives have gained a huge interest in the last 20 years. It has been proven that there are other microorganisms, such as Aspergillus niger, with the ability to transform ellagitannins into EA.31 As far as we are concerned, this is the first time that L. sakei, L. mesenteroides, E. hirae, L. garvieae, L. casei, and E. durans are tested for the in vitro biodegradation of ellagitannins and the first time that Lacticaseibacillus paracasei,32E. faecium,33 and L. lactis(33) are tested for punicalagin degradation, specifically. Therefore, the results from the present study confirm the ability of certain LAB to facilitate the biodegradation of punicalagin into EA and identify specific strains with particular potential in the formation of bioactive compounds. This finding is of remarkable scientific interest as the occurrence of Lactobacilli as well as Enterococcus spp. in the small intestine would contribute to degrading dietary punicalagin into EA that could, in turn, be later absorbed or transformed into urolithins by other bacteria in the colon.
Table 3 shows the concentration of EA in the medium in which all strains were tested. Among all, L. paracasei 74 showed a better conversion rate of punicalagin into EA (4.67%), followed by L. plantarum 295 (4.50%) and L. plantarum 284 (3.93%). Despite achieving a higher transformation ratio than our bacterium selected to conduct proteomic analyses (L. plantarum 89, 3.75%; E. faecium 126, 3.72%), these bacteria were not selected due to the disparity between the results on ellagic acid content between the samples that were tested in the assay. Bacteria with the lowest conversion rates were E. faecium 37 and L. sakei 195 (3.34 and 3.27%, respectively), yet their numbers were also highly remarkable. Our results indicate that the ability of LAB to metabolize punicalagin from a pomegranate extract into ellagic acid could be a strain-specific ability, but further research has to be done on that topic. While the production of EA in the experimental units is noticeable, the conversion rates indicate that a relatively small percentage of punicalagin was eventually converted. This could be explained by the imbalance between the concentration of precursor and the bacteria counts and/or the high affinity of punicalagin to bind biomolecules (i.e., proteins), which would hinder its degradation by bacteria.34
Other authors conducted similar experiments using pomegranate juice (PJ) as a source of ellagitannins.20,21 PJ is made by the extrusion of arils, and it seems that the quantity of punicalagin in arils (4100 ± 200 μg/L) is significantly lower than that in the peel or mesocarp (10 543.4 ± 468.0 and 20 314.8 ± 701.0 mg/kg, respectively).15 Yet, the quantity of punicalagin in PJ is highly variable as it depends on the cultivar and on the parts of the fruit employed in the extraction process, either the arils or the whole fruit. The quantity of punicalagin aril pomegranate juice ranges from 4100 to 233 000 μg/L, and in whole fruit pomegranate juice ranges from 166 000 to 800 000 μg/L.35 Taking this into account, the production of ellagic acid when fermenting PJ with assorted L. plantarum strains (from 6400 ± 200 to 7100 ± 300 μg EA/L) vs control (no bacteria) (4900 ± 200 μg EA/L) was not as impressive as the numbers obtained in this research.20 However, the quantity of punicalagin was not measured in that research, so we are not able to calculate the conversion rate from punicalagin to ellagic acid. However, given that the punicalagin concentration in PJ produced from certain varieties of pomegranate arils reaches 233 000 μg/L, an increase of 1500 μg/L in EA is not as noticeable as our average 1131.55 μg/L increase starting from 30 000 μg/L of punicalagin. It also deserves to be highlighted that the fermentation conditions reported in that previous study differ from those in our research in terms of time (120 vs 24 h) and temperature (30 vs 37 °C). Due to this fact, in our experiment where an extract made by pomegranate mesocarp was incubated, the concentration of EA reached up to 20 times more when fermented than that of the extract that was not exposed to a probiotic 1131.55 ± 329.10 vs 54.21 ± 17.78 μg/L.
The pomegranate food supplement used in the present study was produced from mesocarp, and that explains the higher concentration of punicalagin (300 mg/g) in the reaction medium compared to that reported in other studies in which PJ was used. Furthermore, our research was made using a fraction of the pill used as a supplement to avoid possible solubility problems in the final volume used for each batch (15 mL). The whole pill had 183 mg of punicalagin on average, which means that eating this extract would confer the same benefits as drinking a full liter of PJ in terms of antioxidant activity. In addition, other ellagitannins are also present in pomegranate extracts and will add differences in the quantity of precursors of the ellagic acid released.36 These results emphasize the relevance of using punicalagin-rich plant sources to perform an efficient and biologically relevant biosynthesis of EA. Furthermore, considering that such materials are typically nonedible tissues from fruits, using such waste materials is of both economic and environmental interest.
While both punicalagin, like other ellagitannins, and EA display antioxidant properties, the low bioavailability and poor absorption of the former make the biotransformation of punicalagin into EA a key biochemical transformation in terms of intestinal uptake and bioactivity.37 EA has, in fact, a better absorption in the gut than punicalagin.38 EA provides protection against oxidative stress due to its radical scavenging activity and its ability to promote the synthesis and activity of antioxidant enzymes such as superoxide dismutase (SOD), glutathione peroxidase (GPx), glutathione reductase (GR), and catalase (CAT).39,40 In addition to this antioxidant property, EA displays anti-inflammatory activity by modulating the formation of proinflammatory cytochemokines (IL-6, TNF-α, IL-8, IL-12, etc.).40,41 There is some therapeutical potential attributed to EA when administered in cancer or in combination with cancer treatments,40 but more clinical studies have to be carried out.
While the ability of these LAB to produce EA from pomegranate ellagitannins is proven in the present study, the implication of the bacteria in the biotransformation of EA into urolithins was not observed in the present experiment. Neither urolithin A nor urolithin B was found in the conditions of the present experiment. In contrast, in human trials, 10.61 μg/mL urolithins were found in plasma after 6 h from the intake of 1.77 mg/mL EA,42 which indicates a 0.6% conversion rate. Hence, it is obvious that even if the LAB under study may facilitate the initial degradation of punicalagin into EA, other common components of human microbiota of the Eggerthellaceae family, such as Gordonibacter and Ellagibacter, are needed for the subsequent biotransformation of EA into urolithins, as previously reported.18,19 The formation of these bioactive species involves an additional relevant step in the biodegradation of ellagitannins as urolithins have been found to be highly bioavailable and display further health-promoting activities.16 Under physiological conditions, the EA escaping from ileal absorption continues its path through the GIT where it is metabolized into urolithins, as we already discussed in the Introduction section.18,19
According to the present results, the combination of dietary pomegranate with a probiotic bacterium (i.e., L. plantarum) could be an efficient means to guarantee the degradation of punicalagin into bioactive compounds with potential benefits on human health. A recent systematic review43 gathered all of the data available regarding the antioxidant activity and health benefits provided by pomegranate consumption. Dietary pomegranate enables a significant reduction of plasma malonaldehyde (MDA), a lipid peroxidation biomarker, in patients with any kind of pro-oxidative disease when treated for 8 or more weeks.43 Inversely, glutathione peroxidase (GPx) increases when unhealthy people were treated, and it lasted for more than 8 weeks.43 An increase in the total antioxidant capacity (TAC) and superoxide dismutase (SOD) activity in plasma was observed.4343 Oxidative stress has been linked to many diseases such as hypertension, atherosclerosis, cardiovascular disease, or cancer.44 The occurrence of the biodegradation described in the present study under physiological conditions as well as the bioactive effects in vivo requires further research.
To shed light on the mechanisms involved in this transformation by LAB, bacteria cocultured in this analysis were analyzed by comparative proteomics to find out which proteins were over- or underexpressed and see if there is any metabolic pathway affected to face the presence of punicalagin in the medium.
Influence of Punicalagin-Rich Pomegranate Supplement on Lactic Acid Bacteria Proteome
General Overview of the Effect of Punicalagin on Bacterial Biological Processes
Spectral data were analyzed by MaxQuant software, enabling the acquisition and comparison of the proteomes between B and B + P groups for the selected bacteria. Among all of the strains assessed, L. plantarum 89, L. paracasei 126, and E. faecium 74 were chosen due to their use as a probiotic in many treatments, especially the first one. Strains from all three of these species have been proven to be a helpful tool in diminishing inflammation in diseases such as ulcerative colitis or irritable bowel syndrome.45−48 The proteins, from the three strains evaluated, exhibited higher relative abundance in comparison with their counterparts from the B group, with statistically significant differences (presented in Table 4). After that, data were processed with GeneOntology enrichment software, ClueGo.
Table 4. Proteins Found in Higher Relative Quantity among Three Strains with Statistical Significance (p < 0.05).
|
E. faecium |
L. paracasei |
L. plantarum |
|||
|---|---|---|---|---|---|
| protein name | Log2 fold change | protein name | Log2 fold change | protein name | Log2 fold change |
| phosphocarrier protein HPr | 2.067 | uncharacterized protein encoded in the toxicity protection region of plasmid R478 contains the von Willebrand factor (VWF) domain | 2.338 | extracellular transglycosylase | 1.682 |
| 50S ribosomal protein L36 | 1.968 | uncharacterized protein | 2.168 | 50S ribosomal protein L35 | 1.496 |
| ribonucleoside-diphosphate reductase subunit β | 1.822 | septum formation initiator | 2.167 | extracellular transglycosylase | 1.491 |
| peptidoglycan hydrolase | 1.686 | cell wall-associated hydrolase | 2.042 | citrate transport protein | 1.397 |
| NlpC/P60 family lipoprotein | 1.545 | uncharacterized protein | 1.993 | 50S ribosomal protein L33 | 1.378 |
| carbamoyl-phosphate synthase large chain | 1.527 | cell wall-associated hydrolase | 1.912 | extracellular transglycosylase, membrane-bound | 1.254 |
| BglG family transcription antiterminator | 1.487 | protein RecA | 1.897 | extracellular transglycosylase, with LysM peptidoglycan-binding domain | 1.211 |
| DNA-binding response regulator | 1.460 | WxL domain-containing protein | 1.814 | glutathione reductase | 1.206 |
| N-acetylmuramoyl-l-alanine amidase | 1.313 | surface antigen | 1.755 | extracellular transglycosylase, with LysM peptidoglycan-binding domain | 1.175 |
| GTP diphosphokinase | 1.310 | predicted outer membrane protein | 1.674 | serine-type d-Ala-d-Ala carboxypeptidase | 1.165 |
| protein RecA | 1.275 | uncharacterized protein | 1.627 | 30S ribosomal protein S20 | 1.105 |
| ribosome-recycling factor | 1.274 | cell wall-associated hydrolase | 1.551 | extracellular protein, NlpC/P60 family.γ-d-glutamate-meso-diaminopimelate muropeptidase | 0.948 |
| 30S ribosomal protein S21 | 1.240 | surface antigen | 1.502 | NADH oxidase | 0.930 |
| ribonucleoside-diphosphate reductase | 1.177 | 50S ribosomal protein L23 | 1.475 | anaerobic ribonucleoside-triphosphate reductase | 0.920 |
| peptidoglycan hydrolase | 1.157 | energy-coupling factor transporter ATP-binding protein EcfA2 | 1.429 | RNA-binding protein, the YhbY family | 0.914 |
| mannosyl-glycoprotein endo-β-N-acetylglucosamidase | 1.155 | NusG_II domain-containing protein | 1.313 | DNA-entry nuclease | 0.845 |
| DNA gyrase subunit A | 1.149 | predicted membrane protein | 1.304 | 50S ribosomal protein L29 | 0.844 |
| DNA-binding response regulator | 1.134 | uncharacterized protein | 1.243 | deoxyadenosine kinase/deoxyguanosine kinase | 0.815 |
| chromosome partitioning protein ParB | 1.069 | uncharacterized protein | 1.208 | 30S ribosomal protein S16 | 0.799 |
| leucine–tRNA ligase | 0.962 | cell surface protein | 1.189 | nucleoside 2-deoxyribosyltransferase | 0.789 |
| 50S ribosomal protein L18 | 0.954 | lactocepin I, serine peptidase, MEROPS family S08A | 1.153 | 50S ribosomal protein L36 | 0.751 |
| ABC superfamily ATP-binding cassette transporter, ABC protein | 0.947 | β-N-acetylhexosaminidase | 1.147 | pyruvate oxidase | 0.749 |
| 50S ribosomal protein L29 | 0.944 | uncharacterized protein | 1.132 | pseudouridine synthase | 0.730 |
| ribose-5-phosphate isomerase A | 0.940 | β-fructosidase (levanase/invertase) | 1.124 | 50S ribosomal protein L32 | 0.726 |
| 50S ribosomal protein L11 | 0.929 | cyclic-di-AMP phosphodiesterase | 1.114 | large-conductance mechanosensitive channel | 0.707 |
| 50S ribosomal protein L14 | 0.929 | 50S ribosomal protein L33 | 1.089 | tRNA modification GTPase MnmE | 0.692 |
| UvrABC system protein A | 0.914 | DD-transpeptidase | 1.086 | peroxidase | 0.686 |
| ATP-dependent Clp protease ATP-binding subunit ClpX | 0.902 | N-acetylmuramoyl-l-alanine amidase | 1.083 | ferredoxin–NADP reductase | 0.681 |
| DNA topoisomerase 4 subunit B | 0.859 | β-lactamase class C-related penicillin-binding protein | 1.074 | uncharacterized protein | 0.679 |
| transcription termination factor Rho | 0.813 | uncharacterized protein | 1.067 | single-stranded DNA-binding protein | 0.677 |
| 50S ribosomal protein L19 | 0.806 | 30S ribosomal protein S20 | 1.061 | extracellular protein, the DUF1002 family | 0.662 |
| glutamine–fructose-6-phosphate aminotransferase [isomerizing] | 0.781 | 50S ribosomal protein L30 | 1.032 | extracellular protein, the DUF2140 family | 0.657 |
| KR domain-containing protein | 0.775 | WxL domain-containing protein | 0.997 | cell wall hydrolase/muramidase | 0.652 |
| Bifunctional oligoribonuclease/PAP phosphatase NrnA | 0.762 | acyl carrier protein | 0.989 | sortase A | 0.652 |
| UvrABC system protein B | 0.732 | peptidoglycan transpeptidase; the ErfK-YbiS-YhnG family | 0.978 | ABC transporter, ATP-binding protein | 0.626 |
| DNA-binding protein HU | 0.723 | ATPase component of ABC transporter with duplicated ATPase domains | 0.965 | extracellular transglycosylase with the LysM peptidoglycan-binding domain | 0.586 |
| redox-sensing transcriptional repressor Rex | 0.672 | amino acid/polyamine/organocation transporter. APC superfamily | 0.942 | deoxynucleoside kinase | 0.573 |
| peptide chain release factor 3 | 0.656 | predicted secreted protein | 0.936 | adherence protein, chitin-binding domain | 0.571 |
| 30S ribosomal protein S15 | 0.618 | transcriptional regulator | 0.924 | extracellular protein, membrane-anchored | 0.570 |
| asparaginase | 0.592 | uncharacterized protein | 0.922 | translation initiation factor IF-1 | 0.568 |
| 50S ribosomal protein L13 | 0.580 | phospholipase A2 family enzyme | 0.921 | extracellular protein, γ-d-glutamate-meso-diaminopimelate muropeptidase | 0.561 |
| ribosome-binding ATPase YchF | 0.578 | predicted xylanase/chitin deacetylase | 0.921 | cell surface protein. membrane-anchored | 0.549 |
| valine–tRNA ligase | 0.521 | DUF4430 domain-containing protein | 0.866 | kojibiose-like phosphorylase. specific | 0.549 |
| FMN-binding domain-containing protein | 0.517 | acetoin/pyruvate dehydrogenase complex, E3 component, dihydrolipoamide dehydrogenase | 0.861 | nitroreductase family protein | 0.539 |
| ATP-dependent DNA helicase | 0.504 | predicted membrane protein | 0.860 | Fe-S_biosyn domain-containing protein | 0.533 |
| 30S ribosomal protein S20 | 0.496 | uncharacterized protein | 0.860 | extracellular protein | 0.531 |
| DNA gyrase subunit B | 0.495 | TPR repeats containing protein | 0.814 | thymidylate synthase | 0.524 |
| 30S ribosomal protein S12 | 0.468 | β-propeller domains of methanol dehydrogenase type | 0.800 | phosphoglycerate mutase family protein | 0.520 |
| DNA-directed RNA polymerase subunit β | 0.454 | lyase_8_N domain-containing protein | 0.790 | oligopeptide ABC transporter, permease protein | 0.515 |
| infA | 0.435 | glycerophosphoryl diester phosphodiesterase | 0.788 | lipoprotein, FMN-binding protein | 0.513 |
| probable succinyl-diaminopimelate desuccinylase | 0.409 | ABC-type Na+ efflux pump, permease component | 0.765 | acyl-[acyl-carrier protein] thioesterase | 0.501 |
| DUF1797 domain-containing protein | 0.378 | transcriptional regulator | 0.741 | preprotein translocase, the YajC subunit | 0.489 |
| acyl carrier protein | 0.364 | uncharacterized protein | 0.728 | rod-shape-determining protein | 0.485 |
| glutamate–tRNA ligase | 0.359 | amino acid ABC transporter membrane protein, PAAT family/amino acid ABC transporter substrate-binding protein; PAAT family | 0.712 | transcription regulator, the LysR family | 0.482 |
| formamidopyrimidine-DNA glycosylase | 0.346 | trypsin-like serine protease with the PDZ domain | 0.702 | spermidine/putrescine ABC transporter, substrate-binding protein | 0.481 |
| GTPase Obg | 0.345 | DNA-directed RNA polymerase subunit omega | 0.693 | ABC transporter, ATP-binding protein | 0.475 |
| 30S ribosomal protein S10 | 0.301 | uncharacterized protein | 0.682 | acetaldehyde dehydrogenase | 0.469 |
| pyrrolidone-carboxylate peptidase | 0.301 | α-glucosidase, family 31 of glycosyl hydrolase | 0.672 | ribonucleoside-diphosphate reductase | 0.465 |
| septation ring formation regulator EzrA | 0.280 | ABC-type uncharacterized transport system, periplasmic component | 0.671 | ABC transporter, substrate-binding protein | 0.461 |
| UDP-glucose 4-epimerase | 0.241 | ABC-type oligopeptide transport system, periplasmic component | 0.663 | ABC transporter, substrate-binding protein | 0.460 |
| DNA-directed RNA polymerase subunit α | 0.199 | transcriptional regulator | 0.621 | RNA-binding protein | 0.459 |
| GMP synthase [glutamine-hydrolyzing] | 0.196 | uncharacterized protein | 0.607 | probable cell wall amidase lytH | 0.458 |
For L. plantarum 89, 1021 proteins were identified, among which 362 showed a significant (p < 0.05) increase when exposed to punicalagin (Table S1). Seven of these proteins were only found when bacteria were incubated with the phytochemical (B +P vs B). The distribution of all of these proteins after gene ontology enrichment is shown in Figure S2. Briefly, the most represented group is the non-membrane-bound organelle (48% of the proteins), followed by anion binding (20%) and cellular component organization (14%).
Although there are different locations/functions given by the software, there are some proteins that are settled in two or more of these groups. For instance, serine-type d-Ala-d-Ala carboxypeptidase, which is found to be one with a higher fold change in B + P with respect to B, belongs to the group of non-membrane-bound organelle, cellular component organization, and carbohydrate synthesis process. Glutathione reductase belongs to anion binding and flavin adenine dinucleotide binding. All ribosomal proteins are located in the non-membrane-bound organelle as they should. ATP-binding cassette (ABC) transporters are included mainly in anion binding and intrinsic components of the membrane. Extracellular transglycosylases were the main group that was increased by exposure to punicalagin, but they were not associated with any of the given cellular functions.
Eighty-three out of 1021 were diminished in B + P, while five of them were only present in B (Table S1).
All of these proteins with a significant decrease were grouped mainly into the pyrimidine ribonucleotide metabolic process (85.0%). Metal ion binding, hydrolase activity, uracil phosphoribosyltransferase, and cytoplasm activity-related enzymes were also diminished in this fermentation.
In L. paracasei 126, 939 proteins were identified (Table S2), of which 122 were significantly increased in B + P compared to the B counterpart (Table 4). In this case, there were no proteins identified only in the B + P samples. The majority of those 122 proteins were grouped as serine-type peptidase activity (Figure S3). Some of the proteins with the most variation between groups could not be identified by the software and were labeled as “uncharacterized proteins”. By searching on a database by their molecular weight, we found out that they might be associated with cell division or catalytic function (hydrolase, peptidase, hydrogenase, etc.). Interestingly, some cell wall-associated hydrolases were found to be increased in L. paracasei when challenged with punicalagin. Their function might be similar to that of the transglycosylases described in L. plantarum. As well as in the previous probiotic, the ribosomal proteins in L. paracasei were also affected probably due to their association with an increase in the growth rate. A really interesting protein associated with anti-inflammatory properties is lactocepin, which has been found in Lactobacillus genus.49 The occurrence of punicalagin in the medium enhanced the production of this bioactive protein by L. paracasei.
One hundred and seventy-one out of 939 were diminished in B + P, while 37 of them were only present in B samples (Table S2).
Those proteins were classified as nucleotide metabolic process (37.5%), organic acid metabolic process (18.75%), nucleotide binding (15.62%), and organonitrogen compound metabolic process (14.06%) predominantly.
For E. faecium 74, 399 proteins were identified, among which 62 had significant increases vs the B group. Only one protein was found in the B + P groups and not found in the B counterpart (Table S3). Those discriminating proteins were classified, as shown in Figure S4. Non-membrane-bound organelle was the group with more proteins affected (52.17%), closely followed by DNA topological change (45.65%) and with a little reminiscent of nucleotide-excision repair (2.17%; Figure S4). Among the ones with increased production in the presence of punicalagin, there are some peptidoglycan/murein hydrolases, showing that even though it belongs to another genus, the proteins in charge of breaking those bonds are still increased.
A protein highlighted in this analysis is phosphocarrier protein HPr, found in many bacteria to be an essential component of the sugar-transporting phosphotransferase system and playing a role in carbohydrate metabolization by interacting with enzymes dedicated to do so.50 Those proteins found in higher quantities were classified, as shown in Figure S4.
One hundred and fifty-three out of 399 proteins were diminished in B + P, while 41 of them were only present in B (Table S3).
Those proteins were grouped into the organonitrogen compound metabolic process (29.17%), organic acid metabolic process (24.17%), peptide biosynthetic process (20%), and nucleotide binding (9.17%) mainly. Three of them were also present in L. paracasei diminished pool of proteins.
On our proteomic analysis, at first sight, we could confirm that the presence of the extract has promoted the proliferation and faster-growing pace of the bacteria selected in vitro, as other colleagues tested beforehand.51 A huge increase in a wide variety of ribosomal proteins, known to translate RNA into proteins, was observed (Table 4).
Implication of Specific Proteins in Punicalagin Metabolism
The degradation of punicalagin into bioactive components requires the implication of bacterial enzymes such as the ellagitannin acyl hydrolase, which takes part in the metabolism of ellagitannins.52 However, this specific protein was not found in the proteome of the selected bacteria. Hence, it is obvious that other hydrolytic enzymes would be able to degrade punicalagin and hence explain the remarkable increase in EA found in the present study. In fact, some proteins with generic names associated with hydrolyzation might be plausible candidates implicated in this relevant pathway. Proteins potentially involved in the punicalagin hydrolysis are shown in Table 5. As we already showed from our substantial protein database, some transglycosylase/cell wall hydrolases have been found in every genus assessed. Certain lytic transglycosylases are capable of breaking cell walls to expand or reshape this cell structure after a cell division. It is reasonable to consider that these enzymes, in addition to catalyzing the scission of β-1,4 bonds between murein monomers, could have a role in hydrolyzing such bonds between the aromatic rings and the glucose present in punicalagin. This could potentially release hexahydroxydiphenic acid (HHDP) into the medium, a molecule that due to its better stability would be transformed into EA53 (Figure 1).
Table 5. Proteins Identified Suspects of Being Involved in Punicalagin Hydrolysisa.
|
E. faecium |
L. paracasei |
L. plantarum |
|||
|---|---|---|---|---|---|
| protein name | Log2 fold change | protein name | Log2 fold change | protein name | Log2 fold change |
| peptidoglycan hydrolase | 1.686 | cell wall-associated hydrolase | 2.042 | extracellular transglycosylase | 1.682 |
| N-acetylmuramoyl-l-alanine amidase | 1.313 | cell wall-associated hydrolase | 1.912 | extracellular transglycosylase | 1.491 |
| peptidoglycan hydrolase | 1.157 | cell wall-associated hydrolase | 1.551 | extracellular transglycosylase membrane-bound | 1.254 |
| mannosyl-glycoprotein endo-β-N-acetylglucosamidase | 1.155 | N-acetylmuramoyl-l-alanine amidase | 1.083 | extracellular transglycosylase with LysM peptidoglycan-binding domain | 1.211 |
| peptidoglycan transpeptidase, the ErfK-YbiS-YhnG family | 0.978 | extracellular transglycosylase with the LysM peptidoglycan-binding domain | 1.175 | ||
| extracellular protein, the NlpC/P60 family, γ-d-glutamate-meso-diaminopimelate muropeptidase | 0.948 | ||||
| cell wall hydrolase/muramidase | 0.652 | ||||
| extracellular transglycosylase with the LysM peptidoglycan-binding domain | 0.586 | ||||
| extracellular protein, γ-d-glutamate-meso-diaminopimelate muropeptidase | 0.561 | ||||
| probable cell wall amidase lytH | 0.458 | ||||
Fold change with respect to their nontreated counterpart groups (p < 0.05).
Moreover, in E. faecium, we identified mannosyl-glycoprotein endo-β-N-acetylglucosamidase, which has been proven to be responsible for breaking oligosaccharides in the cytosol.54 Additionally, the enzyme γ-d-glutamate-meso-diaminopimelate muropeptidase, associated with the probiotic L. plantarum, has been identified as cell wall hydrolase and glutamic acid hydrolase.55
To the best of our knowledge, this is the first evaluation of the impact of a potential bioactive compound in LAB proteome, which further transforms it into a more bioavailable compound. The results obtained point to the higher quantity of proteins with glycolytic activity in three quite different species, which are seemingly working by degrading punicalagin into less-complex substances. In this sense and considering the relatively high size of punicalagin, it is not expected to be uptaken without the requirement of any bacterial transporter machinery. We found a higher quantity of ATP-binding cassette (ABC) transporter-related proteins in all three strains when exposed to punicalagin. ABC transporters are ATP-mediated membrane proteins whose role is no other than transferring molecules through the cell wall. The main ABC transporters found are displayed in Table 6.
Table 6. ABC Transporter-Related Proteins Found in All Three Bacteria Testeda.
|
E. faecium |
L. paracasei |
L. plantarum |
|||
|---|---|---|---|---|---|
| protein name | Log2 fold change | protein name | Log2 fold change | protein name | Log2 fold change |
| ABC superfamily ATP-binding cassette transporter ABC protein | 0.947 | ATPase component of ABC transporter with duplicated ATPase domains | 0.965 | ABC transporter. ATP-binding protein | 0.626 |
| UvrABC system protein A | 0.914 | ABC-type Na+ efflux pump, permease component | 0.765 | oligopeptide ABC transporter, permease protein | 0.515 |
| UvrABC system protein B | 0.732 | amino acid ABC transporter membrane protein, PAAT family/amino acid ABC transporter substrate-binding protein, the PAAT family | 0.712 | spermidine/putrescine ABC transporter substrate-binding protein | 0.481 |
| ABC-type uncharacterized transport system, periplasmic component | 0.671 | ABC transporter. ATP-binding protein | 0.475 | ||
| ABC-type oligopeptide transport system, periplasmic component | 0.663 | ABC transporter, substrate-binding protein | 0.461 | ||
| ABC transporter, substrate-binding protein | 0.460 | ||||
Fold change with respect to their nontreated counterpart groups (p < 0.05).
As research shows,56 these transporters import nutrients, export molecules, and play a role in many other cell functions. It could be possible that to get energy from it, they import punicalagin, degrade it, and export ellagic acid to avoid possible antimicrobial activity.
Our hypothesis is that the presence of a new compound that is unable to pass through the membrane by passive diffusion may increase the need for the cells to create new bridges to transfer it into their cytoplasm. Thus, although further studies are required to confirm this asseveration, the higher quantity of this type of protein, with a quite specific function in the three different tested species, suggests a key role of these proteins in the punicalagin biotransformation by LAB, as shown in Figure 1.
In conclusion, this work has demonstrated the ability of 30 different LAB to transform a complex phytochemical with low bioavailability, punicalagin, into simpler molecules, including the bioavailable ellagic acid. This enables a rational procedure to transform punicalagin from a byproduct, pomegranate mesocarp, into a useful molecule. The most efficient way of application, in vivo or in vitro, should be further explored. Additionally, molecular mechanisms underlying this biotransformation by LAB are originally reported through label-free comparative proteomics. This approach has shed light on the way that punicalagin is transformed, pointing to two potential mechanisms involved: degradation by hydrolytic enzymes and intake/export through ABC transporters. The lack of degradation of EA into urolithins emphasizes the necessity of the implication of other bacteria from microbiota to synthesize these bioactive species in vivo.
Glossary
Abbreviations
- LAB
lactic acid bacteria
- ABC transporters
ATP-binding cassette transporters
- GIT
gastrointestinal tract
- EA
ellagic acid
- PJ
pomegranate juice
Supporting Information Available
The Supporting Information is available free of charge at https://pubs.acs.org/doi/10.1021/acs.jafc.2c06585.
Extracted ion chromatogram (EIC) of standard compounds punicalagin (m/z 1083.0593), ellagic acid (m/z 300.9990), and both urolithin A (m/z 227.0350) and B (m/z 211.0401) (Figure S1); distribution by function of proteins found in higher relative quantity in L. plantarum in the presence of 30 μg/mL punicalagin (Figure S2); distribution by function of proteins found in higher relative quantity in L. paracasei in the presence of 30 μg/mL punicalagin (Figure S3); distribution by function of proteins found in higher relative quantity in E. faecium in the presence of 30 μg/mL punicalagin (Figure S4); proteins identified in this study for L. plantarum 89 along with Log2 fold change (in blue) and significance values (p, in red) of the 30 μg/mL punicalagin (P) treatment in comparison to the nontreated control (B) (Table S1); proteins identified in this study for L. paracasei 126 along with Log2 fold change (in blue) and significance values (p, in red) of the 30 μg/mL punicalagin (P) treatment in comparison to the nontreated control (B) (Table S2); proteins identified in this study for E. faecium 74 along with Log2 fold change (in blue) and significance values (p, in red) of the 30 μg/mL punicalagin (P) treatment in comparison to the nontreated control (B) (Table S3). (PDF)
Author Contributions
M.E. conceived the project and finalized the manuscript. M.E., J.D., and V.C. designed the experiments. J.D., V.C., and D.M. analyzed the data. I.M. conducted the isolation and characterization of bacteria. V.C. collected the samples, conducted the experiments, performed UHPLC-MS, and drafted the manuscript. All authors contributed to interpreting the data and reviewed the manuscript.
Support from the Spanish Ministry of Economics and Competitiveness (SMEC) through the project AGL2017-84586R is acknowledged. A Q-Exactive mass spectrometer for proteomic research was acquired by the grant UNEX-AE-3394 funded by MCIN/AEI/10.13039/501100011033 and by “ERDF A way of making Europe”.
The authors declare no competing financial interest.
Supplementary Material
References
- Kamada N.; Chen G. Y.; Inohara N.; Núñez G. Control of pathogens and pathobionts by the gut microbiota. Nat Immunol. 2013, 14, 685–690. 10.1038/ni.2608. [DOI] [PMC free article] [PubMed] [Google Scholar]
- Rodríguez J. M.; Murphy K.; Stanton C.; et al. The composition of the gut microbiota throughout life, with an emphasis on early life. Microb. Ecol. Health Dis. 2015, 26, 26050 10.3402/mehd.v26.26050. [DOI] [PMC free article] [PubMed] [Google Scholar]
- Carding S.; Verbeke K.; Vipond D. T.; Corfe B. M.; Owen L. J. Dysbiosis of the gut microbiota in disease. Microb. Ecol. Health Dis. 2015, 26, 26191 10.3402/mehd.v26.26191. [DOI] [PMC free article] [PubMed] [Google Scholar]
- Health and Nutritional Properties of Probiotics in Food Including Powder Milk with Live Lactic Acid Bacteria, 2001.
- Liu Y.; Zheng S.; Cui J.; Guo T.; Zhang J. Lactiplantibacillus plantarum Y15 alleviate type 2 diabetes in mice via modulating gut microbiota and regulating NF-κB and insulin signaling pathway. Braz. J. Microbiol. 2022, 53, 935. 10.1007/s42770-022-00686-5. [DOI] [PMC free article] [PubMed] [Google Scholar]
- Zeng Z.; Guo X.; Zhang J.; Yuan Q.; Chen S. Lactobacillus paracasei modulates the gut microbiota and improves inflammation in type 2 diabetic rats. Food Funct. 2021, 12, 6809–6820. 10.1039/d1fo00515d. [DOI] [PubMed] [Google Scholar]
- Ding L. N.; Ding W. Y.; Ning J.; Wang Y.; Yan Y.; Wang Z. b. Effects of probiotic supplementation on inflammatory markers and glucose homeostasis in adults with type 2 diabetes mellitus: A systematic review and meta-analysis. Front. Pharmacol. 2021, 12, 770861 10.3389/fphar.2021.770861. [DOI] [PMC free article] [PubMed] [Google Scholar]
- Mardini H. E.; Grigorian A. Y. Probiotic mix VSL#3 is effective adjunctive therapy for mild to moderately active ulcerative colitis: A meta-analysis. Inflammatory Bowel Dis. 2014, 20, 1562–1567. 10.1097/MIB.0000000000000084. [DOI] [PubMed] [Google Scholar]
- Guglielmetti S.; Mora D.; Gschwender M.; Popp K. Randomised clinical trial: Bifidobacterium bifidum MIMBb75 significantly alleviates irritable bowel syndrome and improves quality of life - A double-blind, placebo-controlled study. Aliment. Pharmacol. Ther. 2011, 33, 1123–1132. 10.1111/j.1365-2036.2011.04633.x. [DOI] [PubMed] [Google Scholar]
- Selma M. V.; Espín J. C.; Tomás-Barberán F. A. Interaction between phenolics and gut microbiota: Role in human health. J. Agric. Food Chem. 2009, 57, 6485–6501. 10.1021/jf902107d. [DOI] [PubMed] [Google Scholar]
- Hervert-Hernández D.; Goñi I. Dietary polyphenols and human gut microbiota: A review. Food Rev. Int. 2011, 27, 154–169. 10.1080/87559129.2010.535233. [DOI] [Google Scholar]
- Seeram N. P.; Adams L. S.; Henning S. M.; et al. In vitro antiproliferative, apoptotic and antioxidant activities of punicalagin, ellagic acid and a total pomegranate tannin extract are enhanced in combination with other polyphenols as found in pomegranate juice. J. Nutr. Biochem. 2005, 16, 360–367. 10.1016/j.jnutbio.2005.01.006. [DOI] [PubMed] [Google Scholar]
- Bialonska D.; Ramnani P.; Kasimsetty S. G.; Muntha K. R.; Gibson G. R.; Ferreira D. The influence of pomegranate by-product and punicalagins on selected groups of human intestinal microbiota. Int. J. Food Microbiol. 2010, 140, 175–182. 10.1016/j.ijfoodmicro.2010.03.038. [DOI] [PubMed] [Google Scholar]
- Matthaiou C. M.; Goutzourelas N.; Stagos D.; et al. Pomegranate juice consumption increases GSH levels and reduces lipid and protein oxidation in human blood. Food Chem. Toxicol. 2014, 73, 1–6. 10.1016/j.fct.2014.07.027. [DOI] [PubMed] [Google Scholar]
- Fischer U. A.; Carle R.; Kammerer D. R. Identification and quantification of phenolic compounds from pomegranate (Punica granatum L.) peel, mesocarp, aril and differently produced juices by HPLC-DAD-ESI/MSn. Food Chem. 2011, 127, 807–821. 10.1016/j.foodchem.2010.12.156. [DOI] [PubMed] [Google Scholar]
- Tomás-Barberán F. A.; González-Sarrías A.; García-Villalba R.; et al. Urolithins, the rescue of “old” metabolites to understand a “new” concept: Metabotypes as a nexus among phenolic metabolism, microbiota dysbiosis, and host health status. Mol. Nutr. Food Res. 2017, 61, 1500901 10.1002/mnfr.201500901. [DOI] [PubMed] [Google Scholar]
- Singh R.; Chandrashekharappa S.; Bodduluri S. R.; et al. Enhancement of the gut barrier integrity by a microbial metabolite through the Nrf2 pathway. Nat. Commun. 2019, 10, 89 10.1038/s41467-018-07859-7. [DOI] [PMC free article] [PubMed] [Google Scholar]
- Selma M. V.; Beltrán D.; García-Villalba R.; Espín J. C.; Tomás-Barberán F. A. Description of urolithin production capacity from ellagic acid of two human intestinal Gordonibacter species. Food Funct. 2014, 5, 1779–1784. 10.1039/c4fo00092g. [DOI] [PubMed] [Google Scholar]
- Beltrán D.; Romo-Vaquero M.; Espín J. C.; Tomás-Barberán F. A.; Selma M. Ellagibacter isourolithinifaciens gen. Nov., sp. Nov., a new member of the family Eggerthellaceae, isolated from human gut. Int. J. Syst. Evol. Microbiol. 2018, 68, 1707–1712. 10.1099/ijsem.0.002735. [DOI] [PubMed] [Google Scholar]
- Filannino P.; Azzi L.; Cavoski I.; et al. Exploitation of the health-promoting and sensory properties of organic pomegranate (Punica granatum L.) juice through lactic acid fermentation. Int. J. Food Microbiol. 2013, 163, 184–192. 10.1016/j.ijfoodmicro.2013.03.002. [DOI] [PubMed] [Google Scholar]
- Pontonio E.; Montemurro M.; Pinto D.; et al. Lactic acid fermentation of pomegranate juice as a tool to improve antioxidant activity. Front. Microbiol. 2019, 10, 1550 10.3389/fmicb.2019.01550. [DOI] [PMC free article] [PubMed] [Google Scholar]
- Martín I.; Rodríguez A.; Alía A.; Martínez R.; Córdoba J. J. Selection and characterization of lactic acid bacteria with activity against Listeria monocytogenes from traditional RTE ripened foods. LWT 2022, 163, 113579 10.1016/j.lwt.2022.113579. [DOI] [Google Scholar]
- Delgado J.; da Cruz Cabral L.; Rodríguez M.; Rodríguez A. Influence of ochratoxin A on adaptation of Penicillium nordicum on a NaCl-rich dry-cured ham-based medium. Int. J. Food Microbiol. 2018, 272, 22–28. 10.1016/j.ijfoodmicro.2018.02.020. [DOI] [PubMed] [Google Scholar]
- Shevchenko A.; Tomas H.; Havliš J.; Olsen J. V.; Mann M. In-gel digestion for mass spectrometric characterization of proteins and proteomes. Nat. Protoc. 2006, 1, 2856–2860. 10.1038/nprot.2006.468. [DOI] [PubMed] [Google Scholar]
- Delgado J.; Núñez F.; Asensio M. A.; Owens R. A. Quantitative proteomic profiling of ochratoxin A repression in Penicillium nordicum by protective cultures. Int. J. Food Microbiol. 2019, 305, 108243 10.1016/j.ijfoodmicro.2019.108243. [DOI] [PubMed] [Google Scholar]
- Luber C. A.; Cox J.; Lauterbach H.; et al. Quantitative proteomics reveals subset-specific viral recognition in dendritic cells. Immunity 2010, 32, 279–289. 10.1016/j.immuni.2010.01.013. [DOI] [PubMed] [Google Scholar]
- Bindea G.; Mlecnik B.; Hackl H.; et al. ClueGO: A Cytoscape plug-in to decipher functionally grouped gene ontology and pathway annotation networks. Bioinformatics 2009, 25, 1091–1093. 10.1093/bioinformatics/btp101. [DOI] [PMC free article] [PubMed] [Google Scholar]
- Ascacio-Valdés J. A.; Aguilera-Carbó A. F.; Buenrostro J. J.; Prado-Barragán A.; Rodríguez-Herrera R.; Aguilar C. N. The complete biodegradation pathway of ellagitannins by Aspergillus niger in solid-state fermentation. J. Basic Microbiol. 2016, 56, 329–336. 10.1002/jobm.201500557. [DOI] [PubMed] [Google Scholar]
- Vaquero I.; Marcobal Á.; Muñoz R. Tannase activity by lactic acid bacteria isolated from grape must and wine. Int. J. Food Microbiol. 2004, 96, 199–204. 10.1016/j.ijfoodmicro.2004.04.004. [DOI] [PubMed] [Google Scholar]
- Valero-Cases E.; Nuncio-Jáuregui N.; Frutos M. J. Influence of fermentation with different lactic acid bacteria and in vitro digestion on the biotransformation of phenolic compounds in fermented pomegranate juices. J. Agric. Food Chem. 2017, 65, 6488–6496. 10.1021/acs.jafc.6b04854. [DOI] [PubMed] [Google Scholar]
- Gumienna M.; Szwengiel A.; Górna B. Bioactive components of pomegranate fruit and their transformation by fermentation processes. Eur. Food Res. Technol. 2016, 242, 631–640. 10.1007/s00217-015-2582-z. [DOI] [Google Scholar]
- Estrada-Gil L.; Contreras-Esquivel J. C.; Flores-Gallegos C.; et al. Recovery of bioactive ellagitannins by ultrasound/microwave-assisted extraction from mexican rambutan peel (Nephelium lappaceum L.). Molecules 2022, 27, 1592 10.3390/molecules27051592. [DOI] [PMC free article] [PubMed] [Google Scholar]
- Cuvas-Limón R. B.; Ferreira-Santos P.; Cruz M.; Teixeira J. A.; Belmares R.; Nobre C. Novel bio-functional aloe vera beverages fermented by probiotic Enterococcus faecium and Lactobacillus lactis. Molecules 2022, 27, 2473 10.3390/molecules27082473. [DOI] [PMC free article] [PubMed] [Google Scholar]
- Kulkarni A. P.; Mahal H. S.; Kapoor S.; Aradhya S. M. In vitro studies on the binding, antioxidant, and cytotoxic action of punicalagin. J. Agric. Food Chem. 2007, 55, 1491–1500. 10.1021/jf0626720. [DOI] [PubMed] [Google Scholar]
- Mathon C.; Chater J. M.; Green A.; et al. Quantification of punicalagins in commercial preparations and pomegranate cultivars, by liquid chromatography–mass spectrometry. J. Sci. Food Agric. 2019, 99, 4036–4042. 10.1002/jsfa.9631. [DOI] [PubMed] [Google Scholar]
- García-Villalba R.; Espín J. C.; Aaby K.; et al. Validated method for the characterization and quantification of extractable and nonextractable ellagitannins after acid hydrolysis in pomegranate fruits, juices, and extracts. J. Agric. Food Chem. 2015, 63, 6555–6566. 10.1021/acs.jafc.5b02062. [DOI] [PubMed] [Google Scholar]
- Heber D.Pomegranate Ellagitannins. In Herbal Medicine: Biomolecular and Clinical Aspects, 2nd ed.; Benzie I. F. F.; Wachtel-Galor S., Eds.; CRC Press/Taylor: Francis, 2011. [PubMed] [Google Scholar]
- González-Sarrías A.; García-Villalba R.; Núñez-Sánchez M. Á.; et al. Identifying the limits for ellagic acid bioavailability: A crossover pharmacokinetic study in healthy volunteers after consumption of pomegranate extracts. J. Funct. Foods 2015, 19, 225–235. 10.1016/j.jff.2015.09.019. [DOI] [Google Scholar]
- Mishra S.; Vinayak M. Ellagic acid inhibits PKC signaling by improving antioxidant defense system in murine T cell lymphoma. Mol. Biol. Rep. 2014, 41, 4187–4197. 10.1007/s11033-014-3289-0. [DOI] [PubMed] [Google Scholar]
- Sharifi-Rad J.; Quispe C.; Castillo C. M. S.; et al. Ellagic acid: A review on its natural sources, chemical stability, and therapeutic potential. Oxid. Med. Cell. Longevity 2022, 2022, 3848084 10.1155/2022/3848084. [DOI] [PMC free article] [PubMed] [Google Scholar] [Retracted]
- Baradaran Rahimi V.; Ghadiri M.; Ramezani M.; Askari V. R. Antiinflammatory and anti-cancer activities of pomegranate and its constituent, ellagic acid: Evidence from cellular, animal, and clinical studies. Phytother. Res. 2020, 34, 685–720. 10.1002/ptr.6565. [DOI] [PubMed] [Google Scholar]
- Seeram N. P.; Henning S. M.; Zhang Y.; Suchard M.; Li Z.; Heber D. Pomegranate juice ellagitannin metabolites are present in human plasma and some persist in urine for up to 48 hours. J. Nutr. 2006, 136, 2481–2485. 10.1093/jn/136.10.2481. [DOI] [PubMed] [Google Scholar]
- Lorzadeh E.; Heidary Z.; Mohammadi M.; Nadjarzadeh A.; Ramezani-Jolfaie N.; Salehi-Abargouei A. Does pomegranate consumption improve oxidative stress? A systematic review and meta-analysis of randomized controlled clinical trials. Clin. Nutr. ESPEN 2022, 47, 117–127. 10.1016/j.clnesp.2021.11.017. [DOI] [PubMed] [Google Scholar]
- Pizzino G.; Irrera N.; Cucinotta M.; et al. Oxidative stress: Harms and benefits for human health. Oxid. Med. Cell. Longevity 2017, 2017, 8416763 10.1155/2017/8416763. [DOI] [PMC free article] [PubMed] [Google Scholar]
- Bosco N.; Oliveira M.; Perruisseau G.; et al. Lactobacillus paracasei reduces intestinal inflammation in adoptive transfer mouse model of experimental colitis. Clin. Dev. Immunol. 2011, 807483 10.1155/2011/807483. [DOI] [PMC free article] [PubMed] [Google Scholar]
- Liu Y.; Yu X.; Yu L.; et al. Lactobacillus plantarum CCFM8610 alleviates irritable bowel syndrome and prevents gut microbiota dysbiosis: A randomized, double-blind, placebo-controlled, pilot clinical trial. Engineering 2021, 7, 376–385. 10.1016/j.eng.2020.06.026. [DOI] [Google Scholar]
- He W.; Ni W.; Zhao J. Enterococcus faecium alleviates gut barrier injury in c57bl/6 mice with dextran sulfate sodium-induced ulcerative colitis. Gastroenterol. Res. Pract. 2021, 2021, 2683465 10.1155/2021/2683465. [DOI] [PMC free article] [PubMed] [Google Scholar]
- Le B.; Yang S. H. Efficacy of Lactobacillus plantarum in prevention of inflammatory bowel disease. Toxicol. Rep. 2018, 5, 314–317. 10.1016/j.toxrep.2018.02.007. [DOI] [PMC free article] [PubMed] [Google Scholar]
- von Schillde M. A.; Hörmannsperger G.; Weiher M.; et al. Lactocepin secreted by Lactobacillus exerts anti-inflammatory effects by selectively degrading proinflammatory chemokines. Cell Host Microbe 2012, 11, 387–396. 10.1016/j.chom.2012.02.006. [DOI] [PubMed] [Google Scholar]
- Rodionova I. A.; Zhang Z.; Mehla J.; et al. The phosphocarrier protein HPr of the bacterial phosphotransferase system globally regulates energy metabolism by directly interacting with multiple enzymes in Escherichia coli. J. Biol. Chem. 2017, 292, 14250–14257. 10.1074/jbc.M117.795294. [DOI] [PMC free article] [PubMed] [Google Scholar]
- Li Z.; Summanen P. H.; Komoriya T.; et al. Pomegranate ellagitannins stimulate growth of gut bacteria invitro: Implications for prebiotic and metabolic effects. Anaerobe 2015, 34, 164–168. 10.1016/j.anaerobe.2015.05.012. [DOI] [PubMed] [Google Scholar]
- Buenrostro-Figueroa J.; Mireles M.; Ascacio-Valdés J. A.; et al. Enzymatic biotransformation of pomegranate ellagitannins: Initial approach to reaction conditions. Iran. J. Biotechnol. 2020, 18, 30–36. 10.30498/ijb.2020.137202.2305. [DOI] [PMC free article] [PubMed] [Google Scholar]
- Aguilera-Carbo A.; Augur C.; Prado-Barragan L. A.; Favela-Torres E.; Aguilar C. N. Microbial production of ellagic acid and biodegradation of ellagitannins. Appl. Microbiol. Biotechnol. 2008, 78, 189–199. 10.1007/s00253-007-1276-2. [DOI] [PubMed] [Google Scholar]
- Suzuki T.; Yano K.; Sugimoto S.; et al. Endo-N-acetylglucosaminidase, an enzyme involved in processing of free oligosaccharides in the cytosol. Proc. Natl. Acad. Sci. U.S.A. 2002, 99, 9691–9696. 10.1073/pnas.152333599. [DOI] [PMC free article] [PubMed] [Google Scholar]
- Fukushima T.; Uchida N.; Ide M.; Kodama T.; Sekiguchi J. DL-endopeptidases function as both cell wall hydrolases and poly-γ-glutamic acid hydrolases. Microbiology 2018, 164, 277–286. 10.1099/mic.0.000609. [DOI] [PubMed] [Google Scholar]
- Zeng Y.; Charkowski A. O. The role of ATP-binding cassette transporters in bacterial phytopathogenesis. Phytopathology 2021, 111, 600–610. 10.1094/PHYTO-06-20-0212-RVW. [DOI] [PubMed] [Google Scholar]
- Nuñez-Sánchez M. A.; García-Villalba R.; Monedero-Saiz T.; et al. Targeted metabolic profiling of pomegranate polyphenols and urolithins in plasma, urine and colon tissues from colorectal cancer patients. Mol. Nutr. Food Res. 2014, 58, 1199–1211. 10.1002/mnfr.201300931. [DOI] [PubMed] [Google Scholar]
Associated Data
This section collects any data citations, data availability statements, or supplementary materials included in this article.