

Abstract
Biases in attention to emotional stimuli (i.e., affect-biased attention) contribute to the development and maintenance of depression and anxiety and may be a promising target for intervention. Past attempts to therapeutically modify affect-biased attention have been unsatisfactory due to issues with reliability and precision. Electroencephalogram (EEG)-derived steady-state visual evoked potentials (SSVEPS) provide a temporally-sensitive biological index of attention to competing visual stimuli at the level of neuronal populations in the visual cortex. SSVEPS can potentially be used to quantify whether affective distractors vs. task-relevant stimuli have “won” the competition for attention at a trial-by-trial level during neurofeedback sessions. This study piloted a protocol for a SSVEP-based neurofeedback training to modify affect-biased attention using a portable augmented-reality (AR) EEG interface. During neurofeedback sessions with five healthy participants, significantly greater attention was given to the task-relevant stimulus (a Gabor patch) than to affective distractors (negative emotional expressions) across SSVEP indices (p<0.0001). SSVEP indices exhibited excellent internal consistency as evidenced by a maximum Guttman split-half coefficient of 0.97 when comparing even to odd trials. Further testing is required, but findings suggest several SSVEP neurofeedback calculation methods most deserving of additional investigation and support ongoing efforts to develop and implement a SSVEP-guided AR-based neurofeedback training to modify affect-biased attention in adolescent girls at high risk for depression.
Keywords: Attention, Augmented reality (AR), Brain-computer interfaces (BCI), Electroencephalogram (EEG), Emotion, Steady-state visual evoked potentials (SSVEP)
I. Introduction
Attention is responsible for curating ongoing perceptions of the environment and its predominant characteristics (e.g., threat vs. safety; punishment vs. reward), which contributes to affective states [1]. For this reason, biases in attention to emotional stimuli (i.e., affect-biased attention) are a proposed mechanism underlying depression and anxiety disorders. Attempts have been made to therapeutically train patients to prioritize “goal-directed” attention to task-relevant stimuli by training attention away from distracting “stimulus-driven” negative stimuli using repeated, automated practice during behavioral tasks [2], [3]. However, most previous attention modification interventions are limited by problems with reliability and interpretability, and there is a need to increase the robustness and precision of these interventions [4], [5].
Because of the precision of brain-based measurement, neurofeedback is a promising modality for targeting affect-biased attention [6]. Neurofeedback has been effective in shaping behavior through brain-based feedback about attention [7], which allows patients to immediately and precisely adjust their attention to emotional information [8]. However, past neurofeedback paradigms used cost-prohibitive functional magnetic resonance imaging (fMRI) procedures, limiting their translation to the clinic. To address this gap, the current study developed a more cost-effective electroencephalogram (EEG) modality, using steady-state visual evoked potentials (SSVEPs). EEG-derived SSVEPs provide a temporally-sensitive biological index of competition between stimulus-driven and goal-directed attention at the level of neuronal populations in the visual cortex and can distinguish attention to competing visual stimuli even when they completely overlap in time and space [9].
Our ongoing work seeks to use SSVEP neurofeedback to target visuocortical components of affect-biased attention among a sample of adolescent girls at high risk for depression. This paper describes pilot efforts to test the SSVEP neurofeedback protocol in an augmented reality (AR) setting among a sample of healthy adult volunteers before implementation in the high-risk developmental sample. The current system combines EEG measurements recorded in response to visual stimuli presented through AR technology for realtime affect-biased attention detection and neurofeedback implementation. The current protocol uses a Microsoft HoloLens AR head mounted display to present visual stimuli superimposed on the real-world environment. The use of AR in a clinical setting allows patients to see their environment while tasks or alerts appear in their visual field in an overlay fashion. This makes the environment more comfortable and intuitive to control than an entirely virtual space. Recently, AR technology has been employed in medical settings [10], [11] as well as in conjunction with brain-computer interfaces (BCIs) [12], [13]. However, AR has not yet been implemented for affect-biased attention training.
During each trial in our protocol, we overlaid two competing visual stimuli on the HoloLens AR goggles. Participants were told to attend to the task-relevant stimulus (a semi-transparent Gabor patch) while inhibiting attention to the emotional distractor (an angry or sad face). Each stimulus was flickered at a distinct frequency (8.57 or 12 Hz) in order to discriminate SSVEP responses to the Gabor vs. face. After each trial, participants received feedback on how much attention was allocated to the Gabor vs. the face (as reflected by a generated SSVEP competition score). We hypothesized that the paradigm would lead to discriminant and reliable SSVEP responses for both Gabor and faces. We tested 1) whether proposed neurofeedback calculation methods would result in statistically significant differences between SSVEP responses to the Gabor and the face and 2) the internal reliability of responses generated during the protocol by comparing responses on odd versus even trials.
II. Methodology
A. Participants
We implemented the SSVEP Affect-Biased Attention Training protocol, which utilized variations of the Affect-Biased Attention Task (shown in Figure 1 and described below) among a sample of five healthy adult volunteers (1 male, mean age = 28.8±6.1 years old). The study was approved by the University of Pittsburgh Institutional Review Board (STUDY19010063) and informed consent was obtained from all participants.
Fig. 1.
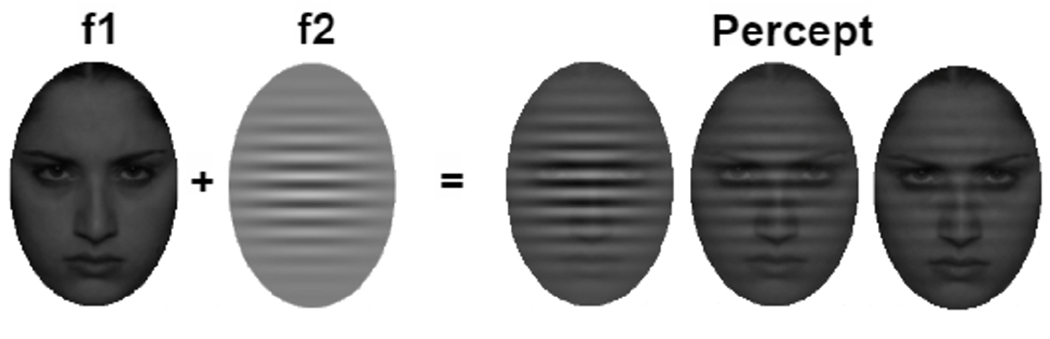
The Affect-Biased Attention Task used in SSVEP neurofeedback training. A flickering Gabor patch at frequency f1 = 12Hz with three different opacity (50%, 25%, 12.5%) respectively overlays a random flickering sad/angry face at another frequency f2 = 8.57Hz for different protocols.
B. SSVEP Affect-Biased Attention Task
The SSVEP Affect-Biased Attention Task assessed participants’ goal-directed attention to task-relevant stimuli (i.e., a Gabor, which is a patch of parallel lines) and stimulus-driven attention to affective distractors (i.e., sad and angry faces), which is an adaptation from a change-detection task used in prior research [14]. During each trial, a face was presented at the center of the screen for 5s. Faces were flickered at a frequency of 8.57Hz (f1) to evoke SSVEPs frequency-tagged to the face. A semi-transparent Gabor patch was superimposed over the face, flickering at 12Hz (f2) to evoke SSVEPs frequency-tagged to the Gabor. Stimuli included 30 pictures of 15 female adolescent actors with sad and angry expressions from the NIMH Child Emotional Faces Set [15].
C. SSVEP Affect-Biased Attention Training Protocol
The SSVEP Affect-Biased Attention Training Protocol consisted of three phases:
Baseline Phase. During the baseline phase, the SSVEP Affect-Biased Attention Task was administered to participants without feedback. Gabor component was displayed at 50% transparency. In this phase, participants completed 30 trials.
Training Phase. During the training phase, the SSVEP Affect-Biased Attention Task was administered with feedback and the opacity of Gabor component is 50%. In this phase, participants completed three training epochs. Each epoch contained 30 trials with discrete feedback presented after each trial. Following each trial of the Affect-Biased Attention Task, feedback was given with a visualization of the SSVEP competition score (see Figure 2), which tells participants which stimulus (Gabor or face) has “won” the competition for attention during that trial (operationalized below). At the end of the second and third epochs, participants also received feedback comparing their performance on the current epoch to the previous epoch. If participants increased the number of trials where the Gabor “won”, then they were told “You’re getting better, keep up the hard work!”. Otherwise, the participant was told “Please keep practicing to improve your performance.”
Mastery Phase. During the mastery phase, a modified version of the SSVEP Affect-Biased Attention task was administered to participants across three levels that progressed in difficulty by reducing the opacity of the Gabor (i.e., the Gabor’s initial opacity was 50% and it was cut in half during the next level; see also Figure 2). Within each level, there was a maximum of 3 epochs, which each included a maximum of 30 trials. In the first mastery level, the initial opacity of the Gabor was set at the same level as that used in the Training Phase. Once a participant crossed a “mastery” threshold within any epoch or level (operationalized below), then the epoch or level concluded; otherwise, epochs or levels concluded once the maximum number of trials or epochs were completed.
Fig. 2.
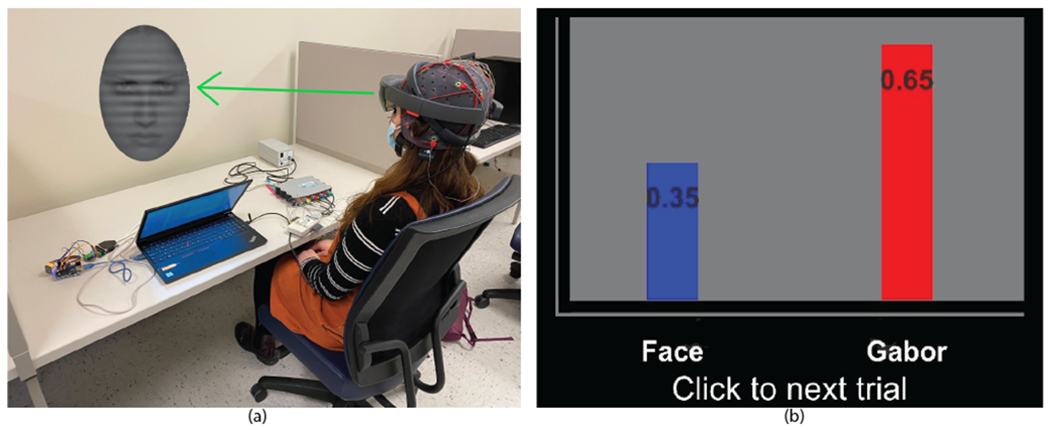
(a) Participant using the EEG-guided AR system, which presents the Affect-Biased Attention Task. EEG electrodes are connected to the system for data collection. (b) The neurofeedback presentation at the end of trials for Training and Mastery Phases. The bar chart displays the Gabor vs. face power ratio calculated based on current trial’s EEG data. If the power ratio of Gabor is higher than that of the face (> 0.50), then participants are told that the Gabor has “won” the competition for attention. Otherwise, we believe that the stimulus-driven attention to face has dominated during the trial and participants are encouraged to keep training attention to the Gabor.
D. SSVEP Feedback Calculations
SSVEP-guided feedback was calculated for the training and mastery phases as described below:
Training Phase. Stimulus-driven attention to the face and goal-directed attention to the Gabor was calculated at the end of each trial using fast Fourier transform (FFT) at the competing frequency tags (8.57Hz and 12Hz) at a cluster of occipital sites. The proportion of attention allocated to the Gabor vs. the face at any given time point was calculated using the FFT coefficients generated for each frequency tag, which resulted in a proportion score ranging from 0 to 1. Scores > 0.50 indicated that the Gabor had won the competition for attention during that trial.
Mastery Phase. During each mastery level, the SSVEP competition score was calculated at the end of each trial, but not presented to the participant. Instead, the script controlling stimulus presentation loaded in each trial’s SSVEP competition score as it was calculated and kept a running average of the scores within that level. Once the participants’ average score crossed the “mastery” threshold (0.55, after at least 2 trials), then mastery of that epoch was marked. After at least 2 epochs were marked as “mastered”, then the level concluded. If mastery was not demonstrated by the end of the maximum number of trials per epoch (30) or epochs per level (3), then the epoch or level still concluded but mastery was not marked. If mastery of the prior level was marked, then the participant was allowed to move on to the more difficult subsequent level. Otherwise, the participant repeated the level. The mastery phase concluded once three levels were completed (regardless of whether mastery of each level was marked).
E. Implementation of SSVEP-Guided AR Modality
To test the proof-of-concept of our proposed SSVEP neurofeedback training protocols, we developed a prototype of the system for this Adolescent Attention to Emotion Study (AAES system) by adopting an EEG-guided AR-based BCI system. A similar AR-based BCI system was proposed by our team in a previous work [16]. In the current study, we have integrated an AR version of the Affect-Biased Attention Task paradigm for the Microsoft Hololens with EEG to deliver neurofeedback. Unlike traditional BCI applications that use a personal computer (PC) monitor to present fixed-location visual stimuli, our AAES system provides a customized platform that tracks head position in real-time and projects the holographic Affect-Biased Attention Task dynamically in the participant’s visual space. Our system setup in use is shown in Figure 2(a). This system is built up as a cascade of multiple applications in different platforms working as a whole to implement our proposed Neurofeedback Training Protocols (Figure 3). The Affect-Biased Attention Task is designed and deployed on the Microsoft HoloLens in Unity (Unity, San Francisco, CA, USA). The system interface is built on MATLAB R2015a (The MathWorks, Natick, Massachussetts, USA) and the EEG collection module is built on MATLAB R2015a with gTec MATLAB API. The computer and the HoloLens applications are connected via Bluetooth Low Energy (BLE) by using an Arduino kit. The computer serves as the main interactive terminal to communicate with each external device.
Fig. 3.
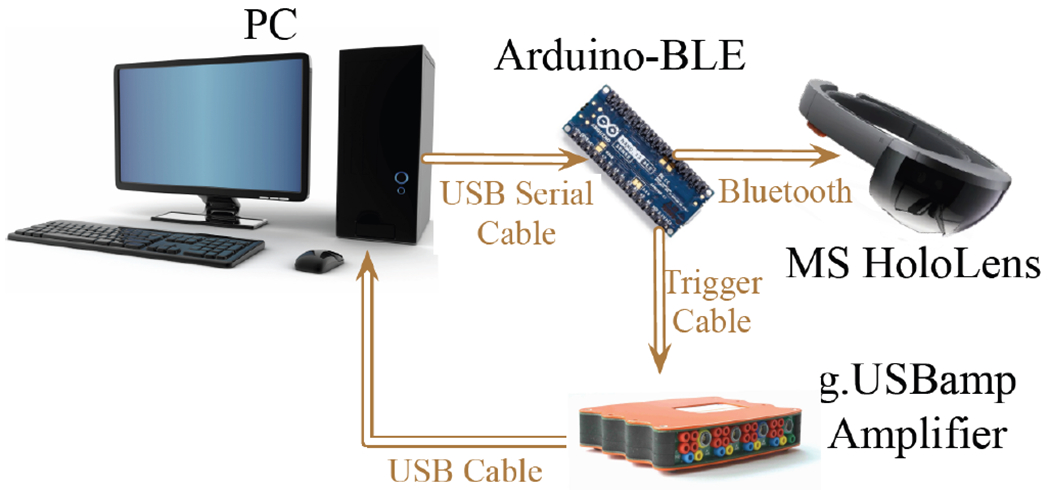
Flowchart that represents connections within AAES system. PC is the main interactive terminal and control unit to activate external devices. The Microsoft HoloLens headset is responsible for displaying visual stimuli. g.USBamp is a high-performance biosignal amplifier for the EEG data acquisition. The Arduino-BLE module serves as a bridge to assist the PC to transmit triggers to HoloLens over Bluetooth and to amplifier over cable.
The AAES system includes three phases (baseline, training, and mastery, as described in our training protocol) that can be user-selected from the PC interface. The PC sends this message to the Arduino-BLE module and then corresponding phase function calls on the HoloLens via Bluetooth and the amplifier via USB to record the EEG in real-time. According to the protocols of selected phase, the PC launches the presupposed number of trials. The PC sends the onset trigger of each trial to the Arduino-BLE board, which then simultaneously sends an EEG trigger to the amplifier to mark the trial via USB and a presentation trigger to HoloLens via Bluetooth. The HoloLens displays our flickering Gabor/face composite in the center of participant’s field of view for 5s. During the Baseline Phase, the participant is passively exposed to successive visual stimuli with a random interval of 1.2s to 2.5s without neurofeedback. During the Training and Mastery Phases, the trial’s EEG data segment will be extracted and used to calculate each component’s power ratio by applying FFT to frequency-tagged SSVEPs at the end of each trial. The neurofeedback, which is displayed using a bar chart as shown in Figure 2(b), will be automatically presented on HoloLens after sent from PC to help participants interpret how their attention was distributed during the previous trial. Participants will be asked to actively adjust their attention on the next trial based on the current feedback and to try for improvement during the next trial. After displaying feedback, participant will use a clicker to progress to the next trial.
III. Experimental Results
A. Experimental Setup
Participants were mounted with an EEG electrode cap and the HoloLens headset while facing to a white wall (Figure 2(a)). The Gabor/face composite was displayed in the center of the field of view 1.14m from participant’s eyes. EEG data was collected through 16 electrodes located at Fp1, Fp2, F3, F4, Fc1, Fc2, Cz, P1, P2, C1, C2, Cp3, Cp4, O1, O2 and Oz according to the 10-20 system with a sampling frequency of 256Hz. In order to explore the optimal training regimen, participants completed both Baseline Phase and Training Phase sessions but with different numbers of epochs. Two of the participants were also tested with the Mastery Phase.
B. Visual Stimuli Detection
As the SSVEP is typically measured over the occipital scalp region (channels O1, O2, and Oz), the EEG data of these three channels were averaged for SSVEP feedback calculation. Using FFT, we can detect the distinct response to competing visual stimuli tagged to specific frequencies for single trials. A peak can typically be detected at the frequency around 12Hz, which is the frequency tagged to the Gabor and around 8.57Hz, which is the frequency tagged to the face (Figure 4).
Fig. 4.
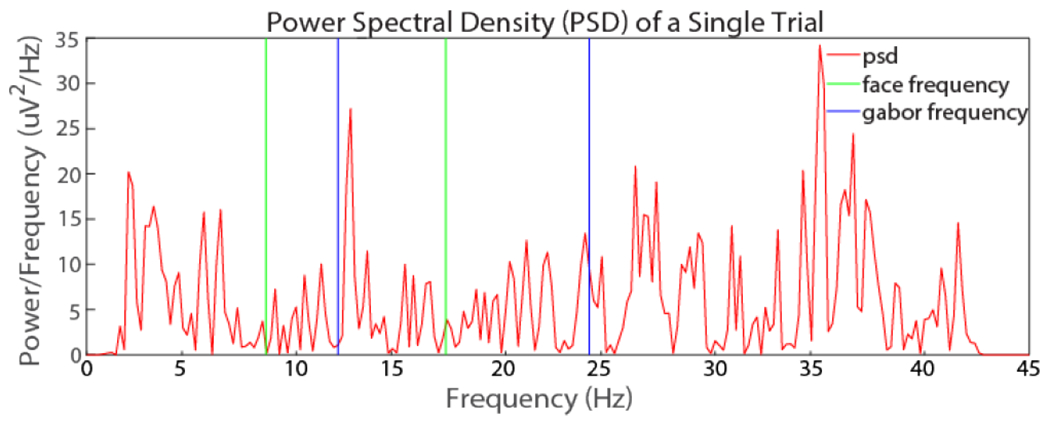
The power spectral density at a cluster of occipital EEG sites during a single trial. The response to visual stimuli tagged at specific frequencies can be detected for each trial. The green vertical lines represent the fundamental frequency and first harmonic of the face image (8.57 and 17.14 Hz, respectively). The blue vertical lines represent the fundamental frequency and first harmonic of the Gabor image (12 and 24 Hz, respectively).
According to our training protocols, the SSVEP competition score is calculated for each trial. However, the power spectral density (PSD) of single trial has a reduced signal-to-noise ratio compared to the PSD averaged over many trials. Additionally, the HoloLens’s refresh rate slightly fluctuates, leading to density peaks that do not exactly align with the Gabor’s or the face’s flickering frequencies. Therefore, to explore the optimal competition score calculation strategy, we tested two different methods: (1) extract the peak power from the respective face and Gabor frequency ranges, and (2) extract the average power from the respective face and Gabor frequency ranges. In addition, to explore the optimal frequency range, we tested four different frequency ranges:
(a) and
(b) and
(c)
(d)
Here and represent fundamental frequency and the first harmonic frequency of face or Gabor, respectively.
C. Statistical Analysis
To test for differences between SSVEP responses to the Gabor versus face across power calculation methods (method 1 and 2, as described above) and frequency ranges (ranges a-d, as described above), we conducted offline analyses for the 630 trials collected across the five participants (collapsed across Baseline and Training sessions). Thirty-two trials from method 1 and twenty-six trials from method 2 were identified as outliers (defined as more than two times the standard deviation) and excluded from analyses.
In our first set of analyses, we examined differences between the log of power to the Gabor and the face for each calculation strategy and frequency range. For sets with a normal distribution (as confirmed by Shapiro-Wilk tests for normality), paired t-tests were performed; for the one non-normally-distributed set, a Wilcoxon signed rank test was performed. For all sets, the null hypothesis was that there were no significant differences power to the Gabor vs. the face. For both methods 1 and 2, all options yielded significant differences (p<0.0001), such that the Gabor had significantly higher power than the face, thus rejecting the null.
In our second set of analyses, we examined differences in the proportion of trials “won” across the two calculation methods and four frequency ranges listed in Table I. Because participants were asked to focus on the Gabor patch rather than the face image, we hypothesized that the proportions of “won” trials for all methods and frequency ranges would be above 0.5. This hypothesis was confirmed by our analyses, with Method 1 generating the highest proportion of trials “won” by the Gabor (0.879).
TABLE I.
The proportions (prop.) of trials where attention was “won” by the Gabor across the proposed two power calculation methods and four frequency ranges.
| Method 1 | Method 2 | |||
|---|---|---|---|---|
|
|
||||
| Range | Gabor prop. | face prop. | Gabor prop. | face prop. |
| a | 0.576 | 0.424 | 0.635 | 0.365 |
| b | 0.879 | 0.121 | 0.665 | 0.335 |
| c | 0.637 | 0.363 | 0.694 | 0.306 |
| d | 0.713 | 0.287 | 0.727 | 0.273 |
Finally, we tested the reliability of our proposed SSVEP competition scores by comparing responses averaged across even vs. odd trials (using both Baseline and Training sessions). Split-half reliability, which is a statistical method used to measure the consistency of the scores of a test, was excellent (Guttman coefficients ranging from 0.92 to 0.97). The average competition scores for each calculation method and frequency range of odd and even trials, and their respective Guttman coefficients, are reported in Table II.
TABLE II.
The average competition scores and Guttman coefficients for even vs. odd trials split by calculation method and frequency range.
| Subject’s Session | Method 1 | |||||||
|---|---|---|---|---|---|---|---|---|
|
| ||||||||
| Range a | Range b | Range c | Range d | |||||
|
| ||||||||
| Odd | Even | Odd | Even | Odd | Even | Odd | Even | |
|
| ||||||||
| s1 | 0.56 | 0.62 | 0.73 | 0.76 | 0.69 | 0.75 | 0.63 | 0.68 |
| s2 | 0.59 | 0.59 | 0.72 | 0.72 | 0.61 | 0.59 | 0.68 | 0.68 |
| s3 | 0.52 | 0.57 | 0.69 | 0.68 | 0.57 | 0.60 | 0.67 | 0.62 |
| s4 | 0.43 | 0.47 | 0.53 | 0.61 | 0.37 | 0.43 | 0.42 | 0.54 |
| s5 | 0.43 | 0.45 | 0.70 | 0.72 | 0.51 | 0.56 | 0.62 | 0.63 |
| s6 | 0.62 | 0.62 | 0.73 | 0.77 | 0.74 | 0.73 | 0.75 | 0.78 |
| s7 | 0.51 | 0.50 | 0.64 | 0.60 | 0.52 | 0.57 | 0.53 | 0.52 |
| s8 | 0.57 | 0.59 | 0.70 | 0.73 | 0.64 | 0.64 | 0.64 | 0.68 |
| s9 | 0.52 | 0.46 | 0.65 | 0.64 | 0.55 | 0.47 | 0.60 | 0.56 |
| s10 | 0.42 | 0.43 | 0.54 | 0.55 | 0.41 | 0.44 | 0.44 | 0.47 |
|
| ||||||||
| Coefficient | 0.93 | 0.95 | 0.96 | 0.94 | ||||
|
| ||||||||
|
| ||||||||
| Subject’s Session | Method 2 | |||||||
|
| ||||||||
| Range a | Range b | Range c | Range d | |||||
|
| ||||||||
| Odd | Even | Odd | Even | Odd | Even | Odd | Even | |
|
| ||||||||
| s1 | 0.61 | 0.63 | 0.64 | 0.63 | 0.73 | 0.75 | 0.69 | 0.71 |
| s2 | 0.62 | 0.60 | 0.65 | 0.67 | 0.63 | 0.60 | 0.68 | 0.67 |
| s3 | 0.56 | 0.59 | 0.59 | 0.59 | 0.61 | 0.64 | 0.63 | 0.64 |
| s4 | 0.46 | 0.51 | 0.48 | 0.52 | 0.42 | 0.49 | 0.45 | 0.51 |
| s5 | 0.46 | 0.48 | 0.53 | 0.54 | 0.52 | 0.56 | 0.62 | 0.59 |
| s6 | 0.61 | 0.63 | 0.63 | 0.64 | 0.73 | 0.73 | 0.76 | 0.76 |
| s7 | 0.52 | 0.48 | 0.54 | 0.45 | 0.52 | 0.55 | 0.54 | 0.53 |
| s8 | 0.58 | 0.60 | 0.60 | 0.63 | 0.64 | 0.64 | 0.68 | 0.65 |
| s9 | 0.51 | 0.47 | 0.57 | 0.51 | 0.53 | 0.48 | 0.60 | 0.54 |
| s10 | 0.45 | 0.47 | 0.45 | 0.47 | 0.44 | 0.47 | 0.43 | 0.48 |
|
| ||||||||
| Coefficient | 0.94 | 0.92 | 0.97 | 0.96 | ||||
IV. Conclusion
In this paper, we describe and implement a proof-of-concept protocol for a SSVEP-based neurofeedback training to modify affect-biased attention using an EEG-based AR modality. our preliminary reliability and validation analyses will inform further development and implementation of the Adolescent Attention to Emotion Study system described in the current study. Specifically, our initial analyses demonstrate that our system can capture attentional responses to competing visual stimuli in an AR modality and that, as instructed and hypothesized, participants were attending more to goal-directed stimuli than emotional distractors, as reflected across all calculation methods and possible frequency ranges. In addition, our SSVEP competition scores demonstrated excellent split-half reliability across the range of calculation strategies, which is a prerequisite of providing meaningful and actionable information to patients via neurofeedback. This preliminary progress has great significance for our subsequent study on SSVEP-based neurofeedback training to modify affect-biased attention among a sample of adolescent girls at high risk for depression.
Presently, we have established the prototype of the AAES system and completed preliminary offline statistical analyses. Our immediate next steps include finalizing the feedback calculation method and frequency range and further testing and implementation of the Mastery Phase. Based on the analyses presented in the current study, our calculation method 2 paired with frequency range c resulted in the high levels of discrimination between the Gabor and the face paired with high levels of reliability. Therefore, we plan to prioritize future pilot testing using this method. In addition, because this is the first implementation of the SSVEP Affect-Biased Attention task in an AR setting, we must gather more information on usability, comfort, and visual fatigue from participants and further assess system stability. Finally, we plan to test whether the feedback delivered to participants after each trial will improve affect-biased attention from baseline to the mastery phase. To do so, we will develop a sham feedback protocol where participants will receive feedback that is unrelated to their actual performance on the task. We will then compare differences between participants receiving active versus sham feedback.
By using SSVEP-guided neurofeedback to modify affect-biased attention in AR, the current study advances the field by establishing a critical proof-of-concept that will be used in the development of a novel training to reduce affect-biased attention among adolescents who are at high risk for major depressive disorder (MDD). If supported, this study will introduce a clear and mechanistic early intervention target that allows for real-time evaluation of attention training quality and efficacy. The preliminary findings from the current study suggest that further testing of such a training has many advantages that make it compelling for future study.
Acknowledgments
This work, Adolescent Attention to Emotion Study (AAES), was supported by NSF-IIS 1915065, NSF IIS 1915083, and NIMH K23 MH119225. Clinicaltrials.gov: NCT04105868; PI: Mary L. Woody.
References
- [1].Woody M and Price R, Encyclopedia of Behavioral Neuroscience 2nd Edition, vol. 3, ch. Targeting Neurodevelopmental Mechanisms in Emotional Disorders Through Intervention, pp. 289–294. August 2020. [Google Scholar]
- [2].Browning M, Holmes EA, and Harmer CJ, “The modification of attentional bias to emotional information: A review of the techniques, mechanisms, and relevance to emotional disorders,” Cognitive, Affective, & Behavioral Neuroscience, vol. 10, no. 1, pp. 8–20, 2010. [DOI] [PubMed] [Google Scholar]
- [3].Price RB, Wallace M, Kuckertz JM, Amir N, Graur S, Cummings L, Popa P, Carlbring P, and Bar-Haim Y, “Pooled patient-level meta-analysis of children and adults completing a computer-based anxiety intervention targeting attentional bias,” Clinical psychology review, vol. 50, pp. 37–49, 2016. [DOI] [PMC free article] [PubMed] [Google Scholar]
- [4].MacLeod C, Grafton B, and Notebaert L, “Anxiety-linked attentional bias: is it reliable?,” Annual review of clinical psychology, vol. 15, pp. 529–554, 2019. [DOI] [PubMed] [Google Scholar]
- [5].McNally RJ, “Attentional bias for threat: Crisis or opportunity?,” Clinical psychology review, vol. 69, pp. 4–13, 2019. [DOI] [PubMed] [Google Scholar]
- [6].Ordikhani-Seyedlar M, Lebedev MA, Sorensen HB, and Puthusserypady S, “Neurofeedback therapy for enhancing visual attention: state-of-the-art and challenges,” Frontiers in neuroscience, vol. 10, p. 352, 2016. [DOI] [PMC free article] [PubMed] [Google Scholar]
- [7].deBettencourt MT, Cohen JD, Lee RF, Norman KA, and Turk-Browne NB, “Closed-loop training of attention with real-time brain imaging,” Nature neuroscience, vol. 18, no. 3, pp. 470–475, 2015. [DOI] [PMC free article] [PubMed] [Google Scholar]
- [8].Schnyer DM, Beevers CG, Megan T. d., Sherman SM, Cohen JD, Norman KA, and Turk-Browne NB, “Neurocognitive therapeutics: from concept to application in the treatment of negative attention bias,” Biology of mood & anxiety disorders, vol. 5, no. 1, pp. 1–4, 2015. [DOI] [PMC free article] [PubMed] [Google Scholar]
- [9].Wieser MJ and Keil A, “Attentional threat biases and their role in anxiety: A neurophysiological perspective,” International Journal of Psychophysiology, vol. 153, pp. 148–158, 2020. [DOI] [PubMed] [Google Scholar]
- [10].Ara J, Bhuiyan H, Bhuiyan YA, Bhyan SB, and Bhuiyan MI, “Ar-based modern healthcare: A review,” arXiv preprint arXiv:2101.06364, 2021. [Google Scholar]
- [11].Sutherland J, Belec J, Sheikh A, Chepelev L, Althobaity W, Chow BJ, Mitsouras D, Christensen A, Rybicki FJ, and La Russa DJ, “Applying modern virtual and augmented reality technologies to medical images and models,” Journal of digital imaging, vol. 32, no. 1, pp. 38–53, 2019. [DOI] [PMC free article] [PubMed] [Google Scholar]
- [12].Lenhardt A and Ritter H, “An augmented-reality based brain-computer interface for robot control,” in International Conference on Neural Information Processing, pp. 58–65, Springer, 2010. [Google Scholar]
- [13].Zao JK, Jung T-P, Chang H-M, Gan T-T, Wang Y-T, Lin Y-P, Liu W-H, Zheng G-Y, Lin C-K, Lin C-H, et al. , “Augmenting vr/ar applications with eeg/eog monitoring and oculo-vestibular recoupling,” in International Conference on Augmented Cognition, pp. 121–131, Springer, 2016. [Google Scholar]
- [14].Woody ML, Miskovic V, Owens M, James KM, Feurer C, Sosoo EE, and Gibb BE, “Competition effects in visual cortex between emotional distractors and a primary task in remitted depression,” Biological Psychiatry: Cognitive Neuroscience and Neuroimaging, vol. 2, no. 5, pp. 396–403, 2017. [DOI] [PMC free article] [PubMed] [Google Scholar]
- [15].Egger HL, Pine DS, Nelson E, Leibenluft E, Ernst M, Towbin KE, and Angold A, “The nimh child emotional faces picture set (nimh-chefs): a new set of children’s facial emotion stimuli,” International journal of methods in psychiatric research, vol. 20, no. 3, pp. 145–156, 2011. [DOI] [PMC free article] [PubMed] [Google Scholar]
- [16].Kocanaogullari D, Huang X, Mak J, Shih M, Skidmore E, Wittenberg GF, Ostadabbas S, and Akcakaya M, “Fine-tuning and personalization of eeg-based neglect detection in stroke patients,” in 2021 43rd Annual International Conference of the IEEE Engineering in Medicine & Biology Society (EMBC), pp. 1096–1099, IEEE, 2021. [DOI] [PubMed] [Google Scholar]