

Abstract
Exposure to polychlorinated biphenyls (PCBs) can occur through multiple routes and sources, including dietary intake, inhalation, dermal contact, and ingestion of dust and soils. Dietary exposure to PCBs is often considered the primary exposure route for the general population; however, recent studies suggest an increasing contribution from indoor inhalation exposure. Here, we aim to estimate the relative contribution of different PCB exposure pathways for the general population, as well as for select age groups. We conducted a targeted literature review of PCB concentrations in environmental media, including indoor and outdoor air, indoor dust, and soils, as well as of total dietary intake. Using the average concentrations from the studies identified, we estimated PCB exposure through different routes for the general population. In addition, we assessed exposure via environmental media for select age groups. We identified a total of 70 studies, 64 that provided background PCB concentrations for one or more of the environmental media of interest and 6 studies that provided estimates of dietary intake. Using estimates from studies conducted worldwide, for the general population, dietary intake of PCBs was the major exposure pathway. In general, our review identifies important limitations in the data available to assess population exposures, highlighting the need for more current and population-based estimates of PCB exposure, particularly for indoor air and dietary intake.
Keywords: persistent organic pollutants, inhalation, ingestion, dietary exposure, PCBs
Graphical Abstract

1. Introduction
The commercial manufacture of polychlorinated biphenyls (PCBs) was banned in the United States under the Toxic Substances Control Act in 1979, yet PCBs continue to be detected in most samples of human blood and breast milk (Kraft et al. 2017; Lehmann et al. 2018). Dietary exposure from intake of PCB contaminated fatty foods, such as fish, meat, and dairy, is often considered the primary source of the human body burden of PCBs. However, several studies suggest that, in some contexts, inhalation exposure levels can be comparable to or even higher than dietary exposures (Lehmann et al. 2015; Harrad et al. 2009; Saktrakulkla et al. 2020). Toddlers and children, in particular, may be at higher risk of increased inhalation exposure, largely due to PCBs in indoor air (Lehmann et al. 2015; Herrick, Stewart, and Allen 2016; Ampleman et al. 2015). Dermal contact or ingestion of PCB contaminated soil or dust may also pose a higher exposure risk for young children (U.S. Environmental Protection Agency 2014).
As semi-volatile compounds, PCBs exist in both gas and particulate phases (Mandalakis and Stephanou 2004). Potential primary sources of indoor inhalation exposures to PCBs include legacy caulking, paints, and fluorescent light ballasts that were produced pre-1979 (U.S. Environmental Protection Agency 2012). In addition to these, PCBs can also arise from non-legacy sources, including the inadvertent modern production of PCBs in pigments used in paints and other consumer products (Hu and Hornbuckle 2010). Buildings with PCB source materials can also serve as a source to outdoor air (Shanahan et al. 2015; Csiszar et al. 2012). Additional primary PCB sources for outdoor air include hazardous waste sites, illegal or improper disposal of industrial wastes and consumer products, leaks from electrical transformers, and incineration of some wastes (ATSDR 2000), as well as water above contaminated sediments (Liu et al. 2015). PCBs enter soils primarily through atmospheric deposition processes (Meijer et al. 2003).
There are 209 unique PCB congeners which consist of two linked benzene rings with one to ten chlorine substitutions. These congeners differ in structural and chemical properties, which determine their relative presence in different environmental media, as well as their potential toxicity. PCBs are subject to long-range atmospheric transport which can differ based on the degree of chlorination (Kallenborn et al. 1998). The lower chlorinated congeners are volatile and thus more readily transported from sources of contamination (Robertson and Ludewig 2011; Norstrom et al. 2010). In addition, they have comparatively shorter half-lives and are more quickly metabolized (Grimm et al. 2015). In contrast, higher chlorinated congeners tend to be more persistent, with longer half-lives and increased biomagnification, and as such, a major exposure route is through the diet (Grimm et al. 2015; Norstrom et al. 2010).
Here, we aim to estimate the relative contribution of different exposure pathways for adults in the general population, as well as for select age groups. Previously, this has been examined based on data from a limited number of studies conducted in the United States (Lehmann et al. 2015). To provide more comprehensive estimates, we conducted a targeted review of PCB background levels worldwide in different environmental media, including indoor dust, soil, indoor air, and outdoor air, as well as dietary PCB intake. To focus on current exposure risk, we derived these estimates based on averages from studies published after 2007, representing approximately the most recent decade of exposure data.
2. Methods
2.1. Literature search strategy
Our targeted literature search focused on PCBs in environmental media (soil, dust, indoor air, outdoor air) and dietary exposure. Drinking water was not included because according to ATSDR (2000), “drinking water is not considered a significant pathway for exposure.” We included studies of any sites where populations may be exposed to background levels of PCBs (i.e., sites with no known direct impacts from industrial operations, waste materials, or PCB-containing materials). For dietary studies, we included only those which estimated PCB intake from the total diet (i.e., not from specific food groups or types). We included studies that measured PCBs as mixtures (e.g., Aroclors), as homologs, or as individual congeners. However, because the effectiveness of indicator PCBs (common subsets of 6, 7, or 12 PCBs) to estimate total PCB concentrations varies based on media type (Megson et al. 2019), we did not include studies that analyzed fewer than 20 congeners.
The literature search was conducted using EPA’s Health and Environmental Research Online (HERO) database. PubMed (National Library of Medicine), TOXNET (retired in December 2019; used only to search literature pre-2018), and Web of Science (Thomson Reuters) were searched for relevant literature. The search was conducted to identify literature published between January 2008 through April 2020. In addition, to identify additional recent references and to focus the literature search, citation mapping was conducted (references listed in Supplemental Material). Finally, the authors also solicited suggestions for relevant articles from experts knowledgeable in the field of exposure science.
The search terms and search strings were developed in collaboration with HERO librarians (Supplemental Material). Iterative refinements of the search string occurred as needed. Search terms for dietary exposure included polychlorinated biphenyls or PCBs, or related terms and dietary intake, dietary exposure, total diet, dietary, ingestion, or food. Search terms for media concentrations included polychlorinated biphenyls or PCBs, or related terms and concentration, levels, dust, dust ingestion, dust contact, dust dermal, soil, soil ingestion, air, inhalation, or inhalation exposure (indoor, residential, homes, apartments, buildings, schools, outdoor, or ambient). The search was refined to exclude papers that addressed topics such as emissions or emissions modeling, physical-chemical properties, sources, fate, wildlife, and toxicity.
2.2. Title and abstract screening
DistillerSR software (https://www.evidencepartners.com/products/distillersr-systematic-review-software/) was used to screen the titles/abstracts identified in the literature search. Two reviewers used DistillerSR to screen each study. Studies were only excluded if both reviewers agreed they were not relevant. Any conflicts between reviewers were resolved by consultation between the reviewers. If conflicts could not be resolved, the study was included for full-text review.
2.3. Full-text review and study evaluation
For full-text review, references that were included after title and abstract screening were exported from DistillerSR into an Excel spreadsheet. This spreadsheet served as an evidence inventory and record of full-text decisions and data extraction (Supplemental Material). Full texts were reviewed by a single reviewer and assessed based on the General Assessment Factors (GAF) for evaluating scientific and technical information recommended by the U.S. EPA’s Science Policy Council. These factors include soundness, applicability and utility, clarity and completeness, uncertainty and variability, and evaluation and review (for further detail, see https://www.epa.gov/risk/summary-general-assessment-factors-evaluating-quality-scientific-and-technical-information). Studies that met these criteria were included for data extraction. Given the limited number of studies, we did not evaluate references based on the quality assurance/quality control methodologies implemented or on the differences between method detection limits. However, information on these study design characteristics is included in Supplemental Material.
2.4. Data extraction
For each included study, the mean or geometric mean was prioritized for extraction. The focus was on the extraction of data representing background levels of PCBs. When studies included estimates of PCB concentrations at both known contaminated and uncontaminated (e.g., “referent”, “unpolluted”) sites, only data from the uncontaminated sites were extracted and included in subsequent analyses. When necessary, these values were extracted from figures using WebPlotDigitizer (https://automeris.io/WebPlotDigitizer/). For studies that did not report the mean, we estimated the mean based on the median, range, and sample size following the equation in Hozo, Djulbegovic, and Hozo (2005). One study of dust and one of indoor air reported the geometric mean rather than the mean. In eight studies, neither the mean nor the geometric mean was provided. For these, we estimated the mean from the median for one study of dust, four of soil, and three of outdoor air. In addition, for each study, we recorded the study location, specific site information, the sample size, the number of congeners analyzed, the analytical method employed, quality assurance/quality control methodologies, method detection limits, and the range of the reported concentrations (Supplemental Material). To estimate the average PCB concentrations for each exposure route, we averaged the central tendency values across studies within each environmental medium. When multiple values were provided for a given location, such as seasonal averages, we averaged these means such that a specific location within a given study is represented by only one mean value (to avoid overrepresentation of any single study location). Values for rural and urban sites were both included.
To examine the relationship between the number of congeners analyzed and the mean concentration or dietary intake levels, we conducted a linear regression analysis for each exposure route (R v3.6.1).
2.5. Estimations of exposure
Exposure algorithms are based on U.S. Environmental Protection Agency (1992). Note, when multiplying μg/g by mg/day the conversion factors cancel (g/1000 mg × 1000 ng/μg); dividing by kg (body weight) results in ng/kg-day. The exposure factors used below are summarized in Table 1. Because PCB absorption factors for environmental media are based on limited data, we calculated exposure using both low and high plausible absorption factors to show the potential resulting variability in exposure estimates. Other exposure assumptions vary between age groups (e.g., body size, time spent indoors, rates of ingestion and inhalation), but we did not vary these parameters within each group. Therefore, exposures of individuals within each age group may be higher or lower than our estimates based on variability in physiological and behavioral parameters.
Table 1.
Exposure parameter assumptions used to estimate average daily PCB exposure. Values in parentheses represent the range of plausible absorption factors for each exposure route.
| Exposure parameter | |||||
|---|---|---|---|---|---|
| 2-<3 years | 6-<12 years | Adults | Source | ||
| Absair | Absorption factor for inhalation | 0.7 (0.35–1.0) | 0.7 (0.35–1.0) | 0.7 (0.35–1.0) | (National Research Council 2006; U.S. Environmental Protection Agency 2012) |
| Absdermal | Absorption factor for dermal contact | 0.07 (0.02–0.5) | 0.07 (0.02–0.5) | 0.07 (0.02–0.5) | (National Research Council 2006; Roy, Hammerstrom, and Schaum 2009; U.S. Environmental Protection Agency 2012) |
| Absing | Absorption factor for ingestion | 0.85 (0.5–1.0) | 0.85 (0.5–1.0) | 0.85 (0.5–1.0) | (National Research Council 2006; U.S. Environmental Protection Agency 2012) |
| Ad | Dust to skin adherence (mg/cm2-day) | 0.038 | 0.005 | 0.003 | (U.S. Environmental Protection Agency 2011) |
| BW | Body weight (kg) | 13.8 | 31.8 | 80 | (U.S. Environmental Protection Agency 2011) |
| Findoor | Fraction of time spent indoors | 0.95 | 0.91 | 0.80 | (U.S. Environmental Protection Agency 2011) |
| Foutdoor | Fraction of time spent outdoors | 0.05 | 0.09 | 0.20 | (U.S. Environmental Protection Agency 2011) |
| IngRdust | Dust ingestion rate (mg/day) | 30 | 30 | 20 | (U.S. Environmental Protection Agency 2011; U.S. Environmental Protection Agency 2017) |
| IngRsoil | Soil ingestion rate (mg/day) | 30 | 30 | 10 | (U.S. Environmental Protection Agency 2011; U.S. Environmental Protection Agency 2017) |
| IR | Inhalation rate (m3/day) | 8.9 | 12.0 | 15.9 | (U.S. Environmental Protection Agency 2011) |
| SA | Skin contact area (cm2) | 1365 | 2554 | 4991 | (U.S. Environmental Protection Agency 2011) |
Average daily exposure to PCBs via ingestion of dust (ADDdust; ng/kg-day) and of soil (ADDsoil; ng/kg-day) were estimated as
where Cdust is the average PCB level in dust (μg/g); Csoil is the average PCB level in soil (μg/g); IngRdust is the dust ingestion rate (30 mg/day for children and 20 mg/day for adults); IngRsoil is the soil ingestion rate (30 mg/day for children and 10 mg/day for adults); Absing is the absorption factor for ingestion (unitless; 0.85); and BW is body weight (13.8, 31.8 and 80 kg for ages 2 to <3 years, 6 to <12 years, and adults, respectively).
Average daily exposure to PCBs via inhalation of indoor air (ADDinhalation-indoor; ng/kg-day) and outdoor air (ADDinhalation-outdoor; ng/kg-day) were estimated as
where Cair-indoor is the concentration of PCBs in indoor air (ng/m3); Cair-outdoor is the concentration of PCBs in outdoor air (ng/m3); IR is the inhalation rate (8.9, 12.0 and 15.9 m3/day for ages 2 to <3 years, 6 to <12 years, and adults, respectively); Findoor is the fraction of time spent indoors (unitless; 0.95, 0.91 and 0.80 assumed for ages 2 to <3 years, 6 to <12 years, and adults, respectively); Foutdoor is the fraction of time spent outdoors (unitless; 0.05, 0.09 and 0.20 assumed for ages 2 to <3 years, 6 to <12 years, and adults, respectively); Absair is the absorption factor for inhalation (unitless; 0.7); and BW is body weight (13.8, 31.8 and 80 kg for ages 2 to <3 years, 6 to <12 years, and adults, respectively).
Average daily exposure to PCBs via dermal contact with indoor dust (ADDdermal; ng/kg-day) was estimated as
where Cdust is the average PCB level in dust (μg/g); Ad is the dust to skin adherence (0.038, 0.005, and 0.003 mg/cm2-day for ages 2 <3 years, 6 to <12 years, and adults, respectively); SA is the skin contact area (1,365, 2,554 and 4,991 cm2 for ages 2 to <3 years, 6 to <12 years, and adults, respectively; assumes contact with the hands, 55% of the arms, and 39% of the legs); Absdermal is the absorption factor for dermal contact (unitless; 0.07); and BW is body weight (13.8, 31.8 and 80 kg for ages 2 to <3 years, 6 to <12 years, and adults, respectively).
Average daily exposure to PCBs via the diet (ADDdiet; ng/kg-day) was estimated as
where IRdiet is the average PCB intake in the daily total diet (μg/day); Absing is the absorption factor for ingestion (unitless; 0.85); and BW is body weight (13.8, 31.8 and 80 kg for ages 2 to <3 years, 6 to <12 years, and adults, respectively).
3. Results and Discussion
3.1. Literature search and review
The literature search and citation mapping identified 3,625 records (i.e., publications, duplicates removed) which were screened in DistillerSR (Figure 1). Of those, 3,396 were excluded as not relevant, and 229 were retrieved for full-text review. One additional dietary study published online August 20, 2020 was identified through personal communication and included for full-text review, for a total of 230 records. Based on the full-text review, 160 records were excluded because they did not meet one or more of the GAFs (see Supplemental Material). The primary reason for exclusion was applicability and utility (e.g., 71 records excluded due to analysis of fewer than 20 congeners; nine excluded as not representative of background concentrations). Of the remaining 70 publications, 64 provided information (e.g., background PCB concentrations) for one or more of the environmental media of interest. Seven relevant studies were identified for dust, 29 for soil, ten for indoor air, and 31 for outdoor air (Table 2; Supplemental Material). For dietary intake, we identified six relevant studies that measured 20 or more congeners (Table 2; Supplemental Material).
Figure 1.

Literature search and screening flow diagram for PCB concentrations in dust, soil, indoor air, and outdoor air, as well as total PCB dietary intake estimates. Studies were published between 2008 and 2020. Some studies evaluated more than one type of media. GAF = General Applicability Factors. *ToxLine was retired in 2019. #Includes one additional dietary study identified through personal communication.
Table 2.
The number of published studies that reported on each environmental medium or on dietary intake, and the average, standard deviation, and range of PCB concentrations or dietary intake levels across studies.
| # of studies | Mean ± SD (range of concentrations) | |
|---|---|---|
| Dust (μg/g) | 7 | 0.10 ± 0.08 (0.0025–0.86) |
| Soil (μg/g) | 29 | 0.017 ± 0.03 (0–2.6) |
| Indoor air (ng/m3) | 10 | 3.5 ± 5.1 (0.01–233) |
| Outdoor air (ng/m3) | 31 | 0.53 ± 1.0 (0.0002–13.0) |
| Dietary (μg/day) | 6 | 0.29 ± 0.21 (0.053–0.54) |
3.2. Number of measured congeners
The average number of congeners measured across study-reported values was 110.8 (37–209), 73.2 (25–206), 92.7 (28–209), 102.8 (24–209), and 71.5 (23–205) for dust, soil, indoor air, outdoor air, and dietary intake, respectively (Figure 2). For the included studies, within each exposure route, we did not find a relationship between the number of congeners analyzed and the mean concentration or dietary intake levels (Figure 2). This lack of relationship may result from small sample size and large site-specific differences between studies. While we chose to combine results across studies that measured between 20 and 209 congeners, we acknowledge that total PCBs are likely underestimated in the individual studies and in the combined mean values. In some cases, these underestimates may be substantial and could affect the interpretation of results. The degree to which the number of congeners measured might lead to underestimation likely varies between studies of environmental media and dietary intake. For example, for dietary studies, the sum of six indicator congeners (PCBs 28, 52, 101, 138, 153, and 180) is frequently used as a robust index of exposure. While we did not include studies that analyzed fewer than 20 congeners in our analysis, their inclusion would not likely have had an appreciable effect on our results (Supplemental Material).
Figure 2.
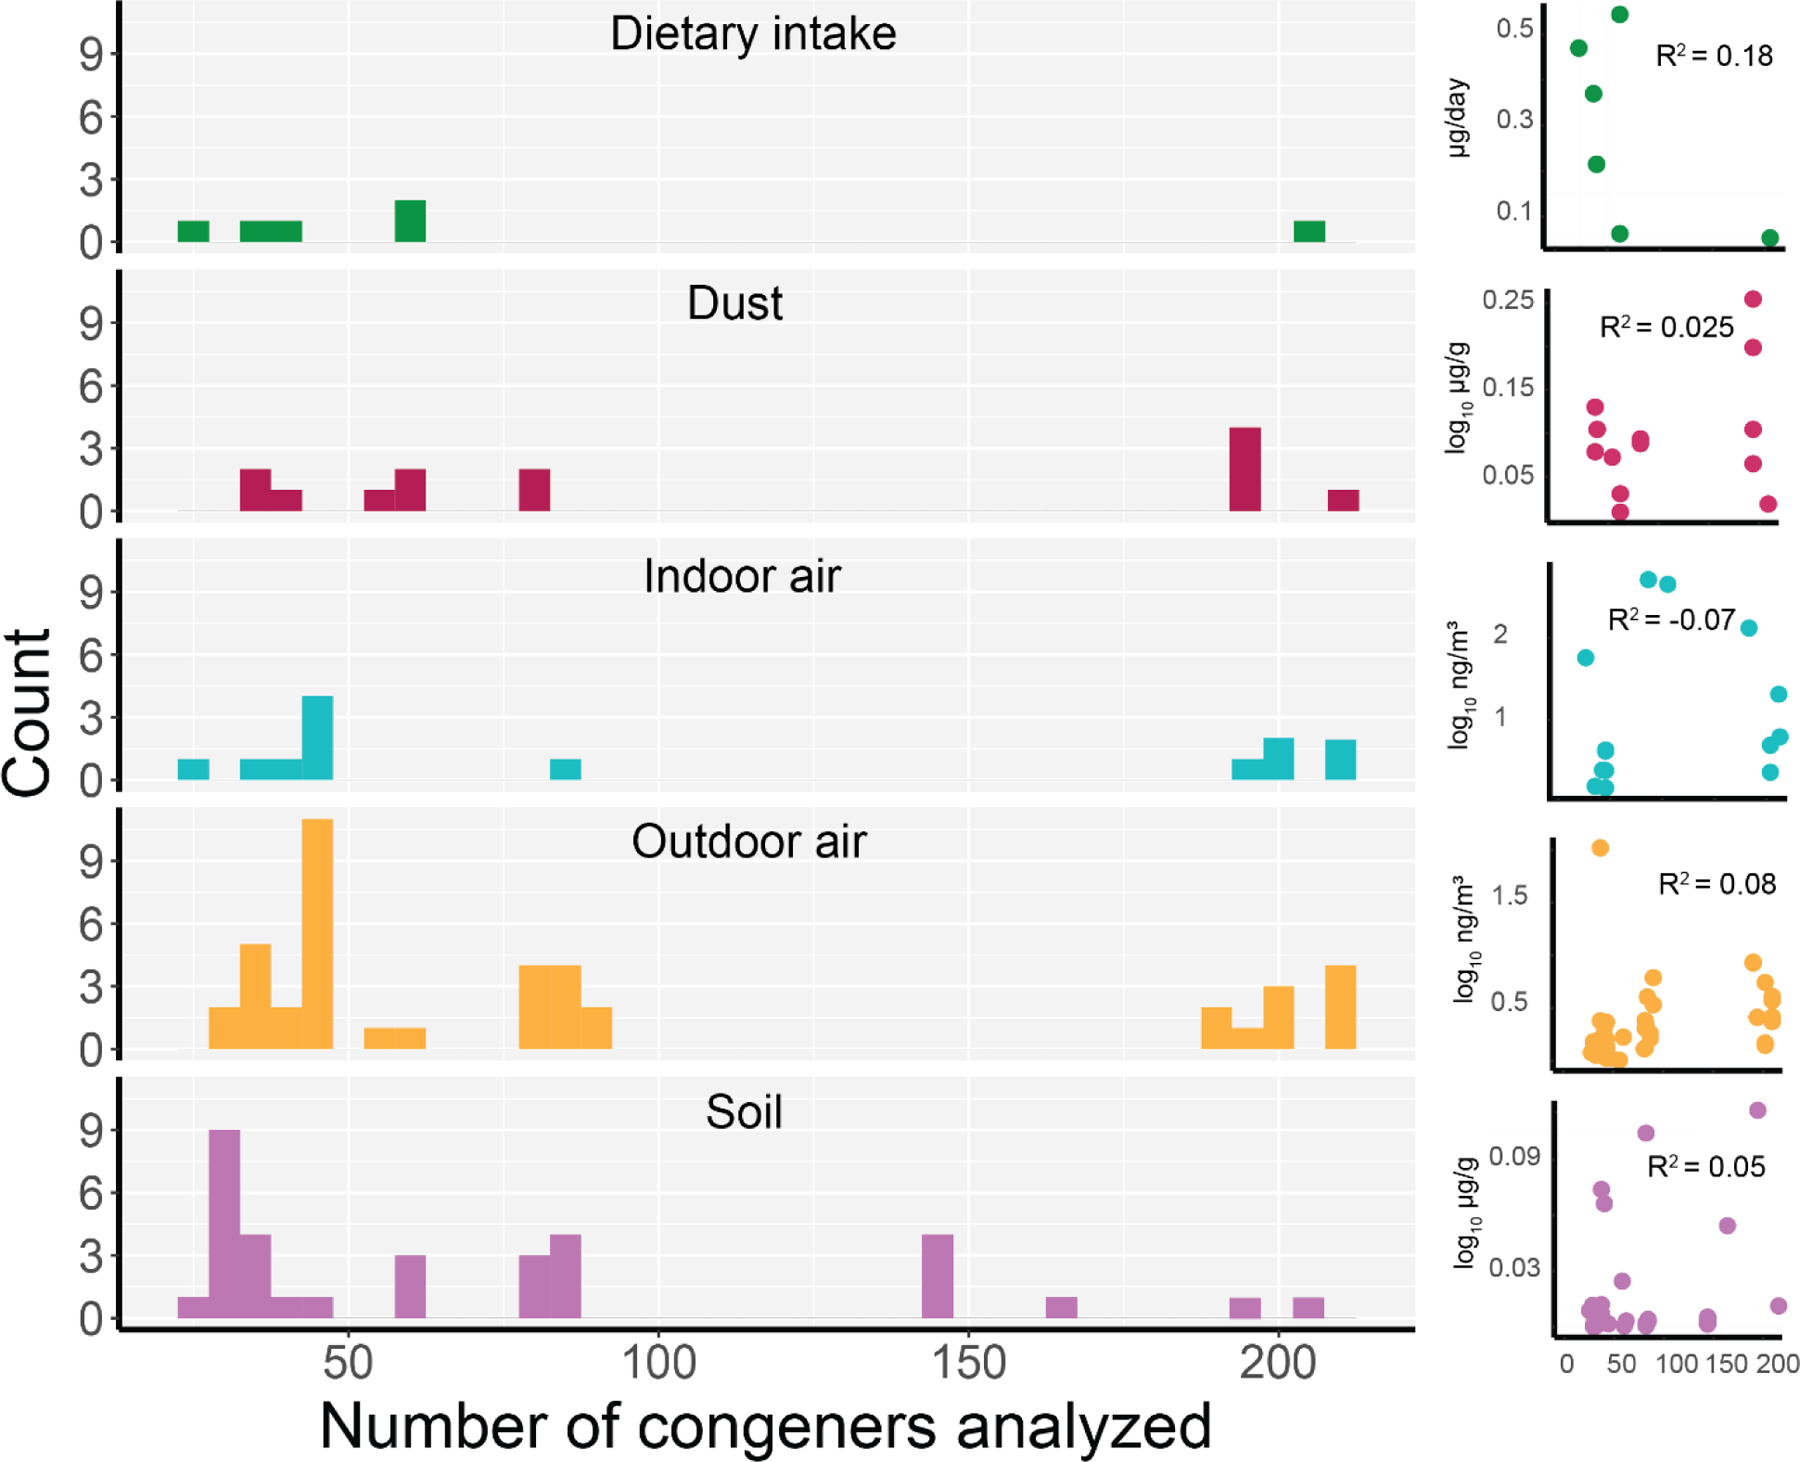
Histogram of the number of congeners analyzed within each study. Scatterplots and R2 values show the relationship between congener number and log10 of the reported concentration or dietary intake levels. Note, four studies reported the congeners analyzed based on the number of chlorines. For these, we assumed all congeners within these groups were analyzed.
3.3. Concentrations in environmental media
The average PCB concentration across studies was 0.1 μg/g, 0.017 μg/g, 3.5 ng/m3, and 0.53 ng/m3 for dust, soil, indoor air, and outdoor air, respectively (Table 2). While there was variation in concentrations for all media, the variability for indoor air was substantial, with measurements ranging from 0.01 to 233 ng/m3. In addition, mean values from the ten included indoor air studies ranged from 0.19 ng/m3 measured in semi-urban homes in Mexico to 15.3 ng/m3 measured in various indoor spaces in Canada. Some of this variability likely reflects the building materials and their age. For example, elevated indoor air PCB concentrations have been observed in public school buildings in the U.S., especially those that were built or extensively remodeled in the 1950s-1970s (U.S. Environmental Protection Agency 2012). Marek et al. (2017) reported on six schools built before, during, and after this time period. We included only data from U.S. schools built after 1979 in our analysis because indoor air in newer schools is likely to be more representative of background levels of exposure; schools built before 1979 had higher indoor air PCB concentrations, with school means ranging from 9.3 ng/m3 to 128.5 ng/m3 (Marek et al. 2017, 2020). In a U.S. EPA study of six school buildings built between the late 1950s and early 1970s, the median indoor air PCB concentration was 318 ng/m3, with a range in medians among schools of <50 to 807 ng/m3 (U.S. Environmental Protection Agency 2012). The primary sources of PCBs within these schools were identified as caulking and fluorescent light ballasts. Given this potential for high levels of contamination, especially in older buildings, our estimate of indoor air inhalation exposure may be an underestimate for some populations.
3.4. Dietary intake levels
The average dietary intake level across the included studies was 0.29 μg/day (Table 2). Interestingly, the most recently published of the six included studies analyzed 205 congeners and had the lowest estimated adult intake level of 0.053 μg/day (Saktrakulkla et al. 2020), suggesting that use of the average dietary intake (0.29 μg/day) may represent levels higher than current exposure. In addition, dietary exposure to PCBs has declined over time in many regions (Xue et al. 2014; Arrebola et al. 2018; Sirot et al. 2012; ATSDR 2000), likely reflecting both a decrease in contamination (environmental degradation and/or biotransformation over time) and a change in consumption patterns. Nonetheless, variation across populations is likely, which may reflect regional differences in contamination levels and/or fish consumption − typically the main contributor to PCB exposure in the diet (Arrebola et al. 2018; Xue et al. 2014). Furthermore, methodologies for measuring and calculating dietary intake vary widely, which may further contribute to the variation.
3.5. Exposure estimates
For each environmental medium and for dietary exposure, we used the mean concentration values across studies given in Table 2 and calculated adult exposure (Table 3) following the equations described above. In this estimation, dietary intake was the primary route of exposure for adults, comprising 88% (3.04 ng/kg-day) of total exposure, followed by indoor air inhalation (11%; 0.39 ng/kg-day; Figure 3A). Relative contributions from the other exposure routes were negligible (0.041–0.65%; Figure 3A) and thus are not discussed further. Additionally, for each environmental medium, we estimated PCB exposure for children ages 2 to <3 years and 6 to <12 years (Table 3; Figure 3B). Due to differences in exposure parameters (i.e., body weight, time spent indoors), we show that children may be subject to increased inhalation exposure, with children ages 2 to <3 years exposed to PCBs via inhalation of indoor air at nearly four times the rate of adults, and children ages 6 to <12 at twice the rate of adults. While we did not identify any studies published between 2008 and 2020 that included age-specific dietary PCB intake estimates, earlier analyses show that dietary PCB intake is also higher in children than adults (Health Canada 2002), suggesting that children may experience substantially higher total PCB exposures.
Table 3.
PCB exposure estimates for adults based on average concentrations reported in included studies. Values in brackets show potential range of exposure estimates based on the low- and high-end range of absorption factors provided in Table 1.
| Exposure in ng/kg-day ± standard deviation (Percent contribution to total exposure) [Range derived from low and high absorption factors] | |||
|---|---|---|---|
| Adults | 2 to <3 years | 6 to <12 years | |
| Dust ingestion | 0.022 ± 0.017 (0.65%) [0.013–0.026] | 0.19 [0.11–0.23] | 0.083 [0.049–0.097] |
| Soil ingestion | 0.0018 ± 0.0034 (0.053%) [0.0010–0.0021] | 0.031 [0.018–0.036] | 0.013 [0.0079–0.016] |
| Indoor inhalation | 0.39 ± 0.57 (11%) [0.20–0.56] | 1.5 [0.76–2.2] | 0.85 [0.42–1.21] |
| Outdoor inhalation | 0.015 ± 0.028 (0.44%) [0.0074–0.021] | 0.012 [0.0060–0.017] | 0.013 [0.0063–0.018] |
| Dermal contact | 0.0014 ± 0.0010 (0.041%) [0.00039–0.0097] | 0.027 [0.0078–0.19] | 0.0029 [0.00083–0.021] |
| Dietary intake | 3.0 ± 2.2 (88%) [1.8–3.6] | Data not available | Data not available |
| All pathways | 3.4 (100%) [2–4.2] | - | - |
Figure 3.

Stacked bar charts showing (A) total estimated PCB exposure in ng/kg-day for adults and (B) estimated PCB exposure from environmental media only (age specific dietary intake data not available) for ages 2 to <3, 6 to <12, and adults. Exposure estimates calculated from averages across all included studies for both environmental media and dietary intake.
To illustrate the variability across studies of PCB dietary intake and indoor air concentrations, we show the range of exposure estimates based on measures within each study (Figure 4). Notably, there is a large range of overlap between these exposure routes, such that it is plausible that under certain conditions PCB exposure arising from indoor air may exceed that from dietary intake. Furthermore, as mentioned earlier, data on PCB absorption factors remain incomplete. To assess the potential impact of alternative assumptions on our results, we show exposure estimates based on the low and high potential range of these factors (Table 3). The variation this introduces is smaller than other sources of variability/uncertainty. For example, for most exposure estimates shown in Table 3, the standard deviations are considerably larger than the range of values that result from applying low and high absorption factors.
Figure 4.

Violin plot showing PCB exposure estimates (ng/kg-day) for adults based on measures within each indoor air and dietary intake study. Open circles represent individual studies.
Our estimates of exposure are based on background levels of PCBs to which people may be exposed, with the upper range of total exposure for adults well below the lowest oral reference dose for a PCB Aroclor set by the U.S. Environmental Protection Agency’s Integrated Risk Information System (i.e., 20 ng/kg-day for Aroclor 1254 (U.S. Environmental Protection Agency 1994)). The reference dose is an estimate of a daily oral exposure to the human population, including sensitive subgroups, that is likely to be without an appreciable risk of deleterious effects during a lifetime. However, there is a potential for much higher exposure in contaminated areas. Populations living near or working at e-waste recyling facilities, in China and India for example, have the potential to be exposed to high levels of PCBs in the soil and outdoor air (Chakraborty et al. 2018; Wang et al. 2016). In addition, our exposure estimates are based on average exposure factors and do not attempt to represent the variability among individuals. For example, given the potential significance of indoor air inhalation for PCB exposure, the fraction of time spent indoors may be an important driving variable and likely differs regionally and by season. Body weight is an additional factor that is variable. Substantial differences between the age-specific inhalation exposure estimates demonstrate the impact of varying these parameters. Thus, while our estimates provide a general overview of background exposure to PCBs, they do not reflect the full extent of variability among individuals within the defined age groups.
Different exposure routes not only contribute differently to total PCB exposure, but also affect the specific congeners to which humans are exposed. Inhalation exposure tends to favor the volatile and lower chlorinated congeners. For example, in a study of 201 congeners, Ampleman et al. (2015) reported that 70–80% of inhalation exposure was due to lower chlorinated congeners and that the inhalation to diet exposure ratio increased with decreasing chlorination. These lower chlorinated congeners tend to be more readily metabolized compared to the lipophilic higher chlorinated congeners, and thus are often at low to undetectable levels in human tissues (Grimm et al. 2015). Importantly, however, low serum levels may not reflect low exposure; instead, presence of these congeners at detectable levels could be indicative of appreciable chronic or recent episodic exposure. In studies of school aged children and of teachers in PCB-containing school buildings, compared to referent populations, an enrichment of lower chlorinated congeners was found in serum samples (Herrick, Meeker, and Altshul 2011; Megson et al. 2013). Lastly, it is important not to equate an increased rate of metabolism with decreased toxicity. Rather, there is evidence to suggest that the lower chlorinated congeners can be bioactivated into toxic metabolites, with the potential for carcinogenic, neurologic, and endocrine disrupting effects (Grimm et al. 2015).
Given the unequal rate of metabolism of PCB congeners, examining PCB congener profiles in human tissues to dissociate the relative contributions from different exposure pathways may offer limited insight (Christensen, Carlson, and Lehmann 2021). Beyond being difficult to detect in human tissues, lower chlorinated congeners, such as those found in air, are often not measured in PCB exposure assessments. For example, of the 35 congeners measured in the National Health and Nutrition Examination Survey (NHANES), 23 of these have at least 6 chlorine substitutions. In contrast, the higher chlorinated congeners common in meat, fish, and dairy are frequently measured, bioaccumulate, and tend to increase with age (though this is more variable in reproductive women), thus the signature from dietary exposure in human tissues is often more robust (DeCaprio et al. 2005; Johnson-Restrepo et al. 2005). Still, there is evidence that both inhalation and dietary pathways can result in significant exposures that may be population specific. In a study of Akwesasne adolescents, a specific congener profile in serum was identified that accounted for over 50% of the total variance within serum PCB profiles. This congener group was not associated with dietary patterns or other predictors, suggesting a significant inhalation exposure pathway (Ravenscroft, Schell, and Environm 2018).
Our analysis sought to evaluate total PCB exposure and assumed that the sum of more than 20 PCB congeners is an adequate representation of the total. It would be interesting, as well, to compile exposure information for specific PCB congeners. This could be particularly important for assessing the sources and exposures for nonlegacy PCBs, the emissions of which have the potential to increase given their modern production (Anh et al. 2021). Indeed, for both susceptible groups and the general population, it would be informative to examine congener-specific exposure estimates to gain further insight into human PCB exposures and how they may change over time. However, at this time, there are several limitations to assessing congener-specific exposure that will require future research. Except for dioxin-like congeners, which, on a mass basis, make up only a minor portion of total PCB exposure (e.g., (Son et al. 2012)), there are no toxicological reference values available to help interpret the potential consequences of exposures to individual congeners. Furthermore, given the variability in the specific congeners measured in each study for each medium and across media, the feasibility of this approach based on the current literature is limited. For example, of the ten included air studies, only 2 of the twelve dioxin-like congeners were reported with any consistency (6 out of ten studies measured PCB 105, five out of ten measured PCB 118), and of the six included diet studies, only one reported individual congener measurements for total dietary intake. An additional challenge to compiling congener-specific exposure estimates arises from differences in the patterns of congener coelutions between studies. Often, congeners coelute into peaks comprised of 2–6 congeners, the composition of which varies across studies. Thus, while an individual congener may be measured by multiple studies, comparisons of measured levels of that congener would be limited to studies with similar coelution patterns.
6. Conclusions
Many PCB congeners are persistent organic pollutants that bioaccumulate and biomagnify in terrestrial and aquatic food chains. Though banned in the U.S. since 1979, humans continue to be exposed as a result of legacy PCBs in the environment, as well as through exposures to inadvertently produced nonlegacy PCBs. These exposures can come from various sources, including dietary intake, inhalation, dermal contact, or ingestion of dust or soil. This review and data analysis highlight the limitations in the data available to assess population exposures to PCBs. The data that do exist are challenging to combine due to inconsistent congener measurements and detection limits. Insight into true human PCB exposures would be furthered by more systematic assessments that employ adequate and consistent methodology to measure all 209 congeners.
The relative contribution to total PCB exposures from dietary intake or indoor air inhalation can be both variable and dynamic. Dietary intake of PCBs will likely continue to slowly decline as higher chlorinated legacy PCBs are metabolized and eliminated from the food chain. In addition, long-term monitoring sites have shown a general decline in atmospheric PCB concentrations over time (Sun, Basu, and Hites 2006; Sun et al. 2007). However, indoor inhalation exposure for certain congeners has the potential to increase given their inadvertent modern production in pigments used in paints and consumer products (Hu and Hornbuckle 2010; Hu, Martinez, and Hornbuckle 2008; Grimm et al. 2015). Given that children may experience higher indoor air inhalation exposures and potentially higher dietary PCB intake (Health Canada 2002), they may be a particularly susceptible group. To put these exposure estimates into context, additional toxicological and epidemiological studies of inhalation exposures may benefit human health risk assessment (Lehmann et al. 2015).
Supplementary Material
Acknowledgements
We thank Todd Zurlinden, Rachel Marek, Keri Hornbuckle, Kent Thomas, Patrick Wilson, and reviewers selected by Science of the Total Environment for help improving the manuscript. This manuscript has been reviewed by the U.S. EPA and approved for publication. Approval does not necessarily signify that the contents reflect the views or opinions of the U.S. EPA, nor does mention of trade names or commercial products constitute endorsement or recommendation for use. Graphical abstract created with elements from Freepik.com.
Funding Sources
This research did not receive any specific grant from funding agencies in the public, commercial, or not-for-profit sectors.
Footnotes
Conflicts of Interest
The authors have no conflicts of interest.
References
- Ampleman MD, Martinez A, DeWall J, Rawn DFK, Hornbuckle KC, and Thorne PS. 2015. ‘Inhalation and Dietary Exposure to PCBs in Urban and Rural Cohorts via Congener-Specific Measurements’, Environmental Science & Technology, 49: 1156–64. [DOI] [PMC free article] [PubMed] [Google Scholar]
- Anh Hoang Quoc, Watanabe Isao, Minh Tu Binh, and Takahashi Shin. 2021. ‘Unintentionally produced polychlorinated biphenyls in pigments: An updated review on their formation, emission sources, contamination status, and toxic effects’, Science of the Total Environment, 755. [DOI] [PubMed] [Google Scholar]
- Arrebola JP, Castano A, Esteban M, Bartolome M, Perez-Gomez B, Ramos JJ, and Bioambient Es. 2018. ‘Differential contribution of animal and vegetable food items on persistent organic pollutant serum concentrations in Spanish adults. Data from BIOAMBIENT.ES project’, Science of the Total Environment, 634: 235–42. [DOI] [PubMed] [Google Scholar]
- ATSDR. 2000. “Toxicological Profile for Polychlorinated Biphenyls.” In. [PubMed]
- Canada, Health. 2002. ‘Dietary Intakes of Contaminants and Other Chemicals for Different Age-Sex Groups of Canadians - Canadian Total Diet Study - Health Canada’, Accessed August 3, 2020. https://www.canada.ca/en/health-canada/services/food-nutrition/food-nutrition-surveillance/canadian-total-diet-study/dietary-intakes-contaminants-other-chemicals-different-sex-groups-canadians.html.
- Chakraborty P, Selvaraj S, Nakamura M, Prithiviraj B, Cincinelli A, and Bang JJ. 2018. ‘PCBs and PCDD/Fs in soil from informal e-waste recycling sites and open dumpsites in India: Levels, congener profiles and health risk assessment’, Science of the Total Environment, 621: 930–38. [DOI] [PubMed] [Google Scholar]
- Christensen Krista, Carlson Laura M., and Lehmann Geniece M.. 2021. ‘The role of epidemiology studies in human health risk assessment of polychlorinated biphenyls’, Environmental Research, 194. [DOI] [PMC free article] [PubMed] [Google Scholar]
- Csiszar Susan A., Daggupaty Sreerama M., Verkoeyen Stephanie, Giang Amanda, and Diamond Miriam L.. 2012. ‘SO-MUM: A Coupled Atmospheric Transport and Multimedia Model Used to Predict Intraurban-Scale PCB and PBDE Emissions and Fate’, Environmental Science & Technology, 47: 436–45. [DOI] [PubMed] [Google Scholar]
- DeCaprio AP, Johnson GW, Tarbell AM, Carpenter DO, Chiarenzelli JR, Morse GS, Santiago-Rivera AL, Schymura MJ, and Environment Akwesasne Task Force on the. 2005. ‘Polychlorinated biphenyl (PCB) exposure assessment by multivariate statistical analysis of serum congener profiles in an adult Native American population’, Environ Res, 98: 284–302. [DOI] [PubMed] [Google Scholar]
- Environmental Protection Agency, U.S. 1992. “Guidelines for Exposure Assessment.” In. Washington, DC: U.S. Environmental Protection Agency. [Google Scholar]
- ———. 2012. “Polychlorinated Biphenyls (PCBs) in School Buildings: Sources, Environmental Levels, and Exposures.” In. Washington, D.C.: U.S. EPA. [Google Scholar]
- ———. 2014. “Child-Specific Exposure Scenarios Examples (Final Report).” In. Washington, DC: U.S. Environmental Protection Agency. [Google Scholar]
- Grimm FA, Hu DF, Kania-Korwel I, Lehmler HJ, Ludewig G, Hornbuckle KC, Duffel MW, Bergman A, and Robertson LW. 2015. ‘Metabolism and metabolites of polychlorinated biphenyls’, Critical Reviews in Toxicology, 45: 245–72. [DOI] [PMC free article] [PubMed] [Google Scholar]
- Harrad S, Ibarra C, Robson M, Melymuk L, Zhang XM, Diamond M, and Douwes J. 2009. ‘Polychlorinated biphenyls in domestic dust from Canada, New Zealand, United Kingdom and United States: Implications for human exposure’, Chemosphere, 76: 232–38. [DOI] [PubMed] [Google Scholar]
- Herrick RF, Meeker JD, and Altshul L. 2011. ‘Serum PCB levels and congener profiles among teachers in PCB-containing schools: a pilot study’, Environmental Health, 10: 56. [DOI] [PMC free article] [PubMed] [Google Scholar]
- Herrick RF, Stewart JH, and Allen JG. 2016. ‘Review of PCBs in US schools: a brief history, an estimate of the number of impacted schools, and an approach for evaluating indoor air samples’, Environ Sci Pollut Res Int, 23: 1975–85. [DOI] [PMC free article] [PubMed] [Google Scholar]
- Hozo SP, Djulbegovic B, and Hozo I. 2005. ‘Estimating the mean and variance from the median, range, and the size of a sample’, BMC Med Res Methodol, 5: 13. [DOI] [PMC free article] [PubMed] [Google Scholar]
- Hu DF, and Hornbuckle KC. 2010. ‘Inadvertent Polychlorinated Biphenyls in Commercial Paint Pigments’, Environmental Science & Technology, 44: 2822–27. [DOI] [PMC free article] [PubMed] [Google Scholar]
- Hu DF, Martinez A, and Hornbuckle KC. 2008. ‘Discovery of Non-Aroclor PCB (3,3 ‘-Dichlorobiphenyl) in Chicago Air’, Environmental Science & Technology, 42: 7873–77. [DOI] [PMC free article] [PubMed] [Google Scholar]
- Johnson-Restrepo B, Kannan K, Rapaport DP, and Rodan BD. 2005. ‘Polybrominated diphenyl ethers and polychlorinated biphenyls in human adipose tissue from New York’, Environmental Science & Technology, 39: 5177–82. [DOI] [PubMed] [Google Scholar]
- Kallenborn R, Oehme M, Wynn-Williams DD, Schlabach M, and Harris J. 1998. ‘Ambient air levels and atmospheric long-range transport of persistent organochlorines to Signy Island, Antarctica’, Science of the Total Environment, 220: 167–80. [Google Scholar]
- Kraft M, Rauchfuss K, Sievering S, Woekner M, Neugebauer F, and Fromme H. 2017. ‘Quantification of all 209 PCB congeners in blood-Can indicators be used to calculate the total PCB blood load?’, International Journal of Hygiene and Environmental Health, 220: 201–08. [DOI] [PubMed] [Google Scholar]
- Lehmann GM, Christensen K, Maddaloni M, and Phillips LJ. 2015. ‘Evaluating Health Risks from Inhaled Polychlorinated Biphenyls: Research Needs for Addressing Uncertainty’, Environmental Health Perspectives, 123: 109–13. [DOI] [PMC free article] [PubMed] [Google Scholar]
- Lehmann GM, LaKind JS, Davis MH, Hines EP, Marchitti SA, Alcala C, and Lorber M. 2018. ‘Environmental Chemicals in Breast Milk and Formula: Exposure and Risk Assessment Implications’, Environ Health Perspect, 126: 96001. [DOI] [PMC free article] [PubMed] [Google Scholar]
- Liu Ying, Wang Siyao, McDonough Carrie A., Khairy Mohammed, Muir Derek C. G., Helm Paul A., and Lohmann Rainer. 2015. ‘Gaseous and Freely-Dissolved PCBs in the Lower Great Lakes Based on Passive Sampling: Spatial Trends and Air–Water Exchange’, Environmental Science & Technology, 50: 4932–39. [DOI] [PubMed] [Google Scholar]
- Mandalakis M, and Stephanou EG. 2004. ‘Wet deposition of polychlorinated biphenyls in the eastern Mediterranean’, Environmental Science & Technology, 38: 3011–18. [DOI] [PubMed] [Google Scholar]
- Marek RF, Thorne PS, Herkert NJ, Awad AM, and Hornbuckle KC. 2017. ‘Airborne PCBs and OH-PCBs Inside and Outside Urban and Rural U.S. Schools’, Environmental Science & Technology, 51: 7853–60. [DOI] [PMC free article] [PubMed] [Google Scholar]
- ———. 2020. “Dataset for airborne PCBs and OH-PCBs inside and outside urban and rural U.S. schools.” In, edited by University of Iowa. [Google Scholar]
- Megson D, O’Sullivan G, Comber S, Worsfold PJ, Lohan MC, Edwards MR, Shields WJ, Sandau CD, and Patterson DG. 2013. ‘Elucidating the structural properties that influence the persistence of PCBs in humans using the National Health and Nutrition Examination Survey (NHANES) dataset’, Science of the Total Environment, 461: 99–107. [DOI] [PubMed] [Google Scholar]
- Megson David, Benoit Nadine B., Sandau Courtney D., Chaudhuri Sri R., Long Tanya, Coulthard Emma, and Johnson Glenn W.. 2019. ‘Evaluation of the effectiveness of different indicator PCBs to estimating total PCB concentrations in environmental investigations’, Chemosphere, 237: 124429. [DOI] [PubMed] [Google Scholar]
- Meijer SN, Ockenden WA, Sweetman A, Breivik K, Grimalt JO, and Jones KC. 2003. ‘Global distribution and budget of PCBs and HCB in background surface soils: Implications or sources and environmental processes’, Environmental Science & Technology, 37: 667–72. [DOI] [PubMed] [Google Scholar]
- Norstrom K, Czub G, McLachlan MS, Hu DF, Thorne PS, and Hornbuckle KC. 2010. ‘External exposure and bioaccumulation of PCBs in humans living in a contaminated urban environment’, Environment International, 36: 855–61. [DOI] [PMC free article] [PubMed] [Google Scholar]
- Ravenscroft J, Schell LM, and Akwesasne Task Force Environm. 2018. ‘Patterns of PCB exposure among Akwesasne adolescents: The role of dietary and inhalation pathways’, Environment International, 121: 963–72. [DOI] [PubMed] [Google Scholar]
- Robertson LW, and Ludewig G. 2011. ‘Polychlorinated Biphenyl (PCB) carcinogenicity with special emphasis on airborne PCBs’, Gefahrstoffe Reinhaltung Der Luft, 71: 25–32. [PMC free article] [PubMed] [Google Scholar]
- Saktrakulkla P, Lan T, Hua J, Marek RF, Thorne PS, and Hornbuckle KC. 2020. ‘Polychlorinated Biphenyls in Food’, Environmental Science & Technology, 54: 11443–52. [DOI] [PMC free article] [PubMed] [Google Scholar]
- Shanahan Caitlin E., Spak Scott N., Martinez Andres, and Hornbuckle Keri C.. 2015. ‘Inventory of PCBs in Chicago and Opportunities for Reduction in Airborne Emissions and Human Exposure’, Environmental Science & Technology, 49: 13878–88. [DOI] [PMC free article] [PubMed] [Google Scholar]
- Sirot V, Tard A, Venisseau A, Brosseaud A, Marchand P, Le Bizec B, and Leblanc JC. 2012. ‘Dietary exposure to polychlorinated dibenzo-p-dioxins, polychlorinated dibenzofurans and polychlorinated biphenyls of the French population: Results of the second French Total Diet Study’, Chemosphere, 88: 492–500. [DOI] [PubMed] [Google Scholar]
- Son Min-Hui, Kim Jun-Tae, Park Hyokeun, Kim Meehye, Paek Ock-Jin, and Chang Yoon-Seok. 2012. ‘Assessment of the daily intake of 62 polychlorinated biphenyls from dietary exposure in South Korea’, Chemosphere, 89: 957–63. [DOI] [PubMed] [Google Scholar]
- Sun P, Basu I, and Hites RA. 2006. ‘Temporal trends of polychlorinated biphenyls in precipitation and air at Chicago’, Environmental Science & Technology, 40: 1178–83. [DOI] [PubMed] [Google Scholar]
- Sun P, Ilora Basu, Blanchard P, Brice KA, and Hites RA. 2007. ‘Temporal and spatial trends of atmospheric polychlorinated biphenyl concentrations near the Great Lakes’, Environmental Science & Technology, 41: 1131–36. [DOI] [PubMed] [Google Scholar]
- U.S. Environmental Protection Agency. 1994. “Integrated Risk Information System (IRIS) Chemical Assessment Summary. Aroclor 1254; CASRN 11097-69-1.” In.
- Wang Y, Hu J, Lin W, Wang N, Li C, Luo P, Hashmi MZ, Wang W, Su X, Chen C, Liu Y, Huang R, and Shen C. 2016. ‘Health risk assessment of migrant workers’ exposure to polychlorinated biphenyls in air and dust in an e-waste recycling area in China: Indication for a new wealth gap in environmental rights’, Environment International, 87: 33–41. [DOI] [PubMed] [Google Scholar]
- Xue J, Liu SV, Zartarian VG, Geller AM, and Schultz BD. 2014. ‘Analysis of NHANES measured blood PCBs in the general US population and application of SHEDS model to identify key exposure factors’, Journal of Exposure Science and Environmental Epidemiology, 24: 615–21. [DOI] [PubMed] [Google Scholar]
Associated Data
This section collects any data citations, data availability statements, or supplementary materials included in this article.