

Summary
Multiple genome-wide association studies (GWAS) have identified specific genetic variants in the coiled-coil domain containing 92 (CCDC92) locus that is associated with obesity and type 2 diabetes in humans. However, the biological function of CCDC92 in obesity and insulin resistance remains to be explored. Utilizing wild-type (WT) and Ccdc92 whole-body knockout (KO) mice, we found that Ccdc92 KO reduced obesity and increased insulin sensitivity under high-fat diet (HFD) conditions. Ccdc92 KO inhibited macrophage infiltration and fibrosis in white adipose tissue (WAT), suggesting Ccdc92 ablation protects against adipose tissue dysfunction. Ccdc92 deletion also increased energy expenditure and further attenuated hepatic steatosis in mice on an HFD. Ccdc92 KO significantly inhibited the inflammatory response and suppressed the NLR Family Pyrin Domain Containing 3 (NLRP3) inflammasome in WAT. Altogether, we demonstrated the critical role of CCDC92 in metabolism, constituting a potential target for treating obesity and insulin resistance.
Subject areas: Cell biology, Cellular physiology, Pathophysiology
Graphical abstract
Highlights
-
•
Ccdc92 deficiency reduces obesity and insulin resistance in mice after a HFD challenge
-
•
Ccdc92 KO inhibits inflammatory response in white adipose tissue from mice on HFD
-
•
Ccdc92 KO attenuates NF-κB signaling and reduces NLRP3 inflammasome activation
Cell biology; Cellular physiology; Pathophysiology
Introduction
Energy balance in animals is dictated by energy intake and subsequent energy expenditure and storage. Energy disorders and adipose tissue dysfunction develop obesity and type 2 diabetes (T2D).1 It has been recognized that dysfunctional adipose tissue secretes proinflammatory cytokines and chemokines, promoting macrophage infiltration into adipose tissue.2,3 Obesity induces chronic inflammation in adipose and peripheral tissues, resulting in low-grade systemic inflammation and facilitating insulin resistance and T2D.3
There is a growing appreciation that specific genes and genetic variations can be involved in common diseases, including diabetes and cardiovascular disease (CVD). Coiled-Coil Domain Containing 92 (CCDC92), also known as Limkain Beta 2 and FLJ22471, is a coiled-coil domain protein that has been shown to interact with centrosomal protein 164 (CEP164) in the centriole/ciliary interface.4,5 Multiple independent genome-wide association studies (GWAS) have identified specific variants in the CCDC92 locus that are associated with obesity, T2D, and coronary artery disease (CAD).6,7,8,9,10,11,12,13 Among these variants, the coding variant rs11057401 (p.Ser70Cys) is associated with CAD, possibly through increased insulin resistance.8,13 Another genetic research study discovered that the rs825476 variant in the CCDC92 gene is also associated with T2D and CAD.12 These genetic analyses highlight that CCDC92 potentially plays a critical role in metabolic disorders, insulin resistance, and CVD. However, the biological function of CCDC92 remains unclear.
The present study demonstrated that the ablation of Ccdc92 inhibited adipose tissue dysfunction and increased insulin sensitivity in mice on a high-fat diet (HFD). Ccdc92 deletion suppressed adipocyte differentiation and reduced macrophage infiltration in white adipose tissue (WAT). In addition, Ccdc92 KO mice exhibited enhanced energy expenditure and attenuated hepatic steatosis. The inflammatory response, particularly the NLRP3 inflammasome activation, was inhibited in the adipose tissue of Ccdc92 KO mice.
Results
Ccdc92 is downregulated in mouse adipose tissue after high-fat diet (HFD) feeding
GWAS studies have revealed that multiple specific variants in the CCDC92 gene are associated with obesity and insulin resistance.6,7,8,9,10,11,12,13 Human CCDC92 mRNA is abundant in metabolically active tissues, particularly adipose tissue, according to the GTex database (https://gtexportal.org/home/gene/CCDC92). CCDC92 protein is abundant in human adipose tissue as detected by immunohistochemical (IHC) staining (Figure 1A). HFD feeding is widely used to induce obesity and insulin resistance in mice. By re-analyzing the microarray data published previously,14,15 we found that Ccdc92 was decreased in epididymal adipose tissue (eWAT) and inguinal adipose tissue (iWAT) from mice on an HFD (Figures 1B and 1C). We further measured the expression of CCDC92 in our mouse adipose tissues from C57BL/6N mice on an HFD compared with a normal chow diet (ND). We demonstrated that Ccdc92 was reduced to an average of 50 and 18% at the mRNA level in mouse eWAT and subcutaneous WAT (sWAT), respectively (Figure 1D), and consistently decreased at the protein level in eWAT after HFD feeding (Figure 1E). To determine which cell types CCDC92 is expressed in adipose tissue, we performed immunostaining in eWAT and found that CCDC92 was expressed in adipocytes (Perilipin-positive cells), mesenchymal stem cells (MSCs, CD44-positive cells) and macrophages (CD68-positive) (Figure 1F). Altogether, CCDC92 is responsive to metabolic disorders induced by an HFD challenge, suggesting a potentially critical role of CCDC92 in regulating adipose tissue function in vivo.
Figure 1.

CCDC92 is responsive to high-fat diet feeding in vivo
(A) Representative immunohistochemical (IHC) images of CCDC92 in normal human white adipose tissue (WAT). Scale bar = 20 μm.
(B) Microarray gene expression analysis of epididymal white adipose tissue (eWAT) in mice on a normal chow diet (ND) or high-fat diet (HFD) from the dataset (GSE32095).
(C) Microarray analysis of inguinal adipose tissue (iWAT) from mice on an ND or HFD (GSE4692). Heatmaps in B and C show the regulated genes related to lipid metabolism.
(D-F) Male C57BL/6N mice were fed an ND or HFD for 14 weeks
(D) mRNA expression of Ccdc92 in eWAT and subcutaneous white adipose tissue (sWAT), n = 4/group.
(E) Representative immunoblots and quantification of CCDC92 in eWAT, n = 4/group.
(F) Representative images show CCDC92 colocalization with Perilipin (adipose tissue marker), CD44 (mesenchymal stem cell marker), and CD68 (macrophage marker) in eWAT from C57BL/6N mice on HFD. Colocalization was quantified by Pearson’s correlation coefficient (PCC). Scale bar = 50 μm. Data are presented as mean ± SEM, ∗p < 0.05; ∗∗p < 0.01. Analysis in (D-F) used unpaired two-tailed t-test.
Ccdc92 KO reduces obesity in mice on an HFD
Firstly, global Ccdc92 KO mice were generated to determine whether CCDC92 is essential for HFD-induced obesity and insulin resistance in vivo (Figures S1A and S1B). Ccdc92 KO was validated by western blotting in mouse adipose tissue and liver (Figures S1C-S1F). Ccdc92 KO mice and littermate wild-type (WT) mice on an ND did not show a significant difference in body weight (BW) or WAT histology (Figures S2A and S2B). However, Ccdc92 KO mice gained significantly less BW starting from 6 weeks on an HFD (60% fat) than WT mice (Figure 2A). After the HFD challenge, Ccdc92 KO mice showed a reduced fat mass in adipose tissues measured by nuclear magnetic resonance (NMR) compared with WT mice on the HFD (Figures 2B and 2C), indicating a critical role of CCDC92 in adipose tissue function in vivo. The weights of WAT, including eWAT, sWAT, and mesenteric WAT (mWAT), a visceral adipose tissue, were significantly decreased in male Ccdc92 KO mice fed HFD, which was consistent with the NMR data (Figures 2D and 2E).
Figure 2.

Attenuated obesity and insulin resistance in male Ccdc92 KO mice on an HFD
(A) Seven to 8-week-old male Ccdc92 KO mice and littermate WT mice were fed HFD. Body weight (BW) of male Ccdc92 KO mice and littermate WT mice was measured at the indicated time points after HFD feeding, n = 10/group.
(B-E) Seven to 8-week-old male Ccdc92 KO mice and littermate WT mice were fed HFD for 14 weeks
(B) Representative images of each mouse group.
(C) Body composition measured by Nuclear Magnetic Resonance (NMR), WT: n = 5, Ccdc92 KO: n = 7.
(D) Representative images of eWAT, subcutaneous WAT (sWAT), and mesenteric WAT (mWAT).
(E) The ratios of eWAT, sWAT, and mWAT to BW in mice, n = 9/group.
(F) Insulin tolerance test (ITT) and (G) Oral glucose tolerance test (OGTT) were performed in male Ccdc92 KO and littermate WT mice on HFD for 13 weeks, n = 10/group. Right panel, quantification of the area under the curve (AUC).
(H) ITT and (I) OGTT were conducted in female Ccdc92 KO and littermate WT mice on HFD for 13 weeks, n = 10/group. Right panel, quantification of the AUC. Data are presented as mean ± SEM, ∗p < 0.05; ∗∗p < 0.01. Analysis in (A, C, F, G, H, and I) used two-way ANOVA with Bonferroni correction. Right parts for AUC in F, G, H, and I used unpaired Student t test; Analysis in (E) used unpaired two-tailed t-test. See also Figures S1 and S2.
Ccdc92 ablation improves insulin sensitivity and glucose tolerance in mice fed HFD
Obesity is a well-recognized risk factor for insulin resistance and T2D.16 Insulin tolerance tests (ITT) and oral glucose tolerance tests (OGTT) were conducted to measure insulin sensitivity and glucose tolerance in Ccdc92 KO and littermate WT mice. There were no significant differences in glucose levels between Ccdc92 KO and littermate WT mice on an ND (Figures S2C-S2F). However, under HFD conditions (HFD for 14 weeks), male Ccdc92 KO mice exhibited lower blood glucose than WT mice in both ITT and OGTT tests (Figures 2F and 2G). The area under the curve (AUC) analysis of ITT and OGTT indicated that Ccdc92 deletion increased insulin sensitivity and glucose tolerance in male mice fed HFD (Figures 2F and 2G). Similar insulin sensitivity and glucose tolerance phenotypes were observed in female Ccdc92 KO mice compared with littermate WT mice fed HFD (Figures 2H and 2I). WT mice were fed HFD for 4 weeks, and the expression of CCDC92 in eWAT was measured by western blotting. We found that CCDC92 expression was reduced in eWAT from HFD groups compared to the ND group (Figure S2G). OGTT and ITT tests were conducted in Ccdc92 KO and littermate WT mice after 4 weeks of HFD feeding at which time there was no body weight difference between the two groups (Figures S2H-S2J). Our findings suggest that Ccdc92 KO had no effect on glucose tolerance and insulin sensitivity at this early time point (Figures S2I and S2J).
Ccdc92 KO attenuates adipocyte differentiation
Consistent with the reduced fat mass in Ccdc92 KO mice on HFD, H&E staining results indicated that Ccdc92 KO reduced adipocyte sizes in eWAT (an average of 27% decrease) and sWAT (an average of 38% decrease) (Figures 3A and 3B). The frequency distribution analysis of adipocyte sizes revealed that Ccdc92 KO leads to smaller adipocytes in eWAT and sWAT (Figures S3A and S3B). A reduced adipose tissue mass can result from less adipocyte differentiation.17 To create an in vitro model in which we could investigate the potential relationship between CCDC92 and adipocyte differentiation, we isolated ear mesenchymal stem cells (EMSCs) from WT littermates and Ccdc92 KO mice and differentiated them into adipocytes.18,19,20 Oil Red O (ORO) staining data showed that Ccdc92 deletion significantly reduced the EMSCs differentiation into adipocytes compared with WT after 3, 5, and 7 days of differentiation (Figure 3C). Mechanistically, Ccdc92 deletion suppressed the mRNA and protein expression of peroxisome proliferator-activated receptor-gamma (PPARγ) and CCAAT Enhancer Binding Protein Alpha (CEBPα) (Figures 3D-3F), which are critical transcription factors of adipocyte differentiation.21 As expected for genes involved in adipocyte differentiation, loss of Ccdc92 reduced the expression of adipocyte marker genes such as Fabp4 (aP2), Glut4, Scd1 and Acly (Figure S3C). Besides the regulation of PPARγ expression, we further found that CCDC92 enhanced PPARγ transcriptional activity as measured by the PPRE-driven luciferase assay (Figure 3G). Altogether, our data suggest that Ccdc92 ablation leads to reduced adipocyte differentiation via suppression of PPARγ and CEBPα, thereby contributing to reduced obesity in mice. Our immunostaining data indicate a colocalization of CCDC92 with CEP164, a centriole appendage protein required for primary cilium formation,22 in EMSCs (Figure S4).
Figure 3.

Decreased adipocyte differentiation in Ccdc92-deficient mesenchymal stem cells (MSCs)
(A and B) Male Ccdc92 KO mice and WT littermates were fed HFD for 14 weeks, n = 5/group.
(A) Representative H&E staining images of eWAT and sWAT. Scale bar = 50 μm
(B) Adipocyte area was analyzed in eWAT and sWAT sections from 5 mice/group.
(C-F) Ear MSCs (EMSCs) from male Ccdc92 KO mice and littermate WT mice were cultured in an adipocyte differentiation medium for 1, 3, 5, and 7 days
(C) Oil Red O (ORO) staining and quantification were performed. Representative images are shown from at least 3 independent experiments. Scale bar = 100 μm.
(D) Relative mRNA levels of PPARγ and Cebpα during adipocyte differentiation were measured by RT-qPCR at the indicated time points. Representative data in D are shown from 3 independent experiments.
(E) Representative immunoblots of PPARᵧ and CEBPα at the indicated time points of adipocyte differentiation.
(F) Quantitative analysis of PPARᵧ and CEBPα expression from three independent experiments.
(G) HEK 293 cells were co-transfected with the PPRE-luciferase reporter gene, PPARγ, and CCDC92 or pcDNA3.1 (control) vectors for 24 h. PPRE-luciferase activity was measured and normalized to Renilla luciferase activity. Representative data in G are shown from 3 independent experiments. Data are presented as mean ± SEM, ∗p < 0.05; ∗∗p < 0.01. Analysis in (B) used unpaired two-tailed t-test. Analysis in C, D, F, and G used two-way ANOVA with Bonferroni correction. See also Figures S3 and S4.
Ccdc92 KO decreases inflammation in WAT
Chronic inflammation in adipose tissue can lead to insulin resistance and T2D in obese individuals.23 Infiltration of macrophages, the most abundant innate immune cells in adipose tissue, was evaluated by IHC staining with the macrophage marker, F4/80. Ccdc92 KO mice fed HFD showed potent resistance to macrophage infiltration in WAT, including eWAT and sWAT (Figure 4A). The number of crown-like structures (CLS), composed of macrophages surrounding dead or dying adipocytes, was significantly reduced in Ccdc92 KO WAT (92% decrease in eWAT and 92% decrease in sWAT) (Figure 4B). As measured by RT-qPCR, the macrophage markers, CD68 and F4/80, were consistently decreased in Ccdc92 KO WAT (Figure 4C). Obesity causes local chronic inflammation and fibrosis in adipose tissue, a hallmark of adipose tissue dysfunction linked to insulin resistance and T2D.24 We measured adipose tissue fibrosis by Masson’s trichrome staining and found that fibrosis was significantly reduced to 29 and 25% in eWAT and mWAT, respectively, from Ccdc92 KO mice fed HFD (Figures 4D and 4E). Ccdc92 KO consistently decreased the expression of fibrosis genes Tgfb1, Tgfb2, and Col1a1 (Figure 4F). Adipose tissue of obese individuals releases proinflammatory cytokines (e.g., IL-1β and TNFα) and adipokines (e.g., leptin and adiponectin).25 Ccdc92 KO mice also had a higher level of serum adiponectin and a lower level of leptin than WT littermates after HFD feeding (Figures 4G and 4H). Altogether, our data suggest that Ccdc92 deficiency inhibits chronic inflammation and fibrosis in WAT, improving adipose tissue function and contributing to elevated insulin sensitivity in mice.
Figure 4.

Decreased macrophage infiltration and fibrosis in WAT from Ccdc92 KO mice on HFD
Male Ccdc92 KO mice and littermate WT mice were fed HFD for 14 weeks
(A) Representative IHC images of F4/80, a macrophage marker, in eWAT and sWAT. Scale bar = 50 μm
(B) Quantitative analysis of crown-like structures (CLS) in eWAT and sWAT (WT: n = 5, Ccdc92 KO: n = 7).
(C) Quantitative analysis of macrophage markers in eWAT by RT-qPCR, n = 5/group.
(D) Representative images of Masson’s trichrome staining for fibrosis (blue) in eWAT and mWAT. Scale bar = 50 μm
(E) The percentage of fibrosis within the entire area was quantitatively analyzed in eWAT and mWAT, n = 4/group.
(F) Quantitative analysis of fibrosis-related genes in eWAT by RT-qPCR, n = 4-7/group.
(G) Serum adiponectin and serum leptin concentrations (H) were measured by ELISA assay in Ccdc92 KO mice and WT littermates, n = 8/group. Data are presented as mean ± SEM, ∗p < 0.05; ∗∗p < 0.01. Analysis in B, G, and H used unpaired two-tailed t-test. Analysis in C, E, and F used two-way ANOVA with Bonferroni correction.
Ccdc92 KO increases energy expenditure and thermogenesis in brown adipose tissue (BAT) in mice on the HFD
An important question is whether the reduction of obesity is due to lower caloric intake, increased energy expenditure, or a combination of both. Our data suggest that Ccdc92 deficiency did not significantly alter food intake (Figure 5A). However, Ccdc92 KO significantly increased total locomotor activity on either day or night (Figure 5B) and elevated oxygen consumption and energy expenditure at night during a 48-h period (Figures 5C and 5D). BAT plays an essential role in energy expenditure and thermogenesis in response to physiological or pathological stimuli.26 H&E staining of BAT showed a 70% smaller adipocyte size in Ccdc92 KO than littermate WT mice (Figure 5E). Uncoupling protein 1 (UCP1), a functional marker of BAT, was elevated in BAT in Ccdc92 KO mice fed HFD as measured by both IHC staining (Figure 5F) and western blotting, when compared to littermate WT mice (Figure 5G). Likewise, lipid catabolism/thermogenesis gene expression was upregulated in BAT from Ccdc92 KO mice (Figure 5H). Overall, our data indicate that Ccdc92 KO enhanced mouse energy expenditure and BAT lipid catabolism/thermogenesis.
Figure 5.

Increased energy expenditure in Ccdc92 KO mice on HFD
(A-D) Male Ccdc92 KO and littermate WT mice were fed HFD for 12 weeks
(A) Food intake/BW, (B) total locomotor activity/BW, (C) O2 consumption/BW, and (D) energy expenditure/BW were measured using the Comprehensive Lab Animal Monitoring System (CLAMS), WT: n = 5, Ccdc92 KO: n = 7.
(E-H) Male Ccdc92 KO and littermate WT mice were fed HFD for 14 weeks
(E) Representative images of H&E staining and quantification of adipocyte size in brown adipose tissue (BAT), n = 5/group. Scale bar = 50 μm
(F) Representative images of IHC for UCP1 in BAT and quantitative analysis, n = 6/group. Scale bar = 50 μm
(G) Representative immunoblot and quantification of UCP1, n = 4/group.
(H) mRNA expression of lipid catabolism and thermogenesis-related genes in BAT was determined by RT-qPCR, n = 7-8/group. Data are presented as mean ± SEM, ∗p < 0.05; ∗∗p < 0.01. Analysis in A-D and H used two-way ANOVA with Bonferroni correction. Analysis in E, F, and G used unpaired two-tailed t-test.
Ccdc92 deficiency attenuates hepatic steatosis in mice on the HFD
In obesity, adipose tissue releases proinflammatory cytokines, adipokines, and free fatty acids, and systemically, they impair liver metabolism and function and lead to insulin resistance. We found that CCDC92 expression is also downregulated in the liver from mice on HFD (Figure S5A). Although there were no changes in liver weight (LW) and triglyceride (TG) content in male Ccdc92 KO mice compared with WT mice on an ND (Figures S5B-S5F), Ccdc92 KO mice on the HFD showed lower LW and LW/BW ratio (Figure 6A). Both the H&E staining and lipid droplet analysis revealed smaller lipid droplets and reduced lipid accumulation in Ccdc92 KO compared with WT (Figures 6B and 6C). This liver fat reduction was further supported by an average of 2.7-fold increase (16 ± 1% vs. 6 ± 1%) in small-sized droplets and an average of 81% decrease (7 ± 1% vs. 37 ± 3%) in large-sized droplets in male Ccdc92 KO mice compared with littermate WT mice (Figure 6C). The reduced hepatic lipid accumulation resulting from Ccdc92 KO is further confirmed by Oil Red O staining (Figure 6D) and quantitative analysis of liver TG content (Figure 6E). In addition to hepatic fat reduction, serum TG content was also significantly decreased in Ccdc92 KO mice on HFD (Figure 6F). Ccdc92 KO mice exhibited significantly reduced total cholesterol (TC) and low-density lipoprotein cholesterol (LDL-C) (Figure 6G). A similar liver phenotype was observed in female Ccdc92 KO mice on the HFD (Figures 6H-6L). Furthermore, we found that Ccdc92 KO decreased de novo lipogenesis genes such as sterol regulatory element binding transcription factor 1 (Srebf1) and stearoyl-CoA desaturase-1 (Scd1) but did not significantly alter the fatty acid β-oxidation related genes in the liver (Figure S5G). Altogether, our data suggest that Ccdc92 deletion protects against HFD-induced hepatic steatosis and dyslipidemia.
Figure 6.

Attenuated hepatic steatosis in Ccdc92 KO mice fed HFD
(A G) Male Ccdc92 KO and littermate WT mice were fed HFD for 14 weeks
(A) BW, liver weight (LW), and LW/BW were measured in littermate WT mice (n = 5) and Ccdc92 KO mice (n = 7).
(B) H&E staining of liver sections. Scale bar = 100 μm
(C) Size ranges of lipid droplets in liver sections from male Ccdc92 KO mice and littermate WT mice, n = 9/group.
(D) Oil Red O (ORO) staining of liver sections from WT mice (n = 5) and Ccdc92 KO mice (n = 7). Scale bar = 50 μm.
(E) Liver triglycerides (TG) content in Ccdc92 KO mice and littermate WT mice was measured and the values were normalized to the weight of liver tissue by grams, n = 10/group.
(F) Serum TG was quantified in WT mice and Ccdc92 KO mice, n = 5/group.
(G) Serum total cholesterol (TC), high-density lipoprotein cholesterol (HDL-C), and low-density lipoprotein cholesterol (LDL-C) were measured in WT mice (n = 5) and Ccdc92 KO mice (n = 7).
(H-L) Female Ccdc92 KO mice (n = 9) and littermate WT mice (n = 10) were fed HFD for 14 weeks (H) BW.
(I) LW/BW.
(J) H&E staining of liver sections (scale bar = 100 μm).
(K) Liver TG and serum TG (L). Data are presented as mean ± SEM, ∗p < 0.05; ∗∗p < 0.01. Analysis in A, D, E, F, H, I, K, and L used unpaired two-tailed t-test. Analysis in G used two-way ANOVA with Bonferroni correction. See also Figure S5.
Inflammatory response is decreased in WAT in Ccdc92 KO mice
To gain a comprehensive understanding of the role of CCDC92 in adipose tissue, we performed RNA-sequencing (RNA-seq) of eWAT from Ccdc92 KO mice and WT littermates on the HFD. PCA analysis was performed with the normalized counts (based on the DESeq2 method) to investigate whether the samples from the same group clustered together (Figures S6A and S6B). A noticeable difference in the transcriptome profiles between WT and Ccdc92 KO groups was observed. In total, 2692 differentially expressed genes (DEGs) were found, out of which 1803 (67%) were upregulated while 889 (33%) were downregulated in WAT from WT mice compared with Ccdc92 KO mice (Figure S6C). Next, based on gene set enrichment analysis (GSEA) hallmark gene sets, we performed GSEA using up- and down-regulated DEGs to gain further insight into the metabolic processes differing between Ccdc92 KO and WT mice. Out of the 34 MSigDB hallmark gene sets, 27 were upregulated in WT WAT (18 gene sets are significant at FDR <25%, Figure S6D and Table S1), 9 out of which were significantly enriched at nominal p value <0.05. In Ccdc92 KO WAT, 7 gene sets were upregulated, and 5 out of which were enriched considerably (p < 0.05) (Figure S6D).
Besides GSEA, the Kyoto Encyclopedia of Genes and Genomes (KEGG), and Gene Ontology (GO) term pathway enrichment analysis showed similar results (Table S1). Using different databases (GSEA, KEGG, GO term), we found that DEGs are most significantly enriched in the biological process of fatty acid metabolism (NES = 2.329, p < 0.0001) (Figure 7A) in Ccdc92 KO WAT samples. Gene Ontology biological process (GO-BP) analysis also suggested a gene cluster for lipid catabolism (Figure 7A heatmap). Lipid catabolic genes, including Pnpla2, Ces1d, Ces1f, Pcca, and Irs1, were significantly increased in WAT from Ccdc92 KO mice (Figure 7B), suggesting potentially increased lipid catabolism resulting from Ccdc92 deficiency in WAT.
Figure 7.

Decreased inflammatory response and increased catabolic response in WAT in Ccdc92 KO mice on HFD
(A) Enrichment plot for top enriched Hallmark gene sets in Ccdc92 KO eWAT samples analyzed by gene set enrichment analysis (GSEA). FATTY ACID METABOLISM is one of the top Hallmark (Molecular Signatures Database, MSigDB) gene sets enriched in Ccdc92 KO mice compared with littermate WT mice. Right panel: heatmap of representative lipid catabolic genes in WAT listed as log2 fold change.
(B) Lipid catabolic process-related genes were determined by RT-qPCR, n = 5-7/group.
(C) Enrichment plot for top enriched Hallmark gene sets by GSEA in eWAT samples from WT mice. INFLAMMATORY RESPONSE is one of the top Hallmark gene sets enriched in WT mice compared with Ccdc92 KO mice. Right panel: heatmap of representative inflammatory genes listed as log2 fold change in WAT.
(D and E) Total enriched common genes related to the inflammatory response in WAT are illustrated in a Venn Diagram (D) and further validated by RT-qPCR (E), n = 5-7/group.
(F) Gene Ontology term enrichment (biological process, GO-BP) was performed to validate the GSEA. Gene clusters for lipid catabolism and inflammatory response identified in GO-BP overlapped with GSEA (in the circle, visualized by Cytoscape and ClueGO). Data are presented as mean ± SEM, ∗p < 0.05; ∗∗p < 0.01. Analysis in B and E used two-way ANOVA with Bonferroni correction. See also Figure S6 and Table S1.
Excessive fat accumulation in adipose tissue leads to the release of proinflammatory mediators, such as TNFα and IL1β, contributing to the development of insulin resistance.3,27 Upregulated genes among DEGs in WAT samples from WT mice were simultaneously enriched in the hallmark gene set of the inflammatory response (WAT, NES = 1.91, p value = 0.0027) (Figure 7C). Consistently, GO-BP analysis suggested a gene cluster of the inflammatory response was downregulated in Ccdc92 KO mice (Figure 7C heatmap). The Venn diagram illustrated that 61 DGEs in the WAT samples overlapped with the inflammatory response gene set (total of 200 genes) (Figure 7D). We validated the downregulation of overlapped genes, including Tnf-α, Timp1, and Ptafr, by RT-qPCR in eWAT (Figure 7E) from Ccdc92 KO compared with WT mice on HFD. GO term pathway enrichment analysis uncovered that Ccdc92 KO increased the lipid catabolic response and decreased the inflammatory response in WAT (Figure 7F), by which Ccdc92 deletion could reduce obesity and insulin resistance.
Ccdc92 KO leads to the inactivation of the Nod-like receptor protein 3 (NLRP3) inflammasome
Accumulating studies demonstrated that NLRP3 inflammasome activation induces obesity and insulin resistance.28,29 Among the overlapped inflammatory genes, Nlrp3 was significantly decreased at the mRNA and protein levels in WAT from Ccdc92 KO mice on HFD (Figures 8A and 8B). The NLRP3 inflammasome activates Caspase-1-dependent production of mature IL-1β and IL-18 30. We observed a reduced cleavage of caspase-1 in eWAT (Figure 8C) and lower serum IL-1β and IL-18 (Figure 8D) in male Ccdc92 KO mice. Serum IL-1β and IL-18 also decreased in female Ccdc92 KO mice on HFD (Figure 8E). Thus, minimized NLRP3 signaling in WAT could reduce proinflammatory cytokine secretion, which results in increased insulin sensitivity in Ccdc92 KO mice.
Figure 8.

NLRP3 inflammasome is inhibited in WAT in Ccdc92 KO mice
(A-D) Male Ccdc92 KO mice and littermate WT mice were fed HFD for 14 weeks
(A) The relative mRNA levels of inflammasome genes in eWAT were determined by RT-qPCR, n = 5-7/group.
(B) The expression of NLRP3 in eWAT was measured by western blotting. Right panel: quantitative analysis of NLRP3, n = 4/group.
(C) Cleaved Caspase-1 in eWAT was determined by western blotting. Right panel: quantification of cleaved/total Caspase-1, n = 4/group.
(D) Serum IL-1β (n = 5/group) and IL-18 (n = 9/group) were measured by ELISA assays.
(E) Female Ccdc92 KO mice and littermate WT mice were fed HFD for 14 weeks. Serum IL-1β (n = 10/group) and IL-18 (n = 5/group) were measured by ELISA assay. Data are presented as mean ± SEM, ∗p < 0.05; ∗∗p < 0.01. Analysis in A used two-way ANOVA with Bonferroni correction. Analysis in B-E used unpaired two-tailed t-test.
CCDC92 activates NF-κB signaling and the inflammatory response
NF-κB, a critical regulator of the proinflammatory response, upregulates NLRP3 at the transcriptional level.30,31 Ccdc92 KO decreased the phosphorylation of p65 at Ser536 (a phosphorylated activation site in response to a wide variety of NF-κB stimuli) in eWAT (Figure 9A), indicating attenuated NF-κB signaling in Ccdc92 KO mice. IκBα is a critical NF-κB inhibitor that sequesters NF-κB in the cytoplasm. IκBα ubiquitination and proteasomal degradation allow NF-κB to translocate to the nucleus and initiate the expression of NLRP3 and inflammatory mediators.32 To determine whether Ccdc92 ablation alters IκBα protein levels, we treated EMSC cells with TNFα to activate NF-κB signaling. Our data suggest that Ccdc92 deletion sustains a higher level of IκBα protein after TNFα treatment (Figure 9B). Furthermore, we found that Ccdc92 KO significantly reduced p65 nuclear translocation to 37%, 45%, and 68% after TNFα treatment at 5, 15, and 30 min, respectively (Figure 9C). Next, we tested whether CCDC92 activates NF-κB activity using a reporter gene containing a firefly luciferase gene under the control of multimerized NF-κB responsive elements. We found that CCDC92 overexpression increased NF-κB luciferase activity to 2.6-fold and 18.2-fold, respectively, in the absence or presence of TNFα (Figure 9D). Similar results were observed in p65-overexpressing cells (Figure 9D). To determine whether NF-κB is required for CCDC92 to upregulate NLRP3, we inhibited NF-κB signaling using the inhibitor of κB kinase (IKK)/NF-κB, Bay 11-7082. Adenovirus-mediated overexpression of CCDC92 significantly increased Nlrp3 expression in EMSCs, and Bay 11-7082 abolished CCDC92-dependent upregulation of Nlrp3 (Figure 9E). Altogether, CCDC92 upregulates NLRP3 via activation of NF-κB signaling.
Figure 9.

NF-κB signaling mediates CCDC92-dependent upregulation of NLRP3
(A) Representative immunoblots of p-p65 S536 and p65 in sWAT from Ccdc92 KO mice and littermate WT mice on HFD for 14 weeks. The p-p65/p65 ratio was quantitatively analyzed, n = 4 mice/group.
(B) Representative immunoblot of IκBα and quantitative analysis in EMSCs treated with TNF-α (10 ng/mL) at the indicated time points, n = 3 independent experiments.
(C) Representative immunoblot of nuclear and cytosolic p65 in EMSCs treated with TNF-α (10 ng/mL) at the indicated time points. Right panel, quantification of nuclear p65/cytosolic p65, n = 3 independent experiments.
(D) Relative NF-κB-luciferase activity in HEK 293 cells transfected with CCDC92 expression vector followed by treatment with TNF-α (10 ng/mL) for 24 h. Right panel, relative NF-κB-luciferase activity in HEK 293 cells transfected with CCDC92 and p65 expression vectors for 48 h. NF-κB-luciferase was measured and normalized to Renilla luciferase activity. The data in this panel are representatives of 3 independent experiments.
(E) Relative mRNA level of Nlrp3 in EMSCs infected with adenovirus encoding CCDC92 (Ad-CCDC92) or Ad-LacZ followed by treatment with Bay 11-7082 (10 μM), an inhibitor of κB kinase (IKK), for 24 h. The data in this panel are representative of 3 independent experiments. Data are presented as mean ± SEM, ∗p < 0.05; ∗∗p < 0.01. Analysis in A used unpaired two-tailed t-test. Analysis in B-E used two-way ANOVA with Bonferroni correction. See also Figures S7 and S8.
IκB Kinase alpha/beta (IKKα/β) is the upstream regulator of NF-κB signaling cascade.33 Ccdc92 KO inhibited the phosphorylation of IKKα/β (Figures S7A and S7B), which could further suppress NF-κB signaling via reducing Iκ-Bα degradation. It was predicted that CCDC92 would interact with other proteins related to the NF-κB pathway, including four and a half LIM domains 2 (FHL2).34 Our co-immunoprecipitation (Co-IP) results showed that CCDC92 interacted with FHL2 (Figures S7C and S7D) in EMSCs. Furthermore, CCDC92 overexpression increased FHL2 expression in EMSCs (Figure S7E). These data provided evidence supporting the CCDC92-dependent regulation of the NF-κB pathway.
Reduced adipose tissue macrophages (ATMs) in Ccdc92 KO mice
Macrophages comprise most of the resident immune cells in adipose tissues and are involved in adipose tissue dysregulation in obesity.35 Ccdc92 KO mice and littermate WT mice were fed HFD for 4 weeks when there was no body weight difference between these two groups, and ATMs were isolated from eWAT.36,37 By flow cytometry analysis, we found that Ccdc92 KO significantly reduced the content of ATMs (CD11b+/F4/80+) and proinflammatory macrophages (CD11b+/F4/80+/CD11c+) in eWAT (Figures S8A and S8B). To decipher the role of CCDC92 in macrophages, we isolated bone marrow-derived monocytes (BMDMs) from Ccdc92 KO and littermate WT mice, and differentiated macrophages were then treated with TNFα. We found that Ccdc92 KO significantly inhibited TNFα-induced NLRP3 expression at the mRNA and protein levels, suggesting CCDC92 also regulates inflammatory status in macrophages (Figures S8C and S8D).
Discussion
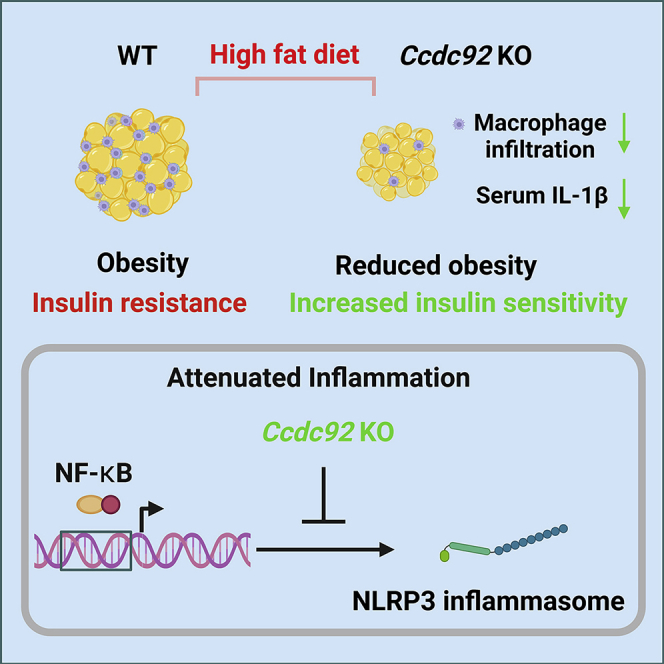
GWAS studies have identified numerous genetic variants associated with obesity and T2D, but the causal genes and biological pathways remain unknown at most loci.38 Having this knowledge is essential for developing precision clinical strategies and innovative therapies for metabolic disorders. Here, using Ccdc92 KO mice and a diet-induced obesity model, we investigated the role of CCDC92, a gene associated with T2D and CAD, in obesity and insulin resistance. We demonstrated that Ccdc92 deletion reduced obesity, inhibited the inflammatory response in WAT, and increased systemic insulin sensitivity (Figure 10). Overall, our studies expand the understanding of CCDC92’s biological function in metabolic disorders.
Figure 10.

Schema showing the role of CCDC92 in obesity and insulin resistance
Ccdc92 deficiency leads to reduced obesity and insulin resistance in mice after an HFD challenge. Ccdc92 deletion inhibits the inflammatory response and adipose tissue dysfunction. CCDC92 KO suppresses the NLRP3 inflammasome, a critical inducer for insulin resistance, via inhibiting NF-κB signaling.
Obesity is caused by excessive energy intake and insufficient energy expenditure, resulting in metabolic dysfunction in adipose tissue.39 CCDC92 is downregulated in WAT after 4 and 14 weeks of HFD feeding. There might be negative feedback in the regulation of CCDC92 in adipose tissue after an HFD challenge. Although there were no appreciable differences in BW and insulin sensitivity between WT and Ccdc92 KO mice on an ND, distinct phenotypes were displayed in those two groups under HFD-mediated lipid-overload conditions. Some genetically engineered transgenic mice only exhibited metabolic phenotypes after HFD challenges.40,41 Chow and HFD feeding may exert separate and independent effects on the measured phenotypes in vivo.42 In addition, there is a possibility that other genes compensate for Ccdc92 KO under normal diet conditions in vivo. Indeed, adipocyte hyperplasia (adipogenesis) is well known to contribute to the increased adipose tissue mass in obesity.43 The present study provided evidence demonstrating that Ccdc92 deletion reduced adipocyte differentiation via downregulation of PPARγ and CEBPα, two essential transcriptional factors for adipocyte differentiation. Previous studies suggest that CCDC92 can directly interact with CEP164,5 a centriole appendage protein required for primary cilium formation.22 Indeed, primary cilia can sense mechanical stimuli and further regulate adipose-derived stem cell differentiation via modulating PPARγ. Our data indicate that CCDC92 is co-localized with CEP164 in EMSCs. CCDC92 may regulate centriole and cilia function via interacting with CEP164, hence influencing PPARγ-mediated adipocyte differentiation. The mechanisms underlying the effects of CCDC92 on adipocyte differentiation warrant future investigation.
WAT inflammation leads to insulin resistance and metabolic disorders. The elevated proinflammatory cytokines in WAT result from obesity-induced local and systemic chronic inflammatory responses, which accelerate insulin resistance.44 In general, macrophages infiltrating adipose tissue surround dead adipocytes to form characteristic crown-like structures.45 In the present study, our results revealed an attenuated proinflammatory status manifested by considerably decreased crown-like structures in adipose tissue and reduced serum IL-1β and IL-18 levels in Ccdc92 KO mice on HFD. Adipose tissue expansion causes a hypoxic response and further promotes fibrosis in WAT,46 which is closely linked to obesity and insulin resistance.47 The current study demonstrated that fibrosis and fibrosis-related genes (Tgfb1 and Tgfb2) were significantly inhibited in WAT in Ccdc92 KO mice. In diet-induced obesity, dysfunctional adipose tissue also produces and releases adipokines to accelerate systemic insulin resistance.48 Hyperleptinemia induced by obesity is associated with leptin resistance that results in hepatic steatosis and ectopic accumulation of lipids in skeletal muscle, heart, and pancreas.49 Adiponectin is another important adipokine that suppresses inflammatory responses and improves insulin sensitivity.50 After the HFD challenge, Ccdc92 KO mice had a lower level of serum leptin and a higher level of adiponectin than littermate WT mice, contributing to the inhibitory effect of Ccdc92 ablation on diet-induced insulin resistance. It is noteworthy that the inhibited inflammatory response in WAT may result from reduced obesity and adipose tissue dysfunction in Ccdc92 KO mice. There is a vicious cycle between inflammatory response and adipose tissue dysfunction, exacerbating each other and contributing to insulin resistance.23 BAT promotes burning fat and increases the metabolic rate, through which it alleviates metabolic disorders, including dyslipidemia and insulin resistance in T2D. Our data demonstrated that Ccdc92 deletion increased locomotor activity, energy expenditure, and enhanced BAT activity manifested by increased UCP1 and thermogenesis-related genes. In subsequent investigations, the role of adipose Ccdc92 in obesity and diabetes will be studied in adipose-specific Ccdc92 KO mice.
Several variants identified in the CCDC92 locus are associated with diabetes and obesity.9,12,13 The exact roles of these variants and the mechanisms of action remain to be explored using either variant knock-in cells or variant-expressing animals for functional studies. According to the eQ-TL analysis of the GTex database, the rs11057401 T>A (pS70C) coding variant in the CCDC92 locus increases the CCDC92 mRNA level. In addition to an mRNA increase, the amino acid replacement may affect protein structure and stability.51 GWAS studies suggest that the rs11057401 CCDC92 S70C variant is positively associated with total cholesterol in humans.8 The present study found that liver lipid accumulation and blood lipid profiles (TC, LDL-C, and TG) were significantly attenuated in Ccdc92 KO mice on HFD. Ccdc92 KO reduces the expression of de novo lipogenesis genes (Srebf1 and Scd1) in the liver. The role of liver-specific Ccdc92 in insulin resistance, dyslipidemia, and fatty liver disease warrants future studies. The free fatty acid flux derived from adipose tissue during obesity progression renders other tissues a substantial fatty acid overload burden.52 Thus, the liver phenotype observed in Ccdc92 KO mice may also attribute to the decreased serum TG/fatty acids released from adipose tissue.
Ccdc92 KO attenuated the inflammatory response, including numerous proinflammatory cytokines and inflammasomes, in adipose tissue. In addition to reduced IKKα/β phosphorylation and IκB degradation in Ccdc92 KO cells, we also demonstrated that CCDC92 interacts with FHL2. FHL2 induces inflammation by activating the NF-κB pathway in multiple cell types.53,54,55 We provided a clue to fully explore the mechanisms mediating the effects of CCDC92 on the inflammatory response. The NLRP3 inflammasome in adipose tissue is positively correlated with chronic inflammation and insulin resistance in obese individuals with T2D.28,29 NF-κB primes NLRP3 inflammasome activation via inducing the transcription of NLRP3 in response to various cytokines.30,31 The NLRP3 inflammasome activates caspase-1 and the latter cleaves the precursors of IL-1β and IL-18 to active forms.30 IL-1β is capable of impairing insulin signaling and triggering insulin resistance in adipose tissue.56 Besides the critical role of NLRP3 inflammasome in macrophages, NLRP3 activation enhances adipogenic differentiation in MSCs.57 The present study demonstrated that Ccdc92 ablation inhibits NLRP3 inflammasome and NF-κB signaling, which may also mediate the attenuated adipocyte differentiation in Ccdc92 KO MSCs. Besides Nlrp3, Ccdc92 deletion also reduced the expression of other inflammasomes, including Nlrc4 and Aim2. NLRC4 is associated with the formation of the NLRP3 inflammasome.58 Both AIM2 and NLRP3 inflammasomes activate caspase-1 and trigger IL-1β maturation.59
ATMs are central players in obesity, inflammation, and metabolic diseases.60 Our data suggest that Ccdc92 KO reduces proinflammatory macrophages in adipose tissue at an early stage before metabolic phenotypes are apparent in vivo. The metabolic phenotypes observed in Ccdc92 KO mice on HFD could be systemic phenotypes resulting from Ccdc92 deficiency in multiple cell types in adipose tissue. The role of macrophage Ccdc92 in obesity and type 2 diabetes will be investigated using macrophage-specific KO mice in future studies.
In conclusion, we demonstrated the critical role of CCDC92 in regulating adipose tissue function and metabolic homeostasis. Our study could lead to an understanding of CCDC92’s biological function and provide a potential target for treating obesity and T2D.
Limitations of the study
We would like to acknowledge some limitations of our studies. Energy intake and energy expenditure need to be balanced to maintain proper energy homeostasis regulated by the CNS. CCDC92 is highly expressed in the brain in humans (GTex database). Also, skeletal muscle and the pancreas are two other metabolically active organs. Thus, refined tissue-specific Ccdc92 KO mouse models would be ideal tools to investigate the role of CCDC92 in the brain and metabolically active tissues, including adipose tissue, liver, skeletal muscle, and pancreas. The effects of CCDC92 on macrophage activation and the role of macrophage Ccdc92 in insulin resistance will be investigated using macrophage-specific Ccdc92 KO mice. Future studies warrant elucidating the exact mechanisms that mediate CCDC92-dependent regulation of adipokines. We also identified multiple enriched signaling pathways, including mitosis, the G2M checkpoint, and apoptosis through RNA-seq analysis of WAT samples, which warrant future studies. The effects of specific variants in the CCDC92 locus on T2D and CAD, relevant for the the precise treatment of these diseases, will be addressed in future studies. Nonetheless, the current study provides new insights into the critical biological function of CCDC92 in metabolic homeostasis and disease conditions.
STAR★Methods
Key resources table
| REAGENT or RESOURCE | SOURCE | IDENTIFIER |
|---|---|---|
| Antibodies | ||
| Rat monoclonal anti-CD44 | BioLegend | Cat# 103002; RRID: AB_312952 |
| Mouse monoclonal anti-CD68 | Santa Cruz | Cat# sc-20060; RRID: AB_2891106 |
| Goat polyclonal anti-Perilipin | Novus | Cat# NB100-60554; RRID: AB_922242 |
| Rabbit polyclonal anti-CCDC92 | ABclonal | Cat# A8262; RRID:AB_2768744 |
| Rabbit polyclonal anti-CEBPα | ABclonal | Cat# A0904; RRID: AB_2757452 |
| Rabbit polyclonal anti-CEP164 | ABclonal | Cat# A9964; RRID:AB_2768855 |
| Rabbit polyclonal anti-UCP1 | ABclonal | Cat# A5857; RRID:AB_2766607 |
| Rabbit polyclonal anti-Caspase 1 | ABclonal | Cat# A0964; RRID:AB_2757485 |
| Mouse monoclonal anti-Myc tag | ABclonal | Cat# AE010; RRID:AB_2770408 |
| Rabbit polyclonal anti-Lamin B1 | ABclonal | Cat# A16909; RRID:AB_2770196 |
| Rabbit monoclonal anti-PPARγ | Cell Signaling Technology | Cat# 2443; RRID:AB_823598 |
| Mouse monoclonal anti-NF-κB p65 | Cell Signaling Technology | Cat# 6956; RRID:AB_10828935 |
| Rabbit monoclonal anti-p-NF-κB p65 (S536) | Cell Signaling Technology | Cat# 3033; RRID:AB_331284 |
| Mouse monoclonal anti-Myc tag | Cell Signaling Technology | Cat# 2276; RRID:AB_331783 |
| Mouse monoclonal anti-IκBα | Cell Signaling Technology | Cat# 4814; RRID:AB_390781 |
| Rabbit monoclonal anti-p- IKKα/β (Ser176/180) | Cell Signaling Technology | Cat# 2697; RRID: AB_2079382 |
| Rabbit monoclonal anti- IKKβ | Cell Signaling Technology | Cat# 8943; RRID:AB_11024092 |
| Rat monoclonal anti-CD45, Clone: 30-F11, Pacific Blue | Invitrogen | Cat# MCD4528; RRID:AB_1500474 |
| Rat monoclonal anti-F4/80, Clone: BM8, PE | Invitrogen | Cat# 12-4801-82; RRID:AB_465923 |
| Hamster monoclonal anti-CD11c, Clone: HL3, PE-Cy7 | BD Biosciences | Cat# 558079; RRID:AB_647251 |
| Rat monoclonal anti-CD11b Antibody, Clone: M1/70, APC-eFluor™ 780 | Thermo Fisher | Cat# 47-0112-82; RRID:AB_1603193 |
| Rat Anti-CD16/CD32 Monoclonal Antibody, Unlabeled, Clone: 2.4G2 | BD Biosciences | Cat# 553141; RRID:AB_394656 |
| Rabbit polyclonal anti-FHL2 | Proteintech | Cat# 21619-1-AP; RRID:AB_10860263 |
| hFAB Rhodamine anti-Actin | Bio-Rad | Cat# 12004163; RRID:AB_2861334 |
| Alexa Fluor 488-AffiniPure Donkey Anti-Rat IgG | Jackson ImmunoResearch Labs | Cat# 712-545-150; RRID:AB_2340683 |
| Alexa Fluor 488-AffiniPure Donkey Anti-Mouse IgG | Jackson ImmunoResearch Labs | Cat# 715-545-150; RRID:AB_2340846 |
| Alexa Fluor 488-AffiniPure Donkey Anti-Goat IgG | Jackson ImmunoResearch Labs | Cat# 705-545-003; RRID:AB_2340428 |
| Alexa Fluor® 594 AffiniPure Donkey Anti-Rabbit IgG | Jackson ImmunoResearch Labs | Cat# 711-585-152; RRID:AB_2340621 |
| IRDye 800CW Donkey anti-Rabbit IgG | LI-COR Biosciences | Cat# 926-32213; RRID:AB_621848 |
| IRDye 680RD Donkey anti-Mouse IgG | LI-COR Biosciences | Cat# 926-68072; RRID:AB_10953628 |
| Rabbit polyclonal anti-NLRP3 | Novus | Cat# NBP2-12446; RRID:AB_2750946 |
| Experimental models: Cell lines | ||
| Mouse: Wild type ear mesenchymal stem cells | This paper | N/A |
| Mouse: Ccdc92 KO ear mesenchymal stem cells | This paper | N/A |
| Mouse: Bone marrow derived macrophages | This paper | N/A |
| Human: HEK 293 cells | ATCC | Cat# PTA-4488; RRID: CVCL_0045 |
| Bacterial and virus strains | ||
| Adenovirus-CCDC92 | This paper | N/A |
| Adenovirus-LacZ | This paper | N/A |
| Chemicals, peptides, and recombinant proteins | ||
| RIPA Lysis and Extraction Buffer | Thermo Fisher Scientific | Cat# 89901 |
| Immunoprecipitation (IP) lysis buffer | Pierce | Cat#: 87787 |
| ChIP-Grade Protein G Magnetic Beads | Cell Signaling Technology | Cat# 9006 |
| cOmplete™, Mini Protease Inhibitor Cocktail | Sigma Aldrich | Cat# 11836153001 |
| Type II collagenase | Sigma Aldrich | Catalog# C6885 |
| Phosphatase Inhibitor Cocktail 2 | Sigma Aldrich | Cat# P5726 |
| Phosphatase Inhibitor Cocktail 3 | Sigma Aldrich | Cat# P0644 |
| Paraformaldehyde solution (4%) | Thermo Fisher Scientific | Cat# J19943-K2 |
| Harris Hematoxylin | Thermo Fisher Scientific | Cat# 6765003 |
| Eosin-Y | Thermo Fisher Scientific | Cat# 6766009 |
| Oil Red O | Sigma Aldrich | Cat# O0625 |
| Fetal Bovine Serum | Gibco | Cat# 10438026 |
| Recombinant Murine FGF-basic | PeproTech | Cat# 450-33 |
| 3-Isobutyl-1-methylxanthine (IBMX) | Sigma Aldrich | Cat# I5879 |
| Insulin | Sigma Aldrich | Cat# I9278 |
| Humulin R (Insulin) | Humulin | Humulin R U-100 |
| Glucose | Sigma Aldrich | G7021 |
| Dexamethasone | Sigma Aldrich | Cat# D8893 |
| Macrophage colony-stimulating factor | Sigma Aldrich | Cat# M6518 |
| Lipofectamine 3000 | Invitrogen | Cat# L3000-008 |
| TNF-α | R&D Systems, Inc | Cat# L210-TA |
| Dual-Glo Luciferase Assay System | Promega | Cat# E1960 |
| Universal SYBR Green Fast qPCR Mix | ABclonal | Cat# RM21203 |
| Bovine serum albumin (BSA) | Thermo Fisher Scientific | Cat# 23208 |
| Nonfat milk blocker | Bio-Rad | Cat# 1706404 |
| Cellulose membrane | Bio-Rad | Cat# 1620112 |
| BAY 11-7082 | Cayman | Cat# 10010266 |
| Bradford assay buffer | Bio-Rad | Cat# 5000006 |
| Nonidet P40 substitute | Sigma Aldrich | Cat# 74385 |
| Ethanol | Decon Laboratories, Inc | Cat# 2716 |
| Sodium citrate | Sigma Aldrich | Cat# W302600 |
| Tween 20 | Bio-Rad | Cat# 1610781 |
| Phosphate Buffered Saline (PBS) | Thermo Fisher Scientific | Cat# BP399 |
| Triton X-100 | Sigma Aldrich | Cat# T8787 |
| ProLong Glass Antifade Mountant with NucBlue Stain | InvitrogenTM | Cat# P36981 |
| Permount Mounting Medium | Fisher | Cat# SP15-500 |
| DMEM/F12 | Gibco | Cat# 11320033 |
| DMEM | Gibco | Cat# 11965-092 |
| Opti-MEM I | Gibco | Cat# 31985-070 |
| High-fat diet | Research Diets, Inc | Cat# D12492 |
| Standard normal Rodent Diet | LabDiet | Cat# 5053 |
| Lipofectamine RNAmaxi | Invitrogen | Cat# 13778075 |
| Lipofectamine 3000 | Invitrogen | Cat# L3000-008 |
| Critical commercial assays | ||
| Ultra Sensitive Mouse Insulin ELISA Kit | Crystal Chem | Cat# 90080 |
| Mouse IL-1 β ELISA Kit | Sigma Aldrich | Cat# RAB0928 |
| Mouse IL-18 DuoSet ELISA | Techne Corporation | Cat# DY7625-05 |
| Mouse adiponectin ELISA Kit | Sigma Aldrich | RAB1115 |
| Mouse leptin ELISA Kit | Sigma Aldrich | RAB0334 |
| High Capacity cDNA Reverse Transcription Kit | Thermo Fisher Scientific | Cat# 4368814 |
| Dual-Glo Luciferase Assay System | Promega | Cat# E1960 |
| Triglyceride Quantification Kit | Sigma Aldrich | Cat# MAK266 |
| Oligonucleotides | ||
| Primer and sgRNA sequence | Sigma Aldrich | Table S2 |
| Recombinant DNA | ||
| pcDNA3.1-CCDC92-myc tag | This paper | N/A |
| P65 | This paper | N/A |
| NF-κB-Luc | Agilent Technologies | 219078-51 |
| PPRE-Luc | This paper | N/A |
| Deposited data | ||
| Bulk RNA seq data, GEO Accession number | NCBI | GEO: GSE191174 |
| Software and algorithms | ||
| ImageJ | Wayne Rasband | https://imagej.nih.gov/ij/ |
| GraphPad Prism7 | GraphPad Software | https://www.graphpad.com/scientificsoftware/ prism/ |
| FlowJo Version 10.8 | FlowJo | https://www.flowjo.com/ |
Resource availability
Lead contact
Further information and requests for resources and reagents should be directed to and will be fulfilled by the lead contact, Yanbo Fan (fanyb@ucmail.uc.edu), Department of Cancer Biology, University of Cincinnati College of Medicine, Cincinnati, OH 45040, USA.
Materials availability
All the plasmid generated in this study are available from the lead contact without restriction. For the Ccdc92 KO mouse, please submit a Materials Transfer Form to the University of Cincinnati.
Experimental model and subject details
Cell lines and primary cultures
Human female HEK-293 cells (RRID: CVCL_0045) were cultured in Dulbecco’s modified Eagle’s medium (DMEM) supplemented with 10% fetal bovine serum and 1% penicillin-streptomycin in a 5% CO2 atmosphere at 37°C. Ear mesenchymal stem cells (EMSCs) were isolated from the external ear of male WT and Ccdc92 KO mice.18,19,20 EMSCs were cultured in DMEM/F12 supplemented with 15% FBS, and 10 ng/mL recombinant murine FGF-basic (PeproTech, Cat# 450-33). The capacity of EMSCs to differentiate into adipocytes was evaluated within three passages. The confluent cells underwent differentiation for 7 days in DMEM/F12 medium containing 4% FBS, 1.7 μM insulin (Sigma Aldrich, Cat# I9278), 1 μM dexamethasone (Sigma Aldrich, Cat# D8893), and 0.5 mM 3-Isobutyl-1-methylxanthine (IBMX) (Sigma Aldrich, Cat# I5879). Bone marrow-derived macrophages (BMDMs) were isolated from male mice and cultured in DMEM supplemented with 10% FBS, 10 ng/mL macrophage colony-stimulating factor (M-CSF, Sigma-Aldrich, Cat# M6518) and 1% penicillin/streptomycin for 7 days.
Mouse strains
Ccdc92 KO mice were generated using sperm (C57BL/6N-Atm1Brd Ccdc92tm1a(KOMP)Mbp/MbpMmucd, Stock Number: 046962-UCD, RRID: MMRRC_046962-UCD) from Mutant Mouse Resource & Research Centers (MMRRC). The genotyping of the KO mice was performed by polymerase chain reaction (PCR) with the following primers: forward, 5′- GGCGCACTCCTAGATACAGC-3′; and reverse, 5′- GCTGCTTGGTAAAGGGACTG-3′. PCR product size is 206bp for WT and 240bp for homozygous. The expression level of Ccdc92 was determined by PCR with primers: forward, 5′- ATGCCAAATGTCTCCTCCTG-3′; and reverse, 5′- TGGATCTGTGGAGGGATAGC-3′. Male and female Ccdc92 KO mice (heterozygous x heterozygous) were bred to generate homozygous Ccdc92 KO mice and littermate wild-type (WT) mice. Both male and female Ccdc92 KO mice and age-matched (7–10 weeks old) littermate WT mice on a C57BL/6N background were fed a high-fat diet (HFD) (20% protein, 60% fat, 20% carbohydrate by calories; D12492, Research Diets, New Brunswick, NJ), or normal chow diet (24.5% protein, 13.1% fat, 62.4% carbohydrate, LabDiet 5053). All mice were maintained at 22°C with a 12-h light/dark cycle and had access to water and food ad libitum. All animal experiments were conducted in accordance with a University of Cincinnati Institutional Animal Care and Use Committee (IACUC) approved protocol (22-09-23-01).
Method details
Oral glucose tolerance test (OGTT) and insulin tolerance test (ITT)
OGTT and ITT were performed in male and female mice fasted for 6 h.61 Blood glucose was measured with the glucometer and test strips (Contour Next EZ, NJ, USA). For OGTT, blood glucose was measured in mice at 0, 15, 30, 60, 90, and 120 min after glucose administration (2 g/kg BW, oral gavage). For ITT, blood glucose was measured in mice treated with insulin (1U/kg BW, i.p.) at the same time points stated above.
Whole-body energy expenditure and body composition
Food intake, locomotor activity, oxygen consumption (VO2), and whole-body energy expenditure were monitored using a Comprehensive Lab Animal Monitoring System (CLAMS, Columbus Instruments) at the University of Michigan Metabolic Phenotyping Core. The metabolic parameters were normalized to BW. Body fat, lean mass, and free fluid were measured using an NMR-based analyzer (Minispec LF90II, Bruker Optics). Animals had access to both food and water during measurements.
Enzyme-linked immunosorbent assay (ELISA) for insulin, IL-1β, adiponectin, and leptin in mice
Ultra-Sensitive Mouse Insulin ELISA Kit (Crystal Chem, Cat# 90080) was applied to measure serum insulin in mice. Serum samples were diluted and then incubated in an antibody-coated ELISA plate (96-well) at 4°C for 2 h. After washing, the conjugate solution was added, followed by incubation for 30 min at room temperature (RT). The plate was washed 10 min three times and then incubated with substrate solution for 40 min. After the reaction was stopped by adding a stop solution, colorimetric absorbance was measured at 450 nm with GloMax Explorer Multimode Microplate Reader (Promega, GM3500, Madison, WI). IL-1β was assessed using a Mouse IL-1 β ELISA Kit (Sigma Aldrich, Cat# RAB0928) according to the manufacturer’s instructions. Serum samples were added to the antibody-coated ELISA plate (96-well) and incubated at 4°C overnight. After washing, a diluted biotinylated detection antibody was added to each well. Following 1 h incubation, the wells were washed and added with HRP-Streptavidin solution and incubated for 45 min. After washing, colorimetric 3,3′,5,5′-tetramethylbenzidine (TMB) reagent was added to each well, followed by incubation for 30 min at RT in the dark with gentle shaking. After the reaction was stopped, absorbance was measured at 450 nm with the GloMax Explorer Multimode Microplate Reader (Promega, GM3500, Madison, WI). Leptin and adiponectin were measured utilizing a Mouse Leptin ELISA Kit (Sigma, RAB0334) and a Mouse Adiponectin ELISA Kit (Sigma, RAB1115), respectively. Serum samples were added to the primary antibody-coated ELISA plate (96-well) and incubated at 4°C overnight. After washing, the detection antibody was added to each well, followed by incubation for 1 h at RT. Streptavidin solution was added and incubated for 45 min, followed by the addition of TMB One-Step Substrate Reagent. The solution was incubated for 30 min, and the reaction was terminated by adding Stop Solution. Absorbance was determined at 450 nm with GloMax Explorer Multimode Microplate Reader (Promega, GM3500, Madison, WI).
Histology
Tissue samples were collected and fixed in 4% paraformaldehyde solution for 48 h, followed by equilibration in 20 and 30% (wt/vol) sucrose solution. The samples were then processed with paraffin embedding or optimal cutting temperature (OCT) before cutting sections. Paraffin-embedded sections were stained with Hematoxylin and Eosin-Y (H&E) for histopathological evaluation. Frozen sections were stained with Oil Red O (Sigma Aldrich, Cat# O0625) to observe lipid accumulations. H&E and Oil Red O sections were examined under light microscopy.
Triglyceride (TG) content quantification, analysis of lipid droplet sizes, and fibrosis in tissue sections
The TG Quantification Kit (Sigma Aldrich, Cat# MAK266) was used to measure TG in serum and liver according to the manufacturer’s instruction. Liver samples were homogenized in 5% Nonidet P40 substitute solution at 90°C for 2 min twice and diluted 10-fold. Serum and liver lysates in a 96-well plate were treated with lipase for 20 min at RT to convert TG to glycerol and fatty acid. Next, a master reaction mix containing mixed TG assay buffer, TG probe, and TG enzyme mix was added to each well. After 60 min incubation, absorbance was measured at 570 nm. In adipose tissue sections, adipocytes were evaluated by utilizing Adiposoft, a Java-based plugin for an open source software package ImageJ (https://imagej.net/Fiji). Adiposoft was used to detect the cell boundaries by applying a morphological filter and further filtering images using a seeded watershed algorithm. These processes reinforce the cellular boundaries to forcibly separate the clustered adipocytes. It counted the number and calculated the area of each bounded space in the output file.62 ImageJ was used for the analysis of lipid droplet sizes in liver sections based on the previous study with modifications.63 The scale was set to a micrometer. H&E images were converted from an RGB format to 8-bit grayscale, and the binary was created. The threshold was adjusted to highlight the lipid droplets. Three groups, including small, mixed, and large groups, were categorized using cut-offs of 4 μm2 (small size) and 20 μm2 (large size).64 The lipid particles were analyzed, and the generated values of percentage were collected. Similarly, the scale was changed to a micrometer to quantify fibrosis in adipose tissue. Images were converted to grayscale, and blue-stained collagen was used for setting the threshold. Fibrosis areas were measured and presented in percentages.
Frequency analysis of adipocytes
After adipocyte areas were measured by using ImageJ, the frequency distribution of adipocyte size was analyzed using GraphPad Prism7. The data were analyzed using the frequency distribution method. The generated histogram data, including bin center and percentage of frequency, were collected. The values falling in the same range of bins were put together to produce a frequency distribution plot.
Immunostaining
Normal human adipose tissue sections (GTX24274) were purchased from GeneTex (CA, USA). The paraffin-embedded sections were incubated with anti-CCDC92 (ABclonal, # A8262, 1:500) overnight at 4°C. For immunostaining, mouse tissue sections embedded in paraffin were incubated with primary antibodies, including CD44 (BioLegend #103002, 1:200), CD68 (Santa Cruz #sc-20060, 1:200), Perilipin (Novus #NB100-60554, 1:200), or UCP1 (ABclonal, A5857, 1:200) overnight at 4°C, followed by incubation with a fluorescent-dye (Alexa Fluor 594- or Alexa Fluor 488; 1:1,000)-conjugated or enzyme (Alkaline phosphatase, 1:1,000)-conjugated secondary antibody. Sections were mounted with ProLong Glass Antifade Mountant with NucBlue Stain (Invitrogen, Cat No P36981) for immunofluorescence or Permount Mounting Medium (Fisher Scientific, SP15-500) for immunohistochemistry. EMSCs were infected with adenovirus encoding CCDC92-myc tag (Ad-CCDC92-myc) at a dose of 20 multiplicity of infection [MOI]). Twenty-four hours later, cells were fixed with 4% paraformaldehyde and then incubated with anti-CEP164 (ABclonal, Cat# A9964, 1: 100) and anti-Myc tag (Cell signaling Technology, Cat# 2276, 1: 500) antibodies. IgG was used as a negative control.
RNA seq analysis of WAT samples
RNA was extracted from an equal amount (weight) of eWAT from male Ccdc92 KO mice and littermate WT mice on a HFD for 14 weeks (n≥ 3/animal group). The quality of the RNA was assessed on an Agilent Technologies Bioanalyzer 2100 RNA pico chip as per the manufacturer’s instructions (Agilent Technologies). RNA sequencing libraries were prepared using the TruSeq RNA library prep kit V2 (Illumina), following the manufacturer’s recommended protocol. Samples prepared by TruSeq were sequenced at the DNA Sequencing Core of University of Michigan with a NovaSeq 6000 instrument using 100 base read lengths in paired-end mode.65 Reads for mouse bulk RNA-seq datasets were mapped using STAR 2.7.7 software alignment against mouse genome reference version GRCm38.p6.66 The total number of sequenced reads was an average of 30 million pairs, in which 90% of the aligned reads were uniquely mapped. Reads were counted with featureCounts (Rsubread-2.8.1). Differential expression analysis was performed with DESeq2 (1.34.0).67 Multi-FASTQ QC statistics indicated that the sequencing data were of high quality and sequencing depth was sufficient to quantify differential gene expression between WT and Ccdc92 KO groups. For all differential gene expression analyses, the p value, false discovery rate (FDR), and fold changes (FC) filters were applied. Filter values, including p < 0.05, FDR <0.1, and |log2FC| > 1, were used for all differential gene expression results. Correlations between datasets and graphical output were conducted in an R environment. Cytoscape (3.9) and ClueGO plugin (v2) were used to visualize pathways and gene clusters.
RNA extraction, reverse transcription, and quantitative PCR (qPCR)
Tissue and cell RNA were isolated using a RNeasy mini kit (Qiagen, Cat No 74104) following the manufacturer’s protocol. RNA was reverse transcribed into cDNA with Super-Script III (Thermo Fisher Scientific, Cat# 12574026) and oligo-dT primer. cDNA was subsequently used for qPCR with Universal SYBR Green Fast qPCR Mix (ABclonal, Cat# RM21203). The relative expression for each gene of interest was normalized with the internal control, β-Actin. The primer sequences are shown in Table S2.
Protein isolation and western blot analysis
Tissue and cell extracts were isolated with RIPA buffer (Thermo Fisher, Cat# 89901) supplemented with PhosStop phosphatase inhibitors (Sigma Aldrich, Cat# 4906845001) and cOmpleteTM protease inhibitor mixture (Sigma Aldrich, Cat# 11836153001). Protein extracts were resolved by SDS-PAGE. Blots were incubated overnight at 4°C with antibodies against the following proteins (source, catalog number, and dilution of the antibody are given in parentheses): NF-κB p65 (Cell Signaling Technology, # 6956, 1:500), p-NF-κB p65 (S536) (Cell Signaling Technology, # 3033, 1:500), NLRP3 (Novus, # NBP2-12446, 1:500), Caspase-1 (ABclonal, # A0964, 1:1000), IκBα (Cell Signaling Technology, # 4814, 1:1000), and Lamin B1(ABclonal, # A16909, 1; 500). After washing with TBS-T buffer, blots were incubated with fluorescent (IRDye800 [1:3,000] or IRDye680 [1:3,000], LI-COR Biosciences) conjugated secondary antibodies. The bands were visualized by a Bio-Rad ChemiDoc imaging system (Bio-Rad Laboratories, Inc, USA).
Transfection and reporter assay
NF-κB-luciferase vector (Agilent Technologies, 219,078-51) and pRL TK Renilla luciferase control reporter construct (Promega, Cat# E2241) were transfected into HEK-293 cells with lipofectamine 3000 (Thermo Fisher, Cat# L3000001) in Opti-MEM I medium (Thermo Fisher, Cat# 31985070). After 24 h, the cells were treated with TNF-α (R&D Systems, Cat# L210-TA, 10 ng/mL) for another 24 h. NF-κB-luciferase vector and p65 expression vector (pcDNA3.1 as a control) were co-transfected into HEK-293 cells for 48 h. CCDC92- and PPARγ-expressing vectors and PPRE-luciferase construct (pRL TK Renilla luciferase as a control) were co-transfected into HEK-293 cells with lipofectamine 3000 in Opti-MEM I medium for 24 h. Firefly-Renilla luciferase activity was measured with the Dual-Glo Luciferase Assay kit (Promega, Cat# E1960) using GloMax Explorer Multimode Microplate Reader (Promega, GM3500, Madison, WI).
Bone marrow-derived macrophage (BMDM) isolation
BMDMs were harvested by flushing the femur and tibia with cold sterile PBS containing 2% heat inactivated FBS.68,69 BMDMs were kept on ice. The isolated bone marrow cells were filtered through 70 μm cell strainers and then pelleted and washed with PBS. The cells were cultured in DMEM supplemented with 10% FBS, 10 ng/mL macrophage colony stimulating factor (M-CSF, Sigma-Aldrich, Cat# M6518), and 1% penicillin/streptomycin at 37°C in a humidified incubator with 5% CO2. After 7 days of cell culture, the differentiated macrophages were treated with TNFα (10 ng/mL) for 4 h. Cells were collected for mRNA and protein measurements.
Adipose tissue macrophage (ATM) isolation and flow cytometry analysis
eWAT was cut into small pieces and incubated in Hanks’ balanced salt solution without Ca2+ and Mg2+ supplemented with 0.5% bovine serum albumin (BSA) and 1 mg/mL type II collagenase (Sigma-Aldrich; Catalog# C6885) at 37°C for 45 min36,37 After digestion, EDTA was added to a final concentration of 10 mM and incubated at 37 °C for an additional 5–10 min. After a short mixing for 20 s, the samples were centrifuged at 4 °C for 10 min, cell pellets were resuspended in 0.1% BSA in PBS, filtered with 70 μm cell strainers (BD Falcon; Cat #352360), and centrifuged again at 400 × g for 5 min. After erythrocyte lysis using RBC lysis buffer (Invitrogen, Cat# 00-4333-57) for 3 min, cells were centrifuged again at 400 × g for 5 min and resuspended in PBS containing 0.1% BSA for flow cytometric analysis.
The cell suspension was pre-incubated with 10 μg/mL Mouse BD Fc Block™ anti-CD16/CD32 antibody, Clone: 2.4G2 (BD Biosciences, Cat# 553141) on ice for 20 min followed by another 20 min incubation with the following antibodies: CD45 antibody, Clone: 30-F11, Pacific Blue (Invitrogen, Cat# MCD4528); F4/80 antibody, Clone: BM8, PE (Invitrogen, Cat# 12-4801-82); CD11b antibody, Clone: M1/70, APC-eFluor™ 780 (Thermo Fisher, Cat# 47-0112-82) and CD11c antibody, Clone: HL3, PE-Cy7 (BD Bioscience, Cat# 558079). The cells were then centrifuged at 400 × g for 5 min and suspended in 300 μL of PBS containing 0.1% BSA for flow cytometry analysis (BD FACSAria III; BD Biosciences). The data were analyzed using FlowJo software (FlowJo, version 10.8, Ashland, OR, USA).
Co-immunoprecipitation (Co-IP)
EMSCs were lysed in immunoprecipitation (IP) lysis buffer (Pierce, Cat#: 87787) containing cOmplete Protease Inhibitor Cocktail (Sigma, SKU:11836153001). After centrifugation at 12,000 rpm for 10 min at 4 °C, the supernatants were collected for an IP assay. Cellular extracts were precleared with ChIP-Grade Protein G Magnetic Beads (Cell Signaling Technology, Cat# 9006) for 1 h at 4 °C and then incubated with an anti-Myc tag (ABclonal, Cat# AE010, 1: 100) or anti-FHL2 (Proteintech, Cat# 21619-1-AP, 1:100) antibody overnight at 4 °C. AffiniPure rabbit IgG (Jackson ImmunoResearch Labs, Cat# 309-005-003) was used as a negative control. The immunocomplexes were pulled down by incubation with magnetic beads for 1 h at 4 °C and washed five times with IP lysis buffer. The samples were separated by SDS-PAGE and analyzed by immunoblotting using an anti-Myc tag (1: 1000) or -FHL2 (1:1000) antibody.70
Quantification and statistical analysis
Statistical analyses were performed using GraphPad Prism version 7.0 (GraphPad Software, CA). Unless indicated otherwise, values are presented as mean ± standard error of the mean (SEM). The quantitative data show all points. N represents the number of individual mice (biological replicates) or individual experiments (technical replicates) as indicated in the figure legends. All data were tested for normality and equal variance. If the data passed those tests, a Student t-test or two-way ANOVA with Bonferroni correction was used to compare the two groups. One-way ANOVA followed by Bonferroni post hoc test was used to compare >2 groups. Nonparametric tests (Mann-Whitney U or Kruskal-Wallis) were used if the data did not pass those tests. P-value < 0.05 was considered statistically significant. p values are shown on the figures as asterisks: ∗, p < 0.05; ∗∗, p < 0.01.
Acknowledgments
The authors gratefully acknowledge thoughtful discussions on biological studies with Dr. Jun-Lin Guan and Dr. Xiaoting Zhang in the Department of Cancer Biology, University of Cincinnati. Y. F. is supported by R01HL138094 and R01HL145176 from the National Heart, Lung, and Blood Institute.
Author contributions
L.R., W.D. conducted experiments and analyzed the data. W.D. conducted RNA-seq analysis. Y.F and L.R. drafted the article with assistance from W.D. D.S. provided technical assistance. R.C.B, G.F., M.H., H.L, C.D., and C.W. critically reviewed the article and provided comments and feedback. Y.F. conceived, designed, and supervised the study.
Declaration of interests
The authors declare no competing interests.
Published: January 20, 2023
Footnotes
Supplemental information can be found online at https://doi.org/10.1016/j.isci.2022.105769.
Supplemental information
GSEA, Kyoto Encyclopedia of Genes and Genomes (KEGG), and Gene Ontology (GO) term pathway enrichment analysis of WAT from Ccdc92 KO and WT mice on HFD for 14 weeks
Data and code availability
The data that support the findings of this study are available from the leading contact upon reasonable request. The raw RNA seq data has been deposited at Gene Expression Omnibus (GEO) database: GSE191174 and are publicly available as of the date of publication. Accession numbers are listed in the key resources table. There is no original code reported in this paper. Any additional information required to reanalyze the data reported in this paper is available from the lead contact upon request.
References
- 1.Rosen E.D., Spiegelman B.M. Adipocytes as regulators of energy balance and glucose homeostasis. Nature. 2006;444:847–853. doi: 10.1038/nature05483. [DOI] [PMC free article] [PubMed] [Google Scholar]
- 2.Kanda H., Tateya S., Tamori Y., Kotani K., Hiasa K.-i., Kitazawa R., Kitazawa S., Miyachi H., Maeda S., Egashira K., Kasuga M. MCP-1 contributes to macrophage infiltration into adipose tissue, insulin resistance, and hepatic steatosis in obesity. J. Clin. Invest. 2006;116:1494–1505. doi: 10.1172/JCI26498. [DOI] [PMC free article] [PubMed] [Google Scholar]
- 3.Makki K., Froguel P., Wolowczuk I. Adipose tissue in obesity-related inflammation and insulin resistance: cells, cytokines, and chemokines. ISRN Inflamm. 2013:139239. doi: 10.1155/2013/139239. [DOI] [PMC free article] [PubMed] [Google Scholar]
- 4.Gupta G.D., Coyaud É., Gonçalves J., Mojarad B.A., Liu Y., Wu Q., Gheiratmand L., Comartin D., Tkach J.M., Cheung S.W.T., et al. A dynamic protein interaction landscape of the human centrosome-cilium interface. Cell. 2015;163:1484–1499. doi: 10.1016/j.cell.2015.10.065. [DOI] [PMC free article] [PubMed] [Google Scholar]
- 5.Chaki M., Airik R., Ghosh A.K., Giles R.H., Chen R., Slaats G.G., Wang H., Hurd T.W., Zhou W., Cluckey A., et al. Exome capture reveals ZNF423 and CEP164 mutations, linking renal ciliopathies to DNA damage response signaling. Cell. 2012;150:533–548. doi: 10.1016/j.cell.2012.06.028. [DOI] [PMC free article] [PubMed] [Google Scholar]
- 6.Huang L.O., Rauch A., Mazzaferro E., Preuss M., Carobbio S., Bayrak C.S., Chami N., Wang Z., Schick U.M., Yang N., et al. Genome-wide discovery of genetic loci that uncouple excess adiposity from its comorbidities. Nat. Metab. 2021;3:228–243. doi: 10.1038/s42255-021-00346-2. [DOI] [PubMed] [Google Scholar]
- 7.Neville M.J., Wittemans L.B.L., Pinnick K.E., Todorčević M., Kaksonen R., Pietiläinen K.H., Luan J., Scott R.A., Wareham N.J., Langenberg C., Karpe F. Regional fat depot masses are influenced by protein-coding gene variants. PLoS One. 2019;14:e0217644. doi: 10.1371/journal.pone.0217644. [DOI] [PMC free article] [PubMed] [Google Scholar]
- 8.Xiao L., Shi D., Zhang H., Zhang Y., Liu Y., Lu H., Zheng Y. Association between single nucleotide polymorphism rs11057401 of CCDC92 gene and the risk of coronary heart disease (CHD) Lipids Health Dis. 2018;17:28. doi: 10.1186/s12944-018-0672-1. [DOI] [PMC free article] [PubMed] [Google Scholar]
- 9.Lotta L.A., Gulati P., Day F.R., Payne F., Ongen H., van de Bunt M., Gaulton K.J., Eicher J.D., Sharp S.J., Luan J., et al. Integrative genomic analysis implicates limited peripheral adipose storage capacity in the pathogenesis of human insulin resistance. Nat. Genet. 2017;49:17–26. doi: 10.1038/ng.3714. [DOI] [PMC free article] [PubMed] [Google Scholar]
- 10.Vujkovic M., Keaton J.M., Lynch J.A., Miller D.R., Zhou J., Tcheandjieu C., Huffman J.E., Assimes T.L., Lorenz K., Zhu X., et al. Discovery of 318 new risk loci for type 2 diabetes and related vascular outcomes among 1.4 million participants in a multi-ancestry meta-analysis. Nat. Genet. 2020;52:680–691. doi: 10.1038/s41588-020-0637-y. [DOI] [PMC free article] [PubMed] [Google Scholar]
- 11.Lumish H.S., O'Reilly M., Reilly M.P. Sex differences in genomic drivers of adipose distribution and related cardiometabolic disorders: opportunities for precision medicine. Arterioscler. Thromb. Vasc. Biol. 2020;40:45–60. doi: 10.1161/ATVBAHA.119.313154. [DOI] [PubMed] [Google Scholar]
- 12.Zhao W., Rasheed A., Tikkanen E., Lee J.J., Butterworth A.S., Howson J.M.M., Assimes T.L., Chowdhury R., Orho-Melander M., Damrauer S., et al. Identification of new susceptibility loci for type 2 diabetes and shared etiological pathways with coronary heart disease. Nat. Genet. 2017;49:1450–1457. doi: 10.1038/ng.3943. [DOI] [PMC free article] [PubMed] [Google Scholar]
- 13.Klarin D., Zhu Q.M., Emdin C.A., Chaffin M., Horner S., McMillan B.J., Leed A., Weale M.E., Spencer C.C.A., Aguet F., et al. Genetic analysis in UK Biobank links insulin resistance and transendothelial migration pathways to coronary artery disease. Nat. Genet. 2017;49:1392–1397. doi: 10.1038/ng.3914. [DOI] [PMC free article] [PubMed] [Google Scholar]
- 14.Ichimura A., Hirasawa A., Poulain-Godefroy O., Bonnefond A., Hara T., Yengo L., Kimura I., Leloire A., Liu N., Iida K., et al. Dysfunction of lipid sensor GPR120 leads to obesity in both mouse and human. Nature. 2012;483:350–354. doi: 10.1038/nature10798. [DOI] [PubMed] [Google Scholar]
- 15.Koza R.A., Nikonova L., Hogan J., Rim J.S., Mendoza T., Faulk C., Skaf J., Kozak L.P. Changes in gene expression foreshadow diet-induced obesity in genetically identical mice. PLoS Genet. 2006;2:e81. doi: 10.1371/journal.pgen.0020081. [DOI] [PMC free article] [PubMed] [Google Scholar]
- 16.Kahn B.B., Flier J.S. Obesity and insulin resistance. J. Clin. Invest. 2000;106:473–481. doi: 10.1172/JCI10842. [DOI] [PMC free article] [PubMed] [Google Scholar]
- 17.Chait A., den Hartigh L.J. Adipose tissue distribution, inflammation and its metabolic consequences, including diabetes and cardiovascular disease. Front. Cardiovasc. Med. 2020;7:22. doi: 10.3389/fcvm.2020.00022. [DOI] [PMC free article] [PubMed] [Google Scholar]
- 18.Rim J.-S., Mynatt R.L., Gawronska-Kozak B. Mesenchymal stem cells from the outer ear: a novel adult stem cell model system for the study of adipogenesis. FASEB J. 2005;19:1205–1207. doi: 10.1096/fj.04-3204fje. [DOI] [PubMed] [Google Scholar]
- 19.McKernan K., Varghese M., Patel R., Singer K. Role of TLR4 in the induction of inflammatory changes in adipocytes and macrophages. Adipocyte. 2020;9:212–222. doi: 10.1080/21623945.2020.1760674. [DOI] [PMC free article] [PubMed] [Google Scholar]
- 20.Mori H., Prestwich T.C., Reid M.A., Longo K.A., Gerin I., Cawthorn W.P., Susulic V.S., Krishnan V., Greenfield A., Macdougald O.A. Secreted frizzled-related protein 5 suppresses adipocyte mitochondrial metabolism through WNT inhibition. J. Clin. Invest. 2012;122:2405–2416. doi: 10.1172/JCI63604. [DOI] [PMC free article] [PubMed] [Google Scholar]
- 21.Rosen E.D., Hsu C.H., Wang X., Sakai S., Freeman M.W., Gonzalez F.J., Spiegelman B.M. C/EBPalpha induces adipogenesis through PPARgamma: a unified pathway. Genes Dev. 2002;16:22–26. doi: 10.1101/gad.948702. [DOI] [PMC free article] [PubMed] [Google Scholar]
- 22.Graser S., Stierhof Y.D., Lavoie S.B., Gassner O.S., Lamla S., Le Clech M., Nigg E.A. Cep164, a novel centriole appendage protein required for primary cilium formation. J. Cell Biol. 2007;179:321–330. doi: 10.1083/jcb.200707181. [DOI] [PMC free article] [PubMed] [Google Scholar]
- 23.Zatterale F., Longo M., Naderi J., Raciti G.A., Desiderio A., Miele C., Beguinot F. Chronic adipose tissue inflammation linking obesity to insulin resistance and type 2 diabetes. Front. Physiol. 2019;10:1607. doi: 10.3389/fphys.2019.01607. [DOI] [PMC free article] [PubMed] [Google Scholar]
- 24.DeBari M.K., Abbott R.D. Adipose tissue fibrosis: mechanisms, models, and importance. Int. J. Mol. Sci. 2020;21:6030. doi: 10.3390/ijms21176030. [DOI] [PMC free article] [PubMed] [Google Scholar]
- 25.Fantuzzi G. Adipose tissue, adipokines, and inflammation. J. Allergy Clin. Immunol. 2005;115:911–919. doi: 10.1016/j.jaci.2005.02.023. [DOI] [PubMed] [Google Scholar]
- 26.Carpentier A.C., Blondin D.P., Virtanen K.A., Richard D., Haman F., Turcotte É.E. Brown adipose tissue energy metabolism in humans. Front. Endocrinol. 2018;9:447. doi: 10.3389/fendo.2018.00447. [DOI] [PMC free article] [PubMed] [Google Scholar]
- 27.Chen Z., Yu R., Xiong Y., Du F., Zhu S. A vicious circle between insulin resistance and inflammation in nonalcoholic fatty liver disease. Lipids Health Dis. 2017;16:203. doi: 10.1186/s12944-017-0572-9. [DOI] [PMC free article] [PubMed] [Google Scholar]
- 28.Vandanmagsar B., Youm Y.-H., Ravussin A., Galgani J.E., Stadler K., Mynatt R.L., Ravussin E., Stephens J.M., Dixit V.D. The NLRP3 inflammasome instigates obesity-induced inflammation and insulin resistance. Nat. Med. 2011;17:179–188. doi: 10.1038/nm.2279. [DOI] [PMC free article] [PubMed] [Google Scholar]
- 29.Barra N.G., Henriksbo B.D., Anhê F.F., Schertzer J.D. The NLRP3 inflammasome regulates adipose tissue metabolism. Biochem. J. 2020;477:1089–1107. doi: 10.1042/BCJ20190472. [DOI] [PubMed] [Google Scholar]
- 30.He Y., Hara H., Núñez G. Mechanism and regulation of NLRP3 inflammasome activation. Trends Biochem. Sci. 2016;41:1012–1021. doi: 10.1016/j.tibs.2016.09.002. [DOI] [PMC free article] [PubMed] [Google Scholar]
- 31.Afonina I.S., Zhong Z., Karin M., Beyaert R. Limiting inflammation-the negative regulation of NF-κB and the NLRP3 inflammasome. Nat. Immunol. 2017;18:861–869. doi: 10.1038/ni.3772. [DOI] [PubMed] [Google Scholar]
- 32.Oeckinghaus A., Ghosh S. The NF-kappaB family of transcription factors and its regulation. Cold Spring Harb. Perspect. Biol. 2009;1:a000034. doi: 10.1101/cshperspect.a000034. [DOI] [PMC free article] [PubMed] [Google Scholar]
- 33.Israël A. The IKK complex, a central regulator of NF-kappaB activation. Cold Spring Harb. Perspect. Biol. 2010;2:a000158. doi: 10.1101/cshperspect.a000158. [DOI] [PMC free article] [PubMed] [Google Scholar]
- 34.Rolland T., Taşan M., Charloteaux B., Pevzner S.J., Zhong Q., Sahni N., Yi S., Lemmens I., Fontanillo C., Mosca R., et al. A proteome-scale map of the human interactome network. Cell. 2014;159:1212–1226. doi: 10.1016/j.cell.2014.10.050. [DOI] [PMC free article] [PubMed] [Google Scholar]
- 35.Caslin H.L., Bhanot M., Bolus W.R., Hasty A.H. Adipose tissue macrophages: unique polarization and bioenergetics in obesity. Immunol. Rev. 2020;295:101–113. doi: 10.1111/imr.12853. [DOI] [PMC free article] [PubMed] [Google Scholar]
- 36.Chen Q., Lai S.M., Xu S., Tan Y., Leong K., Liu D., Tan J.C., Naik R.R., Barron A.M., Adav S.S., et al. Resident macrophages restrain pathological adipose tissue remodeling and protect vascular integrity in obese mice. EMBO Rep. 2021;22:e52835. doi: 10.15252/embr.202152835. [DOI] [PMC free article] [PubMed] [Google Scholar]
- 37.Cho K.W., Morris D.L., Lumeng C.N. Flow cytometry analyses of adipose tissue macrophages. Methods Enzymol. 2014;537:297–314. doi: 10.1016/B978-0-12-411619-1.00016-1. [DOI] [PMC free article] [PubMed] [Google Scholar]
- 38.Loos R.J.F., Yeo G.S.H. The genetics of obesity: from discovery to biology. Nat. Rev. Genet. 2022;23:120–133. doi: 10.1038/s41576-021-00414-z. [DOI] [PMC free article] [PubMed] [Google Scholar]
- 39.Ning T., Wang Q. Adipose tissue remodeling and adipose precursors. Tissue. Eng. Regen. Med. 2019:457–462. [Google Scholar]
- 40.Xu F., Zheng X., Lin B., Liang H., Cai M., Cao H., Ye J., Weng J. Diet-induced obesity and insulin resistance are associated with brown fat degeneration in SIRT1-deficient mice. Obesity. 2016;24:634–642. doi: 10.1002/oby.21393. [DOI] [PubMed] [Google Scholar]
- 41.Zeng Q., Wang N., Zhang Y., Yang Y., Li S., Zheng R., Chai J., Qiao T., Jiang S. Partial deficiency of Zfp217 resists high-fat diet-induced obesity by increasing energy metabolism in mice. Int. J. Mol. Sci. 2021;22:5390. doi: 10.3390/ijms22105390. [DOI] [PMC free article] [PubMed] [Google Scholar]
- 42.Warden C.H., Fisler J.S. Comparisons of diets used in animal models of high-fat feeding. Cell Metab. 2008;7:277. doi: 10.1016/j.cmet.2008.03.014. [DOI] [PMC free article] [PubMed] [Google Scholar]
- 43.Nishimura S., Manabe I., Nagasaki M., Hosoya Y., Yamashita H., Fujita H., Ohsugi M., Tobe K., Kadowaki T., Nagai R., Sugiura S. Adipogenesis in obesity requires close interplay between differentiating adipocytes, stromal cells, and blood vessels. Diabetes. 2007;56:1517–1526. doi: 10.2337/db06-1749. [DOI] [PubMed] [Google Scholar]
- 44.Stolarczyk E. Adipose tissue inflammation in obesity: a metabolic or immune response? Curr. Opin. Pharmacol. 2017;37:35–40. doi: 10.1016/j.coph.2017.08.006. [DOI] [PubMed] [Google Scholar]
- 45.Murano I., Barbatelli G., Parisani V., Latini C., Muzzonigro G., Castellucci M., Cinti S. Dead adipocytes, detected as crown-like structures, are prevalent in visceral fat depots of genetically obese mice. J. Lipid Res. 2008;49:1562–1568. doi: 10.1194/jlr.M800019-JLR200. [DOI] [PubMed] [Google Scholar]
- 46.Lin D., Chun T.-H., Kang L. Adipose extracellular matrix remodelling in obesity and insulin resistance. Biochem. Pharmacol. 2016;119:8–16. doi: 10.1016/j.bcp.2016.05.005. [DOI] [PMC free article] [PubMed] [Google Scholar]
- 47.Lawler H.M., Underkofler C.M., Kern P.A., Erickson C., Bredbeck B., Rasouli N. Adipose tissue hypoxia, inflammation, and fibrosis in obese insulin-sensitive and obese insulin-resistant subjects. J. Clin. Endocrinol. Metab. 2016;101:1422–1428. doi: 10.1210/jc.2015-4125. [DOI] [PMC free article] [PubMed] [Google Scholar]
- 48.Berg A.H., Scherer P.E. Adipose tissue, inflammation, and cardiovascular disease. Circ. Res. 2005;96:939–949. doi: 10.1161/01.RES.0000163635.62927.34. [DOI] [PubMed] [Google Scholar]
- 49.Paraskevas K.I., Liapis C.D., Mikhailidis D.P. Leptin: a promising therapeutic target with pleiotropic action besides body weight regulation. Curr. Drug Targets. 2006;7:761–771. doi: 10.2174/138945006777435371. [DOI] [PubMed] [Google Scholar]
- 50.Weyer C., Funahashi T., Tanaka S., Hotta K., Matsuzawa Y., Pratley R.E., Tataranni P.A. Hypoadiponectinemia in obesity and type 2 diabetes: close association with insulin resistance and hyperinsulinemia. J. Clin. Endocrinol. Metab. 2001;86:1930–1935. doi: 10.1210/jcem.86.5.7463. [DOI] [PubMed] [Google Scholar]
- 51.Ashenberg O., Gong L.I., Bloom J.D. Mutational effects on stability are largely conserved during protein evolution. Proc. Natl. Acad. Sci. USA. 2013;110:21071–21076. doi: 10.1073/pnas.1314781111. [DOI] [PMC free article] [PubMed] [Google Scholar]
- 52.Horowitz J.F., Klein S. Whole body and abdominal lipolytic sensitivity to epinephrine is suppressed in upper body obese women. Am. J. Physiol. Endocrinol. Metab. 2000;278:E1144–E1152. doi: 10.1152/ajpendo.2000.278.6.E1144. [DOI] [PubMed] [Google Scholar]
- 53.Dahan J., Nouët Y., Jouvion G., Levillayer F., Adib-Conquy M., Cassard-Doulcier A.M., Tebbi A., Blanc F., Remy L., Chen J., et al. LIM-only protein FHL2 activates NF-kappaB signaling in the control of liver regeneration and hepatocarcinogenesis. Mol. Cell Biol. 2013;33:3299–3308. doi: 10.1128/MCB.00105-13. [DOI] [PMC free article] [PubMed] [Google Scholar]
- 54.Hua G., He C., Lv X., Fan L., Wang C., Remmenga S.W., Rodabaugh K.J., Yang L., Lele S.M., Yang P., et al. The four and a half LIM domains 2 (FHL2) regulates ovarian granulosa cell tumor progression via controlling AKT1 transcription. Cell Death Dis. 2016;7:e2297. doi: 10.1038/cddis.2016.207. [DOI] [PMC free article] [PubMed] [Google Scholar]
- 55.Xia W.R., Fu W., Wang Q., Zhu X., Xing W.W., Wang M., Xu D.Q., Xu D.G. Autophagy induced FHL2 upregulation promotes IL-6 production by activating the NF-kappaB pathway in mouse aortic endothelial cells after exposure to PM2.5. Int. J. Mol. Sci. 2017;18:1484. doi: 10.3390/ijms18071484. [DOI] [PMC free article] [PubMed] [Google Scholar]
- 56.Jager J., Grémeaux T., Cormont M., Le Marchand-Brustel Y., Tanti J.-F. Interleukin-1beta-induced insulin resistance in adipocytes through down-regulation of insulin receptor substrate-1 expression. Endocrinology. 2007;148:241–251. doi: 10.1210/en.2006-0692. [DOI] [PMC free article] [PubMed] [Google Scholar]
- 57.Wang L., Chen K., Wan X., Wang F., Guo Z., Mo Z. NLRP3 inflammasome activation in mesenchymal stem cells inhibits osteogenic differentiation and enhances adipogenic differentiation. Biochem. Biophys. Res. Commun. 2017;484:871–877. doi: 10.1016/j.bbrc.2017.02.007. [DOI] [PubMed] [Google Scholar]
- 58.Man S.M., Hopkins L.J., Nugent E., Cox S., Glück I.M., Tourlomousis P., Wright J.A., Cicuta P., Monie T.P., Bryant C.E. Inflammasome activation causes dual recruitment of NLRC4 and NLRP3 to the same macromolecular complex. Proc. Natl. Acad. Sci. USA. 2014;111:7403–7408. doi: 10.1073/pnas.1402911111. [DOI] [PMC free article] [PubMed] [Google Scholar]
- 59.Sagulenko V., Thygesen S.J., Sester D.P., Idris A., Cridland J.A., Vajjhala P.R., Roberts T.L., Schroder K., Vince J.E., Hill J.M., et al. AIM2 and NLRP3 inflammasomes activate both apoptotic and pyroptotic death pathways via ASC. Cell Death Differ. 2013;20:1149–1160. doi: 10.1038/cdd.2013.37. [DOI] [PMC free article] [PubMed] [Google Scholar]
- 60.Russo L., Lumeng C.N. Properties and functions of adipose tissue macrophages in obesity. Immunology. 2018;155:407–417. doi: 10.1111/imm.13002. [DOI] [PMC free article] [PubMed] [Google Scholar]
- 61.Fan Y., Wolford B.N., Lu H., Liang W., Sun J., Zhou W., Rom O., Mahajan A., Surakka I., Graham S.E., et al. Type 2 diabetes sex-specific effects associated with E167K coding variant in TM6SF2. iScience. 2021;24:103196. doi: 10.1016/j.isci.2021.103196. [DOI] [PMC free article] [PubMed] [Google Scholar]
- 62.Galarraga M., Campión J., Muñoz-Barrutia A., Boqué N., Moreno H., Martínez J.A., Milagro F., Ortiz-de-Solórzano C. Adiposoft: automated software for the analysis of white adipose tissue cellularity in histological sections. J. Lipid Res. 2012;53:2791–2796. doi: 10.1194/jlr.D023788. [DOI] [PMC free article] [PubMed] [Google Scholar]
- 63.Adomshick V., Pu Y., Veiga-Lopez A. Automated lipid droplet quantification system for phenotypic analysis of adipocytes using cellprofiler. Toxicol. Mech. Methods. 2020;30:378–387. doi: 10.1080/15376516.2020.1747124. [DOI] [PMC free article] [PubMed] [Google Scholar]
- 64.Conn C.S., Yang H., Tom H.J., Ikeda K., Oses-Prieto J.A., Vu H., Oguri Y., Nair S., Gill R.M., Kajimura S., et al. The major cap-binding protein eIF4E regulates lipid homeostasis and diet-induced obesity. Nat. Metab. 2021;3:244–257. doi: 10.1038/s42255-021-00349-z. [DOI] [PMC free article] [PubMed] [Google Scholar]
- 65.Lu H., Sun J., Liang W., Zhang J., Rom O., Garcia-Barrio M.T., Li S., Villacorta L., Schopfer F.J., Freeman B.A., et al. Novel gene regulatory networks identified in response to nitro-conjugated linoleic acid in human endothelial cells. Physiol. Genomics. 2019;51:224–233. doi: 10.1152/physiolgenomics.00127.2018. [DOI] [PMC free article] [PubMed] [Google Scholar]
- 66.Dobin A., Davis C.A., Schlesinger F., Drenkow J., Zaleski C., Jha S., Batut P., Chaisson M., Gingeras T.R. STAR: ultrafast universal RNA-seq aligner. Bioinformatics. 2013;29:15–21. doi: 10.1093/bioinformatics/bts635. [DOI] [PMC free article] [PubMed] [Google Scholar]
- 67.Love M.I., Huber W., Anders S. Moderated estimation of fold change and dispersion for RNA-seq data with DESeq2. Genome Biol. 2014;15:550. doi: 10.1186/s13059-014-0550-8. [DOI] [PMC free article] [PubMed] [Google Scholar]
- 68.Toda G., Yamauchi T., Kadowaki T., Ueki K. Preparation and culture of bone marrow-derived macrophages from mice for functional analysis. STAR Protoc. 2021;2:100246. doi: 10.1016/j.xpro.2020.100246. [DOI] [PMC free article] [PubMed] [Google Scholar]
- 69.Ying W., Cheruku P.S., Bazer F.W., Safe S.H., Zhou B. Investigation of macrophage polarization using bone marrow derived macrophages. J. Vis. Exp. 2013 doi: 10.3791/50323. [DOI] [PMC free article] [PubMed] [Google Scholar]
- 70.Fan Y., Guo Y., Hamblin M., Chang L., Zhang J., Chen Y.E. Inhibition of gluconeogenic genes by calcium-regulated heat-stable protein 1 via repression of peroxisome proliferator-activated receptor alpha. J. Biol. Chem. 2011;286:40584–40594. doi: 10.1074/jbc.M111.232918. [DOI] [PMC free article] [PubMed] [Google Scholar]
Associated Data
This section collects any data citations, data availability statements, or supplementary materials included in this article.
Supplementary Materials
GSEA, Kyoto Encyclopedia of Genes and Genomes (KEGG), and Gene Ontology (GO) term pathway enrichment analysis of WAT from Ccdc92 KO and WT mice on HFD for 14 weeks
Data Availability Statement
The data that support the findings of this study are available from the leading contact upon reasonable request. The raw RNA seq data has been deposited at Gene Expression Omnibus (GEO) database: GSE191174 and are publicly available as of the date of publication. Accession numbers are listed in the key resources table. There is no original code reported in this paper. Any additional information required to reanalyze the data reported in this paper is available from the lead contact upon request.