

Abstract
Environmental DNA (eDNA) is a highly sensitive and cost‐effective tool that is increasingly being applied to studies of biodiversity and species detection. This non‐invasive method relies on the collection of environmental samples that contain genetic material being shed into surrounding environment by the target organism/s. While forensic science has a long history of using molecular tools for collecting DNA from the environment, the detection of human DNA from environmental water samples has been limited. This study investigated the detection and degradation rates of human eDNA in water samples under controlled laboratory conditions. Using a human‐specific qPCR assay targeting the ND1 region of human mitochondrial DNA, eDNA degradation over time in water spiked with human blood was assessed. Recovery of nuclear DNA was investigated by determining if routine DNA short tandem repeat (STR) profiles of the blood source could be generated. Results demonstrated that human eDNA remains detectable for up to 11 days under laboratory conditions in environmental water and up to 35 days in distilled water. Partial STR profiles could be recovered from environmental water only up to 24 h, while, in distilled water, partial profiles continued to be recovered up to 840 h. These findings demonstrate that sampling human eDNA from aquatic samples can provide reliable human DNA detection within relatively short time windows, assisting law enforcement agencies by providing information about the potential time an individual may have been present in an area or assisting in the detection and location of a body or remains in aquatic environments.
Keywords: blood, DNA degradation, environmental DNA (eDNA), environmental water, human DNA, mitochondrial DNA, nuclear DNA, short tandem repeat
Highlights.
A complementary collection technique for recovery of human DNA from an aquatic environment has been identified.
Human DNA from blood is detectable for only up to 11 days in environmental water.
STR profiles are recoverable from highly diluted blood samples up to 24 h in environmental water.
Findings indicate the potential to broaden DNA recovery capacity to assist forensic investigations.
1. INTRODUCTION
Recent improvements in the ability to detect, collect, and genotype trace quantities of DNA have assisted many forensic investigations [1, 2, 3]. The utilization of environmental DNA (eDNA) as a tool in detecting human DNA may provide additional opportunities for the collection of evidence to assist forensic investigations. All organisms continually shed cells into the surrounding environment, leaving what is often referred to as eDNA [4]. eDNA is often analyzed using one of two main analytical approaches. The first is the use of a species‐specific assay (often qPCR or ddPCR) that uses a probe designed to specifically amplify DNA from a target species with high specificity [4, 5]. The second approach is a community composition approach and involves the use of metabarcoding which amplifies a gene region from a broader taxonomic group and then compares the sequences generated to databases to identify what species or groups are present [6, 7, 8, 9]. eDNA may be derived from a wide variety of environmental samples, including feces, saliva, urine, and/or epithelial cells of plants and animals (including humans) and can be extracted from environmental samples such as soil, air, water, or snow and does not require direct interaction with the organism [4, 6, 7, 8, 9].
Once released into the environment, eDNA starts to decay. The window of detectability of eDNA will be dependent on environmental conditions, bacterial action, the cell types the eDNA originates from, and how much DNA is present in the first place [10]. For example, cellular material released into the environment is continually broken down by UV light and microbial activity [11]. Furthermore, when an organism dies, the DNA is normally degraded by endogenous nucleases, but rapid desiccation, low temperatures, and high salt concentrations can cause nucleases to be destroyed or inactivated before all nucleic acids are broken down [12]. For instance, oxidation and the direct and indirect effects of background radiation will alter the nitrogenous bases of the sugar‐phosphate backbone of DNA [12]. In addition to that depurination, deamination, and other hydrolytic processes will also lead to destabilization and degradation of DNA [12]. Thus, understanding the decay rate of eDNA of an organism within different water environments is crucial for understanding how long ago it may have been released (and hence how long ago the target organism may have been present at a particular location).
Given the success of detecting a range of different species using eDNA in aquatic environments, this approach may prove to be useful in locating a missing individual, or human biological material, or narrowing down and directing resources during a search in an aquatic environment. Locating human remains or biological materials as quickly as possible is crucial to preserve evidence in a criminal investigation. DNA has been widely used in forensic science for several decades for identifying potential victims and/or perpetrators of a crime. Before eDNA samples from aquatic environments can be used to assist forensic investigation, we need to establish how long human eDNA persists in these environmental samples. Thus, the aim of this study was to determine eDNA degradation rates in freshwater aquatic samples. Human‐specific probes were used to detect and quantify the amount of human DNA in water samples over an 860 h period and to determine the decay rates of human DNA derived from blood. The ability to recover DNA‐STR profiles from these aquatic samples and how that changed over time, was also tested.
2. MATERIALS AND METHOD
2.1. Blood samples
Human blood samples were taken by a trained phlebotomist from a healthy female blood donor. Ethylenediaminetetraacetic acid (EDTA) was used as an anticoagulant. Blood samples were stored at 4°C and used within 24 h of collection. The same blood source was used for all experiments reported in this study. This study was conducted in accordance with The Code on Ethics of the World Medical Association (Declaration of Helsinki) and approved by the Human Ethics Advisory Group (HEAG) under approval number TEC‐39‐2017‐Durdle.
2.2. eDNA decay trial setup
Decay trials were carried out in 20 L experimental plastic chambers that had been rinsed with 1% sodium hypochlorite and then distilled water and left to dry before use. Experimental chambers were closed with a screw cap lid to reduce the likelihood of contamination of human DNA from outside sources. A small hole was drilled into the screw cap lid and silicon air tubing was tightly fitted through the opening to allow for aeration of the experimental chamber from an air pump to prevent anoxic conditions from forming and ensuring cells remain suspended throughout the experiment period. Four replicate containers were filled with 20 L of distilled water and another four replicates were filled with 20 L of environmental water taken from a dam on a private rural property. This dam does not regularly have known inputs of potential human DNA, reducing the likelihood of background DNA confounding our estimates of eDNA decay. Three replicate containers from each water treatment were spiked with 100 μl of whole human blood. A control for each water treatment was not spiked with blood and was used to determine the presence and/or levels of background human DNA or subsequent contamination during the experimental period. Experimental conditions were maintained at 19°C in a 12 h day and night light setting for the duration of the testing period (up to 35 days).
2.3. Sample collection of eDNA water treatment
Prior to sample collection, the contents of the container were homogenized using a 40 mm stir bar on a magnetic stirrer. Water samples were collected from each container prior to the addition of blood, immediately after the addition of blood, and at regular time intervals up to 35 days (Table 1). A 600 ml sample was decanted from each distilled water container using a built‐in tap for each water treatment and 500 ml of this was syringe‐filtered through a 0.22 μm pore size, polyethersulfone membrane, sterile Sterivex® ‐ GP 0.22 μm Filter Unit (PES) membranes (Merck Millipore,). However, for samples from the environmental water treatment, only 50 ml was filtered due to numerous particles of sediment and debris that blocked the filters and prevented further filtering. The volume of water filtered for each treatment was noted during sample collection and used to determine the final concentrations of DNA in the water sample. After filtering, the inlet and outlet end of the Sterivex® filters were sealed with parafilm, labeled, and placed in a zip lock bag to be stored at −80°C until DNA extraction was performed.
TABLE 1.
Time periods at which sampling of the sterile and environmental water treatments occurred
| Sampling period | Time (hours) |
|---|---|
| 1 | 0 a |
| 2 | 12 |
| 3 | 24 |
| 4 | 48 |
| 5 | 96 |
| 6 | 120 |
| 7 | 144 |
| 8 | 168 |
| 9 | 192 |
| 10 | 240 |
| 11 | 264 |
| 12 | 288 |
| 13 | 312 |
| 14 | 336 |
| 15 | 504 |
| 16 | 672 |
| 17 | 840 |
Immediately after spiking with blood.
2.4. DNA extraction
DNA was extracted from the Sterivex® filters using DNeasy Blood & Tissue Extraction Kits (QIAGEN), following a modified protocol [13]. Frozen Sterivex® filters were thawed at room temperature. Lysis solution (720 μl ATL buffer and 80 μl proteinase K) was pipetted between the outer end of the Sterivex® filter and capsule walls. The filter was vigorously shaken vertically for a few seconds and then incubated while rotating at 56°C for 2 h using a Heraeus incubator (Thermo Scientific,). After incubation, the Sterivex® filter was shaken vigorously for another few seconds. All the liquid from the inlet end capsule was then removed using a 3 ml Luer Lock syringe (Merck,) and the total amount of volume removed was measured and transferred into a 5 ml LoBind tube (Merck). Buffer AL and ice‐cold molecular grade 99% ethanol were added to the sample in equal volumes at a 1:1:1 ratio. The solution mixture was vortexed vigorously for 10 s. A maximum of 650 μl of the mixture at a time was pipetted into a DNeasy Mini Spin column in a 2 ml collection tube. Multiple spins were performed until all mixtures were used up, after which DNA extractions were performed following the manufacturer's instructions with a final elution volume of 100 μl for each sample. Extracted DNA was stored at −20°C until required for further analysis.
2.5. Real‐time PCR
Detection of human DNA from water samples was achieved using human‐specific primers and probes targeting the ND1 region of the mitochondrial DNA (mtDNA) [14]. An internal polymerase chain reaction control (IPC) was also included as a positive control in all qPCR reactions (Table 2). In a total reaction volume of 10 μl, the qPCR reaction mixture consisted of 5 μl of GoTaq® Master Mix (Promega), 0.25 μl of 18 μM hydrolysis mtND1 probe, 0.25 μl of 10 μM of forward and reverse mtND1 primers (FAM), 0.25 μl of 18 μM hydrolysis IPC probe, 0.25 μl of 10 μM of forward and reverse IPC primers (HEX), 1.5 μl of nuclease‐free water, 1 μl of IPC oligonucleotide template, and 1 μl of template DNA. A negative control consisting of 1 μl of nuclease‐free water was included, instead of template DNA, in each qPCR run. qPCRs were performed in a CFX Connect™ Real‐Time System (Bio‐Rad instrument,) with operation parameters: initial incubation at 95°C for 3 minutes, followed by 40 cycles of denaturation at 95°C for 10 s and annealing and extension at 60°C for 20 s. Fluorescence acquisition of both FAM and HEX channels was performed simultaneously at the end of each cycle.
TABLE 2.
Oligonucleotide sequence of primers and probes for mtND1 and IPC
| Oligonucleotide | Sequence 5′ – 3’ | Reference |
|---|---|---|
| mtND1 – forward | CCCTAAAACCCGCCACATCT | [14] |
| mtND1 – reverse | GAGCGATGGTGAGAGCTAAGGT | |
| mtND1 – probe | /56‐FAM/CCATCACCCTCTACATC/3MGBEc/ | |
| IPC – forward | AAGCGTGATATTGCTCTTTCGTATAG | [15] |
| IPC – reverse | ACATAGCGACAGATTACAACATTAGTATTG | |
| IPC – probe | /5HEX/TACCATGGCAATGCT/3MGBEc/ | |
| IPC Oligo |
AAGCGTGATATTGCTCTTTCGTATAGTTACCA TGGCAATGCTTAGAACAATACTAATGTTGTAAT CTGTCGCTATGT |
2.5.1. qPCR standards
To determine the assay's limit of quantification (LOQ) and limit of detection (LOD), a standard curve with 1:10 dilution series of human genomic DNA was performed and assessed following the protocol and curve fitting method described by Klymus [16]. Between 105 and 1011 copies of mtDNA were freshly prepared and used in triplicate alongside samples in each qPCR reaction to fit a standard curve to quantify the human mtDNA, depending on the amplification efficiency between the replicate PCR standards. Next, standard curves were pooled across plates to calculate concentrations of the unknown samples. Amplification curves were analyzed with the automatic baseline feature of Version 3.1 of the CFX Manager™ Software. For each run, the software used amplification results from a freshly prepared serial dilution to generate a calibration curve for mtDNA by plotting C q (quantification cycle) values versus log C 0 (initial standard of DNA concentration).
2.5.2. Internal PCR control analysis
Environmental samples may contain a complex mix of organic and inorganic compounds, some of which may inhibit PCRs. Internal PCR controls (IPC) were incorporated into all PCR samples to account for the effect of PCR inhibitors that may be present in the environmental water samples. Positive control samples were produced using a 1:10 serial dilution of 10 μM oligonucleotide. The standards ranged from 100 pM to 10 fM. IPC standards were run in triplicate with an efficiency of 100.9%, R 2 value of 0.981, and a slope of −3.3. Therefore, 1 μl of 10 pM of IPC is incorporated in each qPCR mtND1 assay sample and is estimated to amplify at C q value of 23.53. The presence of inhibitors will shift the C q value to a higher value for a given quantity of template DNA.
3. SAMPLE ANALYSIS
3.1. eDNA decay
To determine eDNA decay curves for both water treatments, an exponential decay rate was fitted with the function C(t) = C 0e −kt where C(t) is the concentration in copies/μL at any given time, C 0 is the initial eDNA concentration, k is the decay rate constant, and t is the time in hours. This was fitted using non‐linear models in statistics program ‘R' (function: ‘nlm’, package: ‘stats’) To determine if there was significant difference between the decay constants of the two different water treatments, a generalized linear model was run after linearizing the concentrations using the natural log (Ln) in the statistics program ‘R' (function:‘eglm’, package:‘stats’).
3.2. STR nDNA profiling
To determine whether it is possible to obtain a forensically useful STR profile from human DNA collected from an aquatic environment, one replicate of the environmental water treatment and one replicate of the distilled water treatment per time point were subjected to STR genotyping. In addition, a buccal swab was collected from the blood donor to generate a full STR profile for comparison. DNA was amplified using PowerPlex® 21 (Promega,) for 30 cycles, as per manufacturer's instructions. A quantity of 0.5 ng extracted DNA was added except for samples quantified at less than 0.033 ng/μL, for which the maximum volume (15 μl) of extract was added to the PCR reaction. Three samples with high concentrations of DNA were diluted down to 0.5 ng/μL. The CE injection specifications were 1.2 kV 24 s. The samples were quantified using the Quantifiler Trio® (Life Technologies,) system on an ABI PRISM® 7500 (Life Technologies,) system using HID Real‐Time PCR Analysis Software. The samples were then amplified using PowerPlex® 21 (Promega,). Amplified product detection and sizing were performed on a 3500xL Genetic Analyzer (Life Technologies,). The methodologies were applied as per manufacturer's recommendations. GeneMapper ID®‐X software (v1.4, Life Technologies,) was used for genotyping with a baseline threshold of 175 RFU and homozygous threshold of 2000 RFU.
3.3. Contamination controls
Control measures were implemented to reduce the chance of cross‐contamination of DNA from unknown sources. All pre‐amplification procedures were conducted under a laminar flow hood. Protective garments, gloves, masks, and hairnet were constantly worn. All surfaces were cleaned with 1% sodium hypochlorite, followed by 70% ethanol pre and post utilization. Only one technician was allowed into the experimental room to carry out the sampling process. Unknown profiles were compared to the profiles of laboratory staff.
4. RESULTS
4.1. mtDNA decay trials report
Human DNA was successfully amplified from both the distilled water and environmental water treatments with the amount detected declining exponentially over time (Figure 1). However, the decay rates did vary between the distilled water and environmental water treatments with the eDNA decaying faster in the environmental water treatment. The decay rate constant (k) for the eDNA was 0.019 h−1 for distilled water samples and 0.070 h−1 for environmental water samples. This corresponds to a half‐life of 36.71 h and 9.86 h for distilled water and environmental water, respectively. The limit of quantification (LOQ) and the limit of detection (LOD) for the assay were calculated at 635 copies/μL for three technical replicates. Subsequently, after time zero, the amplification profile shows a drop in mtDNA copy number for both distilled and environmental water treatments that were significantly different from each other (F1,98 = 31.02, p = 2.24 × 10⁻⁷). The copy number of mtDNA at time zero in distilled water was 4.44 × 1009 (SE ± 4.18 × 1005) and 2.20 × 1009 (SE ± 1.87 × 1006) for the environmental water samples. In the first 24 h, DNA concentration was reduced by 41% in distilled water and 90% in environmental water samples from their initial starting concentrations. After 48 h, overall DNA concentration had reduced by 77% in distilled water samples and 96% in the environmental water samples. At 840 h, further reduction in DNA concentration in distilled water (99%) and environmental water (99%) befell. The control samples indicated the presence of small amounts of background mtDNA contamination in both the distilled (16%) and environmental water samples (3%) when compared to the treatment samples at time zero. Background mtDNA detected in controlled distilled and environmental water was present at 7.12 × 1008 and 8.53 × 1007 copies at time zero. All qPCR technical negative controls showed no amplification of DNA. IPC amplified in the distilled water treatment at a C q value of 24.26 (SE ± 0.21) and environmental water treatment at a C q value of 26.06 (SE ± 0.62).
FIGURE 1.
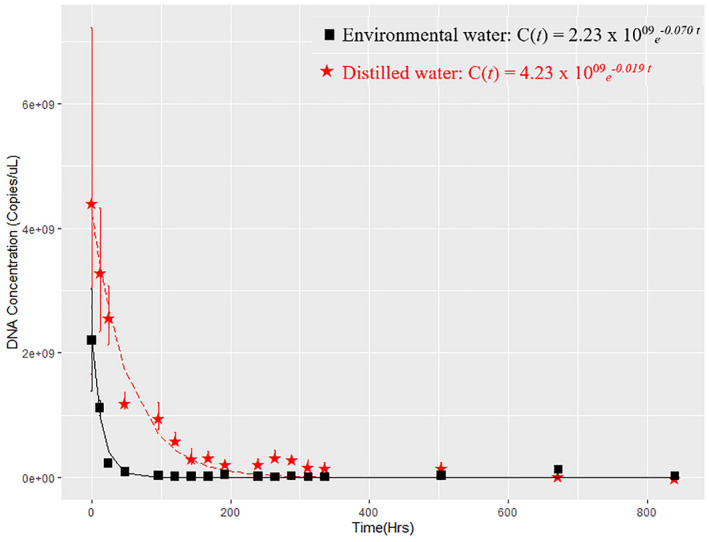
DNA decay rate of human mtDNA in environmental water (black; squares) and distilled water treatment (red; stars) spiked with 100 μl of human blood over time. The error bar in the graph represents ± standard error of the mean from three replicates. Equations show the rate of decay after fitting the model C(t) = C 0e−kt to raw data.
4.2. nDNA STR profiling
Full and partial STR nDNA profiles were obtained from some environmental and distilled water samples. There was substantial allelic dropout in the environmental water treatment compared to distilled water treatment over time (Table 3). Complete profiles (42/42 alleles) were obtained from both the distilled and environmental water treatment with at time zero. However, for the environmental water treatment, alleles were progressively lost up to 24 h after which no alleles were detected. In contrast, 8/42 alleles were still detected at 672 h, and one allele at 840 h from the distilled water treatment. The STR nDNA profiles generated from both environmental and distilled water treatments spiked with blood were compared to the female donor's STR nDNA profile and all alleles matched to the donor's profile. No nDNA contamination from other sources was detected and no alleles were detected in the environmental water control. However, a DNA profile generated from the control samples taken from the distilled water treatment at time zero did not match that of the female donor. Markers at the Amelogenin locus, used to determine sex, indicated that the DNA was from a male individual. This profile was not detected in any experimental samples and did not match any known profiles from laboratory staff.
TABLE 3.
nDNA profiling data (average peak height of alleles and total number of alleles per profile) for samples taken at different time points from distilled and environmental water treatment spiked with blood. One sample per time point was analyzed, and maximum number of alleles per profile is 42
| Time (hours) | 20 L distilled water spiked with 100 μl of blood | 20 L environmental water spiked with 100 μl of blood | ||
|---|---|---|---|---|
| Avg. peak height (RFU) | Number of alleles per profile out of 42 | Avg. peak height (RFU) | Number of alleles per profile out of 42 | |
| 0 | 91,449 | 42 | 2532 | 42 |
| 12 | 74,374 | 42 | 1134 | 39 |
| 24 | 6673 | 42 | 248 | 3 |
| 48 | 5544 | 41 | 0 | 0 |
| 96 | 3176 | 40 | 0 | 0 |
| 120 | 1529 | 40 | 0 | 0 |
| 144 | 1489 | 40 | 0 | 0 |
| 168 | 1718 | 40 | 0 | 0 |
| 192 | 994 | 40 | 0 | 0 |
| 240 | 617 | 39 | 0 | 0 |
| 264 | 1491 | 39 | 0 | 0 |
| 288 | 1315 | 39 | 0 | 0 |
| 312 | 485 | 33 | 0 | 0 |
| 336 | 430 | 29 | 0 | 0 |
| 504 | 483 | 17 | 0 | 0 |
| 672 | 239 | 8 | 0 | 0 |
| 840 | 373 | 1 | 0 | 0 |
The average peak height in profiles from distilled water was substantially higher than in profiles of samples taken at the same time from environmental water treatments (Table 3). For example, at time zero, the average peak height of alleles in distilled water treatment was 91,449 RFU, while the average peak height was 2532 RFU in environmental water. At 48 h, the average peak height of alleles in the distilled water treatment was 5544 RFU, while no alleles were detected in the environmental water treatment.
5. DISCUSSION
This study has shown that human mtDNA and nDNA can be readily detected from aquatic samples. The decay trials showed that the mtDNA detectability decreased rapidly as the DNA concentration dropped by 96% in the first 48 h in the environmental water treatment but could still be detected up to 840 h later. Studies have reported aquatic organisms' eDNA concentrations falling below the detection limit in 0.9–54 days [10, 17, 18, 19, 20, 21, 22, 23]. However, many factors may affect eDNA decay rates, including temporal variations in the rate at which DNA is shed into the environment and local environmental conditions such as temperature, UV radiation levels, and decomposition from different bacterial communities [24, 25, 26, 27, 28, 29, 30, 31, 32]. High salinity environments can affect eDNA structure and stability as well as decrease exonuclease activity, which may reduce degradation [21, 28]. UV radiation, for example, has been shown in some studies to have no influence on the rate of eDNA decay, while other studies have shown that light exposure increases eDNA decay [30, 31, 32, 33, 34, 35]. In terms of biotic environmental conditions, DNA decays more quickly in untreated water than it does in sterilized or autoclaved water [23]. The impacts on extracellular enzyme activity are the most prominent of the abiotic factors on eDNA decay that have been identified [21]. Along with the aforementioned issues, marine and freshwater tropical environments have higher than 16.1°C surface temperatures occasionally above 30°C, and high UV radiation levels at sea levels which may accelerate the eDNA degradation rate and reduce its persistence period, decreasing the probability of detection [29]. According to reports, eDNA decays faster in marine waters than in freshwaters [36, 37]. As per Thomsen [36], eDNA degrades rapidly in seawater (less than 7 days). Although human DNA decay was observed in distilled and environmental water treatments in this study, it is anticipated that human DNA detection is likely to vary depending on the abundance of human DNA relative to the size of the body of water, types, and composition of environmental water, rates of water flow and the presence of inhibitors that can hinder the amplification of target DNA [32]. Considering the amount of mtDNA detected in this study, mtDNA could potentially be used to locate human remains in larger bodies of water, or upstream in flowing water.
In this study, real‐time DNA quantification of mtDNA and STR profile genotyping of nDNA were performed on DNA that was recovered from different water treatments. STR nDNA profiles obtained from DNA samples in this study suggest it may be possible to recover a DNA profile from an aquatic water sample, however, the DNA profiles show substantial loss of alleles in environmental water, with no alleles recovered after 24 h. This differed from DNA profiles obtained from distilled water, which showed some alleles could be detected up to 840 h. These results support previous research which indicates the type of water can impact the detection of DNA. For example, it has been shown that more alleles could be recovered after 72 h from tissue samples from human ribs maintained in freshwater than tissue maintained in saltwater [38]. Although only three alleles were detected in environmental water at 24 h, there may still be some forensic utility as the partial profile could be used for exclusionary purposes or to suggest a particular individual is the potential source of the eDNA, warranting further investigation. However, the results indicate that reliable identification of an individual from DNA recovered from an aquatic environment may be difficult if the DNA is collected more than 24 h after it has been released into an aquatic environment.
This experiment focused on the degradation of DNA using human blood as the source. However, DNA can originate from a variety of human tissues and biological fluids, which could have different decay profiles to that seen for blood in this study. With respect to human remains, when they are exposed to environmental water for a prolonged period, the body will experience disarticulation and detachment of soft tissue [38, 39]. For this reason, it is not unusual to find small parts of a body distant from the rest of the human remains as a result of water currents and animal interactions [38, 39]. While the body of water is likely to be larger than what was used in this study, it is also likely to have more human DNA if the source is a body or small parts of the body. Similarly, as the body disarticulates, the primary source of DNA could spread, making it easier to locate the general area of the remains.
Background mtDNA contamination was detected in distilled control samples, indicating that care needs to be taken once samples are collected to avoid contamination. For environmental water samples, background DNA is likely to be present, which highlights the importance of taking replicate samples over the study area to account for background eDNA and detect changes in mtDNA composition, particularly in areas where people are known to visit and interact with the water frequently. Environmental water samples may have detectable levels of background human DNA present and the ability to recover a forensically useful STR profile from such water samples would depend on factors such as the concentration of human DNA in the water, the level of DNA degradation, and how many individuals have contributed DNA to the water source. As water sources may contain background DNA from many individuals, such as those used for swimming or wastewater discharge from residential areas, research should be conducted to understand background levels of human DNA in environmental samples.
5.1. Limitations and future perspectives
Unlike sample collection from the distilled water treatments in which each Sterivex® filter is capable of handling up to 500 ml of distilled water samples, only 50 ml of environmental water was able to be filtered. The Sterivex® filters used in this research had a pore size of 0.22 μm, but particles larger than 0.22 μm were present in the environmental water samples. During sample collection, plant material, soft sediments, and insects were found inside the environmental water samples; in particular, arthropods and ostracods were observed. Environmental water samples could be pre‐filtered to remove large debris prior to sample collections, but this could risk the loss of DNA associated with larger pieces of tissue, or DNA that has adhered to larger matter. In order to process larger volumes of environmental water, a new water sampling method could be explored with a larger pore size filter or the use of a series of filters with decreasing pore size. Additionally, at time zero of the experiment, when blood was spiked into distilled and environmental water, there was a large standard error in the mtDNA copy number in both water treatments. This variation is possibly due to incomplete homogenization of the samples after blood was added into the water containers and prior to sample collection. eDNA studies that use soil and water samples have shown that samples that are often contaminated with sediment particles are more prone to have humic acid or humic substances [40, 41]. These substances strongly inhibit enzymes such as Taq Polymerase which is used in PCR reactions to amplify DNA [40, 41, 42]. A ΔIPC value greater than 0.75 may indicate an inaccurate mtDNA quantification due to PCR inhibition [15]. As a result, the IPCs present in distilled and environmental water treatments are within a normal range, however, the environmental water samples have a significant difference when compared to distilled water treatments which shows evidence of inhibition. A common guideline for screening and validating IPCs for use in eDNA surveys will need to be established.
It would also be important to analyze different sources of human DNA to validate this assay. More complex water samples in which humans are frequently present or which contain multiple sources of human DNA (such as wastewater) should also be studied due to their applicability to real‐world forensic scenarios. Locating the original source of the eDNA can be problematic as eDNA can rapidly diffuse in water and the DNA may be transported away from its original source by the movement of water downstream, wind‐driven circulation, or tidal effects [4]. Therefore, research should be conducted into the detection of human DNA in water systems with dynamic water flow, to determine how far DNA may be transported from the initial release point [43] and whether the flow impacts the integrity of the DNA. The results from this study can be used to make recommendations for the use of eDNA in a forensic capacity. Importantly, the baseline decay rate of human eDNA in aquatic samples determined in this study can be used as a guide for forensic investigators to narrow down the location of the body and understand the potential window of time DNA may be recoverable once introduced into an aquatic environment. In contrast, STR nDNA profiling can provide a supportive resource for the forensic investigators regarding the eDNA samples collected in relation to a crime to help associate a sample with the originating individual. While nDNA STR profiles are more discriminating than mtDNA profiles, the latter can still be sufficiently discriminating to assist investigations. Given that mtDNA is more plentiful than nDNA in most biological samples and due to their structure less prone to being negatively impacted by environmental conditions [44] they may be the more appropriate source of human DNA to recover and profile from eDNA samples and should be part of the focus of future research pursuits in this area.
6. CONCLUSION
This research provides a demonstration of the detection of human DNA in distilled and environmental water, using methods commonly used to monitor the presence of other organisms in aquatic environments. This finding is valuable as it may provide a cost‐effective method to assist law enforcement agencies to narrow down the location and identity of a body, missing person, or human biological materials.
ACKNOWLEDGMENT
This study benefited from suggestions and discussions between Mr Matthew Ryan (Environmental Protection Authority) and Dr Craig Sherman. We also greatly appreciate the remarkable help and support of Dr Xavier Conlan throughout this project. Open access publishing facilitated by Deakin University, as part of the Wiley ‐ Deakin University agreement via the Council of Australian University Librarians.
[Correction added on 29 Nov 2022, after first online publication: CAUL funding statement has been added.]
Antony Dass M, Sherman CDH, Nai YH, Ellis MR, van Oorschot RAH & Durdle A Assessing the use of environmental DNA (eDNA) as a tool in the detection of human DNA in water. J Forensic Sci. 2022;67:2299–2307. 10.1111/1556-4029.15124
REFERENCES
- 1. Butler JM. Advanced topics in forensic DNA typing: methodology. Amsterdam, Netherlands: Elsevier Science; 2011. p. 271–345. [Google Scholar]
- 2. Van Oorschot RA, Meakin GE, Kokshoorn B, Goray M, Szkuta B. DNA transfer in forensic science: recent progress towards meeting challenges. Genes. 2021;12(11):1766. 10.3390/genes12111766 [DOI] [PMC free article] [PubMed] [Google Scholar]
- 3. Van Oorschot RA, Ballantyne KN, Mitchell RJ. Forensic trace DNA: a review. Investigative Genet. 2010;1(1):1–17. 10.1186/2041-2223-1-14 [DOI] [PMC free article] [PubMed] [Google Scholar]
- 4. Rees HC, Maddison BC, Middleditch DJ, Patmore JR, Gough KC. The detection of aquatic animal species using environmental DNA–A review of eDNA as a survey tool in ecology. J Appl Ecol. 2014;51(5):1450–9. 10.1111/1365-2664.12306 [DOI] [Google Scholar]
- 5. Lutz S, Weisser H‐J, Heizmann J, Pollak S. mtDNA as a tool for identification of human remains. Int J Leg Med. 1996;109(4):205–9. 10.1007/BF01225519 [DOI] [PubMed] [Google Scholar]
- 6. Taberlet P, Coissac E, Hajibabaei M, Rieseberg LH. Environmental DNA. Mol Ecol. 2012;21(8):1789–93. 10.1111/j.1365-294X.2012.05542.x [DOI] [PubMed] [Google Scholar]
- 7. Jerde CL, Mahon AR. Improving confidence in environmental DNA species detection. Mol Ecol Resour. 2015;15(3):461–3. 10.1111/1755-0998.12377 [DOI] [PubMed] [Google Scholar]
- 8. Ficetola GF, Miaud C, Pompanon F, Taberlet P. Species detection using environmental DNA from water samples. Bio Lett. 2008;4(4):423–5. 10.1098/rsbl.2008.0118 [DOI] [PMC free article] [PubMed] [Google Scholar]
- 9. Taberlet P, Coissac E, Pompanon F, Brochmann C, Willerslev E. Towards next‐generation biodiversity assessment using DNA metabarcoding. Mol Ecol. 2012;21(8):2045–50. 10.1111/j.1365-294X.2012.05470.x [DOI] [PubMed] [Google Scholar]
- 10. Dejean T, Valentini A, Duparc A, Pellier‐Cuit S, Pompanon F, Taberlet P, et al. Persistence of environmental DNA in freshwater ecosystems. PloS One. 2011;6(8):e23398. 10.1371/journal.pone.0023398 [DOI] [PMC free article] [PubMed] [Google Scholar]
- 11. Maier RM, Pepper IL, Gerba P. Environmental microbiology. 2nd ed. San Diego, CA: Academic Press; 2009. p. 214–33. [Google Scholar]
- 12. Hofreiter M, Serre D, Poinar HN, Kuch M, Pääbo S. Ancient DNA. Nat Rev Genet. 2001;2(5):353–9. 10.1038/35072071 [DOI] [PubMed] [Google Scholar]
- 13. Spens J, Evans AR, Halfmaerten D, Knudsen SW, Sengupta ME, Mak SS, et al. Comparison of capture and storage methods for aqueous macrobial eDNA using an optimized extraction protocol: advantage of enclosed filter. Methods Ecol Evol. 2017;8(5):635–45. 10.1111/2041-210X.12683 [DOI] [Google Scholar]
- 14. Timken MD, Swango KL, Orrego C, Buoncristiani MR. A duplex real‐time qPCR assay for the quantification of human nuclear and mitochondrial DNA in forensic samples: implications for quantifying DNA in degraded samples. J Forensic Sci. 2005;50(5):1044–60. 10.1520/JFS2004423 [DOI] [PubMed] [Google Scholar]
- 15. Hudlow WR, Chong MD, Swango KL, Timken MD, Buoncristiani MR. A quadruplex real‐time qPCR assay for the simultaneous assessment of total human DNA, human male DNA, DNA degradation and the presence of PCR inhibitors in forensic samples: a diagnostic tool for STR typing. Forensic Sci Int Genet. 2008;2(2):108–25. 10.1016/j.fsigen.2007.09.001 [DOI] [PubMed] [Google Scholar]
- 16. Klymus KE, Merkes CM, Allison MJ, Goldberg CS, Helbing CC, Hunter ME, et al. Reporting the limits of detection and quantification for environmental DNA assays. Environ DNA. 2020;2(3):271–82. 10.1002/edn3.29 [DOI] [Google Scholar]
- 17. Sassoubre LM, Yamahara KM, Gardner LD, Block BA, Boehm AB. Quantification of environmental DNA (eDNA) shedding and decay rates for three marine fish. Environ Sci Technol. 2016;50(19):10456–64. 10.1021/acs.est.6b03114 [DOI] [PubMed] [Google Scholar]
- 18. Thomsen PF, Kielgast J, Iversen LL, Wiuf C, Rasmussen M, Gilbert MTP, et al. Monitoring endangered freshwater biodiversity using environmental DNA. Mol Ecol. 2012;21(11):2565–73. 10.1111/j.1365-294X.2011.05418.x [DOI] [PubMed] [Google Scholar]
- 19. Pilliod DS, Goldberg CS, Arkle RS, Waits LP. Factors influencing detection of eDNA from a stream‐dwelling amphibian. Mol Ecol Resour. 2014;14(1):109–16. 10.1111/1755-0998.12159 [DOI] [PubMed] [Google Scholar]
- 20. Strickler KM, Fremier AK, Goldberg CS. Quantifying effects of UV‐B, temperature, and pH on eDNA degradation in aquatic microcosms. Biol Conserv. 2015;183:85–92. 10.1016/j.biocon.2014.11.038 [DOI] [Google Scholar]
- 21. Barnes MA, Turner CR, Jerde CL, Renshaw MA, Chadderton WL, Lodge DM. Environmental conditions influence eDNA persistence in aquatic systems. Environ Sci Technol. 2014;48(3):1819–27. 10.1021/es404734p [DOI] [PubMed] [Google Scholar]
- 22. Goldberg CS, Sepulveda A, Ray A, Baumgardt J, Waits LP. Environmental DNA as a new method for early detection of New Zealand mudsnails (Potamopyrgus antipodarum). Freshw Sci. 2013;32(3):792–800. 10.1899/13-046.1 [DOI] [Google Scholar]
- 23. Merkes CM, McCalla SG, Jensen NR, Gaikowski MP, Amberg JJ. Persistence of DNA in carcasses, slime and avian feces may affect interpretation of environmental DNA data. PLoS One. 2014;9(11):e113346. 10.1371/journal.pone.0113346 [DOI] [PMC free article] [PubMed] [Google Scholar]
- 24. Kreader CA. Persistence of PCR‐detectable Bacteroides distasonis from human feces in river water. Appl Environ Microbiol. 1998;64(10):4103–5. 10.1128/AEM.64.10.4103-4105.1998 [DOI] [PMC free article] [PubMed] [Google Scholar]
- 25. Okabe S, Shimazu Y. Persistence of host‐specific Bacteroides–Prevotella 16S rRNA genetic markers in environmental waters: effects of temperature and salinity. Appl Environ Microbiol. 2007;76(4):935–44. 10.1007/s00253-007-1048-z [DOI] [PubMed] [Google Scholar]
- 26. Corinaldesi C, Beolchini F, Dell'Anno A. Damage and degradation rates of extracellular DNA in marine sediments: implications for the preservation of gene sequences. Mol Ecol. 2008;17(17):3939–51. 10.1111/j.1365-294X.2008.03880.x [DOI] [PubMed] [Google Scholar]
- 27. Poté J, Ackermann R, Wildi W. Plant leaf mass loss and DNA release in freshwater sediments. Ecotoxicol Environ Saf. 2009;72(5):1378–83. 10.1016/j.ecoenv.2009.04.010 [DOI] [PubMed] [Google Scholar]
- 28. Borin S, Crotti E, Mapelli F, Tamagnini I, Corselli C, Daffonchio D. DNA is preserved and maintains transforming potential after contact with brines of the deep anoxic hypersaline lakes of the eastern Mediterranean Sea. Saline Syst. 2008;4(1):10. 10.1186/1746-1448-4-10 [DOI] [PMC free article] [PubMed] [Google Scholar]
- 29. Barnes MA, Turner CR, Jerde CL, Renshaw MA, Chadderton WL, Lodge DM. Environmental conditions influence eDNA persistence in aquatic systems. Environ Sci Technol. 2014;48(3):1819–27. 10.1021/es404734p [DOI] [PubMed] [Google Scholar]
- 30. Walters SP, Yamahara KM, Boehm AB. Persistence of nucleic acid markers of health‐relevant organisms in seawater microcosms: implications for their use in assessing risk in recreational waters. Water Res. 2009;43(19):4929–39. 10.1016/j.watres.2009.05.047 [DOI] [PubMed] [Google Scholar]
- 31. Dick LK, Stelzer EA, Bertke EE, Fong DL, Stoeckel DM. Relative decay of Bacteroidales microbial source tracking markers and cultivated Escherichia coli in freshwater microcosms. Appl Environ Microbiol. 2010;76(10):3255–62. 10.1128/AEM.02636-09 [DOI] [PMC free article] [PubMed] [Google Scholar]
- 32. Davy CM, Kidd AG, Wilson CC. Development and validation of environmental DNA (eDNA) markers for detection of freshwater turtles. PloS One. 2015;10(7):e0130965. 10.1371/journal.pone.0130965 [DOI] [PMC free article] [PubMed] [Google Scholar]
- 33. Bae S, Wuertz S. Rapid decay of host‐specific fecal Bacteroidales cells in seawater as measured by quantitative PCR with propidium monoazide. Water Res. 2009;43(19):4850–9. 10.1016/j.watres.2009.06.053 [DOI] [PubMed] [Google Scholar]
- 34. Green HC, Shanks OC, Sivaganesan M, Haugland RA, Field KG. Differential decay of human faecal Bacteroides in marine and freshwater. Environ Microbiol. 2011;13(12):3235–49. 10.1111/j.1462-2920.2011.02549.x [DOI] [PubMed] [Google Scholar]
- 35. Bae S, Wuertz S. Survival of host‐associated bacteroidales cells and their relationship with enterococcus spp., campylobacter jejuni, salmonella enterica serovar typhimurium, and adenovirus in freshwater microcosms as measured by propidium monoazide‐quantitative PCR. Appl Environ Microbiol. 2012;78(4):922–32. 10.1128/AEM.05157-11 [DOI] [PMC free article] [PubMed] [Google Scholar]
- 36. Thomsen PF, Kielgast J, Iversen LL, Møller PR, Rasmussen M, Willerslev E. Detection of a diverse marine fish fauna using environmental DNA from seawater samples. PLoS One. 2012;7(8):e41732. 10.1371/journal.pone.0041732 [DOI] [PMC free article] [PubMed] [Google Scholar]
- 37. Dell'Anno A, Corinaldesi C. Degradation and turnover of extracellular DNA in marine sediments: ecological and methodological considerations. Appl Environ Microbiol. 2004;70(7):4384–6. 10.1128/AEM.70.7.4384-4386.2004 [DOI] [PMC free article] [PubMed] [Google Scholar]
- 38. Graham E, Adamowicz M. Effects of different types of water on the degradation rate of human DNA in bone and tissue. 2015. https://www.newhaven.edu/_resources/documents/academics/surf/past‐projects/2014/ema‐graham‐paper.pdf. Accessed 3 Aug 2022. [Google Scholar]
- 39. Haglund WD. Disappearance of soft tissue and the disarticulation of human remains from aqueous environments. J Forensic Sci. 1993;38(4):806–15. 10.1520/JFS13476J [DOI] [PubMed] [Google Scholar]
- 40. Thomsen PF, Willerslev E. Environmental DNA–an emerging tool in conservation for monitoring past and present biodiversity. Biol Conserv. 2015;183:4–18. 10.1016/j.biocon.2014.11.019 [DOI] [Google Scholar]
- 41. Swango KL, Timken MD, Chong MD, Buoncristiani MR. A quantitative PCR assay for the assessment of DNA degradation in forensic samples. Forensic Sci Int. 2006;158(1):14–26. 10.1016/j.forsciint.2005.04.034 [DOI] [PubMed] [Google Scholar]
- 42. Lance RF, Guan X. Variation in inhibitor effects on qPCR assays and implications for eDNA surveys. Can J Fish Aquat Sci. 2020;77(1):23–33. 10.1139/cjfas-2018-0263 [DOI] [Google Scholar]
- 43. Jane SF, Wilcox TM, McKelvey KS, Young MK, Schwartz MK, Lowe WH, et al. Distance, flow and PCR inhibition: eDNA dynamics in two headwater streams. Mol Ecol Res. 2015;15(1):216–27. 10.1111/1755-0998.12285 [DOI] [PubMed] [Google Scholar]
- 44. Melton T, Holland C, Holland M. Forensic mitochondria DNA analysis: current practice and future potential. Forensic Sci Rev. 2012;24(2):101–22. [PubMed] [Google Scholar]