

Abstract
In Europe, the risk assessment for bees at the European Union or national level has always focussed on potential impacts on honeybees. During the revision of the European Food Safety Authority bee guidance it was explicitly stated that bumblebees and solitary bees should be considered as well and consequently concerns were raised regarding the representativeness of honeybees for these other bee species. These concerns originate from differences in size as well as differences in behavioral and life history traits of other bee species. In response to this concern, the non‐Apis working group of the International Commission for Plant‐Pollinator Relationships initiated a ring‐test of a semifield tunnel study design using the bumblebee Bombus terrestris. Nine laboratories participated, validating and improving the proposed design over a 2‐year period. The intention of the ring‐test experiments was to develop and if possible, establish a test protocol to conduct more standardized semifield tests with bumblebees. In the present study, the results of the ring‐tests are summarized and discussed to give recommendations for a promising experimental design. Environ Toxicol Chem 2022;41:2548–2564. © 2022 The Authors. Environmental Toxicology and Chemistry published by Wiley Periodicals LLC on behalf of SETAC.
Keywords: Ecotoxicology, Bumblebee, Non‐Apis , Test design, Crop protection products, Risk assessment
For ecotoxicological testing of crop protection products a test design was developed and ring‐tested by the non‐Apis working group of the International Commission for Plant–Pollinator Relationships to conduct semifield tunnel tests with the bumblebee species Bombus terrestris (Linnaeus, 1758).

INTRODUCTION
Pollination is an important ecosystem service and consequently the assessment of possible adverse effects of plant protection products on pollinators is a focal point in the authorization process of plant protection products. In the past, the risk assessment of plant protection products on bees focussed solely on the honeybee (Apis mellifera L.; e.g., Europe and Mediterranean Plant Protection Organization [EPPO] 170; 2010 & Organisation of Economic Co‐Operation and Development [OECD] 75; OECD, 2007). In 2013 the European Food Safety Authority (EFSA) issued a Guidance Document on the risk assessment of crop protection products on bees (hereafter called the EFSA Bee guidance document). This not only addressed honeybees (Apis mellifera), but also mentioned that consideration must be given to solitary bees and bumblebees (Bombus spp.) because declines of several non‐Apis bees have been reported (e.g., Biesmeijer et al., 2006; Nieto et al., 2014; Potts et al., 2010), including bumblebees (e.g., Cameron et al., 2011; Goulson et al., 2008; Potts et al., 2016; Rasmont & Mersch, 1988), and plant protection products have been identified as one of the potential factors involved (e.g., Brittain et al., 2010; Brittain & Potts, 2011).
Being a guidance document, the EFSA Bee guidance document lacks detailed advice on how to perform toxicity studies under laboratory, semifield, and field conditions on bumblebees and how to evaluate the data (EFSA, 2013). At that time, however, validated test guidelines on how to generate robust data fuelling the risk assessment procedures in the EFSA Bee guidance document for solitary bees and bumblebees were not available. Following the publication of the EFSA Bee guidance document, the International Commission for Plant–Pollinator Relationships (ICP‐PR) established a non‐Apis working group in 2014. It consists of experts from authorities, academia, and industry and aims to develop and establish robust and reproducible test protocols to conduct standardized laboratory and semifield tests with non‐Apis bees. As a result, two OECD guidelines for bumblebee acute contact and oral toxicity tests in the laboratory have been published (OECD 246 and 247). The present study describes the development of a first standard test protocol for a bumblebee semifield test and the results of its ring‐testing by nine laboratories from Germany, Spain, Switzerland, and the United Kingdom performing a total of 16 semifield studies over 2016 and 2017.
Although no standardized test protocol was available, first recommendations for higher tier tests with bumblebees were already given in the late 1980s and 1990s by Tasei et al. (1987, 1993, 1994), Gretenkord & Drescher, 1996), Gretenkord (1997), Schaefer and Mühlen (1996), and Sechser and Reber (1998), which have been reviewed by Van der Steen (2001) and Tasei (2002). The assessments conducted in the above‐mentioned studies were food consumption, weight of colonies, wing size of adults, mortality of adults and larvae (inside the colony), foraging activity, flight activity at the hive entrance, number of brood cells (eggs, larvae, and pupae) and workers before, during, and after exposure, and photographs of the brood nest (to track the development). In recent years test designs related to ecotoxicological field and semifield testing of bumblebees were developed further but the variety of test designs and proposed endpoints made it difficult to compare results. Cabrera et al. (2016) distilled recommendations for bumblebee studies in the semifield focussing on colony mass, colony reproduction, foraging activity, and mortality endpoints. These results, together with the description of higher‐tier semifield tests (involving cages, tunnels or tents) for honeybees (EPPO, 2010) and the general Society of Environmental Toxicology and Chemistry/European Standard Characteristics Of beneficials Regulatory Testing recommendations on semifield testing (Barrett et al., 1994) formed the basis for the current ring‐testing protocol. It was decided to conduct a semifield test (and not a field test) for two reasons: first, it is easier to standardize and, second, it is a “worst‐case‐scenario,” because the effect of the test item is not diluted by alternative, untreated floral ressources. The aim of the ring‐test was to optimize the handling of the bumblebees, optimize the experimental design of the tunnel study, propose suitable reference items (positive controls), outline the reliability and potential for use in risk assessment procedures of the proposed endpoints, and when required provide recommendations for improvement.
METHODS
Background
Because it is still under discussion which parameters should be used to evaluate the impacts of plant protection products on non‐Apis bees in a risk assessment context, it is not (yet) clear which tests are required and therefore we have made some pragmatic decisions when designing the test. Because the buff‐tailed bumblebee Bombus terrestris is commercially available, it was selected as a test organism. Because these insects become available in the colony initiation phase (Figure 1), only the specific life‐history traits during their social phase could be addressed. Based on the recommendations from Cabrera et al. (2016) and the reviews of van der Steen (2001) and Tasei (2002) the following assessments were selected for the ring‐test: brood development, flight and foraging activity, mortality (of adults and larvae), colony weight development, and reproduction (gynes and males), because these parameters can all be assessed during the social phase of B. terrestris colonies. The goal of our study was to capture the baseline variability of these parameters and to evaluate their potential for use in risk assessment. Flight and foraging activity assessments were conducted to monitor exposure, while brood development, colony weight development, mortality, and reproduction were used to monitor the potential effects of the test item on bumblebee adults and the brood, and could be used as endpoints for risk assessment.
Figure 1.

Bumblebee life cycle. Life cycle of Bombus terrestris: hibernating queens start foraging in spring and initiate a new bumblebee colony; the foundress queen starts building a brood nest and starts laying eggs; the foundress queen is still foraging and takes care of the brood; as soon as the first workers emerge, they take over the brood care and start foraging, the eusocial phase in the life cycle starts, and the foundress queen stays in the brood nest; the colony grows and produces workers; in the reproduction phase males and gynes are produced; the foundress queen dies and the young queens and males start foraging; gynes are mating; mated queens search for a place to overwinter and hibernate.
Although the first ring‐test (2016) was performed using existing experience within the participating laboratories and available literature, the focus of the second ring‐test (2017) was to further reduce variability between studies by increased standardization of, for instance, the worker abundance per square meter of crop, colony composition at our study start, assessment of parameters, determination of switch point (start of male and queen production), and timing of deep‐freezing at study termination. This was especially important as one of the parameters considered most relevant, namely the queen production (colony reproduction), was reported to be highly variable (Cabrera et al., 2016).
Test organisms
The buff‐tailed bumblebee, B. terrestris terrestris (Linnaeus, 1758; Hymenoptera, Apidae), was used as a test organism, with the exception of the UK laboratory, which used B. terrestris audax (Harris, 1780). Young, queenright bumblebee colonies were obtained from commercial bumblebee breeders. Colonies were kept in containers, which were equipped with a nutrition system (a sugar solution tank and pollen pellets). The nutrition system was closed off or taken out and the pollen pellets were removed, so that the bees were not fed during the exposure and monitoring period. In some cases, however, food resources were not sufficient during the whole monitoring period. In these cases, access to the sugar solution was reinstated and pollen pellets were provided.
For the ring‐test in 2017, a large surplus (at least twice as many colonies as required for the test) of small colonies with approximately five to 10 workers was ordered from a single supplier to select the most suitable and equal colonies for the test. After the initial brood assessment, the colonies were kept in the laboratory or in a climatic chamber and were observed for approximately 1–2 weeks (until the number of workers per colony increased to 15–30) before conducting a second brood assessment. Following this procedure, the colony developmental speed could be taken as a further criterion for the selection of colonies. The final selection of bumblebee colonies used in the studies was based on criteria including the number of workers, the total number of alive stages, and, in addition in the 2017 ring‐tests, the development speed (increase ratio) to reduce variability between colonies in the actual test (see Table 1 for details). These criterion were used to choose colonies, which were as similar as possible, and to distribute them evenly between the control and the test item treatment. A statistical analysis was conducted to ensure similar starting conditions in the control and the test item treatment (see Calculations and statistics for details).
Table 1.
Overview of significant results in the ring‐test with the test item dimethoate
| 2016 | 2017 | |||||||||||||
|---|---|---|---|---|---|---|---|---|---|---|---|---|---|---|
| Lab | Mean ± SD | Mean ± SD | ||||||||||||
| Parametera | Treatment | 1 | 2 | 3 | 5 | 7 | 1 | 3 | 4 | 5 | 6 | 7 | 8 | 9 |
| Initial number of workers (n) | C | 85 ± 24 | 66 ± 5 | 50 ± 5 | 25 ± 5 | 22 ± 5 | 30 ± 10 | 55 ± 7 | 58 ± 12 | 31 ± 4 | 62 ± 9 | 26 ± 6 | 32 ± 3 | 20 ± 4 |
| T | 79 ± 9 | 66 ± 8 | 48 ± 6 | 25 ± 5 | 22 ± 5 | 31 ± 7 | 55 ± 9 | 51 ± 8 | 33 ± 3 | 60 ± 5 | 24 ± 7 | 34 ± 5 | 19 ± 3 | |
| Initial number of alive stages (n) | C | 230 ± 39 | 231 ± 34 | 172 ± 20 | 88 ± 15 | 69 ± 20 | 102 ± 16 | 194 ± 27 | 178 ± 24 | 77 ± 3 | 159 ± 27 | 112 ± 23 | 102 ± 15 | 58 ± 12 |
| T | 224 ± 34 | 208 ± 9 | 173 ± 22 | 86 ± 14 | 61 ± 17 | 103 ± 15 | 200 ± 32 | 160 ± 33 | 78 ± 5 | 160 ± 30 | 108 ± 30 | 106 ± 14 | 54 ± 4 | |
| Development speed | C | n.a. | n.a. | n.a. | n.a. | n.a. | 2.2 ± 0.4 | 3.8 ± 0.8 | 2.0 ± 0.3 | 1.9 ± 0.4 | 1.5 ± 0.3 | 1.6 ± 0.4 | 10.9 ± 5.1 | 2.2 ± 0.7 |
| T | n.a. | n.a. | n.a. | n.a. | n.a. | 2.5 ± 0.4 | 3.6 ± 0.3 | 1.9 ± 0.4 | 2.3 ± 0.3 | 1.2 ± 0.2 | 1.5 ± 0.2 | 8.1 ± 1.5 | 2.2 ± 0.8 | |
| Foraging activity (per 3 min/4 m²) (n) | C | 10.9 ± 1.0 | 2.0 ± 0.5 | 2.9 ± 1.0 | 2.2 ± 0.5 | 1.8 ± 1.2 | n.a. | n.a. | n.a. | n.a. | n.a. | n.a. | n.a. | n.a. |
| T | 0.0* ± 0.0 | 0.3* ± 0.3 | 0.1* ± 0.1 | 0.0* ± 0.0 | 0.1* ± 0.0 | n.a. | n.a. | n.a. | n.a. | n.a. | n.a. | n.a. | n.a. | |
| Flight activity (per 10 min) (n) | C | n.a. | n.a. | 4.1 ± 0.9 | 11.3 ± 2.0 | 5.0 ± 2.2 | 5.5 ± 1.6 | 15.3 ± 3.8 | 4.0 ± 1.7 | 8.6 ± 1.7 | 7.0 ± 2.5 | 5.2 ± 1.0 | 5.6 ± 1.7 | 5.5 ± 2.3 |
| T | n.a. | n.a. | 0.5* ± 0.3 | 0.2* ± 0.2 | 1.2* ± 1.3 | 0.1* ± 0.1 | 1.9* ± 0.8 | 0.3* ± 0.2 | 0.8* ± 0.3 | 2.1* ± 1.0 | 0.1* ± 0.2 | 1.5* ± 0.8 | 1.6* ± 0.5 | |
| Mortality Adult bumblebees (n) | C | 20.4 ± 10.5 | n.a | 8.2 ± 3.9 | 1.8 ± 1.3 | 8.7 ± 6.3 | 21.2 ± 6.9 | 1.8 ± 1.3 | 3.0 ± 4.0 | 2.3 ± 1.9 | 0.7 ± 1.0 | 3.5 ± 1.9 | 5.2 ± 2.1 | 3.8 ± 2.5 |
| T | 77.0* ± 12.5 | 166.5 ± 61.2 | 83.0* ± 10.6 | 92.5* ± 19.0 | 58.2* ± 47.6 | 67.7* ± 21.1 | 73.8* ± 6.5 | 39.2* ± 7.8 | 29.8* ± 4.8 | 25.0* ± 5.9 | 60.5* ± 26.5 | 82.3* ± 15.8 | 8.2 ± 8.9 | |
| Mortality bumble bee larvae (n) | C | 22.2 ± 11.3 | n.a. | 64.0 ± 22.2 | 2.0 ± 3.3 | 17.3 ± 21.8 | 4.3 ± 1.6 | 43.7 ± 31.4 | 1.2 ± 1.5 | 4.0 ± 2.6 | 5.3 ± 5.2 | 27.2 ± 23.2 | 22.0 ± 10.8 | 1.2 ± 1.3 |
| T | 26.2 ± 8.5 | n.a. | 5.3 ± 9.5 | 3.2 ± 3.9 | 2.8 ± 3.2 | 10.5 ± 14.3 | 7.2 ± 8.2 | 9.0* ± 12.6 | 11.7 ± 12.5 | 0.5 ± 0.8 | 15.3 ± 13.9 | 20.5 ± 17.3 | 11.3* ± 10.3 | |
| Colony weight development (g) | C | 39.0 ± 58.0 | 385.8 ± 35.4 | 269.5 ± 99.2 | 55.5 ± 54.3 | 90.2 ± 46.8 | 144.5 ± 107.1 | 40.2 ± 3.2 | 83.0 ± 42.6 | 69.7 ± 10.8 | 258.3 ± 77.4 | 107.7 ± 29.0 | 180.9 ± 18.1 | 119.8 ± 39.9 |
| T | 0.0 ± 0.0 | 77.5* ± 46.9 | 6.2* ± 4.4 | −11.0* ± 36.1 | 41.8* ± 27.7 | 53.3* ± 13.0 | 3.2* ± 7.7 | 37.7* ± 6.6 | −7.7* ± 2.7 | 1.5* ± 5.4 | 14.7* ± 42.9 | 12.8* ± 9.5 | 52.0* ± 37.1 | |
| Final number of queen stages (n) | C | 7.6 ± 17.0b | 103.3 ± 93.5 | 137.8 ± 51.4 | 13.3 ± 17.1b | 11.5 ± 15.2 | 12.8 ± 17.4 | 11.8 ± 8.3 | 0.0 ± 0.0 | 0.0 ± 0.0 | 2.5 ± 6.1 | 29.8 ± 23.9 | 48.3 ± 49.5 | 27.3 ± 18.1b |
| T | 0.0 ± 0.0b | 5.7* ± 0.1 | 0.0* ± 0.0 | 1.2 ± 2.9b | 0.8* ± 2.0 | 0.0 ± 0.0 | 0.0* ± 0.0 | 0.0 ± 0.0 | 0.0 ± 0.0 | 0.0 ± 0.0 | 5.3* ± 13.1 | 8.5* ± 8.5 | 13.8 ± 11.5b | |
| Gyne weight (mg) | C | n.a. | 894 ± 122 | 800 ± 75 | 619 ± 105 | 626 ± 331 | n.a. | 641 ± 94 | n.a. | n.a. | 781 ± 40 | 702 ± 44 | 723 ± 74 | 592 ± 111 |
| T | n.a. | 996 ± 74 | n.a. | n.a. | 780 ± 0 | n.a. | n.a. | n.a. | n.a. | n.a. | 746 ± 129 | n.a. | 721 ± 53 | |
SD = standard deviation; flight activity = mean flight activity (sum of entering and leaving bumblebees at hive entrance) per 10 min; mean foraging activity = foraging bumblebees per three times 4 m² and 3 min; mortality of adult bumblebees/larvae = mean sum of dead adult bumblebees/larvae in hive during the exposure phase; colony weight development = development of colony weight during exposure phase (maximum weight of colony minus initial weight); final number of queen stages, total number of all queen stages developed including emerged gynes, queen larvae and queen pupae; mean gyne weight = mean weight of emerged gynes.
Excluded from further analysis (quality criteria not met).
n.a. = not available/not assessed.
*Statistically significant different to control (p ≤ 0.05).
Test design
The bumblebee field trials were designed in analogue to honeybee semifield trials using tunnels covered with a fine gauze mesh. The tunnel size varied according to the equipment available at the different laboratories, and therefore ranged from 40 to 108 m² between the laboratories. The tunnel size was adapted to the size of the bumblebee colonies to ensure that enough pollen and nectar was provided (maximum of one worker per m² at the introduction of colonies in the tunnels). As a bumblebee attractive crop, Phacelia tanacetifolia (purple tansy) was used for all tests except for one test in 2017, in which winter oil seed rape (Brassica napus) was used. Both crops were known to be attractive to bumblebees and to provide enough nectar and pollen (based on pre‐existing experience of some of the participating laboratories). Based on the season Brassica napus was used in spring (May), whereas Phacelia tanacetifolia was used in summer (June to August). Semi‐field trials were conducted using five to six replicates (one study with only two replicates was excluded from the data set [see Quality criteria]), consisting of a tunnel containing one bumblebee colony per treatment group in 2016 and six replicates in 2017. Bumblebee hives were set up on one side of the tunnel with the hive entrance facing toward the crop. The hives were covered with a rainproof roof to provide shading and shelter from rain.
The test included an exposure phase and a monitoring phase. At the start of the exposure phase, bumblebee hives were set up in the tunnels at the beginning of crop flowering (according to the Biologische Bundesanstalt, Bundessortenamt und CHemische Industrie [BBCH] scale 61–63). As a result, adult bumblebees and their brood were exposed to the nectar and pollen of the treated crop throughout the flowering period. At the end of the flowering period in the tunnels (BBCH 69), the bumblebee colonies were transferred to a monitoring site (noncropped area with sufficient foraging resources and minimal crop protection product exposure), where the bumblebee colonies could continue to develop to reach the switch point (start of male and queen production) and their reproductive phase. The colonies of the control and the test item treatment group were set up at the same monitoring site to ensure similar conditions. The colonies of the different treatment groups were set up at least 30 m apart from each other to prevent mixing up of the colonies. Exposure periods in the tunnels ranged from 7 to 25 days with a mean exposure duration of 13 days in 2016 (Table 2), whereas mean exposure comprised 15 days in 2017 (Table 3). The duration of the exposure phase depended on the flowering period of the crop. The colonies were removed from the tunnels at the end of flowering, as soon as the pollen and nectar availability was too low to sustain the colonies. It was defined that the exposure phase had to be at least 10 days as quality criterium (see Quality criteria). The respective monitoring periods in all valid studies ranged from 2.0–6.5 weeks. After the monitoring phase, the bumblebee hives were deep‐frozen in a climate chamber or deep‐freezer after narcotization with dry ice and a final brood assessment was performed. In 2016, the termination of the present study (i.e., the end of the monitoring phase) was triggered by an observed loss in weight of the colonies on two consecutive assessments. Based on preliminary data, “weight loss” was chosen as a marker to detect the switch‐point, that is, the time point at which a colony enters the reproductive phase and starts to produce gynes. Three weeks after the weight loss was observed in a colony, this colony was deep‐frozen (each colony individually). In 2017 the observation of first queen larvae (distinguishable by size) was used as a marker for the switch point instead of weight loss, because this proved to be more practical. Therefore, all colonies were monitored for the detection of first queen larvae during the mortality assessments (two times per week). Queen excluders (preventing the gynes, which are larger than the workers, to leave the hive) were installed and emerged gynes were collected two times per week. Twenty‐one days after the first queen pupae had been detected, the colonies were deep‐frozen (each colony individually).
Table 2.
Details on the participating laboratories in the ring‐test 2016 and the performed tests (crop Phacelia tanacetifolia, test item dimethoate)
| Laboratory | Test item rate (g a.i./ha) | Exposure time (days)a | Tunnel size (m²) | No. of replicates | Country/monthb | Data gaps/issues | Quality criteriac |
|---|---|---|---|---|---|---|---|
| 1 | 3000 | 7 | 50 | 5 | Germany/June | No data on flight and gyne weights; only 7 days exposure | Partially fulfilled |
| 2 | 3000 | 25 | 100 | 6 | Germany/July | No flight data | Fulfilled |
| 3 | 3000 | 18 | 60 | 6 | Germany/July, August | – | Fulfilled |
| 4 | 3000 | 18 | 60 | 6 | Switzerland/July, August | Initial no. of workers/colony >100 | Not fulfilled |
| 5 | 3000 | 8 | 40 | 6 | Germany/June | Only 8 days exposure | Partially fulfilled |
| 6 | 400 | 9 | 108 | 2 | Germany/June, July | Replicates <4; initial number of workers/colony >200; only 9 days exposure | Not fulfilled |
| 7 | 3000 | 10 | 100 | 6 | Spain/July, August | No data on gyne weights | Fulfilled |
Calculated from application day to end of tunnel phase exposure.
The month(s) during which the exposure phase was conducted is given.
A study was regarded to be valid if the toxic reference showed clear effects (statistically significant increase in adult mortality, statistically significant decrease in colony weight development and flight activity) and an exposure period in the tunnels lasted at least 10 days.
Table 3.
Details on the participating laboratories in the ring‐test 2017 and the performed tests [crop Phacelia tanacetifolia (except for Laboratory 6, which used Brassica napus), test item dimethoate]
| Lab | Test item rate (g a.i./ha) | Exposure time (days)a | Tunnel size (m²) | No. of replicates | Country/monthb | Data gaps/issues | Quality criteriac |
|---|---|---|---|---|---|---|---|
| 1 | 800 | 12 | 40 | 6 | Germany/July | No data on gyne weights | Fulfilled |
| 2 | 800 | 12 | 55 | 6 | Germany/July | Initial number of workers and alive stages significant different in control and treatment group | Not fulfilled |
| 3 | 800 | 14 | 60 | 6 | Germany/July, August | – | Fulfilled |
| 4 | 800 | 22 | 60 | 6 | Switzerland/June | – | Fulfilled |
| 5 | 800 | 18 | 40 | 6 | Germany/July, August | – | Fulfilled |
| 6d | 800 | 11 | 60 | 6 | Germany/May | – | Fulfilled |
| 7 | 800 | 24 | 100 | 6 | Germany/July, August | – | Fulfilled |
| 8 | 800 | 22 | 54 | 6 | England/July | – | Fulfilled |
| 9 | 800 | 7 | 60 | 6 | Spain/June, July | Only 7 days exposure | Partially fulfilled |
Calculated from application day to end of tunnel phase exposure.
The month(s) during which the exposure phase was conducted is given.
A study was regarded to be valid if the toxic reference showed clear effects (statistically significant increase in adult mortality, statistically significant decrease in colony weight development and flight activity) and an exposure period in the tunnels lasted at least 10 days.
Winter oil seed rape (Brassica napus).
Application/test item
The organophosphate insecticide dimethoate was chosen as a test item, which is known to be toxic to adult honeybees and therefore is commonly used as a reference item in ecotoxicological laboratories and field studies on honeybees and laboratory studies on bumblebees. In addition, one laboratory tested whether the insect growth regulator diflubenzuron may be suitable for detecting effects on bumblebee brood development. Diflubenzuron was selected on previous experiences from laboratory tests showing its effect on bumblebees (Tasei, 2001). The application was conducted at least 2 days after the introduction and acclimatization of the bumblebee colonies into the tunnels to ensure exposure of foraging bumblebees. All test items were applied as formulated products once during flowering during daily bumblebee flight as a single spray application following Good Agricultural Practice. The bumblebee colonies in the tunnels were covered with plastic sheets to prevent direct overspray of the colonies during the application. The foraging activity was checked visually in the tunnels before the application to ensure that bumble bees were foraging during the application and thus were exposed to direct overspray in the crop and to fresh residues in nectar and pollen on the day of the application. In 2017 it was defined that flight activity at the colony entrance has to be ≥2 bees exiting the colony entrance per 10 min before the test item was applied.
In 2016, seven tests were performed with dimethoate and one test with diflubenzuron. In 2016 dimethoate was applied at a rate of 3000 g a.i./ha in all valid tests. The high rate of dimethoate was initially chosen to account for the difference in sensitivity between bumblebees and honeybees in laboratory tests. Diflubenzuron was applied at a rate of 216 g a.i./ha. Because dimethoate caused high mortalities at a rate of 3000 g a.i./ha tested in 2016, the application rate was reduced in the subsequent year based on the experience of some laboratories with lower rates. As a result in 2017, nine tests were performed with dimethoate applied at a reduced rate of 800 g a.i./ha and again one test with diflubenzuron applied at a rate of 216 g a.i./ha. In contrast to the dimethoate tests, all tests with diflubenzuron were performed with three replicates only.
Assessments/parameters
The following assessments were performed to investigate behavioral and lethal effects and to obtain the respective parameters: (1) Foraging activity: The number of foraging bumblebees in the crop per defined area (4 m²) and time (3 min) of the tunnel; performed only in 2016. Assessed at the day of application once shortly before application to guarantee a sufficient exposure and shortly after the application and at 1, 2, and 4 days after the application to assess behavioral effects. Because the number was rather low in almost all tests, foraging activity was not assessed in 2017 (see also Results). (2) Flight activity: The number of foragers entering and exiting the colony entrance per time interval (10 min) during the exposure phase; assessments were conducted at the day of application once shortly before the application to guarantee a sufficient exposure and shortly after application (minimum 1 h after application) and at 1, 2, and 4 days after the application to assess behavioral effects. (3) Mortality: Dead adult bees and dead larvae inside the hive box were assessed in 2016 once after the bumblebee colonies were set up in the tunnels before the application and at 0, 1, 2, and 4 days after the application and thereafter two times per week. In 2017 assessments were performed once before application and two times per week post application. At each assessment dead adults and larvae were counted and removed. (4) Colony weight development: Colony weight was assessed in 2016 once after the bumblebee colonies were set up in the tunnels before the application and at 0, 1, 2, and 4 days after the application and thereafter two times per week until the end of the monitoring phase. In 2017 assessments were performed once before the application and two times per week post application until the end of the monitoring phase. The final weight was recorded after deep‐freezing of the colonies at the final brood assessment. Weighing of the colonies was always performed without a sugar solution tank. Weight development was used as an indicator of the development of the brood nest, because changes in weight follow a certain pattern and are linked to the health status and the developmental state of a bumblebee colony. (5) Queen production: The number of queen larvae, queen pupae, and emerged gynes; weight of emerged gynes. In 2016 the length of the right forewing of the emerged gynes was measured. The idea was to have a more reliable measure of gyne health, which is independent of the actual body weight. After deep‐freezing of the colony, a final brood assessment was performed and the following observations were documented: number of gynes, weight of individual gynes, right wing length of gynes (in 2016 only), number of egg cells, number of worker/male larvae and pupae, number of queen larvae and pupae, number of workers and number of males.
Quality criteria
For both ring‐tests, a semifield study was regarded to be valid if the toxic reference (in the context of the ring‐tests: the test item) showed clear effects, for example, statistically significant increases in adult and larval mortality, decreases in colony weight development, or flight activity of adult bumblebees. An exposure period in the tunnels of at least 10 days was required for sufficient exposure. Also, at least four replicates were needed for each treatment group (control and the test item), the initial number of workers must not exceed 100 individuals per colony, and no statistically significant differences were observed between colonies selected for the control and the test item treatment group in the initial number of workers and alive stages and development speed (see Table 1 for details).
Data preparation
To compare data between the different laboratories, the following parameters were normalized: the foraging activity data were normalized to a time window of 3 min and 4 m² observation area, the mortality data were calculated for the exposure phase (time in tunnel) only, and the colony weight development was expressed as weight difference based on the maximum weight and the initial weight at the start of the study (by using “maximum weight” instead of the “final weight” the colonies are compared at the time point at which they have their maximum size, because the final weight depends on the timing of deep‐freezing). For the remaining parameters no normalization was necessary.
Calculations and statistics
After evaluation of all data generated in the ring‐test, further statistical analysis was conducted only with the data from studies meeting the quality criteria in full or partially. The latter exception was made only when the exposure period was shorter than 10 days. It should be noted, however, that for these latter studies the endpoint “queen production” was not evaluated.
The statistical software program SAS® Ver 9.3 was used for statistical analysis (SAS Institute, 2002). The data in the test item treatment group (initial brood assessment [number of workers, number of alive stages, development speed], mortality, flight activity, foraging activity, colony weight development, and offspring production) were analyzed for significant differences in comparison to the control group. Prior to testing, normality was tested using the Shapiro–Wilk test (p ≤ 0.05) and homoscedasticity was tested using the F‐test (p ≤ 0.05). For normally distributed data with homogeneity of variance, a pooled t‐test (p ≤ 0.05) was conducted. For normally distributed but not homoscedastic data, a Satterthwaite t‐test was performed (p ≤ 0.05). Data that were not normally distributed were tested using a Mann–Whitney exact test (p ≤ 0.05). One‐sided tests (left‐sided [“lower”]) for offspring production (gynes, males) and weight data were conducted. For mortality data (adult mortality), one‐sided tests (right‐sided [“higher”]) were performed. For the initial brood assessment, foraging and flight activity data two‐sided tests were performed. Regression analysis was performed to test any correlation between wing length and body weight using Spearman rank correlation. Also, a regression analysis using Spearman rank correlation was conducted to test if a correlation between the production of queen stages and the development speed (determined between the first and the second initial brood assessment) or the daily colony weight increase during the tunnel phase exists. The minimum detectable difference (MDD) defines the difference between the means of a treatment and the control that must exist to detect a statistically significant effect (Environment Canada, 2005). Note that a difference of 90%–100% means that only large effects can be detected, 70%–90% indicates that only large to medium effects can be detected, 50%–70% means that medium effects can be detected, and an MDD value <50% indicates that small effects can be detected (EFSA, 2013). The MDD can be calculated a posteriori for the statistical method used (e.g., t‐test), considering the actual test design (replication, selected type‐I error level alpha) and the sample variation. To calculate the absolute MDD and the MDD relative to control means we used the method described by Brock et al. (2015).
RESULTS
In 2016 eight studies were performed and in 2017 10 studies were conducted, comprising 16 studies (seven in 2016 and nine in 2017) using dimethoate and two studies using diflubenzuron as a test item (one in 2016 and one in 2017). The results of the dimethoate studies will be presented first, followed by those using diflubenzuron.
Studies on dimethoate
Quality criteria
In 2016, three out of the seven participating laboratories that used dimethoate as a test item met all quality criteria, while two only partially fulfilled the criteria and two did not fulfil them (see Table 2). Problems encountered by the participating laboratories ranged from having an insufficient amount of replicates, an initial number of workers exceeding 100 individuals per colony or a too short an exposure period. In contrast, seven of the nine participating laboratories met the quality criteria set for the ring‐test in 2017 (see Table 3). In one study the initial number of workers and alive stages in colonies selected for the treatment group were significantly different to the control group and in one study the exposure time was 7 days, thus only partially fulfilling the quality criteria. Overall, only the data from two laboratories that exceeded the number of workers at the test start (in 2016) and from one study (in 2017), which did not meet the criteria at the initial brood assessment, were excluded from further data analysis and presentation.
In addition, for the parameter queen production, laboratories 1, 5, and 6 for 2016 and laboratory 9 for 2017 were excluded from further data analysis because they had an exposure period of less than 10 days. As a result, a total of 10 tests that used dimethoate as a test item were considered for the data analysis of queen production while 13 tests were used for the remaining parameters.
Foraging activity
In the control treatments, mean foraging activity varied between 1.8 and 10.9 bees/3 min with a mean over all laboratories of 3.9 bees/3 min in 2016 (Table 1). Statistically significant reductions in foraging activity after application of the reference item dimethoate could be observed for the datasets of all (five) laboratories in 2016 (p ≤ 0.05, pooled t‐test, Mann–Whitney exact, Satterthwaite t‐test). Reductions in foraging activity ranged from 12% to 98% compared to the control. Although statistically significant differences could be detected, this parameter was considered not very reliable due to the low overall numbers of foraging bumblebees. It was concluded that counts at the hive (flight activity) were more precise and as a result the endpoint “foraging activity” was discarded in the 2017 testing.
Flight activity
The flight activity (number of foragers entering and exiting the hives) was assessed in both years by all laboratories, except for laboratories 1 and 2 in 2016 (Table 1; Figure 2). In the controls, mean flight activity varied between 4.1 and 11.3 bees/10 min, with a mean across all laboratories of 6.8 bees/10 min in 2016. In 2017, mean flight activity varied between 4.0 and 15.3 bees/10 min, with a mean across all laboratories of 7.1 bees/10 min. The flight activity was statistically significantly reduced in all of the 11 evaluated tests (p ≤ 0.05, pooled t‐test, Mann–Whitney exact, Satterthwaite t‐test). Although the overall reduction in flight activity over all laboratories comprised 87% (2016) and 85% (2017), individual reductions ranged from 77% to 99% in 2016 and from 71% to 98% in 2017 compared to the control.
Figure 2.

Box plot of the number of exiting and entering bumblebees per 10 min during the exposure phase in 2016 and 2017 (only the results of the valid tests are shown). The median, and first and third quartiles are presented, and whiskers represent minimum and maximum values.
Mortality
The mean sum of dead adults per replicate over the exposure period ranged from 0.7 to 26 for the control treatments with a mean value of 6.7. In 2016, when the test item was applied at a rate of 3000 g a.i./ha, mortality was high with a mean value of 90.9 dead adult bumblebees during the exposure phase, representing 86.7% of the number of adult bumblebees and pupae initially present. In 2017, the application rate of dimethoate was reduced to 800 g a.s./ha, resulting in an average mortality of 48.3 dead adult bumblebees during the exposure phase (representing 68.6% of the number of adult bumblebees and pupae initially present). The mortality of adult bumblebees observed in the test item group was found to be statistically significantly higher compared to controls in all assessed tests in 2016 and in seven out of eight tests in 2017 (p ≤ 0.05, pooled t‐test, Mann–Whitney exact, Satterthwaite t‐test; Table 1 and Figure 3).
Figure 3.

Box plot of the number of dead worker bees in hives during the exposure phase in 2016 and 2017 (only the results of the valid tests are shown). The median, and first and third quartiles are presented, and whiskers represent minimum and maximum values.
As the test item caused a severe increase in mortality and often led to the loss of the foundress queens, no more brood developed and consequently larval mortality stayed lower compared to the control. Therefore, the mortality of larvae in the hive displayed mixed results: statistically significant increases (2016, not observed; 2017, observed in two of eight tests) but also decreases compared to the control (2016, observed in two of five tests; 2017, four out of eight tests) were observed (p ≤ 0.05, pooled t‐test, Mann–Whitney exact, Satterthwaite t‐test; Table 1).
Weight development
The development of the brood nest was evaluated by measuring the weight of the colonies. All colonies in the control displayed an increase in the mean weight during the exposure phase ranging between 39.0 and 385.8 g/colony and 40.2 and 258.3 g/colony in 2016 and 2017, respectively. Because of high levels of bumblebee mortality, most colonies in the test item treatment displayed only very slight weight increases (up to 15 g), staying stable or even losing weight in the tests. Interestingly, this pattern was observed both in 2016 using the 3000 g a.i./ha dose and in 2017 using the 800 g a.i./ha dose. Thus, mean weight increase was found to be significantly lower in the test item colonies in four out of five tests in 2016 and in all tests in 2017 (p ≤ 0.05, pooled t‐test, Mann–Whitney exact, Satterthwaite t‐test; Table 1 and Figure 4). Differences in the colony weight of the test item treated colonies compared to the control colonies ranged from −54% to −120% in 2016 and from −55% to −111% in 2017.
Figure 4.

Box plot of the total colony weight development of bumblebee colonies during the whole exposure phase in 2016 and 2017 (only the results of the valid tests are shown). The median, and first and third quartiles are presented, and whiskers represent minimum and maximum values.
Reproduction
The mean production of queen stages (defined as the sum of emerged gynes, queen pupae, and queen larvae) in the control was highly variable, ranging between 11.5 and 137.8/colony in 2016 and from 0 to 48.3/colony in 2017. Moreover, in two of the tests in 2017 it was 0.0/colony. According to the loss of adult bumblebees and foundress queens, the mean number of queen stages in the test item group was 0.0/colony in one test in 2016 and in five tests in 2017, and below 10/colony in the remaining tests of both years. Consequently, the reproduction was found to be statistically significantly lower in the reference item in three out of three considered tests in 2016 and in three of eight tests in 2017 (p ≤ 0.05, pooled t‐test, Mann–Whitney exact, Satterthwaite t‐test; Table 1 and Figure 5). Reductions in production of gynes ranged from 93% to 100% compared to the control in 2016 and from 82% to 100% in 2017. In some of the tests, the daily increase in weight during the tunnel phase was very low, even in the controls (Figure 6). This indicates that the nectar and pollen availability was not sufficient to allow the colonies to develop properly. The data imply that as soon as food resources are not sufficient, especially during early development stages, no or fewer gynes are produced by the colonies. Only well‐developing colonies reach the switch point and start producing gynes. A regression analysis showed that there is a correlation between daily weight increase during the tunnel phase and production of queen stages (Spearman' correlation coefficient r = 0.65, n = 108, p < 0.05). In addition, also a correlation between the development speed (determined between the first and second initial brood assessment) and the production of queen stages was found (Spearman's correlation coefficient r = 0.31, n = 84, p < 0.05).
Figure 5.
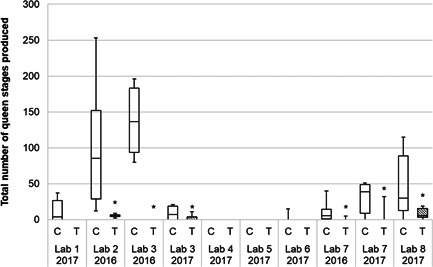
Box plot of the total number of bumblebee queen stages (sum of emerged gynes, queen larvae, and queen pupae) produced in 2016 and 2017 (only the results of the valid tests are shown). The median, and first and third quartiles are presented, and whiskers represent minimum and maximum values.
Figure 6.

Daily weight increase in control colonies during the exposure phase in 2016 and 2017 (tests observed with statistically significant lower number of bumblebee queen stages produced marked in gray).
Mean gyne weight
Only three complete data sets (one in 2016 and two in 2017) were available for evaluation. The mean gyne weight varied between laboratories and was slightly higher for gynes from the test item treatment group compared to the control group (726 ± 143 and 683 ± 91 mg for the test item and the control, respectively). No statistically significant differences were found between gyne weights from treated and control colonies (Table 1). A regression analysis showed that there is no correlation between forewing length and body weight (Spearman's correlation coefficient r = 0.16, n = 505, p > 0.05).
Studies on diflubenzuron
In addition to the reference item dimethoate, one laboratory tested the insect growth regulator diflubenzuron as a reference item at a rate of 216 g a.s./ha in both 2016 and 2017 (Table 4). Foraging and flight activity were not reduced after application of the test item. The mean mortality of adult bumblebees also did not show any statistically significant difference compared to the control treatment. In addition, neither the colony weight development nor the production of gynes differed statistically significant from controls in these tests. However, with regard to larval mortality in the hives, a statistically significant difference (four times higher in 2016 and 11 times higher in 2017) was found in both years (p ≤ 0.05, pooled t‐test, Mann–Whitney exact).
Table 4.
Overview of significant results in the ring‐test with the test item diflubenzuron
| Mean ± SD | |||
|---|---|---|---|
| Parametera; mean per hive or replicate) | Year/treatment | 2016 | 2017 |
| Initial number of workers (n) | C | 85 ± 24 | 30 ± 10 |
| T | 73 ± 16 | 28 ± 8 | |
| Initial number of alive stages (n) | C | 230 ± 39 | 102 ± 16 |
| T | 212 ± 41 | 103 ± 27 | |
| Foraging activity (per 3 min/4 m²) (n) | C | 10.9 ± 1.0 | n.a. |
| T | 9.6 ± 0.5 | n.a. | |
| Flight activity (per 10 min) (n) | C | n.a. | 5.5 ± 1.6 |
| T | n.a. | 3.4 ± 1.8 | |
| Mortality adult bumblebees (n) | C | 20.4 ± 10.5 | 21.2 ± 6.9 |
| T | 12.8 ± 3.0 | 15.3 ± 5.7 | |
| Mortality bumblebee larvae (n) | C | 22.2 ± 11.3 | 4.3 ± 1.6 |
| T | 82.8* ± 22.6 | 95.0* ± 30.6 | |
| Colony weight development (g) | C | 39.0 ± 58.0 | 144.5 ± 107.1 |
| T | 47.0 ± 23.3 | 76.3 ± 35.4 | |
| Final number of queen stages (n) | C | 7.6 ± 17.0 | 12.8 ± 17.4 |
| T | 0.8 ± 1.8 | 2.6 ± 2.6 | |
| Gyne weight (mg) | C | n.a. | n.a. |
| T | n.a. | n.a. | |
The test item was applied at a rate of 216 g a.i./ha. In 2016, only three replicates, no flight ass., no gyne weights assessed, only 7 days of exposure. In 2017, only three replicates, no gyne weights assessed.
n.a. = not available/not assessed; SD = standard deviation; flight activity = mean flight activity (sum of entering and leaving bumblebees at hive entrance) per 10 min; mean foraging activity = foraging bumblebees per three times 4 m² and 3 min; mortality of adult bumblebees, mean mortality of adult bumblebees in hive; colony weight development = development of colony weight during exposure phase (maximum weight of colony minus initial weight); final number of queen stages = total number of all queen stages developed including emerged gynes = queen larvae and queen pupae; mean gyne weight = mean weight of emerged gynes.
*Statistically significant different to control (p ≤ 0.05).
MDDs
The MDDs for the different parameters give an indication of how variable the respective parameters are and what statistical effects could be determined with them (see Table 5). The MDD of the parameter “flight activity” benefits from multiple observations taken when weather conditions are comparable. The MDD was on average 34 in 2016 which means that a difference of 34% could be detected statistically and consequently small effects would be detectable. In 2017, the MDD for the endpoint “flight activity” was 28. For the parameter “adult mortality” a mean MDD of 42 was observed in 2016 and mean MDD of 61 in 2017. The parameter “colony weight development” showed an average MDD value of 66 in 2016 and of 33 in 2017. Even though only data sets with a mean of ≥10 queen stages observed in control colonies were included in the analysis, the endpoint “queen production” is the parameter with the highest MDD, with on average 55 in 2016 and 98 in 2017. Based on the MDD classes proposed by EFSA (2013), on average only large effects could be determined statistically for queen production. It should be noted, however, that this endpoint was rather variable over the different studies, ranging between 25 and 78 in 2016 and between 70 and 148 in 2017, indicating that some laboratories could also detect small effects with the present study design.
Table 5.
Minimum detectable differences (MDDs) for different parameters of the 2016 and 2017 ring‐tests
| Year | Parameter | n | Mean | Median | Minimum | Maximum |
|---|---|---|---|---|---|---|
| 2016 | Flight | 3 | 34 | 27 | 24 | 50 |
| Adult mortality | 5 | 42 | 40 | 34 | 52 | |
| Colony weight development | 6 | 66 | 71 | 37 | 87 | |
| Queen productiona | 3 | 55 | 62 | 25 | 78 | |
| 2017 | Flight | 10 | 29 | 30 | 21 | 44 |
| Adult mortality | 10 | 61 | 59 | 29 | 114 | |
| Colony weight development | 10 | 33 | 34 | 8 | 60 | |
| Queen productiona | 4 | 98 | 93 | 70 | 148 |
Number of emerged gynes, queen pupae, and queen larvae (considering datasets with mean queen production of ≥10 only).
n = number of trials which were considered for the respective parameters.
DISCUSSION
The ring‐test results showed that bumblebees foraged well on both winter oilseed rape (Brassica napus) and purple tansy (Phacelia tanacetifolia), and control colonies gained weight during the exposure phase in the tunnel. The correlation between daily weight increase during this tunnel phase and the later production of gyne stages implies that the availability of nectar and pollen in the tunnel is important for undisturbed brood development.
Using dimethoate, most tests found statistically significant reductions in flight activity and colony weight development, an increase in mortality, and effects on reproduction parameters following the application at the reduced rate of 800 g a.i./ha. This rate is twice the rate used in tunnel studies with A. mellifera (400 g a.i./ha dimethoate; CEB, 2011). First‐tier laboratory tests with bumblebee workers usually show a lower sensitivity compared to honeybees (mainly due to their size; see OECD, 2017a, 2017b). In addition, Uhl et al. (2016) found the sensitivity of B. terrestris to be more than 40 times lower compared to A. mellifera. To account for these differences, the application rate was initially already chosen at a higher rate and dimethoate proved to be a dependable positive control at the tested rate of 800 g a.i./ha.
As can be expected from an insect growth regulator, the two studies using diflubenzuron as a test item did not show any acute effects on the mortality and flight activity of adult worker bumblebees but did show significant effects on larval mortality. Because of this limited range of detectable responses, using diflubenzuron as a reference compound seems less favorable. Additional research is needed to design studies on bumblebee colonies for assessing the adverse effects of insect growth regulator substances such as diflubenzuron, because the data set presented in our study is limited. For the time being, dimethoate proves to be a toxic reference item impacting a broader range of endpoints and causing acute effects on bumblebees and their progenies under semifield conditions.
To verify exposure for products with acute toxicity, the parameter “flight activity” (number of foragers entering and exiting the hives) appears to be a more reliable parameter compared to “foraging activity” (number of foragers observed on a certain crop area). Although both parameters are based on foraging behavior, the endpoint “flight activity” results in a higher resolution because it records the number of foragers entering and exiting the hives whereas the density of forager bees (measured by “foraging activity”) in a certain crop area can be very low. The reason for the observed low forager bee density in the assessment areas inside our study tunnels is that bumblebee colonies are a lot smaller than honeybee colonies (comprising only several hundred individuals compared to at least several thousand bees in a honeybee colony). Also, a large tunnel size further dilutes the number of foragers observed per m². In addition, the assessment of “flight activity” enables more detailed observations because it is also possible to count the number of returning foragers with visible pollen loads to show exposure to the diet provided by the target crop. For this parameter, statistically significant effects between the untreated and the dimethoate‐treated replicates were detectable in all evaluated tests.
The parameter “mortality of adult bumblebees” proved to be a reliable parameter showing statistically significant effects in most tests. The parameter “larval mortality” is regarded to be relevant only for substances where effects on the bumblebee brood at a given application rate or brood affecting properties (i.e., effects on the larval development or pupation) cannot be excluded. For test items causing acute effects on adult bumblebees, larval mortality is not a suitable parameter as pre‐imaginal mortality depends on the size of the brood nest and particularly when a colony is well developed, larval mortality is higher compared to a weak colony (false‐positive results). That is why colonies need to be as equal as possible before the start of a study.
The weight development of bumblebee colonies is a reliable parameter to evaluate their health status. The increase in weight is directly related to a normal development of the brood nest and is a good indicator of the health condition of a colony. The parameter should be presented as colony weight (weight of the brood nest and bees without the weight of the hive box) because of possible differences in the initial weight of the hive box. The results show that loss of colony weight is not a good indicator of the switch point (the start of queen and male production).
The parameter “gyne weight” is a parameter that might give an indication of whether the emerged gynes are affected by the test item. One issue in the semifield set‐up is that gynes cannot forage freely because the colonies are fitted with queen excluders to prevent gynes from exiting the colony. Hence, gynes do not build up their fat reserve as they would under natural conditions. Although this artifact prevents a comparison to weights given in the literature for freely foraging gynes, it is still possible to compare gyne weights between untreated and treated replicates within the semifield test design. The ring‐test showed no effects of dimethoate on gyne weight. The slightly higher mean gyne weight found in most of the tests in the dimethoate treatment is probably due to the fact that with an increasing number of gynes in a colony the amount of food available to each individual gyne decreases. An alternative measurement of the wing length was not usable as a surrogate for weight. The radial cell length could alternatively be used as a surrogate for queen size or queen weight to compare treated and control colonies. However, radial cell length could not predict diapause survival of bumblebee queens (Beekman et al., 1998).
Overall, the results imply that only the numbers of queen larvae, pupae, and emerged gynes provide useable endpoints in the final brood assessment. The assessment of other parameters, such as the weight and forewing size of emerged gynes, the number of adult workers and males and their stages as well as the number of cells with eggs, does not provide useful data when the colonies are deep‐frozen almost at the end of the colony life cycle. Generally, the number of workers decreases when the colony reaches the switch point (enters the reproductive phase). Depending on the developmental stage there will be varying amounts of workers left in a colony. The more developed a colony is, the fewer workers and brood will be observed. Gynes can be held back in the hive box using queen excluders due to their size, but for males this is not possible. Generally, males fly out some time after their emergence and do not come back to the colonies.
The parameter “queen production,” that is, reproduction of the colony, is a vital parameter in risk assessment due to the specific life‐history traits of bumblebees. Bumblebees do not overwinter as a colony and only the gynes overwinter to found a new colony in the following spring. Therefore, the produced gynes are essential for the preservation of the population in the next season. In the ring‐test, this parameter combines all emerged gynes, queen larvae, and queen pupae in the colony. We have chosen to summarize all queen stages (larvae, pupae, and emerged gynes) because the number of emerged gynes depends on the timing of deep‐freezing and is therefore in isolation by definition too variable.
Due to the natural variation in the number of gynes and males that are produced from a colony, this parameter shows a higher variability when compared to the other parameters. This variability, however, could not be explained by the number of workers, alive stages or brood stages at test start, the crop provided, the number of workers, alive stages or brood stages per m² crop in the tunnels, and the duration of the monitoring phase.
Nevertheless, queen production is strongly influenced by the start of the eusocial phase of the colony and much attention should be paid to the colony selection to reduce variability. To trigger the bumblebee colonies to produce gynes the following recommendations seem to be crucial. First, start the study relatively early in the season to follow the natural life cycle as much as possible. Second, start with healthy, young, well‐sized colonies (large colonies tend to be at the end of their annual development cycle, resulting in the risk of colonies having already started to produce gynes before exposure). In addition, the development speed (determined between the first and second initial brood assessments) could be used to select colonies with a medium to high development speed (at least approximately double in size after 7–10 days) to achieve sufficient queen production. Lastly, enough food resources have to be provided during the exposure phase in the tunnels (e.g., larger tunnel size and a good crop quality, irrigation if the soil is too dry for sufficient nectar production) and during the monitoring phase (i.e., areas of natural vegetation with flowering plants in the vicinity of the monitoring site).
The experience of some laboratories is that colonies under the above‐mentioned conditions produce a relatively high number of gynes, resulting in a lower variability. However, a lot of experience is needed to understand the specific mechanisms and to handle the set‐up and the bumblebee colonies.
Results also suggest that due to the variability of colony size and development, a minimum of six replicates per treatment group is recommended. Modelling the impact of an increase from four to six replicates on the MDD for the parameter “queen production” shows a decrease of 10.6% for the mean MDD. For the test with the lowest detected MDD a decrease of 20.5% (from 45.5% to 25%) could be reached for the parameter “queen production” with six replicates.
Based on the results obtained in the ring‐test it would not be possible to detect detrimental effects of less than 25% on “queen production” compared to controls (lowest MDD was 25, average was 72). A mean MDD of 36% for “queeen production” was reported by Sterk et al. (2016) in a large‐scale field study, while Candolfi et al. (2018) also found similar MDD values for this parameter as well. With a larger database more accurate MDD values could be determined. Because “queen production” is considered to be the most important endpoint in risk assessment (Cabrera et al., 2016) this indicates that effect levels derived for honeybees, that is, the effect level of 7% which was proposed as the protection goal in the EFSA Bee guidance document (2013), does not fit the biological variation present in bumblebee colonies.
All the ring‐test data presented in the present study were generated with B. terrestris. The assumption is that the principles of the test design should be suitable also for other Bombus species, such as B. impatiens (Cresson, 1863). However, the test design may have to be adapted if different crops are used (Scott‐Dupree et al., 2018; Gradish et al., 2016). The rates of the toxic reference dimethoate might have to be adapted to other species. It seems that B. impatiens is more sensitive to dimethoate compared with B. terrestris (Scott‐Dupree et al., 2018).
CONCLUSIONS
The test design developed over the 2‐year testing period was based on the experiences of the nine different laboratories and available information from literature. Overall, the ring‐test protocol was found to be workable for the majority of laboratories and the results improved in the second year (2017) because the laboratories increased their experience with the test. It was shown that semifield studies with bumblebees in purple tansy (P. tanacetifolia) or winter oil seed rape (B. napus) are feasible. It is noted that the success of a study strongly depends on the experience of the performing laboratory, the crop quality, the quality of the bumblebee colonies, and the weather conditions. Excluding the weather, these parameters can be influenced to a certain degree by the experimenter. The availability of food (nectar and pollen) and thus the quality of the crop during the exposure phase in the tunnels is an important factor influencing the development of a colony and has an impact on the reproductive success. If the conditions during the exposure phase are not favorable, colonies generally reproduce less and variability increases. To ensure a sufficient exposure period (at least 10 days) in P. tanacetifolia, it is important to set up the colonies in the tunnels as soon as enough flowers are open to provide nectar and pollen for them (at the start of flowering, approximately BBCH 61–63). In B. napus this is less critical because the flowering period is generally longer.
Because the reproductive success of a bumblebee colony is crucial for the survival of bumblebee populations, the parameter “queen production” is the most relevant parameter for the risk assessment. However, according to the data from the available ring‐tests, this parameter still seems to be highly variable. Different measures were taken to reduce the variability of the colonies at test start by an improved colony selection method. In addition, a minimum reproductive success in the control must be defined in the future to be able to detect possible effects in the treatment. Further research and experience are necessary to get a better understanding of what triggers and influences queen production within such a semifield set‐up and the possibility of reducing the variability in queen production. It seems that particularly the developmental speed of the hives (medium to high) and a sufficient provision of food from the crop during the exposure phase are basic requirements to achieve queen production and a low variability. For the time being, dimethoate can be proposed as a toxic reference item at a rate of 800 g a.i./ha, but further experience is needed on the use of the insect growth regulators (e.g., diflubenzuron). Other active substances may be considered as well, but these should be tested beforehand to establish which application rates to use and what effects are expected in a semifield trial.
Based on the experiences in the ring‐tests, recommendations for working methods are given in Table 6. These recommendations are a first systematic step and are open for further improvement and standardization.
Table 6.
Recommendations for a possible semifield study design for the assessment of plant protection product side effects on bumblebees
| 1) General design of the test method | |
| The test consists of at least three treatment groups, the untreated Control C, the test item treatment Group T, and a toxic reference item (applied with the active ingredient dimethoate or in case of insect growth regulators the active ingredient diflubenzuron). The application takes place as spray application at least 2–4 days after set up of the bumblebee colonies in the tunnels. | |
| As relevant parameters brood development, flight activity, colony weight development, and reproduction performance [queen stages (defined as sum of queen larvae, queen pupae, and emerged gynes)] are considered. | |
| The adult bees and their larvae will be exposed to the nectar and pollen of the crop throughout the flowering period. After the end of exposure in the tunnels, the colonies are transferred to a monitoring location to assess the subsequent development of the colonies and the production of queens. | |
| 2) Test method | |
| 2.1) Test system/test organism | |
| Species/variety | Bombus terrestris (Linnaeus, 1758) |
| Recommendations might be applicable with adaptations also for other species, that is, Bombus impatiens (Cresson, 1863), Bombus ignitus (Smith, 1869), and so forth. | |
| Source | Colonies from commercial supplier. |
| Colonies | Normal queenright colonies each with approximately 10–40 bumblebee workers at arrival at the test site depending on the time of the study start and the crop (the colonies will be larger when they are introduced in the tunnels, because the colony growth between arrival at the test site and study start has to be considered). To ensure uniform colony development and a low variability in the endpoints/parameters following approach is a possibility but is not mandatory: the colonies are kept indoors (laboratory, storage room, climatic chamber) at ambient temperature for approximately 1–2 weeks to monitor the development and exclude queens that were damaged by the transport. |
| To reduce variability between the replicates colonies which are similar in size and composition and are developing at an equal pace should be selected for the test. Also, colonies should not have reached the “switch‐point” (produced male or queen larvae) before study start. | |
| Bumblebees are supplied with auxiliary food (sugar solution and pollen) before set‐up of the colonies in the tunnels. During the exposure and monitoring phase the sugar solution supply is closed and pollen supply stopped. | |
| Condition of the colonies, development of the bumblebee brood | At least once before set‐up in the tunnels (initial brood assessments). |
| Once at the end of the monitoring phase (final brood assessment). | |
| Crop | For the test Phacelia tanacetifolia or oil seed rape as bee attractive crops or other bee attractive and relevant crops can be used. |
| 2.2) Test design | |
| Study type | Semifield study |
| Tunnel size | Minimum 40 m², better 60 m² (~maximum one worker per m² at introduction of colonies in the tunnels) |
| Number of treatment groups | ≥1 test item treatment, one control (negative control), one toxic reference (positive control) |
| Toxic reference item | Dimethoate (800 g a.s./ha) or in case of insect growth regulators, that is diflubenzuron (216 g a.i./ha) |
| Replicates per treatment group | ≥6 (for the toxic reference three replicates can be sufficient) |
| Test organism per treatment group | Six bumblebee colonies per treatment group (one per tunnel) |
| Bumblebee colony selection before test initiation | Approximately two times more colonies with approximately 10–40 workers should be ordered for initial brood assessment. The best and most uniform colonies can be selected. |
| The following criteria should be taken into account for the final choice of the colonies: | |
| |
| The colonies should be as uniform as possible regarding these criteria. | |
| Pre‐exposure period | Set‐up of bumblebee colonies in tunnels: 2–4 days before application |
| Set‐up | Sun and rain protection of hives is recommended (i.e., hives placed on palettes, protection with styrofoam roofs) |
| Water supply generally not required (exception under very hot conditions, in greenhouses, etc.) | |
| Application | Foliar application following good agricultural practice, timing during bee flight (flight activity at the colony entrance has to be ≥2 bees exiting the colony entrance per 10 min before the test item is applied). During the application the colonies have to be covered (e.g., by plastic sheets) to prevent direct overspray of the colonies. For the test item a different application scheme (i.e., application after or before flight, application before flowering, seed treatments, etc.) might be tested. |
| Exposure phase | Duration of approximately 2 weeks (during flowering period of the crop), as long as crop conditions are favorable (providing sufficient nectar and pollen) |
| Post‐exposure period (monitoring site) | After the exposure phase in the tunnels, the bumblebee colonies are transferred to one monitoring site because different conditions on separate monitoring sites may substantially influence the colony development. This site should be a noncropped area with foraging resources providing a sufficient pollen and nectar supply to avoid starvation of the colonies; mass flowering crops should be avoided, and crop protection product exposure should be minimal. Colonies of the different treatment groups should be placed at least 20 m apart from each other. |
| Hives should be well protected against rain and animal interference. The surrounding flowering vegetation is assessed once during the monitoring phase (listing of most abundant flowering species). | |
| Additional feeding (sugar solution, pollen) during the monitoring phase should be avoided. | |
| 2.3) Quality criteria | |
| Parameters | At least a significant reduction in one of the parameters in the toxic reference compared to the control. |
| 2.4) Assessments and parameters | |
| Initial brood assessment | Adult and brood stages are determined before set‐up of the colonies in the tunnels. |
| For the initial brood evaluations each hive is opened under red light and the following brood stages and observations are documented: | |
| |
| The initial brood assessments are performed to choose bumblebee colonies that are healthy and similar in size and composition. It is recommended to perform the initial brood assessments with approximately twice as many colonies as needed to keep variability between the replicates at a minimum. | |
| Flight activity | The observation of the flight activity takes place at the entrance of each bumblebee hive. At each assessment the number of bumblebees entering and exiting the hive (both separately) will be counted during a defined time interval (at least 10 min). Flight assessments should be conducted in parallel in the control and the test item treatment(s). |
| Assessments should be performed at least every 3–4 days (two times per week). Depending on the test item daily assessments might be advisable in the first days after the application to be able to detect small, acute effects. While observing entering forager bumblebees, the number of foragers with pollen loads of the target crop should be documented to evaluate exposure. | |
| Mortality | Mortality of adult bumblebees and larvae is assessed inside the hives at least every 3–4 days (two times per week). Depending on the test item daily assessments might be advisable in the first days after the application to be able to detect small, acute effects. At each assessment dead adults and larvae are counted and removed from the hive. Foundress queen mortality is also noted. |
| Colony weight development | The weight of the bumblebee colonies is determined at least every 3–4 days (two times per week). Depending on the test item daily assessments might be advisable in the first days after the application to be able to detect small, acute effects. |
| Switch‐point | All colonies are monitored for the “switch point” (= detection of first queen larvae) every 3–4 days (two times per week, during exposure and monitoring phase). |
| Queen production/termination of test | The bumblebee colonies are expected to switch to the reproduction phase (= the production of sexuals) at the end of the exposure phase or during the monitoring phase. The occurrence of queen larvae and pupae as well as the presence of males is documented. Approximately 7 days after first queen pupae have been detected, queen excluders have to be installed and emerged gynes are collected every 3–4 days (two times per week). |
| If at least 30% of the estimated queen pupae or at least 10 gynes have emerged the hive is deep‐frozen (each hive individually, approximately 1 month after first queen pupae have been detected). Colonies which do not reach the switch point are deep‐frozen on the same day as the last control hive. If it is foreseeable that a hive will not reach the switch point, it can be deep‐frozen earlier (e.g., toxic reference treated colonies; expert judgment and documentation necessary). | |
| Queen production and final brood assessment | At the end of the study, bumblebee colonies will be killed by deep‐freezing and the following brood stages and observations will be documented: |
| |
Supporting Information
The Supporting information are available on the Wiley Online Library at https://doi.org/10.1002/etc.5430.
Author Contributions Statement
Olaf Klein: Writing—original draft; Conceptualization; Methodology; Data curation; Formal analysis; Investigation; Software; Validation; Visualization. Ivo Roessink: Writing—review and editing; Supervision. Charlotte Elston: Writing—review and editing; Conceptualization; Methodology. Silvio Knäbe: Writing—review and editing; Conceptualization; Methodology. Johannes Lückmann: Writing—review and editing; Conceptualization; Methodology. Lea Franke: Writing—review and editing; Conceptualization; Methodology; Data curation; Investigation; Validation; Visualization. Tobias Jütte: Writing—review and editing; Conceptualization; Methodology; Investigation. Jozef van der Steen: Writing—review and editing; Supervision. Matthew J. Allan: Conceptualization; Methodology; Investigation. Annika Alscher: Conceptualization; Methodology; Investigation. Kristin Amsel: Conceptualization; Methodology; Investigation. Magdaléna Cornement: Conceptualization; Methodology; Investigation. Nina Exeler: Conceptualization; Methodology; Investigation. Bettina Hodapp: Conceptualization; Methodology; Investigation. Carole Jenkins: Conceptualization; Methodology; Investigation. Stefan Kimmel: Conceptualization; Methodology; Investigation. Verena Tänzler: Conceptualization; Methodology; Investigation. Juan Sorlí Guerola: Investigation.
Supporting information
This article includes online‐only Supporting Information.
Supporting information.
Supporting information.
Supporting information.
Supporting information.
Supporting information.
Acknowledgment
We would like to thank J. van der Steen and N. Hanewald for organizing numerous non‐Apis group meetings. Also, we are thankful for the platform the International Commission for Plant‐Pollinator Relationships provides for scientists working in different institutions to meet, discuss, and develop new ideas and methods.
Olaf Klein, Ivo Roessink, Charlotte Elston, Lea Franke, Tobias Jütte, Silvio Knäbe, Johannes Lückmann, and Jozef van der Steen contributed equally to this work.
Data Availability Statement
Data, associated metadata, and calculation tools are available in the Supporting Information.
REFERENCES
- Barrett, K. L. , Grandy, N. , Harrison, E. G. , Hassan, S. , & Oomen, P. (1994, March 28–30). Guidance document on regulatory testing procedures for pesticides with non‐target arthropods. European Standard Characteristics of non‐target arthropod Regulatory Testing (ESCORT) Workgroup, SETAC Europe, Wageningen, the Netherlands.
- Beekman, M. , van Stratum, P. , & Lingeman, R. (1998). Diapause survival and post‐diapause performance in bumblebee queens (Bombus terrestris). Entomologia Experimentalis et Applicata, 89(3), 207–214. 10.1046/j.1570-7458.1998.00401.x [DOI] [Google Scholar]
- Biesmeijer, J. C. , Roberts, S. P. , Reemer, M. , Ohlemuller, R. , Edwards, M. , Peeters, T. , Schaffers, A. P. , Potts, S. G. , Kleukers, R. , Thomas, C. D. , Settele, J. , & Kunin, W. E. (2006). Parallel declines in pollinators and insect‐pollinated plants in Britain and the Netherlands. Science, 313(5785), 351–354. [DOI] [PubMed] [Google Scholar]
- Brittain, C. , & Potts, S. G. (2011). The potential impacts of insecticides on the life‐history traits of bees and the consequences for pollination. Basic and Applied Ecology, 12(4), 321–331. [Google Scholar]
- Brittain, C. A. , Vighi, M. , Bommarco, R. , Settele, J. , & Potts, S. G. (2010). Impacts of a pesticide on pollinator species richness at different spatial scales. Basic and Applied Ecology, 11(2), 106–115. [Google Scholar]
- Brock, T. C. M. , Hammers‐Wirtz, M. , Hommen, U. , Preuss, T. G. , Ratte, H.‐T. , Roessink, I. , Strauss, T. , & Van den Brink, P. J. (2015). The minimum detectable difference (MDD) and the interpretation of treatment‐related effects of pesticides in experimental ecosystems. Environmental Science and Pollution Research 22(2), 1160–1174. [DOI] [PMC free article] [PubMed] [Google Scholar]
- Cabrera, A. R. , Almanza, M. T. , Cutler, G. C. , Fischer, D. L. , Hinarejos, S. , Lewis, G. , Nigro, D. , Olmstead, A. , Overmyer, J. , Potter, D. A. , Raine, N. E. , Stanley‐Stahr, C. , Thompson, H. , & van der Steen, J. (2016). Initial recommendations for higher‐tier risk assessment protocols for bumble bees, Bombus spp. (Hymenoptera: Apidae), Integrated Environmental Assessment and Management 12(2), 222–229. [DOI] [PubMed] [Google Scholar]
- Cameron, S. A. , Lozier, J. D. , Strange, J. P. , Koch, J. B. , Cordes, N. , Solter, L. F. , & Griswold, T. L. (2011). Patterns of widespread decline in North American bumble bees. Proceedings of the National Academy of Sciences, 108(2), 662–667. 10.1073/pnas.1014743108 [DOI] [PMC free article] [PubMed]
- Candolfi, M. P. , Bargen, H. , Bocksch, S. , Klein, O. , Kleinhenz, M. , Knaebe, S. , & Szczesniak, B. (2018). Which endpoints can be reliably assessed in semi‐field pollinator species testing without estimating false positive or false negative? MDDs and replicates issue. Journal of Agricultural Science and Technology, 8, 142–161. [Google Scholar]
- CEB . (2011). Methode n° 230: Method for the evaluation of side‐effects of plant protection products on honey bees (Apis mellifera L.) (p. 43). Association Française de Protection des Plantes.
- Environment Canada . (2005). Guidance document on statistical methods (EPS l/RM/46).
- Europe and Mediterranean Plant Protection Organization . (2010). Efficacy evaluation of plant protection products—Side effects on honeybees. OEPP/EPPO PP 1/170 (4). EPPO Bulletin, 40, 313–319.
- European Food Safety Authority . (2013). Guidance on the risk assessment of plant protection products on bees (Apis mellifera, Bombus spp. and solitary bees). EFSA Journal, 11(7), 3295. [DOI] [PMC free article] [PubMed] [Google Scholar]
- Goulson, D. , Lye, G. C. , & Darvill, B. (2008). Decline and conservation of bumble bees. Annual Review of Entomology, 53, 191–208. https://www.annualreviews.org/doi/abs/10.1146/annurev.ento.53.103106.093454 [DOI] [PubMed] [Google Scholar]
- Gradish, A. E. , Cutler, G. C. , Frewin, A. J. , & Scott‐Dupree, C. D. (2016). Comparison of buckwheat, red clover, and purple tansy as potential surrogate plants for use in semi‐field pesticide risk assessment with Bombus impatiens . PeerJ, 4: e2228. 10.7717/peerj.2228 [DOI] [PMC free article] [PubMed] [Google Scholar]
- Gretenkord, C. (1997). Laborzucht der Dunklen Erdhummel Bombus terrestris und toxikologische Untersuchungen unter Labor‐ und Halbfreilandversuchen [Doctoral Dissertation, Rheinischen Friedrich‐Wilhelms‐Universität Bonn, Germany].
- Gretenkord, C. , & Drescher, W. (1996, September 17–19). Laboratory and cage test methods for the evaluation of the effects of insect growth regulators (Insegar, Dimilin) on the brood of B. Terrestris (Appendix 29). In Proceedings of the 6th International Symposium on the hazards of pesticides to bees, Braunschweig, Germany.
- Nieto, A. , Roberts, S. P. M. , Kemp, J. , Rasmont, P. , Kuhlmann, M. , Criado, M. C. , Biesmeijer, J. C. , Bogusch, P. , Dathe, H. H , De La Rúa, P. , De Meulemeester, T. , Dehon, M. , Dewulf, A. , Ortiz‐Sánchez, F. J. , Lhomme, P. , Pauly, A. , Potts, S. G. , Praz, C. , Quaranta, M. , … Michez, D. (2014). European red list of bees (p. 84). Publication Office of the European Union. [Google Scholar]
- Organisation for Economic Co‐operation and Development . (2007). Guidance document on the honey bee (Apis mellifera L.) brood test under semi‐field conditions (OECD Series on Testing and Assessment, No. 75). OECD Publishing. https://www.oecd.org/env/guidance-document-on-the-honey-bee-apis-mellifera-l-brood-test-under-semi-field-conditions-9789264085510-en.htm
- Organisation for Economic Co‐operation and Development . (2017a). Test No. 246: Bumblebee, acute contact toxicity test (OECD Guidelines for the Testing of Chemicals, Section 2). OECD Publishing. 10.1787/9789264284104-en [DOI]
- Organisation for Economic Co‐operation and Development . (2017b). Test No. 247: Bumblebee, acute oral toxicity test (OECD Guidelines for the Testing of Chemicals, Section 2). OECD Publishing. 10.1787/9789264284128-en [DOI]
- Potts, S. G. , Biesmeijer, J. C. , Kremen, C. , Neumann, P. , Schweiger, O. , & Kunin, W. E. (2010). Global pollinator declines: Trends, impacts and drivers. Trends in Ecology & Evolution, 25(6), 345–353. [DOI] [PubMed] [Google Scholar]
- Potts, S. G. , Imperatriz‐Fonseca, V. L. , & Ngo, H. T. (2016). The assessment report of the Intergovernmental Science‐Policy Platform on Biodiversity and Ecosystem Services on pollinators, pollination and food production (552pp.). IPBES, Secretariat of the Intergovernmental Science‐Policy Platform on Biodiversity and Ecosystem Services.
- Rasmont, P. , & Mersch, P. (1988). Première estimation de la dérive faunique chez les bourdons de la Belgique (Hymenoptera: Apidae). Annales de la Société Royale Zoologique de Belgique, 118(2), 141–147. [Google Scholar]
- SAS Institute . (2002. –2010). SAS ® Proprietary software 9.3.
- Schaefer, H. , & Mühlen, W. (1996). Erste Erfahrungen zur Freilandprüfung von Alsystin mit der Erdhummel (Bombus terrestris L). Apidologie, 27(4), 273–275. [Google Scholar]
- Sechser, B. , & Reber, B. (1998). Using a sequential testing scheme under laboratory and field conditions with the bumble bee Bombus terrestris to evaluate the safety of different groups of insecticides. In Haskell P. T. & McEwen P. (Eds.), Ecotoxicology, (pp. 166–174). 10.1007/978-1-4615-5791-3_17 [DOI]
- Scott‐Dupree, C. , Gradish, A. E. , Celetti, T. , & Cutler, C. (2018). Including Bombus impatiens in the mix: Developing semi‐field pesticide risk assessment methodology for the North American surrogate bumble bee. In Oomen P. A. & Pistorius J. (Eds.), 2018. Hazards of pesticides to bees—13th International Symposium of the ICP‐PR Bee Protection Group, Valencia (Spain), October 18–20, 2017. Julius‐Kuehn‐Archiv, 462, 153–157.
- Sterk, G. , Peters, B. , Gao, Z. , & Zumkier, U. (2016). Large‐scale monitoring of effects of clothianidin‐dressed OSR seeds on pollinating insects in Northern Germany: Effects on large earth bumble bees (Bombus terrestris). Ecotoxicology, 25(9), 1666–1678. [DOI] [PMC free article] [PubMed] [Google Scholar]
- Tasei, J. N. (2001). Effects of insect growth regulators on honey bees and non‐Apis bees. A review. Apidologie, 32(6), 527–545. [Google Scholar]
- Tasei, J. N. (2002). Impact of agrochemicals on non‐Apis bees. In Devillers J. & Pham‐Delegue M.‐H. (Eds.), Honey bees: Estimating the environmental impact of chemicals (pp. 101–131). Taylor & Francis.
- Tasei, J. N. , Carré, S. , Grondeau, C. , & Hureau, J. M. (1987). Effets d'applications insecticides a l'egard d'apoides pollinisateurs autres que l'abeille domestique (Megachile rotundata F. et Bombus terrestris L.). Conference Internationale sur les Ravageurs en Agriculture, 1(6), 127–136. [Google Scholar]
- Tasei, J. N. , Sabik, H. , Pirastru, L. , Langiu, E. , Blanche, J. M. , Fournier, J. , & Taglioni, J. P. (1993, October 25–28). A sequential study on the effects of deltamethrin (Decis CE) on bumble bees. Proceedings of the 5th International Symposium on the hazards of pesticides to bees, Wageningen, the Netherlands, (pp. 155–160).
- Tasei, J. N. , Sabik, H. , Pirastru, L. , Langiu, E. , Blanche, J. M. , Fournier, J. , & Taglioni, J. P. (1994). Effects of sublethal doses of deltamethrin (Decis Ce) on Bombus terrestris . Journal of Apicultural Research, 33(3), 129–135. [Google Scholar]
- Uhl, P. , Franke, L. A. , Rehberg, C. , Wollmann, C. , Stahlschmidt, P. , Jeker, L. , & Brühl, C. A. (2016). Interspecific sensitivity of bees towards dimethoate and implications for environmental risk assessment. Scientific Reports, 6(1), 1–7. 10.1038/srep34439 [DOI] [PMC free article] [PubMed] [Google Scholar]
- van der Steen, J. M. (2001). Review of the methods to determine the hazard and toxicity of pesticides to bumblebees. Apidologie, 32(5), 399–406. 10.1051/apido:2001139 [DOI] [Google Scholar]
Associated Data
This section collects any data citations, data availability statements, or supplementary materials included in this article.
Supplementary Materials
This article includes online‐only Supporting Information.
Supporting information.
Supporting information.
Supporting information.
Supporting information.
Supporting information.
Data Availability Statement
Data, associated metadata, and calculation tools are available in the Supporting Information.