

Abstract
Natural populations are characterized by abundant genetic diversity driven by a range of different types of mutation. The tractability of sequencing complete genomes has allowed new insights into the variable composition of genomes, summarized as a species pan‐genome. These analyses demonstrate that many genes are absent from the first reference genomes, whose analysis dominated the initial years of the genomic era. Our field now turns towards understanding the functional consequence of these highly variable genomes. Here, we analysed weighted gene coexpression networks from leaf transcriptome data for drought response in the purple false brome Brachypodium distachyon and the differential expression of genes putatively involved in adaptation to this stressor. We specifically asked whether genes with variable “occupancy” in the pan‐genome – genes which are either present in all studied genotypes or missing in some genotypes – show different distributions among coexpression modules. Coexpression analysis united genes expressed in drought‐stressed plants into nine modules covering 72 hub genes (87 hub isoforms), and genes expressed under controlled water conditions into 13 modules, covering 190 hub genes (251 hub isoforms). We find that low occupancy pan‐genes are under‐represented among several modules, while other modules are over‐enriched for low‐occupancy pan‐genes. We also provide new insight into the regulation of drought response in B. distachyon, specifically identifying one module with an apparent role in primary metabolism that is strongly responsive to drought. Our work shows the power of integrating pan‐genomic analysis with transcriptomic data using factorial experiments to understand the functional genomics of environmental response.
Keywords: genomics/proteomics, molecular evolution, phenotypic plasticity, transcriptomics
1. INTRODUCTION
Soil water availability is a critical factor determining plant growth, development, and reproduction (Bohnert et al., 1995). Plants are able to cope with and acclimate to a range of soil water contents through the reprogramming of their physiology, growth, and development over time scales ranging from hours to seasons (Chaves et al., 2003). Many of these acclimation strategies arise from altered transcriptional profiles (Fisher et al., 2016; Miao et al., 2017). Drought‐responsive gene regulatory pathways have been investigated extensively in model plant systems such as Arabidopsis thaliana, maize, and rice (Borah et al., 2017; Hayano‐Kanashiro et al., 2009; Janiak et al., 2015; Nakashima et al., 2009, 2014). A clear emerging theme, however, is that diverse species and varieties of plants exhibit diverse stress response mechanisms (Des Marais et al., 2012; Juenger, 2013; Pinheiro & Chaves, 2011), often controlled by complex regulatory networks. Understanding the genetic control of this phenotypic diversity is a priority for understanding the response of natural populations to climate change, and for designing resilient crop species (Benfey & Mitchell‐Olds, 2008).
Recent studies have brought attention to the remarkable variation in gene content among plant populations (Alonge et al., 2020; Gao et al., 2019; Gordon et al., 2017; Haberer et al., 2020), reflected in a species' pan‐genome. A pan‐genome refers to the genomic content of a species as a whole, rather than the composition of a single, reference, individual genotype (Koonin & Wolf, 2008). In practice, pan‐genomes are estimated by deeply resequencing the genomes of a diversity panel of genotypes, often using a reference genome to aid in final assembly and annotation (Lei et al., 2021). In the diploid model grass Brachypodium distachyon, genomic analysis of 56 inbred natural “accessions” revealed that the total pan‐genome of the species comprised nearly twice the number of genes in any single accession (Gordon et al., 2017). Remarkably, only 73% of genes in a given accession are found in at least 95% of the other accessions (Gordon et al., 2017) – so‐called “core genes” (universal or nearly universal genes; Koonin & Wolf, 2008) and “soft‐core genes” (found in at least 95% of accessions; Kaas et al., 2012) – suggesting that a large number of genes are unique to subsets of accessions or even to individual accessions. The list of core genes in B. distachyon is enriched for annotations associated with essential cellular processes such as primary metabolism. Lower‐occupancy genes, or “shell genes,” are found in 5%–94% of accessions and their annotations are enriched for many processes related to environmental response, including disease resistance. Similar patterns have been observed in the pan‐genomes of Arabidopsis thaliana, barley, sunflower, and an ever‐growing number of additional plant species (Bayer et al., 2020; Contreras‐Moreira et al., 2017; Hübner et al., 2019). The DNA sequences of core genes bear the hallmark of strong purifying selection and are typically expressed at a higher level and in more tissues as compared to shell genes. Shell genes may be the result of gene duplications or deletions in the ancestor of a subset of studied genotypes and, indeed, the vast majority of shell genes in B. distachyon appear to be functional, as homologues are found in other species' genomes (Gordon et al., 2017).
The preceding observations raise the intriguing possibility that shell genes may represent segregating variation that could be shaped by natural selection and thereby facilitate local adaptation or adaptive responses to a variable environment. Multiple studies in Arabidopsis thaliana demonstrate the role of segregating functional gene copies – effectively large‐effect mutations – in shaping whole‐plant response to the abiotic environment (Monroe et al., 2016, 2018). The phenotypic effect size of a mutation can determine the likelihood that the mutant will become fixed in a population, with large‐effect mutations more likely than not to confer deleterious phenotypes that may be removed from populations by natural selection (Fisher, 1930). The observation that any two accessions of B. distachyon probably differ in the presence or absence of hundreds of functional gene copies begs the question as to how potentially function‐changing gene deletions escape the purging effects of purifying selection. Pan‐genomics requires that we reconceptualize how we interpret “gene loss” as we move beyond a reference‐genome view of genome function. Genes identified as “missing” from a subset of accessions might represent deletions of genes whose function was no longer constrained by purifying selection in some novel environment, duplicated genes that originated in a subset of accessions and thus are absent in other accessions, or paralogs that were both present in a common ancestor and then reciprocally lost in subsets of accessions.
The pleiotropic effect of a mutation can be affected by the number of genes with which it interacts (Jeong et al., 2001); if a gene has relatively few interacting partners then its presence or absence in a particular accession may have a small fitness effect and thus be maintained in populations. Similarly, the efficacy of selection to purge deleterious alleles may be reduced if a gene is only expressed in a subset of environments experienced by a species (Paaby & Rockman, 2014). In the context of pan‐genomes, we consider gene presence/absence polymorphisms as mutations, and we explore functional gene turnover by testing the hypothesis that shell genes and core genes differ in their topological positions in environmentally responsive gene coexpression networks.
Gene coexpression networks are widely used to interpret functional genomic data by assessing patterns of correlation among genes via a threshold that assigns a connection weight to each gene pair (Langfelder & Horvath, 2008; Zhang & Horvath, 2005). Sets of genes with similar expression profiles are assigned to modules by applying graph clustering algorithms (Mao et al., 2009). Genes, or “nodes,” in such networks show considerable variation in the extent to which their expression covaries with other genes. As such, coexpression networks are generally considered “scale‐free” in the sense that few nodes have many neighbouring nodes while many nodes have few neighbouring nodes (Guelzim et al., 2002). Modules are often comprised of genes with similar functions (Stuart et al., 2003; Wolfe et al., 2005). High connectivity “hub” genes that show a large number of interactions with other genes within a weighted coexpression network are candidates for key players in regulating cellular processes (Albert et al., 2000; Carlson et al., 2006; Dong & Horvath, 2007). As such, hub genes might be expected to encode essential cellular functions and thus show pleiotropic effects when mutated or deleted. By contrast, genes with fewer close coexpression relationships are often situated on the periphery of networks and might, therefore, exhibit fewer pleiotropic effects when missing or mutated (Des Marais, Guerrero, et al., 2017; Masalia et al., 2017; Porth et al., 2014). In this context, we hypothesize that pan‐genome core genes may be over‐represented among coexpression network “hub‐genes,” as both appear to be involved in core cellular processes and may therefore show deleterious effects when deleted. Conversely, we hypothesize that pan‐genome “shell genes” – whose patterns of expression and thereby phenotypic effects are more restricted and condition‐specific – will be enriched among lowly connected (nonhub) genes in gene coexpression networks.
Here, we study the relationship between a plant's pan‐genome and its gene coexpression networks using Brachypodium distachyon. Brachypodium is a small genus of the subfamily Pooideae (Poaceae) that contains ~20 species distributed worldwide (Catalán et al., 2016; Hasterok et al., 2022; Scholthof et al., 2018). The annual diploid species B. distachyon is a model for temperate cereals and biofuel grasses (Catalán et al., 2014; Mur et al., 2011; Scholthof et al., 2018; Vogel et al., 2010); a reference genome for one B. distachyon accession, Bd21 (IBI, 2010) is now complemented by 54 deeply resequenced natural accessions (Gordon et al., 2017). Recent studies demonstrate the utility of B. distachyon and its close congeners for elucidating the evolution and ecology of plant‐abiotic interactions, focusing especially on responses to soil drying, aridity, and water use strategy (Des Marais & Juenger, 2016; Des Marais, Lasky, et al., 2017; Fisher et al., 2016; Handakumbura et al., 2019; Manzaneda et al., 2012, 2015; Martínez et al., 2018; Monroe et al., 2021; Skalska et al., 2020; Verelst et al., 2013). In the present study, we first identify and characterize gene coexpression modules associated with response to soil drying. We then test the hypothesis that the occupancy of pan‐genes – whether they are part of the shell or core gene sets of the pan‐genome – is associated with their connectivity in the B. distachyon gene coexpression network. Our study demonstrates the dynamic nature of plant genomes and sets up future work on the functional consequences of diversity on the evolution of gene regulatory networks.
2. MATERIALS AND METHODS
2.1. Plant material, experimental design, total‐RNA extraction and 3′ cDNA tag libraries preparation
Sampling herein follows our earlier work documenting physiological and developmental response of 33 diploid natural accessions of Brachypodium distachyon (L.) P. Beauv. to soil drying (Figure 1; Table S1; Des Marais, Lasky, et al., 2017). The sampled accessions were inbred for more than five generations (Filiz et al., 2009; Vogel et al., 2006, 2009) and represent the geographic and ecological diversity of B. distachyon across the Mediterranean region. Whole genome resequencing data is available for all studied accessions (Gordon et al., 2017).
FIGURE 1.
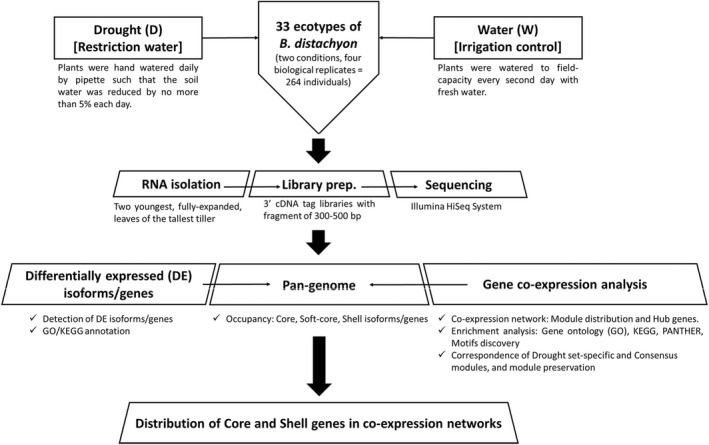
Summary of the experimental design and analyses performed in the 33 accessions of the model grass Brachypodium distachyon under drought (D) and water (control) (W) conditions.
A total of 264 individual plants from the 33 accessions were grown under two greenhouse conditions, restriction of water (drought, D) and well‐watered (water, W). We sampled four biological replicates per treatment and accession combinations (33 accessions x 4 replicates x 2 treatments [D and W]). For a full description of the growth and treatment conditions, please see Des Marais, Lasky, et al. (2017). In short, seeds were stratified at 6°C for 14 days and then greenhouse‐grown in 600 ml of Profile porous ceramic rooting media (Profile Products) in Deepot D40H pots (650 ml; Stuewe & Sons). For the first 21 days of growth, all plants were watered to field capacity every other day. Daytime high temperatures ranged from 23°C to 28°C and night‐time lows from 14°C to 18°C. On day 21 four treatment regimes were implemented: Cool Wet, Cool Drought, Hot Wet, and Hot Drought, with Drought and Wet plants spatially randomized within single blocks of Hot or Cool conditions. The hot treatment raised air temperatures in the plant canopies by ~10°C. Because temperature was confounded with experimental block in the design used for the current study, we did not include a temperature effect in any of the statistical models used herein. Well‐watered plants (hereafter “Water”) were watered to field‐capacity every second day with fresh water, whereas drought plants (hereafter “Drought”) were hand‐watered daily by pipette such that the soil water was reduced by 5% each day. The final soil water content of drought plants on day 11 of treatment – 32 days post‐germination – was 45% field capacity, which corresponds to a decrease in water potential of 1.2 MPa as compared to field capacity in this growth media (Des Marais et al., 2012).
For each plant, the two youngest, fully expanded leaves of the tallest tiller were excised with a razor blade at the base of the lamina and flash‐frozen on liquid nitrogen. Tissue was ground to a fine powder under liquid nitrogen using a Mixer Mill MM 300 (Retsch GmbH). RNA was extracted using the Sigma Spectrum Total Plant RNA kit, including on‐column DNase treatment, following the manufacturer's protocol, and quantified using a NanoDrop spectrophotometer (Thermo Scientific). We used a RNA‐Seq library protocol (3′ cDNA tag libraries with fragment of 300–500 bp) for sequencing on the Illumina HiSeq platform adapted from Meyer et al. (2011). This Tag‐Seq method yields only one sequence per expressed transcript in the RNA pool, allowing for higher sequencing coverage per gene as a function of total sequencing effort (Tandonnet & Torres, 2017).
2.2. Preprocessing of sequences, quantifying transcript abundances, normalizing procedures, and controlling batch effects
Sequencing was carried out using an illumina HiSeq2500 platform (100 bp Single‐End, SE, sequencing). Quality control of SE reads was performed with fastqc software. Adapters and low quality reads were removed and filtered with trimmomatic‐0.32 (Bolger et al., 2014). Total numbers of raw and filtered SE reads for each accession and treatment are shown in Table S2. Quantifying the abundances of transcripts from RNA‐Seq data was done with kallisto version 0.43.1 (Bray et al., 2016). To accommodate the library preparation and sequencing protocols (3′ tag from fragments of 300–500 bp), pseudoalignments of RNA‐Seq data were carried out using as references 500 bp from the 3′ tails of the B. distachyon_314_version 3.1 transcriptome (IBI, 2010; https://phytozome.jgi.doe.gov/pz/portal.html#!info?alias=Org_Bdistachyon). We applied estimated average fragment lengths of 100 bp and standard deviations of fragment length of 20. Resulting numbers of transcripts per million (TPM) were recorded.
Exploratory analysis of the data set and the subsequent filtering and normalization of transcripts abundance between samples, and the in silico technical replicate steps (bootstrap values computed with kallisto), were conducted with the Sleuth package (Pimentel et al., 2017). A total of 16,386 targets (transcripts/isoforms) were recovered after the normalizing and filtering step using Sleuth. This program was also used for batch‐correction of data and of differentially expressed (DE) genes. To account for library preparation batch effects, date of library preparation was included as a covariate with condition variable in the full model (Table S2).
2.3. Coexpression network analysis of normalized transcripts abundance
Coexpression networks for the Drought and Water (control) data sets were carried out using the transcripts per million (TPM) estimates and the R package wgcna (Langfelder & Horvath, 2008). We analysed 16,386 transcripts that were filtered and normalized for 127 Drought and 124 Water individual samples (individual plants). After the removal of putative outliers, we retained 121 Drought and 108 Water samples that were used for network construction.
Identical parameters were used for the Drought and the Water data sets to construct their respective coexpression networks. The BlockwiseModules function was used to perform automatic network construction and module detection on the large expression data set of transcripts. Parameters for coexpression network construction were fitted checking different values. We chose the Pearson's correlation and unsigned network type, soft thresholding power 6 (high scale free, R 2 > .85), a minimum module size of 30, and a medium sensitivity (deepSplit = 2) for the cluster splitting. The topological overlap matrix (TOM) was generated using the TOMtype unsigned approach. Module clustering was performed with function cutreeDynamic and the partitioning around medoids (PAM) option activated. Module merging was conducted with mergeCutHeight set to 0.30. Kdiff was calculated using wgcna to estimate the relationship between connectivity among genes within vs between coexpression modules.
Both isoform and gene counts were calculated. Isoform counts included all transcripts identified (e.g., Bradi1g1234.1; Bradi1g1234.2; Bradi1g1234.3) and gene counts only included different genes expressed, thus different isoforms from the same gene were reduced to a single gene count in each case (e.g., Bradi1g12345.1 and Bradi1g12345.2 are two isoforms of one gene, Bradi1g12345).
2.4. Detection of highly connected nodes (hub genes/ isoforms) within coexpression networks
Three representative descriptors of modules, module eigengene (ME), intramodular connectivity (kIM), and eigengene‐based connectivity (kME; or its equivalent module membership, MM) were calculated using the wgcna package. Briefly, ME is defined as the first principal component of a given module and is often considered to represent the gene expression profiles within the module. kIM measures how connected, or coexpressed, a given gene is with respect to the genes of a particular module. Thus, intramodular connectivity is also the connectivity in the subnetwork defined by the module. MM is the correlation of gene expression profile with the module eigengene (ME) of a given module. MM values close to 1 or −1 indicate genes highly connected to the module. The sign of MM indicates a positive or a negative relationship between a gene and the eigengene of the module (Langfelder & Horvath, 2010). Genes with absolute MM value over 0.9 were considered “hub genes.” Correlations between MM values transformed by a power of β = 6 and kIM values were also calculated.
2.5. Pan‐genome occupancy of clustered, hub, and differentially expressed genes across accessions
Because the B. distachyon accessions studied herein comprise a subset of those included in the original pan‐genome (Gordon et al., 2017), we reran the clustering procedures used in our earlier analysis with only the 33 accessions used here. We clustered CDS sequences from the annotated genomes of each of the studied accessions to define core, soft‐core, and shell genes with the software get_homologues‐est v03012018 (Contreras‐Moreira et al., 2017) using the OMCL algorithm (−M) and a stringent percent‐sequence identity threshold (–S 98). The resulting pan‐genome matrix was interrogated to identify “core” genes observed in all 33 accessions, “soft‐core” genes observed in 32 and 31, and “shell” genes observed in 30 or fewer accessions. Occupancy was defined as the number of accessions that contain a particular gene model. We tested whether each module showed an excess or deficit of shell genes as compared to genome averages of pan‐gene occupancy using a Fisher's exact test, as implemented in the R programming language (R Core Team, 2022).
2.6. Enrichment and GO/KEGG annotation of clustered genes
Gene ontology (GO) and the Kyoto Encyclopedia of Genes and Genomes (KEGG) annotations for the B. distachyon 314 (Bd21 acccession) version 3.1 reference genome were retrieved (http://phytozome.jgi.doe.gov/; IBI, 2010). Gene lists were tested for functional enrichments with the PANTHER (Protein ANalysis THrough Evolutionary Relationships) overrepresentation test (http://www.pantherdb.org). The original B. distachyon 314 (Bd21 accession) version 3.1 gene ids were converted to version 3.0 with help from Ensembl Plants (Howe et al., 2020) to match those in PANTHER version 16.0 (Mi et al., 2021). Tests were conducted on all genes and on both conditions ‐‐ Drought and Water ‐‐ applying the Fisher's exact test with false discovery rate (FDR) multiple test correction. This analysis was applied on different data sets: all genes, and pan‐genome core, soft‐core, and shell genes for each coexpressed module.
2.7. Drought versus watered modular structure preservation and comparison between consensus and set‐specific modules
Permutation tests were performed to check for preservation of the module topology in the Drought (discovery data) and the Water (test data) networks using both the approach of Langfelder et al. (2011) as well as the modulePreservation function of the netrep (Ritchie et al., 2016) R package with null = “all” (include all nodes) option for RNA‐Seq data. All netrep test statistics (module coherence, average node contribution, concordance of node contributions, density of correlation structure, concordance of correlation structure, average edge weight, and concordance of weighted degree) were evaluated through permutation analysis; therefore, a module was considered preserved if all the statistics had a permutation test p‐value <.01. Searching for modules that could play a role in drought response, we focused on Drought modules that were unpreserved in the Water network (p‐value >.01) in at least one of the seven statistics presented in Ritchie et al. (2016)). The Consensus modules (Cons) and the respective relationships between Consensus and Drought (D) and Water (W) modules were performed as described in Langfelder and Horvath (2008).
2.8. Annotations of upstream DNA motifs in the coexpression modules
Genes assigned to modules in the Drought and Water networks were further analysed with the objective of discovering DNA motifs putatively involved in their expression in each module. Motif analysis was carried out using a protocol based on rsat::Plants (Ksouri et al., 2021). This approach allowed us to discover DNA motifs enriched in the promoter regions of coexpressed genes and to match them to curated signatures of experimentally described transcription factors. First, −500 bp (upstream) to +200 bp (downstream) sequences around the transcription start sites of the genes detected in each module and 50 random negative controls from other gene promoter regions of equal size were extracted from the B. distachyon Bd21 version 3.0 (Ensembl Plants version 46) reference genome. Then, the peak‐motifs (Thomas‐Chollier et al., 2012) option was used to discover enriched motifs applying a second order Markov genomic model, and GO enrichment was computed for them. The analyses generated a report with links to similar curated motifs in the database footprintDB as scored with normalized correlation (Ncor; Sebastian & Contreras‐Moreira, 2014). For each module a highly supported DNA motif was selected according to Ncor, e‐value, and the number of sites (i.e., putative cis‐regulatory elements, CREs) used to compile the motif. The matrix‐scan tool (Turatsinze et al., 2008), with a weight threshold set to 70% of the motif length (60% for the small module D8), was used to scan the discovered motifs and to identify individual genes within each module harbouring putative CREs.
All the protein sequences predicted for each coexpression module were analysed using iTAK (Plant Transcription factor & Protein Kinase Identifier and Classifier) online (version 1.6) (Zheng et al., 2016) to annotate their respective transcription factors, transcriptional regulators and related protein kinases (classification system by Lehti‐Shiu & Shiu, 2012).
2.9. Differentially expressed (DE) isoforms/genes
In order to determine how many isoforms and genes were differentially expressed between the two treatments (D vs. W), the two data sets were analysed through the sleuth_result function (Pimentel et al., 2017). This function computes likelihood ratio tests (LRT) for null (no treatment effect) and alternative (treatment effect) hypotheses, attending to the full and reduced fitted models. A significant q‐value ≤1E‐6 threshold was fixed to detect DE isoforms. The 50 most differentially expressed genes (25 upregulated and 25 downregulated) were classified based on fold‐change of the average TPM values between the drought and water treatments.
3. RESULTS
Our RNA‐Seq data set comprised 121 Drought and 108 Water samples, obtained from 33 inbred accessions of B. distachyon (Figure 1). After the filtering and quality control steps, we identified 16,386 transcripts in our analyses comprising 4941 isoforms of 3789 differentially expressed (DE) genes between the water and drought treatments (Files S1 and S2). Of these genes, 2808 were upregulated (3591 isoforms) and 980 downregulated (1350 isoforms) in D versus W conditions. One gene (Bradi1g09950) showed both upregulated (Bradi1g09950.2) and downregulated (Bradi1g09950.1) isoforms under drought conditions (File S2).
3.1. Modular distribution of genes in the gene coexpression networks
The 33 genetically diverse accessions, along with random experimental variance, provided a wealth of expression variance that was leveraged to estimate major axes of variation – coexpression modules – from the RNA‐Seq data. The modular distribution of genes in the Drought and Water gene coexpression networks showed differences both in the number and the size of the modules (Figures S1 and S2a,b; Tables 1a,b and S3a,b). The Drought coexpression network comprised nine modules (D1–D9) containing a total of 5020 isoforms (min = 38, max = 2477 isoforms per module), corresponding to 4006 genes (min = 27, max = 1986 genes per module). The largest D1 module contained 15.1% of the isoforms (16.1% of the genes) whereas two modules (D2, D3) clustered 4%–6% of the isoforms and genes each and the remaining modules clustered ≤2% of isoforms and genes each (Figure S1a; Table 1a). A total of 11,366 isoforms (69.4%; 8313 genes, 67.4%) were not clustered in any Drought module using our criteria (grey or “zero” D0 module; Figures S1 and S2a; Table 1a). The Water coexpression network showed 13 modules (W1–W13) containing a total of 6711 isoforms (min = 48, max = 1866 isoforms per module), corresponding to 5407 genes (min = 40, max = 1439 genes per module). The largest W1 contained 11.4% of the isoforms (11.6% of the genes) whereas six modules (W2–W7) clustered over >2%–6% of the isoforms and genes and the remaining six modules ≤2% each (Figure S1b; Table 1b). A total of 9675 isoforms (59.0%; 6934 genes, 56.0%) were not clustered in any Water module (grey or “zero” W0 module; Figures S1 and S2b; Table 1b). Hereafter, coexpression modules identified in the Drought RNA‐Seq data set will be labelled with the prefix “D” while those modules identified in the Water (control) data set will have the “W” prefix.
TABLE 1.
Statistics of the number and percentage of isoforms (all and hub isoforms) and genes (all and hub genes), and mean kdiff (the difference between intra‐ and intermodular connectivity) per module for each Drought (a) and Water (b) coexpression networks
| Drought modules | Isoforms (nodes) per module | Genes per module | Mean Kdiff | |||
|---|---|---|---|---|---|---|
| All | hub (KME >0.9) | All | Hub (KME >0.9) | |||
| (a) | ||||||
| D0 | Grey | 11,366 (69.4%) | nd | 8313 (67.4%) | nd | nd |
| D1 | Turquoise | 2477 (15.1%) | 4 (0.16%) | 1986 (16.1%) | 3 (0.15%) | 7.9 |
| D2 | Blue | 979 (6.0%) | 20 (2.04%) | 750 (6.1%) | 13 (1.73%) | 3.7 |
| D3 | Brown | 750 (4.6%) | 41 (5.47%) | 627 (5.1%) | 38 (6.06%) | 10.1 |
| D4 | Yellow | 318 (1.9%) | 4 (1.26%) | 258 (2.1%) | 4 (1.55%) | 3.7 |
| D5 | Green | 214 (1.3%) | 4 (1.87%) | 169 (1.4%) | 3 (1.78%) | 0.8 |
| D6 | Red | 111 (0.7%) | 10 (9.01%) | 95 (0.8%) | 7 (7.37%) | −1.5 |
| D7 | Black | 68 (0.4%) | 4 (5.88%) | 48 (0.4%) | 4 (8.3%) | −0.2 |
| D8 | Pink | 65 (0.4%) | 0 (0%) | 57 (0.5%) | 0 (0%) | −5.9 |
| D9 | Magenta | 38 (0.2%) | 0 (0%) | 27 (0.2%) | 0 (0%) | −8.8 |
| Total counts | 16,386 | 87 (0.53%) | 12,330 | 72 (0.58%) | ||
| Total unique counts | 16,386 | 87 (0.53%) | 12,137 | 72 (0.59%) | ||
| Total unique counts (excluding grey module) | 5020 | 87 (1.73%) | 4006 | 72 (1.80%) | ||
| Water modules | Isoforms (nodes) Per module | Genes per module | Mean Kdiff | |||
|---|---|---|---|---|---|---|
| All | Hub (KME >0.9) | All | Hub (KME >0.9) | |||
| (b) | ||||||
| W0 | Grey | 9675 (59.0%) | nd | 6934 (56.0%) | nd | nd |
| W1 | Turquoise | 1866 (11.4%) | 149 (7.98%) | 1439 (11.6%) | 115 (7.99%) | 26.8 |
| W2 | Blue | 870 (5.3%) | 4 (0.46%) | 727 (5.9%) | 3 (0.41%) | −3.7 |
| W3 | Brown | 827 (5.0%) | 2 (0.24%) | 696 (5.6%) | 1 (0.14%) | 0.3 |
| W4 | Yellow | 701 (4.3%) | 2 (0.29%) | 590 (4.8%) | 2 (0.34%) | −0.7 |
| W5 | Green | 607 (3.7%) | 12 (1.98%) | 509 (4.1%) | 10 (1.96%) | 3.1 |
| W6 | Red | 435 (2.7%) | 9 (2.07%) | 358 (2.9%) | 8 (2.08%) | 2.1 |
| W7 | Black | 390 (2.4%) | 26 (6.67%) | 313 (2.5%) | 23 (7.35%) | 4.6 |
| W8 | Pink | 288 (1.7%) | 2 (0.69%) | 245 (2.0%) | 2 (0.82%) | −2.2 |
| W9 | Magenta | 282 (1.7%) | 22 (7.80) | 239 (1.9%) | 21 (8.79%) | 5.8 |
| W10 | Purple | 246 (1.5%) | 5 (2.03%) | 185 (1.5%) | 2 (1.08%) | −1.4 |
| W11 | Greenyellow | 89 (0.5%) | 8 (8.99%) | 55 (0.4%) | 1 (1.81%) | −3.1 |
| W12 | Tan | 62 (0.4%) | 1 (1.61%) | 51 (0.4%) | 1 (1.96%) | −0.9 |
| W13 | Salmon | 48 (0.3%) | 9 (18.75%) | 40 (0.3%) | 1 (2.5%) | −1.6 |
| Total counts | 16,386 | 251 (1.53%) | 12,381 | 190 (1.53%) | ||
| Total unique counts | 16,386 | 251 (1.53%) | 12,137 | 190 (1.57%) | ||
| Total unique counts (excluding grey module) | 6711 | 251 (3.74%) | 5407 | 190 (3.51%) | ||
Note: The quantity of total counts of genes in drought and water networks is different because we counted the genes for each module independently. When several isoforms of the same gene were clustered in different modules, the gene was counted multiple times; however, it was counted only once if it clustered in the same module. For example, if D1 has three isoforms (Bradi1g10000.1, Bradi1g10000.2 and Bradi1g10000.3) of the same gene, it was counted only once (Bradi1g10000); when isoforms were found in different modules (e.g., Bradi1g10000.1 in D1, Bradi1g10000.2 in D2, Bradi1g10000.3 in D3), the gene was counted three times.
While the genes comprising coexpression modules probably represent functionally related genes, modules are not discrete entities and many genes within a module are probably coexpressed with genes in other modules. The largest Drought modules showed a positive (D1, D2, D3, D4, and D5) or slightly negative (D6 and D7) mean kdiff, while the smallest modules had more negative values (D8 and D9; Table 1a). Negative kdiff values indicate that connectivity out of the module is higher than intramodular connectivity. Similarly, the Water modules showed positive mean kdiff values in the largest modules (W1, W3, W5, W6, W7, and W9) or slightly negative (W4), with the exception of one large and one intermediate module (W2 and W8), both having negative values similar to those of the smallest modules (Table 1b). High positive linear correlations between MM values and kIM values were recovered in both Drought (Figure S3a) and Water (Figure S3b) networks, thus validating the criterion of high MM (>0.9) for selecting hub genes. Collectively, these results suggest that modules of both Drought and Water networks were statistically well‐supported but also that many of their genes probably share transcriptional activity with genes included in other modules.
3.2. Preservation and correspondence of Drought and Water networks
We tested the hypothesis that some coexpression modules are only observed under one of our two treatment conditions using two approaches. First, a permutation test was performed using netrep (Ritchie et al., 2016) to test for the preservation of module topology in the Drought versus the Water networks, defined as discovery and test data sets, respectively. This test comprises seven topological statistics on each module and condition (drought vs. water), quantifying the replication of the structural relationship between nodes composing each module under the null hypothesis that the module of interest is not preserved. All Drought and Water modules were topologically preserved according to the seven netrep statistics (permutation test p‐values < .01). We further tested for correspondence between Drought (D) and Water (W) set‐specific and Drought‐Water Consensus (Cons) coexpression modules using wgcna (Figures 2a,b). Consensus modules are those shared by two or more networks (Langfelder & Horvath, 2007). We found that several Drought specific modules were comprised of no or very few isoforms included in the Consensus modules (Figure 2a). Thus, the Drought modules D5 (green), D7 (black) and D9 (magenta) did not show a clear correspondence with consensus modules. The seemingly conflicting results between netrep – which detected module preservation between Drought and Water modules – and wgcna – which identified three modules that were not preserved – reflected the different sensitivities of these two approaches to changing coexpression relationships within modules (Gibson, 2016). This suggested that all modules were preserved in a broad sense between treatments, but that nodes within modules D5, D7, and D9 could have slightly different coexpression relationships than those observed in the corresponding modules in the Water treatment. We also found Water specific modules (Figure 2b), W1 (turquoise), W6 (red), W8 (pink), and W12 (tan), that did not overlap with the Consensus modules or overlapped only with the noncoexpressed grey module. W1 and W6 overlapped with the grey consensus module, whereas the smaller modules W8 and W12 did not overlap with any consensus module.
FIGURE 2.
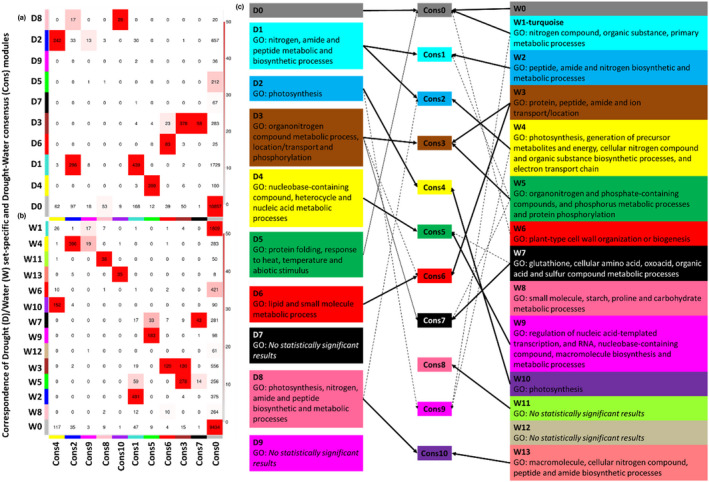
Correspondence (number of nodes) of Drought (D) (a) and Water (W) (b) set‐specific and Drought‐Water consensus (Cons) modules. Each row of the table corresponds to one Drought/Water set‐specific module, and each column corresponds to one consensus module. Numbers in the table indicate node counts in the intersection of the corresponding modules. Colouring of the table encodes − log(p), with p being the Fisher's exact test p‐value for the overlap of the two modules. The stronger the red colour, the more significant the overlap is. (c) Comparison of the gene ontology (GO) enrichments for each D and W module, according to the correlation with the common consensus module.
Seven modules in the Drought network and 11 in the Water network showed a significant GO term enrichment (Table 2a,b; File S3). Both networks shared modules enriched for different biological processes. Potentially equivalent modules between the D and W networks were inferred attending to the common consensus module with which they overlapped (Figure 2a,b) and their GO enrichments (Figure 2c). Thus, the D1 and W2 modules matched Cons1 and were GO‐enriched in nitrogen, amide, and peptide metabolic and biosynthetic processes, D2 and W10 matched Cons4 and were enriched in the photosynthesis, D3 and W3 matched Cons3 and were enriched in processes of transport and locations of compounds, D4 and W9 were enriched in nucleic acid metabolic processes, and D8 and W13 in nitrogen, amide, and peptide biosynthetic and metabolic processes. However, some modules showed enrichment in biological process unique to one or the other coexpression network. For example, D5 is enriched in genes involved in protein folding, response to heat, temperature, and abiotic stimulus, and W6 in genes predicted to be involved in cell wall organization or biogenesis. Collectively, these coexpression analyses suggest that the detected modules represent groups of functionally related genes, and that many functional relationships among genes were conserved in the Water and Drought networks.
TABLE 2.
Summary of the enrichment analysis according to the statistically significant GO biological process for the genes (all, core, soft‐core and shell genes) clustered in the Drought (D) (a) and Water (W) (b) modules applying the statistical overrepresentation test of Panther (http://pantherdb.org/) tool.
| Modules | All genes | Core genes | Soft‐core genes | Shell genes | |
|---|---|---|---|---|---|
| (a) | |||||
| D1 | Turquoise | Nitrogen, amide and peptide metabolic and biosynthetic processes | Nitrogen, amide and peptide metabolic and biosynthetic processes | Nitrogen, amide and peptide metabolic and biosynthetic processes | Photosynthesis, nitrogen, amide and peptide metabolic and biosynthetic processes |
| D2 | Blue | Photosynthesis | Photosynthesis | Photosynthesis | No statistically significant terms |
| D3 | Brown | Organonitrogen compound metabolic process, location/transport and phosphorylation | Organonitrogen compound metabolic process, location/transport and phosphorylation | No statistically significant terms | No statistically significant terms |
| D4 | Yellow | Nucleobase‐containing compound, heterocycle and nucleic acid metabolic processes | No statistically significant terms | No statistically significant terms | No statistically significant terms |
| D5 | Green | Protein folding, response to heat, temperature and abiotic stimulus | Protein folding, response to heat, temperature and abiotic stimulus | Response to heat, temperature, and protein folding | No statistically significant terms |
| D6 | Red | Lipid and small molecule metabolic process | Lipid and small molecule metabolic process | No statistically significant terms | No statistically significant terms |
| D7 | Black | No statistically significant terms | No statistically significant terms | No statistically significant terms | No statistically significant terms |
| D8 | Pink | Photosynthesis, nitrogen, amide and peptide biosynthetic and metabolic processes | No statistically significant terms | No statistically significant terms | Photosynthesis, nitrogen, amide and peptide biosynthetic and metabolic processes |
| D9 | Magenta | No statistically significant terms | No statistically significant terms | No statistically significant terms | No statistically significant terms |
| (b) | |||||
| W1 | Turquoise | Nitrogen compound, organic substance, primary metabolic processes | Nitrogen compound, organic substance, primary metabolic processes | Protein ubiquitination, protein modification by small protein conjugation | No statistically significant terms |
| W2 | Blue | Peptide, amide and nitrogen biosynthetic and metabolic processes | Peptide, amide and nitrogen biosynthetic and metabolic processes | Peptide, amide and nitrogen biosynthetic and metabolic processes | Peptide, amide and nitrogen biosynthetic and metabolic processes |
| W3 | Brown | Protein, peptide, amide and ion transport/location | Protein, peptide, amide and ion transport/location | Protein and ion transport/location | No statistically significant terms |
| W4 | Yellow | Photosynthesis, generation of precursor metabolites and energy, cellular nitrogen compound and organic substance biosynthetic processes, and electron transport chain | Organic substance, primary, nitrogen compound, nucleobase‐containing compound metabolic processes | No statistically significant terms | Photosynthesis, generation of precursor metabolites and energy, cellular nitrogen compound and organic substance biosynthetic processes, and electron transport chain |
| W5 | Green | Organonitrogen and phosphate‐containing compounds, and phosphorus metabolic processes and protein phosphorylation | Organonitrogen and phosphate‐containing compounds, small molecule, protein and phosphorus metabolic processes and protein phosphorylation | No statistically significant terms | No statistically significant terms |
| W6 | Red | Plant‐type cell wall organization or biogenesis | Plant‐type cell wall organization or biogenesis | No statistically significant terms | No statistically significant terms |
| W7 | Black | Glutathione, cellular amino acid, oxoacid, organic acid and sulfur compound metabolic processes |
Glutathione, cellular amino acid, oxoacid, organic acid and sulfur compound metabolic processes |
No statistically significant terms | No statistically significant terms |
| W8 | Pink | Small molecule, starch, proline and carbohydrate metabolic processes | Small molecule, starch, proline and carbohydrate metabolic processes | No statistically significant terms | No statistically significant terms |
| W9 | Magenta | Regulation of nucleic acid‐templated transcription, and RNA, nucleobase‐containing compound, macromolecule biosynthesis and metabolic processes | Cellular protein Modification process, protein dephosphorylation, protein Modification process, macromolecule modification and dephosphorylation | Regulation of nucleic acid‐templated transcription, and RNA, nucleobase‐containing compound, macromolecule biosynthesis and metabolic processes | No statistically significant terms |
| W10 | Purple | Photosynthesis | Photosynthesis | Photosynthesis | No statistically significant terms |
| W11 | Greenyellow | No statistically significant terms | No statistically significant terms | No statistically significant terms | No statistically significant terms |
| W12 | Tan | No statistically significant terms | No statistically significant terms | No statistically significant terms | No statistically significant terms |
| W13 | Salmon | Macromolecule, cellular nitrogen compound, peptide and amide biosynthetic processes | No statistically significant terms | No statistically significant terms | Macromolecule, cellular nitrogen compound, peptide and amide biosynthetic processes |
Note: The biological processes are summarized according to the lowest false discovery rate (FDR) values (see File S3)
3.3. Regulatory motifs of genes in the Drought and Water modules
We detected statistically over‐represented sequence motifs upstream of the gene sequences in several modules. These motifs represent putative cis‐regulatory elements (CREs) located in proximal promoter regions of coexpressed genes in the Drought (Table 3a; Figure S4a) and Water (Table 3b; Figure S4b) networks. A generally low but variable proportion of genes harbouring putative CREs in their proximal promoters was detected in each module. The drought (Table 3a) and water (Table 3b) modules showed between 3.5%–54.2% and 0.1%–23% of genes with the predicted CREs, respectively. Genes in the same module shared a conserved regulatory architecture. For example, calmodulin‐binding CREs were enriched in the D4 (associated with nucleobase‐containing compound, heterocycle and nucleic acid metabolic processes GO terms) and W9 modules (also enriched for nucleobase‐containing compound GO processes, among others). We also observed enriched motifs in treatment‐specific modules: for example the proximal promoters of 27.8% of the genes in module D5 contained CREs similar to those bound by transcription factor B‐3 (Table 3a; Scharf et al., 2012), known to regulate heat shock responses in Arabidopsis thaliana (Bechtold et al., 2013; Guo et al., 2016; Nover et al., 2001).
TABLE 3.
DNA motifs and cis‐regulatory elements (CREs) of coexpressed genes assigned to Drought (D) (a) and Water (W) (b) modules.
| Drought modules | Accession (footprintDB) | Names | consensus | Protein (Swissprot) | Ncor | evalue | sites | Genes with putative CREs in promoter | ||
|---|---|---|---|---|---|---|---|---|---|---|
| Proportion of genes with CREs per module | Total genes with CREs (occupancy of core, soft‐core and shell genes) | |||||||||
| (a) | ||||||||||
| D1 | Turquoise | MA1353.1 (JASPAR 2020), M0609 (AthalianaCistrome v4_May2016) | AT1G72740, AT1G72740.DAP, T04493 | ssmaAAACCCTAGcy | Telomere repeat‐binding factor 5 (MYB transcription factor) | 0.741 | 1.40E‐56 | 225 | 9.0% | 178 [139 [78.1%]; 26 [14(6%]; 13 [7.3%]) |
| D2 | Blue | ABI4 (Athamap 20,091,028) | ABI4 | scCACCaCCCrc | Ethylene‐responsive transcription factor ABI4 (Protein ABSCISIC ACID INSENSITIVE 4) | 0.697 | 5.80E‐07 | 178 | 17.1% | 128([102 [79.7%]; 17 [13.3%]; 9 [7.0%]) |
| D3 | Brown | M1684_1.02 (CISBP 1.02) | T153999_1.02, WRKY60 | gtCGGTCAACgk | Probable WRKY transcription factor 60 (WRKY DNA‐binding protein 60) | 0.877 | 1.30E‐09 | 165 | 11.6% | 73 [54 (74.0%); 13 (17.8%); 6 (8.2%)] |
| D4 | Yellow | MA1197.1 (JASPAR 2020), M0350 (AthalianaCistrome v4_May2016) | CAMTA1, CAMTA1.DAP, T27097 | bgCGACGCGCTks | Calmodulin‐binding transcription activator 1, AtCAMTA1 (Ethylene‐induced calmodulin‐binding protein b, EICBP.b) (Signal‐responsive protein 2, AtSR2) | 0.717 | 7.80E‐18 | 69 | 19.4% | 50 [26 (52.0%); 13 (26.0%); 11 (22.0%)] |
| D5 | Green | M0455 (AthalianaCistrome v4_May2016) | HSFB3.ampDAP, T08630 | kkCTCTrGAAGgk | Heat stress transcription factor B‐3, AtHsfB3 (AtHsf‐05) | 0.691 | 9.10E‐13 | 89 | 27.8% | 47 [36 (76.6%); 5 (10.6%); 6 (12.8%)] |
| D6 | Red | Not found | Not found | Not found | Not found | Not found | Not found | Not found | ‐ | ‐ |
| D7 | Black | AHL25_3 (ArabidopsisPBM 20,140,210) | AHL25 | wcAAAATAAATak | AT‐hook motif nuclear‐localized protein 25 (AT‐hook protein of GA feedback 1) | 0.643 | 0.46 | 35 | 54.2% | 26 [16 (61.6%); 5 (19.2%); 5 (19.2%)] |
| D8 | Pink | MA1274.1 (JASPAR 2020), M0256 (AthalianaCistrome v4_May2016) | OBP3, OBP3.DAP, T16682 | mrArGAATArrrAARrdh | Probable plastid‐lipid‐associated protein 14, chloroplastic, AtPap14 (Fibrillin‐11) (OBP3‐responsive protein 1) | 0.623 | 1.50E‐12 | 14 | 3.5% | 2 |
| D9 | Magenta | Not found | Not found | Not found | Not found | Not found | Not found | Not found | ‐ | ‐ |
| Water modules | Accession (footprintDB) | Names | consensus | Protein (Swissprot) | Ncor | evalue | sites | Genes with putative CREs in promoter | ||
|---|---|---|---|---|---|---|---|---|---|---|
| Proportion of genes with CREs per module | Total genes with CREs [occupancy of core, soft‐core and shell genes] | |||||||||
| (b) | ||||||||||
| W1 | Turquoise | M0587_1.02 (CISBP 1.02) | PK22848.1, T073801_1.02 | wkwcTAAAATTTTAGwww | No results | 0.59 | 6.80E‐29 | 32 | 0.1% | 2 |
| W2 | Blue | At2g20350:M05132:TRANSFAC | At2g20350/M05132/TRANSFAC | mmAGGCCCATCwv | Ethylene‐responsive transcription factor ERF120 | 0.59 | 1.90E‐97 | 244 | 22.3% | 162 [115 (71.0%); 25 (15.4%); 22 (13.6%)] |
| W3 | Brown | Not found | Not found | Not found | Not found | Not found | Not found | Not found | ‐ | ‐ |
| W4 | Yellow | MA1379.1 (JASPAR 2020), M0357 (AthalianaCistrome v4_May2016) | SOL1, SOL1.DAP, T15201 | wwTTAAwwwddAAAwr | Carboxypeptidase SOL1, EC 3.4.17.‐ (Protein SUPPRESSOR OF LLP1 1) | 0.662 | 1.10E‐09 | 458 | 0.3% | 2 |
| W5 | Green | UP00581A_2 (UniPROBE 20,160,601) | vascular plant one zinc finger protein 2, VOZ2 | sgAGTCAACGtcgv | Transcription factor VOZ2 (Protein VASCULAR PLANT ONE‐ZINC FINGER 2, AtVOZ2) | 0.88 | 1.90E‐10 | 126 | 5.7% | 29 (20 (69.0%); 4 [13.8%]; 5 [17.2%]) |
| W6 | Red | M0523 (AthalianaCistrome v4_May2016) | MYB58.DAP, T03869 | ytgCyACCAACCAvm | Transcription factor MYB58 | 0.837 | 1.10E‐11 | 45 | 2.5% | 9 |
| W7 | Black | UP00582A_2 (UniPROBE 20,160,601) | ARABIDOPSIS THALIANA WRKY DNA‐BINDING PROTEIN 18, At4g31800, AtWRKY18, F11C18.16, F28M20.10, WRKY transcription factor 1, WRKY transcription factor 18, WRKY1 | mmsGGTCAAACGyr | WRKY transcription factor 18 | 0.698 | 7.40E‐07 | 27 | 6.1% | 19 (17 [89.5%]; 2 [10.5%]; 0 [0.0%]) |
| W8 | Pink | Not found | Not found | Not found | Not found | Not found | Not found | Not found | ‐ | ‐ |
| W9 | Magenta | MA1197.1 (JASPAR 2020), M0350 (AthalianaCistrome v4_May2016) | CAMTA1, CAMTA1.DAP, T27097 | ssaCCGCGTcss | Calmodulin‐binding transcription activator 1, AtCAMTA1 (Ethylene‐induced calmodulin‐binding protein b, EICBP.b) (Signal‐responsive protein 2, AtSR2) | 0.755 | 4.50E‐19 | 95 | 23.0% | 55 (28 [50.9%]; 12 [21.8%]; 15 [27.3%]) |
| W10 | Purple | Not found | Not found | Not found | Not found | Not found | Not found | Not found | ‐ | ‐ |
| W11 | Green‐yellow | Not found | Not found | Not found | Not found | Not found | Not found | Not found | ‐ | ‐ |
| W12 | Tan | Not found | Not found | Not found | Not found | Not found | Not found | Not found | ‐ | ‐ |
| W13 | Salmon | Not identified | Not identified | trAAATymwwwTTCAht | Not identified | 0.504 | 0.00017 | 35 | 20.0% | 8 |
Note: Modules (numeric and colour codes of the modules); Accession (footprintDB), Names (gene name); Consensus sequence of motif; Protein name (Swissprot); Ncor (normalized correlation score); e‐value; sites (number of sites used to compile the DNA motif); Proportion of genes with CREs per module as detected by matrix‐scan in 500 to +200 bp windows; Total genes with CREs (occupancy of core, soft‐core and shell genes). The dashes indicate that no results were retrieved
Additionally, all of the predicted encoded proteins in each module were analysed to annotate the transcription factors (TF), transcriptional regulators (TR), and kinases (Table S4a,b). For example, TRs annotated in the D5 module – identified above as putatively drought‐specific ‐ are involved in responses to abscisic acid, heat stress, water deprivation and defence, and in zinc, chromatin, and metal ion binding (Table S4a).
3.4. Hub nodes of the Drought and Water networks
Hub nodes were detected in both the Drought (Table 1a) and the Water (Table 1b) networks. A total of 87 (0.53%; 1.73% excluding grey module) hub node isoforms from 72 (0.58%; 1.8% excluding grey module) hub genes were identified in the Drought network, and 251 (1.53%; 3.74% excluding grey module) hub node isoforms from 190 (1.53%; 3.51% excluding grey module) hub genes in the Water network. Roughly, more than twice per‐module fraction of hubs was detected in the Water network (1.53% hub nodes/ 1.53% hub genes; Table 1b) compared to the Drought network (0.53% hub nodes/ 0.58% hub genes; Table 1a).
3.5. Pan‐genome analyses: occupancy of all clustered and hub genes
The studied pan‐genome subset contained 34,310 pan‐genome clusters (hereafter “pan‐genes”) which were classified by the number of accessions with a gene model represented in a given cluster to determine their occupancy. We found 16,057 (46.8%) core gene clusters with at least one member in every accession. We analysed these core genes along with the 5642 (16.4%) clusters from the soft‐core pan‐genome (occupancy in 31 or 32 accessions) to account for gene annotation errors and uncertainty with orthology assignments. In contrast, there were 12,611 (36.8%) shell genes (i.e., observed in fewer than 31 accessions). Of the 34,310 pan‐genes, 15,848 were represented by sequenced RNA tags, after our filtering and normalizing steps. The occupancy of the expressed pan‐genes was 12,137 (76.6%) core, 1869 (11.8%) soft‐core and 1842 (11.6%) shell genes. The discrepancy between the total number of pan‐genes and that of genes represented by RNA‐Seq tags may have been caused by the filtering of lowly expressed genes. Additionally, many genes in the genome or pan‐genome were probably not expressed in leaf tissue at the developmental stage assessed herein. However, our results were consistent with prior studies which found that pan‐genome core genes are frequently more highly expressed (Gao et al., 2019; Gordon et al., 2017; Tao et al., 2021) and therefore more likely to be sampled in RNA‐sequencing libraries (Figure S5).
The distribution of pan‐gene occupancy varied considerably among modules in both Drought and Water networks (Table 4a,b; Figures 3a,b). Most modules in both coexpression networks showed ratios of shell genes consistent with the genome averages (Fisher's exact test; Table 4a,b), with notable exceptions. Among Drought modules, D8 showed a considerable excess of shell genes (63.2%). Conversely, D2 (10.0%) and D3 (11.2%) each show a deficit of shell genes. Water coexpression modules showed considerably more variation in pan‐gene occupancy. Most large modules in the water network showed significant deficits of shell genes, though W4 (27.8%), W9 (21.8%), W11 (25.5%), W12 (27.5%), and W13 (60.0%) had an excess of shell genes relative to the genome averages (note that W11, W12, and W13 were very small modules with fewer than 60 genes each).
TABLE 4.
Occupancies [core (33 accessions); soft‐core (31–32 accessions) and shell (≤30 accessions)] of the coexpressed genes (a, b) and hub genes (c, d) for each module of the Drought (D) and Water (W) coexpression networks
| Drought genes occupancy | |||||
|---|---|---|---|---|---|
| Drought modules | Genes | Core (33) | Soft‐core (32 or 31) | Shell (≤30) | |
| (a) | |||||
| D0 | Gray | 8313 | 5764 (69.3%) | 1269 (15.3%) | 1280 (15.4%) |
| D1 | Turquoise | 1986 | 1422 (71.6%) | 265 (13.3%) | 299 (15.1%) |
| D2 | Blue | 750 | 549 (73.2%) | 126 (16.8%) | 75 (10.0%)*** |
| D3 | Brown | 627 | 440 (70.2%) | 117 (18.7%) | 70 (11.2%)* |
| D4 | Yellow | 258 | 160 (62.0%) | 49 (19.0%) | 49 (19.0%) |
| D5 | Green | 169 | 123 (72.8%) | 27 (16.0%) | 19 (11.2%) |
| D6 | Red | 95 | 62 (65.3%) | 18 (19.0%) | 15 (15.8%) |
| D7 | Black | 48 | 28 (58.3%) | 9 (18.8%) | 11 (22.9%) |
| D8 | Pink | 57 | 17 (29.8%) | 4 (7.0%) | 36 (63.2%)*** |
| D9 | Magenta | 27 | 20 (74.1%) | 6 (22.2%) | 1 (3.7%) |
| Total counts | 12,330 | 8585 (69.6%) | 1890 (15.3%) | 1855 (15.0%) | |
| Total unique counts | 12,137 | 8426 (69.4) | 1869 (15.4%) | 1842 (15.2%) | |
| Total unique counts (excluding grey module) | 4006 | 2813 (70.2%) | 618 (15.4%) | 575 (14.4%) | |
| Water genes occupancy | |||||
|---|---|---|---|---|---|
| Water modules | Genes | Core (33) | Soft‐core (32 or 31) | Shell (≤30) | |
| (b) | |||||
| W0 | Grey | 6934 | 4788 (69.1%) | 1006 (14.5%) | 1140 (16.4%)* |
| W1 | Turquoise | 1439 | 1094 (76.0%) | 188 (13.1%) | 157 (10.9%)*** |
| W2 | Blue | 727 | 544 (74.8%) | 111 (15.3%) | 72 (9.9%)*** |
| W3 | Brown | 696 | 500 (71.8%) | 128 (18.4%) | 68 (9.8%)*** |
| W4 | Yellow | 590 | 353 (59.8%) | 73 (12.4%) | 164 (27.8%)*** |
| W5 | Green | 509 | 375 (73.7%) | 101 (19.8%) | 33 (6.5%)*** |
| W6 | Red | 358 | 258 (72.1%) | 67 (18.7%) | 33 (9.2%)** |
| W7 | Black | 313 | 216 (69.0%) | 59 (18.8%) | 38 (12.1%) |
| W8 | Pink | 245 | 162 (66.1%) | 50 (20.4%) | 33 (13.5%) |
| W9 | Magenta | 239 | 124 (51.9%) | 63 (26.4%) | 52 (21.8%)* |
| W10 | Purple | 185 | 127 (68.6%) | 36 (19.5%) | 22 (11.9%) |
| W11 | Greenyellow | 55 | 33 (60.0%) | 8 (14.5%) | 14 (25.5%) |
| W12 | Tan | 51 | 31 (60.8%) | 6 (11.8%) | 14 (27.5%) |
| W13 | Salmon | 40 | 13 (32.5%) | 3 (7.5%) | 24 (60.0%)*** |
| Total counts | 12,381 | 8618 (69.6%) | 1899 (15.3%) | 1864 (15.1%) | |
| Total unique counts | 12,137 | 8426 (69.4) | 1869 (15.4%) | 1842 (15.2%) | |
| Total unique counts (excluding grey module) | 5407 | 3795 (70.2%) | 890 (16.5%) | 722 (13.3%) | |
| Drought hub genes (KME > 0.9) occupancy | |||||
|---|---|---|---|---|---|
| Drought modules | Hub genes | Core (33) | Soft‐core (32 or 31) | Shell (≤30) | |
| (c) | |||||
| D1 | Turquoise | 3 | 3 (100%) | 0 (0%) | 0 (0%) |
| D2 | Blue | 13 | 10 (76.9%) | 1 (7.7%) | 2 (15.4%) |
| D3 | Brown | 38 | 20 (52.6%) | 18 (47.4%) | 0 (0%) |
| D4 | Yellow | 4 | 3 (75%) | 1 (25%) | 0 (0%) |
| D5 | Green | 3 | 3 (100%) | 0 (0%) | 0 (0%) |
| D6 | Red | 7 | 4 (57.1%) | 3 (42.9%) | 0 (0%) |
| D7 | Black | 4 | 0 (0%) | 0 (0%) | 4 (100%) |
| D8 | Pink | 0 | 0 (0%) | 0 (0%) | 0 (0%) |
| D9 | Magenta | 0 | 0 (0%) | 0 (0%) | 0 (0%) |
| Total counts | 72 | 43 (59.7%) | 23 (31.9%) | 6 (8.3%) | |
| Total unique counts | 72 | 43 (59.7%) | 23 (31.9%) | 6 (8.3%) | |
| Water hub genes (KME >0.9) occupancy | |||||
|---|---|---|---|---|---|
| Water modules | Hub genes | Core (33) | Soft‐core (32 or 31) | Shell (≤30) | |
| (d) | |||||
| W1 | Turquoise | 115 | 82 (71.3%) | 18 (15.7%) | 15 (13.0%) |
| W2 | Blue | 3 | 2 (66.7%) | 1 (33.3%) | 0 (0%) |
| W3 | Brown | 1 | 1 (100%) | 0 (0%) | 0 (0%) |
| W4 | Yellow | 2 | 1 (50%) | 0 (0%) | 1 (50%) |
| W5 | Green | 10 | 6 (60%) | 3 (30%) | 1 (10%) |
| W6 | Red | 8 | 7 (87.5%) | 1 (12.5%) | 0 (0%) |
| W7 | Black | 23 | 16 (69.6%) | 7 (30.4%) | 0 (0%)*** |
| W8 | Pink | 2 | 2 (100%) | 0 (0%) | 0 (0%) |
| W9 | Magenta | 21 | 13 (61.9%) | 1 (4.8%) | 7 (33.3%) |
| W10 | Purple | 2 | 2 (100%) | 0 (0%) | 0 (0%) |
| W11 | Greenyellow | 1 | 1 (100%) | 0 (0%) | 0 (0%) |
| W12 | Tan | 1 | 0 (0%) | 0 (0%) | 1 (100%) |
| W13 | Salmon | 1 | 1 (100%) | 0 (0%) | 0 (0%) |
| Total counts | 190 | 134 (70.5%) | 31 (16.3%) | 25 (13.2%) | |
| Total unique counts | 190 | 134 (70.5%) | 31 (16.3%) | 25 (13.2%) | |
Note: Asterisks indicate significant differences comparing shell and total genes between modules and network by Fisher's exact test (*p ≤ .05; **p ≤ .01; ***p ≤ .001).
FIGURE 3.
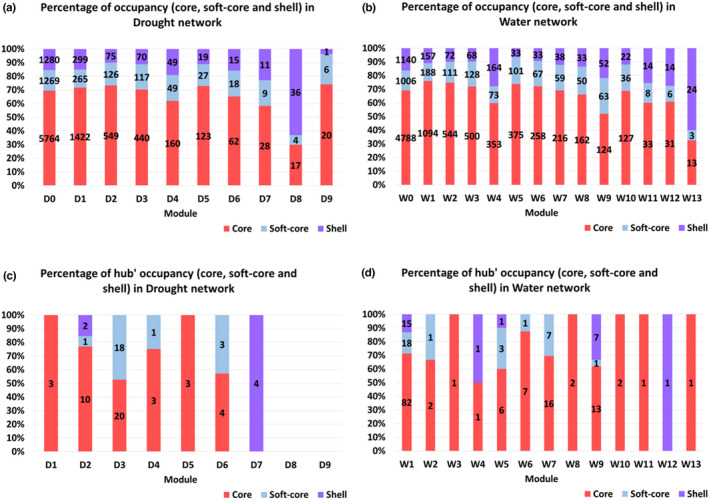
Proportion (%) of occupancies (core [33]; soft‐core[3–32] and shell [≤30]) of the coexpressed genes (a, b) and hub genes (c, d) for each Drought (D) and Water (W) network.
To investigate the proportion of putative hub genes in each module that were members of the shell gene sets, greater departures from genome averages were required to reach statistical significance given the comparatively small number of these genes (Table 4c,d; Figure 3c,d). Among the Drought modules, D8 and D9 did not show hub genes whereas other modules showed a predominance (>80%) of core or soft‐core hub genes with the exception of D7, whose four hub genes were shell genes (Table 4c). Among the Water modules, W9 had a high proportion of shell hub genes (33.3%) as well as W4 and W12 though these were poorly enriched with hub genes, whereas W7 showed a low percentage of hub shell genes. Only the shell genes of module W7 are significantly under‐represented among the hub genes of the Water modules, according to the Fisher test (Table 4d).
As expected, core and soft‐core genes were mostly enriched in the same GO terms as those in their respective complete modules (Table 2a,b). Similarly, shell genes corresponded to genes involved in the same biological process as those included in their complete modules. However, the most significant GO term of the shell genes of D1 was photosynthesis, which was not found to be significant among core genes. Similarly, the shell genes of D8 were enriched in photosynthesis, nitrogen, amide, and peptide biosynthetic and metabolic processes terms, while core gene sets did not show any significant enrichments (Table 2a,b and File S3).
We analysed the pan‐genome occupancy of genes with putative CREs in the modules with at least 10 detected genes. These corresponded predominantly to core genes (>50%) in both networks, whereas 7%–22% of the genes with predicted motifs in the Drought network and 0%–27.3% in the Water network corresponded to shell genes (Table 3a,b).
3.6. Enrichments of differentially expressed genes with a pan‐genomic perspective
Of the differentially expressed genes with upregulated isoforms in the drought condition, 72%, 17.8% and 10% were core, soft‐core, and shell genes, respectively. On the other hand, 67.5%, 20.9% and 11.6% of the genes with downregulated isoforms in the drought condition were core, soft‐core, and shell genes, respectively (Table 5; File S2). A total of 59.3% of DE isoforms (58.7% of DE genes) and 47.4% DE isoforms (44.6% DE genes) of Drought (Table S5a) and Water (Table S5b) networks, respectively, were not assigned to any modules (i.e., they are members of the grey or zero module). Among the hub nodes (isoforms), 64.4% (56/87) and 34.3% (86/251) of them correspond to DE isoforms of the Drought (Table S6a) and Water (Table S6b) networks, respectively.
TABLE 5.
Pan‐genome analysis of the differentially expressed (DE) isoforms according to their gene occupancy: core (33 accessions), soft‐core (31–32 accessions) and shell (≤30 accessions)
| Gene occupancy | ||||
|---|---|---|---|---|
| Core | Soft‐core | Shell | Total | |
| Upregulated | 2027 (72.2%) | 500 (17.8%) | 281 (10%) | 2808 |
| Downregulated | 661 (67.5%) | 205 (20.9%) | 114 (11.6%) | 980 |
| Up/downregulated | 1* | 0 | 0 | 1 |
| Total | 2689 | 705 | 395 | 3789 |
One gene was represented by one upregulated and one downregulated isoform.
Five of the nine Drought coexpression modules had a predominance (>50%) of upregulated DE isoforms except for the large modules D2 and D3 and the small modules D8 and D9 (Table S5a). Similarly, among Water modules, only one large module (W4) and three small modules (W10, W11 and W13) had a predominance of downregulated DE isoforms in the drought condition compared to the water condition (Table S5b).
A total of 21 out of the 25 most strongly upregulated genes did not cluster with other genes in the drought coexpression network (i.e., they were members of the grey D0 module), while the majority of these strongly upregulated genes did cluster in a module in the water network (Table S7). The 25 most strongly upregulated genes by drought showed a range of predicted functions which included two predicted dehydrins (Decena et al., 2021), two ABA‐associated proteins, and two lipid transfer proteins (LTPs; Table S7). LTPs were among the most highly induced transcripts in an Arabidopsis thaliana experiment that imposed very similar soil drying conditions to those imposed in the present study (Des Marais et al., 2012). The 25 most strongly downregulated genes showed markedly different patterns than the most strongly upregulated genes. Most of the genes cluster in D2 and W10, and four of these genes (three clustered in D2 and one in W10) were hub genes (Table S7). Both of these modules were enriched for genes involved in photosynthesis (Table 2a,b) and the annotations for many of these genes suggested associations with the light reactions of photosynthesis.
4. DISCUSSION
Large scale transcriptome data sets have been used to construct coexpression networks for gene and gene regulation discovery in model plant systems and crops (Aoki et al., 2007, 2016; Masalia et al., 2017; Miao et al., 2017). The coexpression network approach allows testing hypotheses on gene functions from their putative regulatory interactions with other functionally known genes classified in the same modules (Mochida et al., 2011), and on links between signalling pathways and phenotypic response to environmental stress (Des Marais et al., 2012). However, the mechanisms of and consequences for genetic diversity in environmentally responsive gene regulatory networks are less often considered (Sun & Dinneny, 2018). Our system‐level approach allowed us to construct a drought‐responsive gene coexpression network from leaf tissue transcriptome profiles of B. distachyon accessions and to identify modules of putatively co‐regulated genes within it. We integrated these network hypotheses with information about gene presence/absence variation as represented in the B. distachyon pan‐genome.
4.1. Regulatory control of Brachypodium response to soil drying
Brachypodium distachyon is an annual species native to seasonally dry environments in the Mediterranean, where it has probably evolved mechanisms to tolerate short‐term soil drying during the growing season as well as unpredictably timed end‐of‐season drought (López‐Álvarez et al., 2015). Several past studies have identified mechanisms of response to soil drying comprising transcriptomic, metabolic, physiological, and developmental plasticity (Bertolini et al., 2013; Chen et al., 2016; Decena et al., 2021; Des Marais et al., 2016; Des Marais, Lasky, et al., 2017; Fisher et al., 2016; Gordon et al., 2014; Handakumbura et al., 2019; Luo et al., 2011; Manzaneda et al., 2015; Priest et al., 2014; Ruíz et al., 2016; Verelst et al., 2013), as well as considerable genetic diversity of response (GxE; Des Marais, Lasky, et al., 2017; Handakumbura et al., 2019). Priest et al. (2014) provided the first transcriptomic assessment of response to drying, exposing the Bd21 accession to a simulated severe drying stress by removing plants from soil to desiccate on a laboratory benchtop. These authors observed a strong transcriptional signature of downregulated photosynthesis, cell division, and cell growth. Subsequent work imposing a more gradual soil drying stress in Bd21 found the opposite pattern, directly observing sustained cell division and transcriptomic patterns of altered primary metabolism, rather than outright downregulation (Verelst et al., 2013). Indeed, studies imposing moderate drying on diverse B. distachyon accessions revealed increased leaf mass per area and greater root biomass in several accessions in response to drying (Des Marais, Lasky, et al., 2017; Handakumbura et al., 2019), both of which require considerable investment of carbohydrates. In the present study we do, however, observe several strongly downregulated genes with annotated functions related to the light reactions of photosynthesis as well as RuBisCO assembly and function (Table S7).
How can we reconcile these transcriptional signatures of reduced photosynthesis with the observation that carbohydrate‐intensive processes like root growth continue under drying? The effects of soil drying on photosynthesis are complex, and the reduction of internal leaf CO2 (ci) caused by stomatal closure can affect the redox status of cells (Pinheiro & Chaves, 2011). As the Calvin Cycle reduces available CO2, it is also a strong sink for energy captured by the photosystems. As this sink is lowered by decreased ci, continued high irradiance can lead to increased expression of photoprotective mechanisms and decreased expression of photochemistry as cells try to protect themselves from excess energy (Demmig‐Adams & Adams, 1996). As a result, studies of soil drying responses often observe decreased activity of the photosystems and increased expression of, for example, photorespiration or other energy sinks (Wingler et al., 1999). While we have no direct measurements of photorespiration or the quantum yield of photosystem II in the current study, our observation of decreased expression of transcripts associated with photosystem proteins is consistent with these mechanisms.
In light of this past evidence for an important role of photosynthesis and primary metabolism in drying response, we focus here on Drought module 5 (D5). D5 showed a low correlation with the Consensus modules (Figure 2a), consistent with the hypothesis that the genes in this module are involved in regulating plant response to drought stress. Its coexpressed genes, both core and soft‐core, are involved in protein folding, response to heat, temperature, and abiotic stimulus (Table 2a). The four DE hub nodes (three genes) of D5 were upregulated in the drought condition compared to the water condition (Table S8) and each of these four hubs is a core gene. Molecular chaperones, especially heat shock proteins (HSPs), were predominantly annotated in both coexpressed and upregulated DE genes (Table S8). Related to the presence of chaperones, the annotated DNA motifs concurred with the GO enrichment of the protein folding and the Heat stress transcription factor B‐3 (Table 3a).
4.2. Topological position of pan‐genes
One key conclusion with respect to the evolution of pan‐genomes and gene regulation arises from our analysis. Namely, the pan‐genes are nonrandomly assorted among coexpression modules in B. distachyon. This observation suggests that the functions conferred by some coexpression modules are probably under stronger purifying selection than those conferred by other modules. These latter modules represent possible regulatory variation on which natural selection may act. Such a prospect was anticipated by Wagner and Altenberg (1996) when they argued that modularity allows for evolutionary tinkering. Our results point towards a role for segregating gene copies in generating this modular variation. This conclusion extends earlier work indicated that low‐occupancy genes tend to be enriched for functional classes of genes putatively involved in local adaptation such as disease resistance and gene regulation (Gordon et al., 2017).
Pleiotropy can have a strong effect on the rate of molecular evolution and on the roles that functional gene variants might play in evolutionary change. Pleiotropy is often correlated with the position of a gene or protein in biochemical and gene regulatory networks (Erwin & Davidson, 2009; Jeong et al., 2001), which are now readily inferred from high dimensional data sets such as the genome‐wide gene coexpression networks studies herein. Here, we considered the case of potentially large‐effect mutations – segregating gene copies identified from a grass pan‐genome ‐ and ask whether such “pan‐genes” are unevenly distributed in gene coexpression networks. Focusing on the well‐watered (control) environment, we found that shell genes – pan‐genes found in fewer than 31 of our studied accessions ‐ were statistically under‐represented among the genes in five of the six largest (in terms of total number of genes) coexpression modules (Table 4b). These large modules are enriched for GO terms comprising essential processes such as protein synthesis, primary metabolism, various processes related to phosphorus metabolism and signalling, and cell wall organization (Table 2b). Moreover, shell genes are generally under‐represented among module hub genes (diagnosed as those whose expression most highly correlated with the module as a whole, and thus possibly the most topologically connected among genes in a module) in these five Water modules (Table 4d). Collectively, these results support the hypothesis that core pan‐genome genes are centrally located in gene coexpression networks and involved in biological processes likely to be under strong purifying selection.
Water module 4 (W4), comprising 590 genes, is the only large water module that is statistically enriched for shell genes (Table 4b). Shell genes in W4 are associated with a range of GO terms including processes related to photosynthesis (Table 2b). In general, the lists of shell genes in modules do not tend to have strong GO enrichments, perhaps owing to the relatively small numbers of genes in these lists. Interestingly, among the Drought modules, the only module for which shell genes do have an enrichment (D8; Table 4a) includes GO terms associated with photosynthesis (Table 2a). Shell genes represent genes found in some sampled accessions but missing in others, suggesting that B. distachyon may harbour genetic diversity in molecular pathways related to photosynthesis. Whether these segregating variants represent adaptive genetic diversity reflecting the broad geographical coverage of our sampling, or simply mildly deleterious copy number variants on their way to being lost will require a larger population sample. Previously, we demonstrated significant genetic variation among the same Brachypodium accessions used herein for leaf carbon content, leaf C:N ratios, and water use efficiency (WUE; Des Marais, Lasky, et al., 2017). Among these, WUE was significantly associated with principal components summarizing climate diversity; it is possible that some of the segregating variation in photosynthesis gene presence/absence is involved in local adaptation to climate.
The coexpression network approach we employed here, in concert with a modern pan‐genomic perspective on segregating genetic variation, allowed us to identify subsets of genes involved in core metabolic processes such as photosynthesis, suggesting possible candidate genes regulating natural genetic variation in resource assimilation and growth. These genes make attractive targets for further hypothesis testing via genome editing. Collectively, our study demonstrates the importance of accounting for both gene copy number variation and regulatory interactions in studying genome function and evolution.
AUTHOR CONTRIBUTIONS
David L. Des Marais and Thomas E. Juenger designed the research. David L. Des Marais performed the experimental manipulations and generated the data. David L. Des Marais, Rubén Sancho, and Bruno Contreras‐Moreira performed the analyses. David L. Des Marais and Rubén Sancho wrote the primary draft, and all authors contributed to the final draft of the manuscript.
CONFLICTS OF INTEREST
The authors affirm that they have no conflict of interest arising from this research or the publication of this manuscript.
OPEN RESEARCH BADGES
This article has earned an Open Data Badge for making publicly available the digitally‐shareable data necessary to reproduce the reported results. The data is available at [provided https://www.ebi.ac.uk/ena].
BENEFIT‐SHARING STATEMENT
All accessions used in the current study originated from collections generated by the Brachypodium research community over several decades. Benefits from this research accrue from the sharing of our data and results on public databases as described above.
Supporting information
Appendix S1
ACKNOWLEDGEMENTS
We thank R. Hopkins, E. Sukamtoh, J. Bonnette, and B. Whitaker for their assistance with data collection. This work was supported by the USDA (NIFA‐2011‐67012‐30663) to D.L.D., NSF (IOS‐0922457) to T.E.J., the Spanish Ministry of Science and Innovation CGL2016‐79790‐P and PID2019‐108195GB‐I00, University of Zaragoza UZ2016_TEC02 grant projects to P.C., and the Joint Genome Institute FP00006675 contract to P.C. and FP00006746 to D.L.D. R.S. was funded by a Spanish Ministry of Economy and Competitiveness (Mineco) FPI PhD fellowship, Mineco and Ibercaja‐CAI mobility grants and Instituto de Estudios Altoaragoneses grant. B.C.M. was funded by Fundación ARAID. P.C. and R.S. were partially funded by a European Social Fund/Spanish Aragón Government Bioflora grant.
Sancho, R. , Catalán, P. , Contreras‐Moreira, B. , Juenger, T. E. , & Des Marais, D. L. (2022). Patterns of pan‐genome occupancy and gene coexpression under water‐deficit in Brachypodium distachyon . Molecular Ecology, 31, 5285–5306. 10.1111/mec.16661
Handling Editor: Regina S Baucom
DATA AVAILABILITY STATEMENT
RNA Sequence data have been made available at the ENA (European Nucleotide Archive; https://www.ebi.ac.uk/ena) with the consecutive accession numbers from ERR6133302 to ERR6133575. All of the R scripts, supplementary Excel files, TPM counts and adjacency matrices are available in the Github repository (https://github.com/Bioflora/Brachypodium_co_expression) identified by the following DOI: https://zenodo.org/badge/latestdoi/388135382. Experimental details and metadata for samples studied herein were reported previously (Des Marais, Lasky, et al., 2017).
REFERENCES
- Albert, R. , Jeong, H. , & Barabási, A.‐L. (2000). Error and attack tolerance of complex networks. Nature, 406, 378–382. 10.1038/35019019 [DOI] [PubMed] [Google Scholar]
- Alonge, M. , Wang, X. , Benoit, M. , Soyk, S. , Pereira, L. , Zhang, L. , Suresh, H. , Ramakrishnan, S. , Maumus, F. , Ciren, D. , Levy, Y. , Harel, T. H. , Shalev‐Schlosser, G. , Amsellem, Z. , Razifard, H. , Caicedo, A. L. , Tieman, D. M. , Klee, H. , Kirsche, M. , … Lippman, Z. B. (2020). Major impacts of widespread structural variation on gene expression and crop improvement in tomato. Cell, 182(1), 145–161.e23. 10.1016/j.cell.2020.05.021 [DOI] [PMC free article] [PubMed] [Google Scholar]
- Aoki, K. , Ogata, Y. , & Shibata, D. (2007). Approaches for extracting practical information from gene co‐expression networks in plant biology. Plant Cell Physiology, 48(3), 381–390. 10.1093/pcp/pcm013 [DOI] [PubMed] [Google Scholar]
- Aoki, Y. , Okamura, Y. , Tadaka, S. , Kinoshita, K. , & Obayashi, T. (2016). ATTED‐II in 2016: A plant coexpression database towards lineage‐specific coexpression. Plants and Cell Physiology, 57(1), e5(1‐9). 10.1093/pcp/pcv165 [DOI] [PMC free article] [PubMed] [Google Scholar]
- Bayer, P. E. , Golicz, A. A. , Scheben, A. , Batley, J. , & Edwards, D. (2020). Plant pan‐genomes are the new reference. Nature Plants, 6(8), 914–920. 10.1038/s41477-020-0733-0 [DOI] [PubMed] [Google Scholar]
- Bechtold, U. , Albihlal, W. S. , Lawson, T. , Fryer, M. J. , Sparrow, P. A. C. , Richard, F. , Persad, R. , Bowden, L. , Hickman, R. , Martin, C. , Beynon, J. L. , Buchanan‐Wollaston, V. , Baker, N. R. , Morison, J. I. , Schöffl, F. , Ott, S. , & Mullineaux, P. M. (2013). Arabidopsis HEAT SHOCK TRANSCRIPTION FACTORA1b overexpression enhances water productivity, resistance to drought, and infection. Journal of Experimental Botany, 64(11), 3467–3481. 10.1093/jxb/ert185 [DOI] [PMC free article] [PubMed] [Google Scholar]
- Benfey, P. N. , & Mitchell‐Olds, T. (2008). From genotype to phenotype: Systems biology meets natural variation. Science, 320, 495–497. 10.1161/circgen.117.001946 [DOI] [PMC free article] [PubMed] [Google Scholar]
- Bertolini, E. , Verelst, W. , Horner, D. S. , Gianfranceschi, L. , Piccolo, V. , Inzé, D. , Pè, M. E. , & Mica, E. (2013). Addressing the role of microRNAs in reprogramming leaf growth during drought stress in Brachypodium distachyon . Molecular Plant, 6(2), 423–443. 10.1093/mp/sss160 [DOI] [PMC free article] [PubMed] [Google Scholar]
- Bohnert, H. J. , Nelson, D. E. , & Jensenayb, R. G. (1995). Adaptations to environmental stresses. The Plant Cell, 7, 1099–1111. [DOI] [PMC free article] [PubMed] [Google Scholar]
- Bolger, A. M. , Lohse, M. , & Usadel, B. (2014). Trimmomatic: A flexible trimmer for Illumina sequence data. Bioinformatics, 30(15), 2114–2120. [DOI] [PMC free article] [PubMed] [Google Scholar]
- Borah, P. , Sharma, E. , Kaur, A. , Chandel, G. , Mohapatra, T. , Kapoor, S. , & Khurana, J. (2017). Analysis of drought‐responsive signalling network in two contrasting rice cultivars using transcriptome‐based approach. Scientific Reports, 42131, 1–21. 10.1038/srep42131 [DOI] [PMC free article] [PubMed] [Google Scholar]
- Bray, N. L. , Pimentel, H. , Melsted, P. , & Pachter, L. (2016). Near‐optimal probabilistic RNA‐seq quantification. Nature Biotechnology, 34(5), 525–527. 10.1038/nbt.3519 [DOI] [PubMed] [Google Scholar]
- Carlson, M. R. J. , Zhang, B. , Fang, Z. , Mischel, P. S. , Horvath, S. , & Nelson, S. F. (2006). Gene connectivity, function, and sequence conservation: predictions from modular yeast co‐expression networks. BMC Genomics, 7(40), 1–15. 10.1186/1471-2164-7-40 [DOI] [PMC free article] [PubMed] [Google Scholar]
- Catalán, P. , Chalhoub, B. , Chochois, V. , Garvin, D. F. , Hasterok, R. , Manzaneda, A. J. , Mur, L. A. , Pecchioni, N. , Rasmussen, S. K. , Vogel, J. P. , & Voxeur, A. (2014). Update on the genomics and basic biology of Brachypodium . Trends in Plant Science, 19(7), 414–418. 10.1016/j.tplants.2014.05.002 [DOI] [PubMed] [Google Scholar]
- Catalán, P. , López‐Alvarez, D. , Díaz‐Pérez, A. , Sancho, R. , & López‐Herranz, M. L. (2016). Phylogeny and evolution of the genus Brachypodium . In Vogel J. P. (Ed.), Genetics and genomics of Brachypodium. Plant Genetics and Genomics: Crops Models (pp. 9–38). Springer. 10.1007/7397 [DOI] [Google Scholar]
- Chaves, M. M. , Maroco, J. P. , & Pereira, J. S. (2003). Understanding plant responses to drought — from genes to whole plant. Functional Plant Biology, 30, 239–264. 10.1071/FP02076 [DOI] [PubMed] [Google Scholar]
- Chen, L. , Han, J. , Deng, X. , Tan, S. , Li, L. , Li, L. , Zhou, J. , Peng, H. , Yang, G. , He, G. , & Zhang, W. (2016). Expansion and stress responses of AP2/EREBP superfamily in Brachypodium distachyon . Scientific Reports, 6, 1–14. 10.1038/srep21623 [DOI] [PMC free article] [PubMed] [Google Scholar]
- Contreras‐Moreira, B. , Cantalapiedra, C. P. , García‐Pereira, M. J. , Gordon, S. P. , Vogel, J. P. , Igartua, E. , Casas, A. M. , & Vinuesa, P. (2017). Analysis of plant pan‐genomes and transcriptomes with GET _ HOMOLOGUES‐EST, a clustering solution for sequences of the same species. Frontiers in Genetics, 8, 184. 10.3389/fpls.2017.00184 [DOI] [PMC free article] [PubMed] [Google Scholar]
- Decena, M. A. , Gálvez‐Rojas, S. , Agostini, F. , Sancho, R. , Contreras‐Moreira, B. , Des Marais, D. L. , Hernandez, P. , & Catalán, P. (2021). Comparative genomics, evolution, and drought‐induced expression of dehydrin genes in model Brachypodium grasses. Plants, 10(2664), 1–29. 10.3390/plants10122664 [DOI] [PMC free article] [PubMed] [Google Scholar]
- Demmig‐Adams, B. , & Adams, W. W. (1996). The role of xanthophyll cycle carotenoids in the protection of photosynthesis. Trends in Plant Science, 1(1), 21–26. 10.1016/S1360-1385(96)80019-7 [DOI] [Google Scholar]
- Des Marais, D. L. , Guerrero, R. F. , Lasky, J. R. , & Scarpino, S. V. (2017). Topological features of gene regulatory networks predict patterns of natural diversity in environmental response. Proceedings of the Royal Society B: Biological Sciences, 284(1856), 20170914. 10.1098/rspb.2017.0914 [DOI] [PMC free article] [PubMed] [Google Scholar]
- Des Marais, D. L. , & Juenger, T. E. (2016). Brachypodium and the abiotic environment. In Vogel J. P. (Ed.), Genetics and genomics of Brachypodium. Plant genetics and genomics: Crops models, volume 18 (pp. 291–311). Springer. [Google Scholar]
- Des Marais, D. L. , Lasky, J. R. , Verslues, P. E. , Chang, T. Z. , & Juenger, T. E. (2017). Interactive effects of water limitation and elevated temperature on the physiology, development and fitness of diverse accessions of Brachypodium distachyon . New Phytologist, 214, 132–144. 10.1111/nph.14316 [DOI] [PubMed] [Google Scholar]
- Des Marais, D. L. , Mckay, J. K. , Richards, J. H. , Sen, S. , Wayne, T. , & Juenger, T. E. (2012). Physiological genomics of response to soil drying in diverse arabidopsis accessions. The Plant Cell, 24, 893–914. 10.1105/tpc.112.096180 [DOI] [PMC free article] [PubMed] [Google Scholar]
- Des Marais, D. L. , Razzaque, S. , Hernandez, K. M. , Garvin, D. F. , & Juenger, T. E. (2016). Quantitative trait loci associated with natural diversity in water‐use efficiency and response to soil drying in Brachypodium distachyon . Plant Science, 251, 2–11. 10.1016/j.plantsci.2016.03.010 [DOI] [PubMed] [Google Scholar]
- Dong, J. , & Horvath, S. (2007). Understanding network concepts in modules. BMC Systems Biology, 1(24), 1–20. 10.1186/1752-0509-1-24 [DOI] [PMC free article] [PubMed] [Google Scholar]
- Erwin, D. H. , & Davidson, E. H. (2009). The evolution of hierarchical gene regulatory networks. Nature Reviews Genetics, 10(2), 141–148. 10.1038/nrg2499 [DOI] [PubMed] [Google Scholar]
- Filiz, E. , Ozdemir, B. S. , Budak, F. , Vogel, J. P. , Tuna, M. , & Budak, H. (2009). Molecular, morphological, and cytological analysis of diverse Brachypodium distachyon inbred lines. Genome, 52(10), 876–890. 10.1139/g09-062 [DOI] [PubMed] [Google Scholar]
- Fisher, L. H. , Han, J. , Corke, F. M. , Akinyemi, A. , Didion, T. , Nielsen, K. K. , Doonan, J. H. , Mur, L. A. , & Bosch, M. (2016). Linking dynamic phenotyping with metabolite analysis to study natural variation in drought responses of Brachypodium distachyon . Frontiers in Plant Science, 7, 1–15. 10.3389/fpls.2016.01751 [DOI] [PMC free article] [PubMed] [Google Scholar]
- Fisher, R. A. (1930). The genetical theory of natural selection. Oxford Clarendon Press. 10.5962/bhl.title.27468 [DOI] [Google Scholar]
- Gao, L. , Gonda, I. , Sun, H. , Ma, Q. , Bao, K. , Tieman, D. M. , Burzynski‐Chang, E. A. , Fish, T. L. , Stromberg, K. A. , Sacks, G. L. , Thannhauser, T. W. , Foolad, M. R. , Diez, M. J. , Blanca, J. , Canizares, J. , Xu, Y. , van der Knaap, E. , Huang, S. , Klee, H. J. , … Fei, Z. (2019). The tomato pan‐genome uncovers new genes and a rare allele regulating fruit flavor. Nature Genetics, 51(6), 1044–1051. 10.1038/s41588-019-0410-2 [DOI] [PubMed] [Google Scholar]
- Gibson, G. (2016). On the evaluation of module preservation. Cell Systems, 3, 17–19. 10.1016/j.cels.2016.07.009 [DOI] [PubMed] [Google Scholar]
- Gordon, S. P. , Contreras‐Moreira, B. , Woods, D. P. , Des Marais, D. L. , Burgess, D. , Shu, S. , Stritt, C. , Roulin, A. C. , Schackwitz, W. , Tyler, L. , Martin, J. , Lipzen, A. , Dochy, N. , Phillips, J. , Barry, K. , Geuten, K. , Budak, H. , Juenger, T. E. , Amasino, R. , … Vogel, J. P. (2017). Extensive gene content variation in the Brachypodium distachyon pan‐genome correlates with population structure. Nature Communications, 8, 2184. 10.1038/s41467-017-02292-8 [DOI] [PMC free article] [PubMed] [Google Scholar]
- Gordon, S. P. , Priest, H. , Des Marais, D. L. , Schackwitz, W. , Figueroa, M. , Martin, J. , Bragg, J. N. , Tyler, L. , Lee, C. R. , Bryant, D. , Wang, W. , Messing, J. , Manzaneda, A. J. , Barry, K. , Garvin, D. F. , Budak, H. , Tuna, M. , Mitchell‐Olds, T. , Pfender, W. F. , … Vogel, J. P. (2014). Genome diversity in Brachypodium distachyon: Deep sequencing of highly diverse inbred lines. The Plant Journal, 79, 361–374. 10.1111/tpj.12569 [DOI] [PubMed] [Google Scholar]
- Guelzim, N. , Bottani, S. , Bourgine, P. , & Képès, F. (2002). Topological and causal structure of the yeast transcriptional regulatory network. Nature Genetics, 31(1), 60–63. 10.1038/ng873 [DOI] [PubMed] [Google Scholar]
- Guo, M. , Liu, J. H. , Ma, X. , Luo, D. X. , Gong, Z. H. , & Lu, M. H. (2016). The plant heat stress transcription factors (HSFS): Structure, regulation, and function in response to abiotic stresses. Frontiers in Plant Science, 7, 114. 10.3389/fpls.2016.00114 [DOI] [PMC free article] [PubMed] [Google Scholar]
- Haberer, G. , Kamal, N. , Bauer, E. , Gundlach, H. , Fischer, I. , Seidel, M. A. , Spannagl, M. , Marcon, C. , Ruban, A. , Urbany, C. , Nemri, A. , Hochholdinger, F. , Ouzunova, M. , Houben, A. , Schön, C. C. , & Mayer, K. F. X. (2020). European maize genomes highlight intraspecies variation in repeat and gene content. Nature Genetics, 52(9), 950–957. 10.1038/s41588-020-0671-9 [DOI] [PMC free article] [PubMed] [Google Scholar]
- Handakumbura, P. P. , Stanfill, B. , Rivas‐Ubach, A. , Fortin, D. , Vogel, J. P. , & Jansson, C. (2019). Metabotyping as a stopover in genome‐to‐phenome mapping. Scientific Reports, 9(1), 1–12. 10.1038/s41598-019-38483-0 [DOI] [PMC free article] [PubMed] [Google Scholar]
- Hasterok, R. , Catalan, P. , Hazen, S. P. , Roulin, A. C. , Vogel, J. P. , Wang, K. , & Mur, L. A. J. (2022). Brachypodium: Twenty years as a grass biology model system; the way forward? Trends in Plant Science. 10.1016/j.tplants.2022.04.008 [DOI] [PubMed] [Google Scholar]
- Hayano‐Kanashiro, C. , Calderón‐Vázquez, C. , Ibarra‐Laclette, E. , Herrera‐Estrella, L. , & Simpson, J. (2009). Analysis of gene expression and physiological responses in three mexican maize landraces under drought stress and recovery irrigation. PLoS One, 4(10), e7531. 10.1371/journal.pone.0007531 [DOI] [PMC free article] [PubMed] [Google Scholar]
- Howe, K. L. , Contreras‐Moreira, B. , De Silva, N. , Maslen, G. , Akanni, W. , Allen, J. , Alvarez‐Jarreta, J. , Barba, M. , Bolser, D. M. , Cambell, L. , Carbajo, M. , Chakiachvili, M. , Christensen, M. , Cummins, C. , Cuzick, A. , Davis, P. , Fexova, S. , Gall, A. , George, N. , … Flicek, P. (2020). Ensembl Genomes 2020‐enabling non‐vertebrate genomic research. Nucleic Acids Research, 48(D1), D689–D695. 10.1093/nar/gkz890 [DOI] [PMC free article] [PubMed] [Google Scholar]
- Hübner, S. , Bercovich, N. , Todesco, M. , Mandel, J. R. , Odenheimer, J. , Ziegler, E. , Lee, J. S. , Baute, G. J. , Owens, G. L. , Grassa, C. J. , Ebert, D. P. , Ostevik, K. L. , Moyers, B. T. , Yakimowski, S. , Masalia, R. R. , Gao, L. , Ćalić, I. , Bowers, J. E. , Kane, N. C. , … Rieseberg, L. H. (2019). Sunflower pan‐genome analysis shows that hybridization altered gene content and disease resistance. Nature Plants, 5(1), 54–62. 10.1038/s41477-018-0329-0 [DOI] [PubMed] [Google Scholar]
- IBI . (2010). Genome sequencing and analysis of the model grass Brachypodium distachyon . Nature, 463, 763–768. 10.1038/nature08747 [DOI] [PubMed] [Google Scholar]
- Janiak, A. , Kwa, M. , & Szarejko, I. (2015). Gene expression regulation in roots under drought. Journal of Experimental Botany, 67(4), 1003–1014. 10.1093/jxb/erv512 [DOI] [PubMed] [Google Scholar]
- Jeong, H. , Mason, S. P. , Barabási, A. L. , & Oltvai, Z. N. (2001). Lethality and centrality in protein networks. Nature, 411(6833), 41–42. 10.1038/35075138 [DOI] [PubMed] [Google Scholar]
- Juenger, T. E. (2013). Natural variation and genetic constraints on drought tolerance. Current Opinion in Plant Biology, 16(3), 274–281. 10.1016/j.pbi.2013.02.001 [DOI] [PubMed] [Google Scholar]
- Kaas, R. S. , Friis, C. , Ussery, D. W. , & Aarestrup, F. M. (2012). Estimating variation within the genes and inferring the phylogeny of 186 sequenced diverse Escherichia coli genomes. BMC Genomics, 13, 577. 10.1186/1471-2164-1113-1577 [DOI] [PMC free article] [PubMed] [Google Scholar]
- Koonin, E. V. , & Wolf, Y. I. (2008). Genomics of bacteria and archaea: The emerging dynamic view of the prokaryotic world. Nucleic Acids Research, 36(21), 6688–6719. 10.1093/nar/gkn668 [DOI] [PMC free article] [PubMed] [Google Scholar]
- Ksouri, N. , Castro‐Mondragón, J. A. , Montardit‐Tarda, F. , van Helden, J. , Contreras‐Moreira, B. , & Gogorcena, Y. (2021). Tuning promoter boundaries improves regulatory motif discovery in nonmodel plants: the peach example. Plant Physiology, 185(3), 1242–1258. 10.1093/plphys/kiaa091 [DOI] [PMC free article] [PubMed] [Google Scholar]
- Langfelder, P. , & Horvath, S. (2007). Eigengene networks for studying the relationships between co‐expression modules. BMC Systems Biology, 1, 54. 10.1186/1752-0509-1-54 [DOI] [PMC free article] [PubMed] [Google Scholar]
- Langfelder, P. , & Horvath, S. (2008). WGCNA: An R package for weighted correlation network analysis. BMC Bioinformatics, 9(559), 1–13. 10.1186/1471-2105-9-559 [DOI] [PMC free article] [PubMed] [Google Scholar]
- Langfelder, P. , & Horvath, S. (2010). Overview of network terminology . https://labs.genetics.ucla.edu/horvath/CoexpressionNetwork/ModulePreservation/Tutorials/glossaryTable.pdf
- Langfelder, P. , Luo, R. , Oldham, M. C. , & Horvath, S. (2011). Is my network module preserved and reproducible? PLoS Computational Biology, 7(1), e1001057. 10.1371/journal.pcbi.1001057 [DOI] [PMC free article] [PubMed] [Google Scholar]
- Lehti‐Shiu, M. D. , & Shiu, S. H. (2012). Diversity, classification and function of the plant protein kinase superfamily. Philosophical Transactions of the Royal Society B: Biological Sciences, 367(1602), 2619–2639. 10.1098/rstb.2012.0003 [DOI] [PMC free article] [PubMed] [Google Scholar]
- Lei, L. , Goltsman, E. , Goodstein, D. , Wu, G. A. , Rokhsar, D. S. , & Vogel, J. P. (2021). Plant pan‐genomics comes of age. Annual Review of Plant Biology, 72(1), 411–435. 10.1146/annurev-arplant-080720-105454 [DOI] [PubMed] [Google Scholar]
- López‐Álvarez, D. , Manzaneda, A. J. , Rey, P. J. , Giraldo, P. , Benavente, E. , Allainguillaume, J. , … Catalan, P. (2015). Environmental niche variation and evolutionary diversification of the Brachypodium distachyon grass complex species in their native circum‐Mediterranean range. American Journal of Botany, 102(7), 1073–1088. 10.3732/ajb.1500128 [DOI] [PubMed] [Google Scholar]
- Luo, N. , Liu, J. , Yu, X. , & Jiang, Y. (2011). Natural variation of drought response in Brachypodium distachyon . Physiologia Plantarum, 141(1), 19–29. 10.1111/j.1399-3054.2010.01413.x [DOI] [PubMed] [Google Scholar]
- Manzaneda, A. J. , Rey, P. J. , Anderson, J. T. , Raskin, E. , Weiss‐Lehman, C. , & Mitchell‐Olds, T. (2015). Natural variation, differentiation, and genetic trade‐offs of ecophysiological traits in response to water limitation in Brachypodium distachyon and its descendent allotetraploid B. hybridum (Poaceae). Evolution, 69(10), 2689–2704. 10.1111/evo.12776 [DOI] [PMC free article] [PubMed] [Google Scholar]
- Manzaneda, A. J. , Rey, P. J. , Bastida, J. M. , Weiss‐Lehman, C. , Raskin, E. , & Mitchell‐Olds, T. (2012). Environmental aridity is associated with cytotype segregation and polyploidy occurrence in Brachypodium distachyon (Poaceae). New Phytologist, 193(3), 797–805. 10.1111/j.1469-8137.2011.03988.x [DOI] [PMC free article] [PubMed] [Google Scholar]
- Mao, L. , Van Hemert, J. L. , Dash, S. , & Dickerson, J. A. (2009). Arabidopsis gene co‐expression network and its functional modules. BMC Bioinformatics, 10(346), 1–24. 10.1186/1471-2105-10-346 [DOI] [PMC free article] [PubMed] [Google Scholar]
- Martínez, L. M. , Fernández‐ocaña, A. , Rey, P. J. , Salido, T. , Amil‐ruiz, F. , & Manzaneda, A. J. (2018). Variation in functional responses to water stress and differentiation between natural allopolyploid populations in the Brachypodium distachyon species complex. Annals of Botany, 00, 1–14. 10.1093/aob/mcy037 [DOI] [PMC free article] [PubMed] [Google Scholar]
- Masalia, R. R. , Bewick, A. J. , & Burke, J. M. (2017). Connectivity in gene coexpression networks negatively correlates with rates of molecular evolution in flowering plants. PLoS One, 12(7), e0182289. 10.1371/journal.pone.0182289 [DOI] [PMC free article] [PubMed] [Google Scholar]
- Meyer, E. , Aglyamova, G. V. , & Matz, M. V. (2011). Profiling gene expression responses of coral larvae (Acropora millepora) to elevated temperature and settlement inducers using a novel RNA‐Seq procedure. Molecular Ecology, 20(17), 3599–3616. 10.1111/j.1365-294X.2011.05205.x [DOI] [PubMed] [Google Scholar]
- Mi, H. , Ebert, D. , Muruganujan, A. , Mills, C. , Albou, L. P. , Mushayamaha, T. , & Thomas, P. D. (2021). PANTHER version 16: A revised family classification, tree‐based classification tool, enhancer regions and extensive API. Nucleic Acids Research, 49(D1), D394–D403. 10.1093/nar/gkaa1106 [DOI] [PMC free article] [PubMed] [Google Scholar]
- Miao, Z. , Han, Z. , Zhang, T. , Chen, S. , & Ma, C. (2017). A systems approach to a spatio‐ temporal understanding of the drought stress response in maize. Scientific Reports, 7(6590), 1–14. 10.1038/s41598-017-06929-y [DOI] [PMC free article] [PubMed] [Google Scholar]
- Mochida, K. , Uehara‐Yamaguchi, Y. , Yoshida, T. , Sakurai, T. , & Shinozaki, K. (2011). Global landscape of a co‐expressed gene network in barley and its application to gene discovery in Triticeae crops. Plants and Cell Physiology, 52(5), 785–803. 10.1093/pcp/pcr035 [DOI] [PMC free article] [PubMed] [Google Scholar]
- Monroe, J. G. , Cai, H. , & Des Marais, D. L. (2021). Diversity in non‐linear responses to soil moisture shapes evolutionary constraints in Brachypodium . G3 Genes Genomes Genetics, 11(12), jkab334. [DOI] [PMC free article] [PubMed] [Google Scholar]
- Monroe, J. G. , McGovern, C. , Lasky, J. R. , Grogan, K. , Beck, J. , & McKay, J. K. (2016). Adaptation to warmer climates by parallel functional evolution of CBF genes in Arabidopsis thaliana. Molecular Ecology, 25(15), 3632–3644. 10.1111/mec.13711 [DOI] [PubMed] [Google Scholar]
- Monroe, J. G. , Powell, T. , Price, N. , Mullen, J. L. , Howard, A. , Evans, K. , Lovell, J. T. , & McKay, J. K. (2018). Drought adaptation in arabidopsis thaliana by extensive genetic loss‐of‐function. eLife, 7, 1–18. 10.7554/eLife.41038 [DOI] [PMC free article] [PubMed] [Google Scholar]
- Mur, L. A. J. , Allainguillaume, J. , Catalán, P. , Hasterok, R. , Jenkins, G. , Lesniewska, K. , Thomas, I. , & Vogel, J. (2011). Exploiting the Brachypodium tool box in cereal and grass research. New Phytologist, 191(2), 334–347. 10.1111/j.1469-8137.2011.03748.x [DOI] [PubMed] [Google Scholar]
- Nakashima, K. , Ito, Y. , & Yamaguchi‐Shinozaki, K. (2009). Transcriptional regulatory networks in response to abiotic stresses in Arabidopsis and Grasses. Plant Physiology, 149, 88–95. 10.1104/pp.108.129791 [DOI] [PMC free article] [PubMed] [Google Scholar]
- Nakashima, K. , Yamaguchi‐Shinozaki, K. , & Shinozaki, K. (2014). The transcriptional regulatory network in the drought response and its crosstalk in abiotic stress responses including drought, cold, and heat. Frontiers in Plant Science, 5(170), 1–7. 10.3389/fpls.2014.00170 [DOI] [PMC free article] [PubMed] [Google Scholar]
- Nover, L. , Bharti, K. , Döring, P. , Mishra, S. K. , Ganguli, A. , & Scharf, K. D. (2001). Arabidopsis and the heat stress transcription factor world: How many heat stress transcription factors do we need? Cell Stress and Chaperones, 6(3), 177–189. 10.1379/1466-1268(2001)006<0177:aathst>2.0.co;2 [DOI] [PMC free article] [PubMed] [Google Scholar]
- Paaby, A. B. , & Rockman, M. V. (2014). Cryptic genetic variation: Evolution's hidden substrate. Nature Reviews Genetics, 15(4), 247–258. 10.1038/nrg3688 [DOI] [PMC free article] [PubMed] [Google Scholar]
- Pimentel, H. , Bray, N. L. , Puente, S. , Melsted, P. , & Pachter, L. (2017). Differential analysis of RNA‐seq incorporating quantification uncertainty. Nature Methods, 14(7), 687–690. 10.1038/nmeth.4324 [DOI] [PubMed] [Google Scholar]
- Pinheiro, C. , & Chaves, M. M. (2011). Photosynthesis and drought: Can we make metabolic connections from available data? Journal of Experimental Botany, 62(3), 869–882. 10.1093/jxb/erq340 [DOI] [PubMed] [Google Scholar]
- Porth, I. , Klápště, J. , McKown, A. D. , La Mantia, J. , Hamelin, R. C. , Skyba, O. , … Douglas, C. J. (2014). Extensive functional pleiotropy of REVOLUTA substantiated through forward genetics. Plant Physiology, 164(2), 548–554. 10.1104/pp.113.228783 [DOI] [PMC free article] [PubMed] [Google Scholar]
- Priest, H. D. , Fox, S. E. , Rowley, E. R. , Murray, J. R. , Michael, T. P. , & Mockler, T. C. (2014). Analysis of global gene expression in Brachypodium distachyon reveals extensive network plasticity in response to abiotic stress. PLoS One, 9(1), e87499. 10.1371/journal.pone.0087499 [DOI] [PMC free article] [PubMed] [Google Scholar]
- R Core Team . (2022). R: A language and environment for statistical computing. R Foundation for Statistical Computing. [Google Scholar]
- Ritchie, S. C. , Watts, S. , Fearnley, L. G. , Holt, K. E. , Abraham, G. , & Inouye, M. (2016). A scalable permutation approach reveals replication and preservation patterns of network modules in large datasets. Cell Systems, 3, 71–82. 10.1016/j.cels.2016.06.012 [DOI] [PubMed] [Google Scholar]
- Ruíz, M. , Quemada, M. , García, R. M. , Carrillo, J. M. , & Benavente, E. (2016). Use of thermographic imaging to screen for drought‐tolerant genotypes in Brachypodium distachyon . Crop and Pasture Science, 67(1), 99–108. 10.1071/CP15134 [DOI] [Google Scholar]
- Scharf, K. D. , Berberich, T. , Ebersberger, I. , & Nover, L. (2012). The plant heat stress transcription factor (Hsf) family: Structure, function and evolution. Biochimica et Biophysica Acta ‐ Gene Regulatory Mechanisms, 1819(2), 104–119. 10.1016/j.bbagrm.2011.10.002 [DOI] [PubMed] [Google Scholar]
- Scholthof, K.‐B. G. , Irigoyen, S. , Catalán, P. , & Mandadi, K. K. (2018). Brachypodium: A monocot grass model system for plant biology. Plant Cell, 30, 1673–1694. [DOI] [PMC free article] [PubMed] [Google Scholar]
- Sebastian, A. , & Contreras‐Moreira, B. (2014). footprintDB: A database of transcription factors with annotated cis elements and binding interfaces. Bioinformatics, 30(2), 258–265. 10.1093/bioinformatics/btt663 [DOI] [PubMed] [Google Scholar]
- Skalska, A. , Stritt, C. , Wyler, M. , Williams, H. W. , Vickers, M. , Han, J. , Tuna, M. , Savas Tuna, G. , Susek, K. , Swain, M. , Wóycicki, R. K. , Chaudhary, S. , Corke, F. , Doonan, J. H. , Roulin, A. C. , Hasterok, R. , & Mur, L. A. J. (2020). Genetic and methylome variation in Turkish Brachypodium distachyon accessions differentiate two geographically distinct subpopulations. International Journal of Molecular Sciences, 21(18), 1–17. 10.3390/ijms21186700 [DOI] [PMC free article] [PubMed] [Google Scholar]
- Stuart, J. M. , Segal, E. , Koller, D. , & Kim, S. K. (2003). A gene coexpression network for global discovery of conserved genetic modules. Science, 302, 249–255. [DOI] [PubMed] [Google Scholar]
- Sun, Y. , & Dinneny, J. R. (2018). Q&A: How do gene regulatory networks control environmental responses in plants? BMC Biology, 16(38), 18–21. 10.1186/s12915-018-0506-7 [DOI] [PMC free article] [PubMed] [Google Scholar]
- Tandonnet, S. , & Torres, T. T. (2017). Traditional versus 3′ RNA‐seq in a non‐model species. Genomics Data, 11, 9–16. 10.1016/j.gdata.2016.11.002 [DOI] [PMC free article] [PubMed] [Google Scholar]
- Tao, Y. , Luo, H. , Xu, J. , Cruickshank, A. , Zhao, X. , Teng, F. , Hathorn, A. , Wu, X. , Liu, Y. , Shatte, T. , Jordan, D. , Jing, H. , & Mace, E. (2021). Extensive variation within the pan‐genome of cultivated and wild sorghum. Nature Plants, 7(6), 766–773. 10.1038/s41477-021-00925-x [DOI] [PubMed] [Google Scholar]
- Thomas‐Chollier, M. , Herrmann, C. , Defrance, M. , Sand, O. , Thieffry, D. , & Van Helden, J. (2012). RSAT peak‐motifs: Motif analysis in full‐size ChIP‐seq datasets. Nucleic Acids Research, 40(4), e31. 10.1093/nar/gkr1104 [DOI] [PMC free article] [PubMed] [Google Scholar]
- Turatsinze, J. V. , Thomas‐Chollier, M. , Defrance, M. , & van Helden, J. (2008). Using RSAT to scan genome sequences for transcription factor binding sites and cis‐regulatory modules. Nature Protocols, 3(10), 1578–1588. 10.1038/nprot.2008.97 [DOI] [PubMed] [Google Scholar]
- Verelst, W. , Bertolini, E. , De Bodt, S. , Vandepoele, K. , Demeulenaere, M. , Pè, M. E. , & Inzé, D. (2013). Molecular and physiological analysis of growth‐limiting drought stress in Brachypodium distachyon leaves. Molecular Plant, 6(2), 311–322. 10.1093/mp/sss098 [DOI] [PubMed] [Google Scholar]
- Vogel, J. P. , Garvin, D. F. , Leong, O. M. , & Hayden, D. M. (2006). Agrobacterium‐mediated transformation and inbred line development in the model grass Brachypodium distachyon . Plant Cell, Tissue and Organ Culture, 84(2), 199–211. 10.1007/s11240-005-9023-9 [DOI] [Google Scholar]
- Vogel, J. P. , Garvin, D. F. , Mockler, T. C. , Schmutz, J. , Rokhsar, D. , Bevan, M. W. , Barry, K. , Lucas, S. , Harmon‐Smith, M. , Lail, K. , Tice, H. , Grimwood, J. , McKenzie, N. , Huo, N. , Gu, Y. Q. , Lazo, G. R. , Anderson, O. D. , You, F. M. , Luo, M. C. , … Baxter, I. (2010). Genome sequencing and analysis of the model grass Brachypodium distachyon . Nature, 463(7282), 763–768. 10.1038/nature08747 [DOI] [PubMed] [Google Scholar]
- Vogel, J. P. , Tuna, M. , Budak, H. , Huo, N. , Gu, Y. Q. , & Steinwand, M. A. (2009). Development of SSR markers and analysis of diversity in Turkish populations of Brachypodium distachyon . BMC Plant Biology, 9, 88. 10.1186/1471-2229-9-88 [DOI] [PMC free article] [PubMed] [Google Scholar]
- Wagner, G. P. , & Altenberg, L. (1996). Perspective: Complex adaptations and the evolution of evolvability. Evolution, 50(3), 967–976. 10.1111/j.1558-5646.1996.tb02339.x [DOI] [PubMed] [Google Scholar]
- Wingler, A. , Quick, W. P. , Bungard, R. A. , Bailey, K. J. , Lea, P. J. , & Leegood, R. C. (1999). The role of photorespiration during drought stress: An analysis utilizing barley mutants with reduced activities of photorespiratory enzymes. Plant, Cell and Environment, 22(4), 361–373. 10.1046/j.1365-3040.1999.00410.x [DOI] [Google Scholar]
- Wolfe, C. J. , Kohane, I. S. , & Butte, A. J. (2005). Systematic survery reveals general applicability of “guilt‐by‐association” within gene coexpression networks. BMC Bioinformatics, 6(227), 1–10. 10.1186/1471-2105-6-227 [DOI] [PMC free article] [PubMed] [Google Scholar]
- Zhang, B. , & Horvath, S. (2005). A general framework for weighted gene co‐expression network analysis. Statistical Applications in Genetics and Molecular Biology, 4(1), 17. [DOI] [PubMed] [Google Scholar]
- Zheng, Y. , Jiao, C. , Sun, H. , Rosli, H. G. , Pombo, M. A. , Zhang, P. , Banf, M. , Dai, X. , Martin, G. B. , Giovannoni, J. J. , Zhao, P. X. , Rhee, S. Y. , & Fei, Z. (2016). iTAK: A program for genome‐wide prediction and classification of plant transcription factors, transcriptional regulators, and protein kinases. Molecular Plant, 9(12), 1667–1670. 10.1016/j.molp.2016.09.014 [DOI] [PubMed] [Google Scholar]
Associated Data
This section collects any data citations, data availability statements, or supplementary materials included in this article.
Supplementary Materials
Appendix S1
Data Availability Statement
RNA Sequence data have been made available at the ENA (European Nucleotide Archive; https://www.ebi.ac.uk/ena) with the consecutive accession numbers from ERR6133302 to ERR6133575. All of the R scripts, supplementary Excel files, TPM counts and adjacency matrices are available in the Github repository (https://github.com/Bioflora/Brachypodium_co_expression) identified by the following DOI: https://zenodo.org/badge/latestdoi/388135382. Experimental details and metadata for samples studied herein were reported previously (Des Marais, Lasky, et al., 2017).