

Abstract
Aim
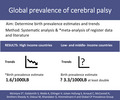
To determine trends and current estimates in regional and global prevalence of cerebral palsy (CP).
Method
A systematic analysis of data from participating CP registers/surveillance systems and population‐based prevalence studies (from birth year 1995) was performed. Quality and risk of bias were assessed for both data sources. Analyses were conducted for pre‐/perinatal, postnatal, neonatal, and overall CP. For each region, trends were statistically classified as increasing, decreasing, heterogeneous, or no change, and most recent prevalence estimates with 95% confidence intervals (CI) were calculated. Meta‐analyses were conducted to determine current birth prevalence estimates (from birth year 2010).
Results
Forty‐one regions from 27 countries across five continents were represented. Pre‐/perinatal birth prevalence declined significantly across Europe and Australia (11 out of 14 regions), with no change in postneonatal CP. From the limited but increasing data available from regions in low‐ and middle‐income countries (LMICs), birth prevalence for pre‐/perinatal CP was as high as 3.4 per 1000 (95% CI 3.0–3.9) live births. Following meta‐analyses, birth prevalence for pre‐/perinatal CP in regions from high‐income countries (HICs) was 1.5 per 1000 (95% CI 1.4–1.6) live births, and 1.6 per 1000 (95% CI 1.5–1.7) live births when postneonatal CP was included.
Interpretation
The birth prevalence estimate of CP in HICs declined to 1.6 per 1000 live births. Data available from LMICs indicated markedly higher birth prevalence.
What this paper adds
• Birth prevalence of pre‐/perinatal cerebral palsy (CP) in high‐income countries (HICs) is decreasing.
• Current overall CP birth prevalence for HICs is 1.6 per 1000 live births.
• Trends in low‐ and middle‐income countries (LMICs) cannot currently be measured.
• Current birth prevalence in LMICs is markedly higher than in HICs.
• Active surveillance of CP helps to assess the impact of medical advancements and social/economic development.
• Population‐based data on prevalence and trends of CP are critical to inform policy.
This paper determined the current birth prevalence of cerebral palsy in high‐income countries has declined to 1.6/1000 live births. Birth prevalence for low‐ and middle‐income countries is markedly higher.
This original article is commented on by Paneth and Yeargin‐Allsopp on pages 1436–1437 of this issue.
Abbreviations
- ACPR
Australian Cerebral Palsy Register
- HIC
high‐income country
- LMIC
low‐ and middle‐income country
- SCPE
Surveillance of Cerebral Palsy in Europe
Cerebral palsy (CP) is an umbrella term for a group of disorders of movement and posture, caused by a non‐progressive interference in the developing brain. Risk factors for CP span the periods before and around the time of conception, during pregnancy, the perinatal period, and up to 2 years of age. Known risk factors and conditions that can combine into causal pathways to CP include genetic variants, congenital anomalies, preterm birth, kernicterus, intrauterine growth restriction and infection, hypoxic ischaemia and cerebrovascular insults during pregnancy and in infancy, and accidental and non‐accidental brain injury. 1
Population‐based CP registers and prevalence studies have monitored the birth prevalence of CP for more than 60 years. 2 The most recent systematic review and meta‐analysis of birth prevalence, which mostly included births in the 1980s and 1990s, found prevalence was 2.1 per 1000 live births. 3 Historically, temporal fluctuations have been reported within high‐income country (HIC) regions as some causal pathways become preventable, such as kernicterus, and others arose such as increased survival of infants born very preterm with the advent of neonatal intensive care units. In recent years, significant and sustained declines in the birth prevalence of CP in HIC regions of Europe, Australia, and Japan have been reported. 4 , 5 , 6 , 7 While the causes for this decline are complicated, declines are being attributed to an array of clinical improvements in public health, maternal, and perinatal care, particularly for infants cared for in a neonatal intensive care unit at highest risk of CP such as those born very preterm or at term with hypoxic–ischaemic encephalopathy. 8 It is therefore important to continue to monitor how improvements in care affect the current birth prevalence of CP across the world and draw attention to recent trends in CP. It is also important to determine whether trends are being seen in all HIC regions, as well as to establish the current overall birth prevalence of CP in these regions.
Population‐based data are also now emerging from regions of low‐ and middle‐income countries (LMICs) where higher rates of CP are being reported. 9 , 10 , 11 The aetiological pathways to CP in these countries seem to differ from HICs. 12 As most births worldwide occur in LMICs, it is imperative that an update in the prevalence of CP includes data from these regions where possible.
Prevalence of CP is not static and can be expected to continuously change as a result of medical advancements, and social and economic development. This study is the result of an international collaboration which aimed to provide a snapshot of recent changes, and current birth prevalence and period prevalence (complementary indicators). Specifically, this systematic analysis of CP register data and published literature aimed to identify the following: (1) trends in birth prevalence for CP of pre‐ or perinatal origin, postneonatal CP, and overall CP (live births) by region and combined for two major networks—the Surveillance of Cerebral Palsy in Europe (SCPE) and the Australian Cerebral Palsy Register (ACPR) since birth year 1995; (2) most recent birth prevalence estimate (live births) and period prevalence estimate (children living in a region) of CP by region and combined for those with data available from birth year 2010 for a current prevalence estimate.
METHOD
We sought to maximize the representation of geographical regions around the world and use the most contemporary data available. We conducted a systematic analysis of population‐based data from two sources: (1) CP registers/surveillance systems and (2) published prevalence studies.
Study population
The study population included children with CP (numerator) born from 1995 in regions of the world with population‐based data, and the population in which they either were born (total live births) or resided (total children of the same age living in the same region) (denominator). Regions were classified by their country's World Bank income classification (low, lower middle, upper middle, high). Timing of CP was categorized as follows: (1) pre‐ or perinatal CP—brain injury/maldevelopment during the pre‐, peri‐, or neonatal period up to 28 days of life, or unknown aetiology; (2) postneonatal CP—a known brain‐damaging event unrelated to factors in the ante‐, peri‐, or neonatal periods, sustained after the neonatal period (28 days of life) but before the age of 2 years; or (3) overall CP—all pre‐ or perinatal CP and postneonatal CP.
CP registers/surveillance systems
In 2020, invitations to participate were sent to representatives from 30 population‐based CP registers known to the study investigators. Registers provided the aggregated number of children with confirmed CP born/living in their region, for each birth year from 1995, by timing of CP, along with equivalent live birth or population denominator data. Data collection was performed during 2020 to 2021.
CP was confirmed at a minimum age of 4 years. 13 For the study, the definition of CP 14 included the five criteria agreed on by SCPE and the ACPR: (1) is an umbrella term for a group of disorders; (2) is a condition that is permanent but not unchanging; (3) involves a disorder of movement and/or posture and of motor function; (4) is due to a non‐progressive interference, lesion, or abnormality, and (5) the interference, lesion, or abnormality originates in the immature brain. 15 , 16 Registers/surveillance systems providing data included children with a diagnosis of CP at the age of 2 years, but who died before age 4 or 5 years, but excluded children with a diagnosis of CP who died before the age of 2 years.
We requested that registers provide descriptive data about the geographical region represented, size of region, continuity of data collection, numerator and denominator definitions, definition of CP, data sources and methods of data acquisition, and consent requirements to confirm inclusion. To be included in the trends analysis, CP registers/surveillance systems required a minimum of 10 consecutive years of data and ongoing data collection.
Published literature on prevalence of CP
A broad systematic literature search strategy was designed with an academic librarian, on the basis of the search originally used by Oskoui et al. 3 Searches were conducted in MEDLINE and EMBASE in November 2020, along with handsearching. There were no limits on language of publication, but the search was limited to papers published from 2011, to include papers published since the systematic review by Oskoui et al. 3 Abstracts and titles were exported into referencing software, and automatic and manual de‐duplication was performed (using Covidence systematic review software, Veritas Health Innovation, Melbourne, Australia; available at www.covidence.org). Titles and abstracts were screened for possible inclusion by one investigator (SG), then the full text of potential articles was retrieved and reviewed by two (SG and SM).
Original research articles were included if they reported population‐based prevalence of CP from birth year 1995 with an internationally agreed definition of CP (denominators defined as live births or children aged between 0 and 18 years in the region). The following studies were excluded: (1) abstract available only; (2) studies describing a subgroup of CP only (e.g. severe motor involvement); (3) studies including people with CP outside the target age range (e.g. born before 1995; 50% of children younger than 4 years); and (4) studies from a region already represented in the current study with newer/equivalent data from a participating CP register/surveillance system or literature.
Sets of two investigators independently reviewed each article meeting all eligibility criteria (SG, SM, HSS, SJH, GH, KH, KM). Methods and results data were extracted using data extraction sheets designed a priori for the study (including reference, year of publication, geographical location of the study, birth cohorts included, study method, data sources, definition of CP and diagnostic criteria used, age at diagnosis/confirmation of diagnosis, definition and inclusion of postneonatal CP, and numerator and denominator definitions). The corresponding author was contacted, as required, to clarify information or data, and authors were asked to provide data from 1995 only. We preferentially extracted case and denominator data for live births, rather than children living in the region. When multiple prevalence rates were reported for children at different ages, data were extracted for the age group closest to age 5 years, when a diagnosis of CP is usually confirmed/verified. For aetiological timing, CP was categorized as pre‐/perinatal if postneonatal CP was explicitly excluded; otherwise, data were categorized as ‘overall’ CP. If not reported, a denominator was estimated from the number of cases and prevalence of CP reported and noted in the accompanying tables.
Quality and risk of bias assessment
CP registers/surveillance systems and included publications were critically appraised for quality and risk of bias. The JBI checklist for prevalence studies 17 was used, which includes nine quality items (marked as yes, no, unclear, or not applicable) and an overall appraisal to ‘include’ or ‘exclude’ the study for meta‐analysis. Sets of two reviewers independently assessed each data source; discrepancies were resolved with an independent third reviewer (SG, SM, HSS, SJH, GH, KH, KM).
Statistical analysis
Objective 1a: recent temporal trends in each region
The temporal trend in the number of pre‐/perinatal CP cases per 1000 live births, and the number of postneonatal CP cases per 10 000 live births between 1995 and 2014 in each region was classified as increasing, decreasing, heterogenous, or no change. For each region, this classification was determined through a two‐step process. First, a Mann–Kendall test 15 , 16 for monotonic trends was used to determine whether the birth prevalence rate for a given region was monotonically increasing or decreasing. The trend for a given region was classified as increasing if the resultant Kendall's τ coefficient was positive and significant (p < 0.05), and was classified as decreasing if the coefficient was negative and significant (p < 0.05). Second, if the trend in a given region could not be classified as either increasing or decreasing (Kendall's τ coefficient giving p > 0.05), then a Poisson regression model with an offset term for live births and a smoothing spline term for birth year was used to distinguish between a heterogenous temporal trend and the presence of no change in the birth prevalence rate. Cubic B‐splines were used for all models, and the degree of smoothness was determined using the restricted maximum likelihood method. The presence of overdispersion in the Poisson regression was inspected. Regions where the smoothing spline term for birth year was significantly different from zero were classified as heterogenous, while regions where the spline term was not significantly different from zero were classified as no change. A smoothed trend line for each region was plotted to visualize birth prevalence trends.
Objective 1b: combined recent temporal trends (register networks)
Temporal trends in the birth prevalence of pre‐/perinatal and postneonatal CP using data from two large CP register networks, the SCPE and the ACPR, were analysed by Poisson regression models with an offset term for live births. Data from the two networks were pooled after testing for any difference in trends between them. Orthogonal polynomial terms for birth year up to the fourth degree were considered, and the final form of birth year in the model was selected using Akaike information criteria. A quadratic model (polynomial up to the second degree) was ultimately selected.
Objective 2a: most recent prevalence in each region
Recent prevalence of pre‐/perinatal, postneonatal, and overall CP were calculated for each region, with 95% confidence intervals (CI). Data for the two most recent birth years were used for pre‐/perinatal CP, while data for any number of birth years from 2010 were used for postneonatal CP given the small number of individuals with postneonatal CP. The 95% CIs were calculated using approximation to the normal distribution after proportions were transformed using Freeman–Tukey double arcsine transformation. 17 Results are presented as prevalence rates after the pooled estimates were back transformed.
Objective 2b: current combined global prevalence
Meta‐analyses of ‘current’ prevalence of pre‐/perinatal CP per 1000 live births, postneonatal CP per 10 000 live births, and overall CP per 1000 live births were performed for regions with prevalence data for at least two consecutive birth years from 2010. The current birth prevalences of CP (pre‐/perinatal, postneonatal, overall) were derived using univariate meta‐analysis of proportions methods. Random effects meta‐analyses using the DerSimonian and Laird method were preferred to fixed effects meta‐analysis because of the anticipated heterogeneity of CP prevalence between regions. Heterogeneity between regional estimates was assessed using the coefficients τ 2 and I 2. χ 2 tests of heterogeneity were also performed. These tests were only used descriptively.
Statistical analyses were performed using R version 4.1 (packages Kendall version 2.2, 18 gam version 1.2, 19 ggplot2 version 3.3.5, 20 meta version 5.2, 21 dmetar version 0.0.09, 22 mgcv version 1.8; 23 R Foundation for Statistical Computing, Vienna, Austria) and STATA version 14.2 (packages metaprop_one; StatCorp, College Station, TX, USA).
Ethical review
In accordance with the National Health and Medical Research Council National Statement on Ethical Conduct in Human Research (Australia), ethical review was not required for this study as it posed negligible risk and involved the use of existing collections of non‐identifiable data (tabulated register data and published literature).
RESULTS
Data from 41 regions of 27 countries were included. CP registers contributed data representing 19 regions from 15 countries, all from Europe and Australia, and classified as regions from HICs. Data from two register networks of Australia and Europe were also received (ACPR and SCPE). Published literature provided data from an additional 22 regions from 12 countries: Africa (n = 2 regions from LMICs), Asia (n = 4 regions from LMICs and n = 5 regions from HICs), Europe (n = 1 region from LMICs and n = 3 from HICs), North America (n = 7 regions from HICs) (Table 1 and Figure S1). No registers or studies were assessed as having a high risk of bias; therefore, all were included in at least one analysis (Tables 1, S1, and S2). Data sources not from registers ranged from face‐to‐face clinical assessments to administrative data linkages (Table 1).
TABLE 1.
Regions included in the study
| Region, country | Data or reference | Data source | World Bank income of country | Denominator |
Participating in temporal trends (birth years) |
Participating in most recent birth prevalence (birth years) |
|---|---|---|---|---|---|---|
| Cross River State, Nigeria | Duke et al. 36 | Key informant method + clinical assessment | Lower middle | Children | — | 2003–2014 |
| Eastern Uganda, Uganda | Kakooza‐Mwesige et al. 35 | Door‐to‐door screening + clinical assessment | Low | Children | — | 1998–2013 |
| Shahjadpur, Bangladesh | Khandaker et al. 10 | Bangladesh Cerebral Palsy Register | Lower middle | Live births | — | 1998–2010 |
| Rajshahi Division, Bangladesh | Murthy et al. 43 | Key informant method + clinical assessment | Lower middle | Children | — | 1995–2013 |
| Henan, China | Yuan et al. 44 | Clinical screening + assessment | Upper middle | Children | — | 2005–2010 |
| R.S. Pura Town, India | Raina et al. 45 | Door‐to‐door screening + clinical assessment | Lower middle | Children | — | 1999–2003 |
| Japan | Toyokawa et al. 46 | National health insurance claims | High | Children | — | 2004–2009 |
| Okinawa, Japan | Touyama et al. 7 | Okinawa Child Development Center surveillance database | High | Live births | — | 1998–2007 |
| Tochigi, Japan | Yamagishi et al. 47 | Survey from medical record | High | Live births | — | 2009–2013 |
| South Korea | Park et al. 48 | National health insurance data | High | Children | — | 1999–2003 |
| Taiwan | Chang et al. 49 | National health insurance data | High | Live births | — | 1996–2000 |
| Australia | Data | Australian Cerebral Palsy Register (ACPR) | High | Live births | 1995–2014 | 2013–2014 |
| New South Wales/Australian Capital Territory, Australia | Data | NSW/ACT Cerebral Palsy Register | High | Live births | — | 2011–2012 a |
| Queensland, Australia | Data | Queensland Cerebral Palsy Register | High | Live births | — | 2010–2011 a |
| South Australia, Australia | Data | South Australian Cerebral Palsy Register | High | Live births | 1995–2014 | 2013–2014 a |
| Victoria, Australia | Data | Victorian Cerebral Palsy Register | High | Live births | 1995–2014 | 2013–2014 a |
| Western Australia, Australia | Data | WA Register of Developmental Anomalies – Cerebral Palsy | High | Live births | 1995–2014 | 2013–2014 a |
| Europe | Data | Surveillance of Cerebral Palsy in Europe (SCPE) | High | Live births | 1995–2010 | 2009–2010 |
| Belgium | Data | Belgian Cerebral Palsy Registry | High | Live births | — | 2010–2011 a |
| Croatia | Data | Register of Cerebral Palsy of Croatia (RCP‐HR) | High | Live births | — | 2010–2011 a |
| Denmark | Data | Danish Cerebral Palsy Registry and National Cerebral Palsy Follow‐Up Programme (CPOP) | High | Live births | 1995–2013 | 2012–2013 a |
| Toulouse, France | Data | Childhood Disabilities Register of the Haute‐Garonne County (RHE31) | High | Children | — | 2010–2011 |
| Grenoble, France | Data | Register for childhood disabilities and perinatal survey (RHEOP) | High | Children | — | 2009–2010 |
| Attica, Greece | Data | The Cerebral Palsy Register of Attica | High | Live births | 1999–2011 | 2010–2011 a |
| Borsod, Hungary | Fejes et al. 50 | Hospital, education, services record review | High | Live births | — | 1995–2006 |
| Eastern area, Ireland | Data | Eastern Area Cerebral Palsy Register | High | Live births | 1995–2012 | 2011–2012 a |
| Moldova | Gincota Bufteac et al. 51 | Hospital record review | Lower middle | Live births | — | 2009–2010 |
| Norway | Data | Norwegian Quality and Surveillance Registry for Cerebral Palsy (NorCP) | High | Live births | 1996–2014 | 2013–2014 a |
| Portugal | Data | Portuguese Surveillance of Cerebral Palsy Programme | High | Live births | 2001–2011 | 2010–2011 a |
| Slovenia | Data | Slovenian Register of Cerebral Palsy | High | Live births | 1999–2011 | 2010–2011 a |
| Western Sweden, Sweden | Data | Cerebral Palsy Register of Western Sweden | High | Live births | 1995–2014 | 2013–2014 a |
| Saint Gallen, Switzerland | Data | The Cerebral Palsy Register of St. Gallen (SPRN) | High | Live births | 1995–2011 | 2010–2011 a |
| Northern Ireland, UK | Data | Northern Ireland Cerebral Palsy Register | High | Live births | 1995–2011 | 2010–2011 a |
| North of England, UK | Glinianaia et al. 52 | North of England Collaborative Cerebral Palsy Survey (NECCPS) | High | Live births | — | 1996–2000 |
| Scotland, UK | Bugler et al. 53 | Cerebral Palsy Integrated Pathway Scotland (CPIPS) surveillance program | High | Children | — | 1997–2016 |
| Sunderland, UK | Data | Sunderland and area study | High | Live births | 1995–2014 | 2013–2014 a |
| Northern Alberta, Canada | Robertson et al. 54 | Canadian Cerebral Palsy Registry | High | Live births | — | 2008–2010 |
| Ontario, Canada | Ray et al. 55 | Pre‐existing administrative linked dataset | High | Neonatal survivors | — | 2002–2008 |
| Quebec, Canada | Oskoui et al. 56 | Cerebral Palsy Register (REPACQ) | High | Children | — | 1999–2001 |
| USA | Zablotsky and Black 57 | National health interview survey | High | Children | — | 1997–2015 |
| Alabama, Georgia, Missouri, Wisconsin, USA | Durkin et al. 58 | Cerebral Palsy surveillance program (ADDM Network) | High | Children | — | 2002 |
| Metropolitan Atlanta, Georgia, USA | Van Naarden Braun et al. 24 | Cerebral Palsy surveillance program (MADDSP) | High | 1‐year survivors | 1996–2002 | 2002 |
| South Carolina, USA | Li et al. 59 | Medicaid services, hospital discharge abstracts, department of disabilities/special needs | High | Live births | — | 2009 |
Included in meta‐analysis of current birth prevalence.
All regions that were able to provide data for trend analyses were from HICs. Data for trend analyses were provided by regions from CP registers (13 of 14 regions). The remaining region from the USA used 1‐year survivors as its denominator, and reported results from a surveillance system. 24 From the 14 regions covering over 8 million live births that contributed to the pre‐/perinatal trend analysis, 79% showed a statistically significant decline. The regions reporting through to 2014 all showed a decline. The remaining three regions showed no change in the time period reported (Figure 1 and Table S3). However, the most recent data available for the USA were from the early 2000s, the Swiss region represents a very small population, and there have been recent declines in Northern Ireland, but not for the entire period for which data were available for this study (1995–2011).
FIGURE 1.
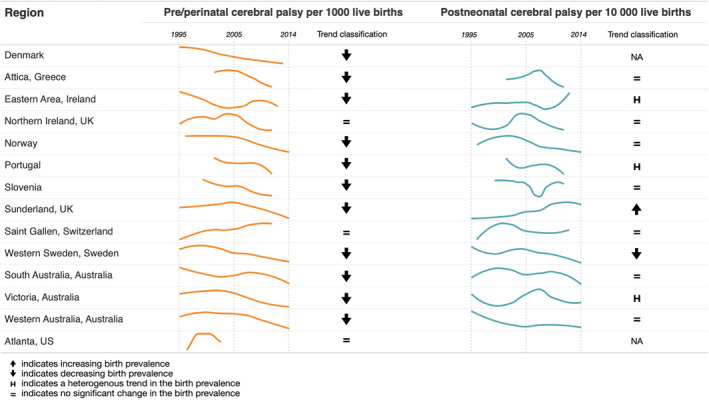
Birth prevalence trends of cerebral palsy.
From the 12 regions that were able to provide data for postneonatal CP, the pattern was mixed, with one region increasing, one decreasing, three being heterogenous, and seven showing no change. This mixed pattern was also seen in those that provided data through to 2014 (Figure 1 and Table S3).
There was no difference in the trends between SCPE and ACPR (test for interaction between birth year and register p = 0.67); therefore data were combined for the two register networks. Figure 2 shows the combined trend line and 95% CIs for pre‐/perinatal CP across Europe and Australia with a statistically significant declining trend (p = 0.012). There was no change for postneonatal CP (figure not shown).
FIGURE 2.
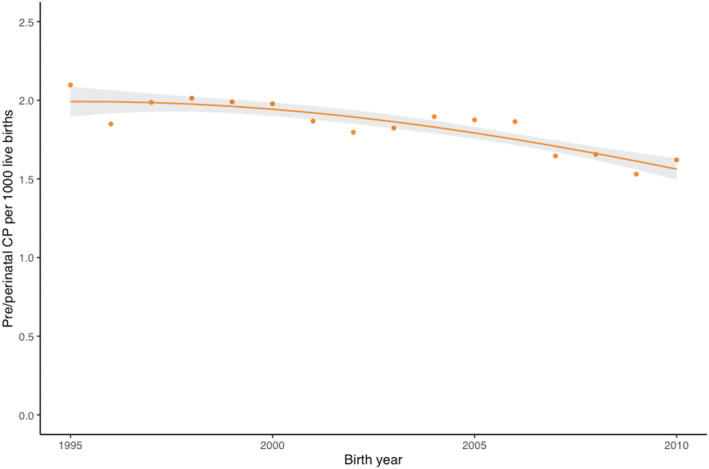
Birth prevalence trend of pre‐/perinatal cerebral palsy (CP; Surveillance of Cerebral Palsy in Europe and the Australian Cerebral Palsy Register combined).
Birth prevalence estimates with 95% CIs were calculated for two CP register networks and 25 regions for pre‐/perinatal CP, 21 regions for postneonatal CP (Figure 3), and 23 regions for overall CP (Figure S2). Most recent birth years were included in the analysis; however, they ranged from 1995 to 2014. Variation across regions reflect different birth years, size of the denominator population, and World Bank income levels. Two regions from LMIC had high birth prevalence estimates of 3 and 3.4 per 1000 live births, one of these regions also had a high postneonatal CP estimate.
FIGURE 3.
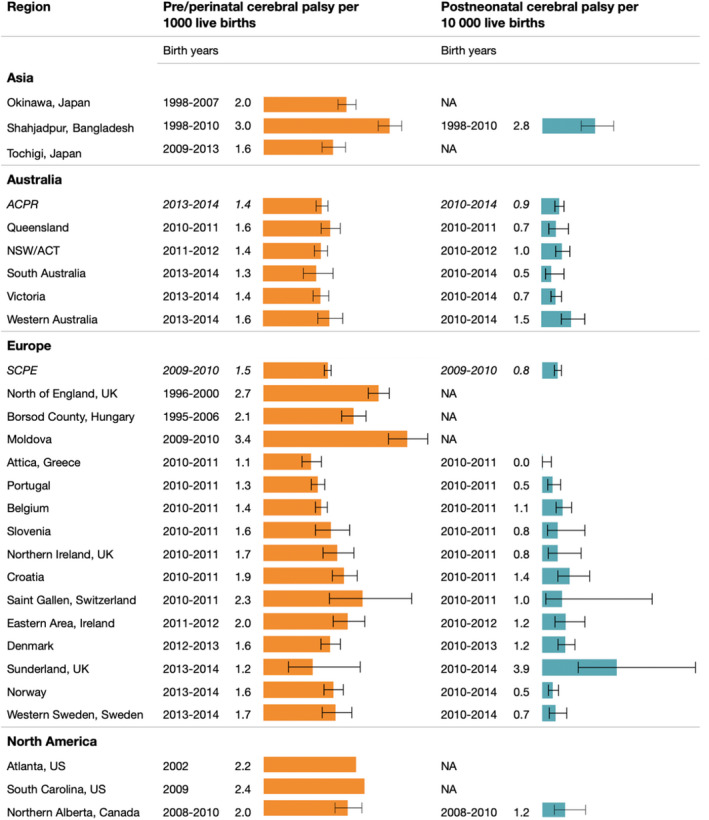
Regional birth prevalence of cerebral palsy. ACPR, Australian Cerebral Palsy Register; ACT, Australian Capital Territory; NSW, New South Wales; SCPE, Surveillance of Cerebral Palsy in Europe.
Meta‐analysis was restricted to regions with data since 2010 to obtain an estimate for current birth prevalence. A total of 17 regions were included in the analysis for both pre‐/perinatal CP, postneonatal CP, and overall CP, all of which were HICs and from CP registers. Heterogeneity does exist between regions; however, for pre‐/perinatal CP there was a combined estimate of 1.5 per 1000 (95% CI 1.4–1.6) live births (τ 2 < 0.001, I 2 = 69.4%) (Figure 4a). For postneonatal CP, the estimate of current birth prevalence was 0.8 per 10 000 (95% CI 0.6–1.0) live births (τ 2 < 0.001, I 2 = 70.1%) (Figure 4b). For overall CP, the estimate of current birth prevalence was 1.6 per 1000 (95% CI 1.5–1.7) live births, seen in Figure S3 (τ 2 < 0.001, I 2 = 72.9%).
FIGURE 4.
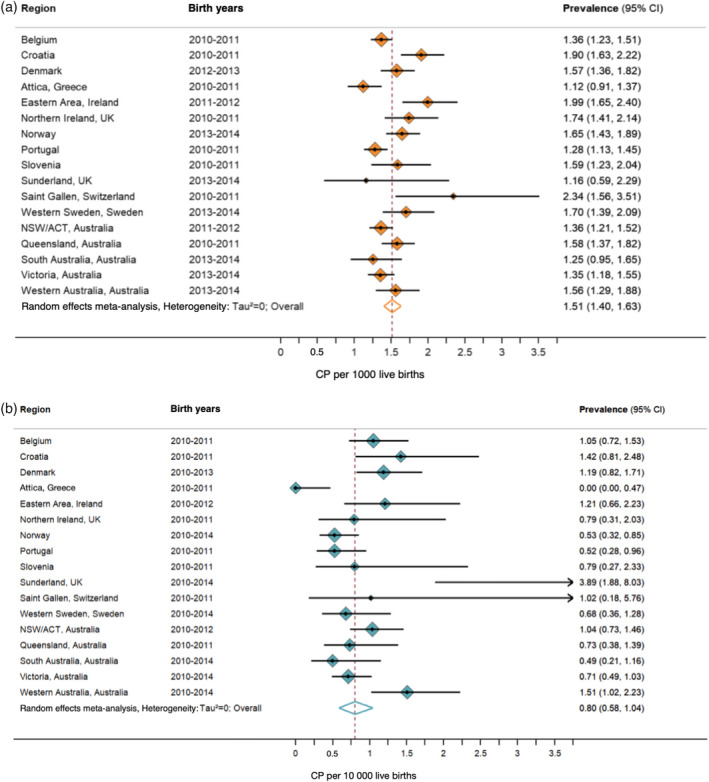
(a) Current pre‐/perinatal birth prevalence of cerebral palsy (CP) in high‐income countries. (b) Current post neonatal birth prevalence of CP in high‐income countries. ACT, Australian Capital Territory; CI, confidence interval; NSW, New South Wales.
Twelve regions reported period prevalence of CP in children (denominator being children the same age living in the area) (Figure 5). Estimated birth years for these studies ranged from 1995 to 2016 and covered over 7 million living children (Table S2). Four of the regions were from LMICs and prevalence ranged from 2.3 to 3.7 per 1000 children. Regions from HICs ranged from 1.6 to 2.9 per 1000 children; those with higher estimates included much earlier birth years.
FIGURE 5.
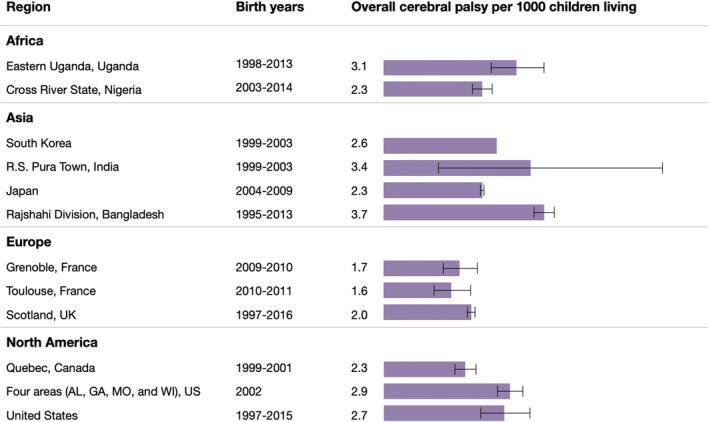
Period prevalence of overall cerebral palsy for children.
DISCUSSION
Before this paper, the most recent international CP birth prevalence study was published in 2013. 3 As such, the great majority of data included were from HICs and birth years from the 1980s and 1990s. At that time the overall birth prevalence was stable, and the estimate was 2.1 per 1000 live births. Since then, several studies have been published that suggest declines in birth prevalence have occurred in the 2000s. 4 , 6 This study was therefore undertaken to update our understanding of the global prevalence of CP by using contemporary data from CP registers and surveillance systems as well as published literature.
Our study confirmed that pre‐/perinatal CP is declining in high‐income regions in Europe and Australia. The trend was similar for individual regions and for the two major CP register networks, SCPE and ACPR. Only one other high‐income region outside these networks was able to be included; 24 however, reporting for this study concluded in birth year 2002, and the same declining trend was not noted. Unfortunately, no registers in LMICs are yet able to report on trends, as at least a decade of population data is required to be meaningful. However, a recent systematic review, which used novel methods to predict trends, reported a concerning increasing trend in China. 25 Neonatal intensive care units are expanding in China and other LMICs, and the increased survival of medically fragile infants born at increasingly lower gestational ages may result in an initial spike in CP prevalence, while further development of neonatal care may decrease the prevalence again—as has been seen in HICs. 26 A challenge for all is how to share knowledge, experiences, and lessons learnt to minimize this inevitable spike. A recent large randomized controlled trial of therapeutic hypothermia has shown that we cannot assume that standard interventions in HICs will work in the same way in LMIC settings; 27 evaluation of such interventions is essential before being introduced into new settings and prevention opportunities should remain a priority. 28
To calculate current global birth prevalence estimates, we restricted meta‐analyses to regions with more than one birth year from 2010. No LMICs were able to participate in these analyses, so these primary findings are for high‐income regions only. The current pre‐/perinatal CP birth prevalence is 1.5 per 1000 live births. The current overall (including postneonatal) CP birth prevalence is 1.6 per 1000 live births. This prevalence estimate is 25% lower than the overall birth prevalence estimate reported in 2013 (2.1 per 1000), 3 and this updated current birth prevalence estimate for HICs should now be used. This is particularly encouraging as this decline has occurred during the same era that survival in neonatal intensive care units is improving for infants born extremely preterm. 31 As described earlier, we have learnt to expect that advances in health care may lead to increases in CP prevalence, as well as decreases.
The number of CP registers and prevalence studies in LMICs is increasing, yet they remain extremely underrepresented. In this study, 7 out of 41 regions were from LMICs (Nigeria, Uganda, Bangladesh [n = 2], China, India, Moldova) compared with 3 out of 49 in the previous study (China, Kenya, Turkey). 3 Two regions were able to report birth prevalence using live births as a denominator, making this comparable to the high‐income regions. Birth prevalence was 3.3 per 1000 overall for Shahjadpur, Bangladesh, and 3.4 per 1000 for pre‐/perinatal CP in Moldova. These birth prevalence estimates are more than double the findings for high‐income regions in our meta‐analysis. The remainder reported period prevalence (with a denominator of children living in the region) as high as 3.7 per 1000 children in Rajshahi Division, Bangladesh. Additional literature from Albania, Egypt, and Pakistan, which could not be included in this review, supports these findings. 32 , 33 , 34 Low‐ and middle‐income regions reporting prevalence estimates suggest that these are almost certainly underestimates due to survival bias (i.e. high mortality in the early years, before a CP diagnosis and, again, high mortality in children with CP), incomplete ascertainment, and inability to include very mild cases at population level. 10 , 35 , 36 Collaborative efforts such as mentorship programmes with SCPE, ACPR, and the Global LMIC CP register will increase representation of LMICs. 37
There has been no change in postneonatal CP, and the current estimate for HICs is 0.8 per 10 000 live births with wide confidence intervals. The numbers for postneonatal CP in HICs are small, and we have less confidence about these trends, particularly for children with a brain injury closer to the age of 2 years, which may be described as an acquired brain injury rather than postneonatal CP. LMICs with higher proportions of postneonatal CP (up to 36% in Nigeria, 36 compared with 6% in Australia 2 ), alert us to the differences in aetiologies of postneonatal CP (e.g. malaria, previous nutritional status) and potentially different opportunities for prevention strategies that are specific to each region. 37 , 38
A shared understanding of the definition and classification of CP is essential for reliable estimates and trends. Standardized and consistent approaches used by registers enable accurate monitoring of the condition over time. In situations when complete agreement cannot be reached, data can be harmonized for comparisons. 39 For example, in this study, data were restricted to CP that occurred in the first 2 years of life, and children who survived beyond the age of 2 years, despite variations between CP registers in these limits. 13 We recommend the continued use of papers such as the one by Smithers‐Sheedy et al. 13 (including confirming diagnosis at age 4 years) and the full annotation that describes in detail the definition of CP. 14
A strength of this study was our reporting on both birth prevalence and period prevalence, which is rarely done. These two indicators are complementary. While birth prevalence is a relevant indicator of the impact of the organization of care and practices in the peri‐ and neonatal period, the cross‐sectional approach used for period prevalence estimates is more relevant for documenting public health issues, notably the impact of CP in the community. It is generally accepted that period prevalence is higher than birth prevalence, which is consistent with our results, although comparisons are difficult (small sample size and different regions). Another strength of this study was our representation of regions without CP registers, by including published population‐based studies with alternative methodologies, such as large surveys and administrative data. However, it is known that conditions, including CP, are coded inconsistently, 40 so risk of bias was higher for studies that solely relied on administrative data for identifying children with CP. Finally, we observed regional heterogeneity in our birth prevalence meta‐analyses. Although there will always be a level of true variation in prevalence between regions, it is likely that under‐ascertainment of children with mild CP is also a contributing factor, particularly for newly established registers. 41
The declining trends in the birth prevalence of pre‐/perinatal CP, evidenced by CP registers in this paper, increases our understanding of the condition and the impact of improvements in ante‐, peri‐, and postnatal care in HICs. This global overview represents the recent and current situation in over 40 regions of the world. Sustainable registers with good ascertainment are essential for continued monitoring of trends and prevalence, and the real‐world impact of changing social development and health care in low‐, middle‐, and high‐income countries. Recognition of CP at national and international levels provides a powerful tool to potentially influence policy and services, leading to a demonstrable contribution to society and economies. 42
Funding information
The Australian CP Register and the NSW/ACT CP Register are funded by the Cerebral Palsy Alliance, Australia. The Northern Ireland Cerebral Palsy Register is funded by the Public Health Agency Northern Ireland. The Norwegian Quality and Surveillance Registry for Cerebral Palsy is funded by the South‐Eastern Norway Regional Health Authority. The Registry of Childhood Disabilities in Haute‐Garonne county (RHE31), France, is funded by the Public Health Agency France and the National Institute of Health and Medical Research. Registre des Handicaps de l'Enfant et Observatoire Périnatal, Grenoble, France.
Supporting information
Figure S1: Data sources flow chart.
Figure S2: Overall regional birth prevalence of cerebral palsy.
Figure S3: Current overall birth prevalence of cerebral palsy in high‐income countries.
Appendix S1: Search strategy.
Table S1: JBI/supporting data for regions represented in birth prevalence analyses.
Table S2: JBI/supporting data for regions represented in period prevalence analyses.
Table S3: Supporting data for regional trends in pre‐/perinatal cerebral palsy and postneonatal cerebral palsy.
ACKNOWLEDGMENTS
The additional members of the Global CP Prevalence Group are as follows: Gina Hinwood, Linda Watson, Megan Auld, Natasha Garrity, Nadia Badawi, Els Ortibus, Inge Franki, Vlatka Mejaski‐Bosnjak, Gija Rackauskaite, Elodie Sellier, Antigone Papavasileiou, Melinda Fejes, Valerie Dowding, Claire Kerr, Guro L. Andersen, Daniel Virella, Anja Troha Gergeli, Catherine Gibson, Karen Horridge, Christoph Tobias Kuenzle, Svetlana V Glinianaia, and Malika Delobel‐Ayoub. Open access publishing facilitated by The University of Sydney, as part of the Wiley ‐ The University of Sydney agreement via the Council of Australian University Librarians. Open access publishing facilitated by The University of Sydney, as part of the Wiley ‐ The University of Sydney agreement via the Council of Australian University Librarians.
We thank the regions that contributed data to the study. We sincerely thank all the families whose data make the epidemiological research possible. The authors have stated that they had no interests that might be perceived as posing a conflict or bias.
McIntyre S, Goldsmith S, Webb A, et al. Global prevalence of cerebral palsy: A systematic analysis. Dev Med Child Neurol. 2022;64(12):1494–1506. 10.1111/dmcn.15346
*Members of the Global CP Prevalence Group are listed in the Acknowledgements.
DATA AVAILABILITY STATEMENT
Data sharing is available on request to the authors, and if data is from a register it would require approval from the individual register.
REFERENCES
- 1. McIntyre S, Morgan C, Walker K, et al. Cerebral palsy‐‐don't delay. Dev Disabil Res Rev 2011; 17: 114–29. [DOI] [PubMed] [Google Scholar]
- 2. Himmelmann K, McIntyre S, Goldsmith S, et al. Epidemiology of Cerebral Palsy. In: Miller F, Bachrach S, Lennon N, O'Neil M editors. Cerebral Palsy. Switzerland: Springer, Cham; 2018. [Google Scholar]
- 3. Oskoui M, Coutinho F, Dykeman J, et al. An update on the prevalence of cerebral palsy: a systematic review and meta‐analysis. Dev Med Child Neurol 2013; 55: 509–19. [DOI] [PubMed] [Google Scholar]
- 4. Galea C, McIntyre S, Smithers‐Sheedy H, et al. Cerebral palsy trends in Australia (1995‐2009): a population‐based observational study. Dev Med Child Neurol 2019; 61: 186–93. [DOI] [PubMed] [Google Scholar]
- 5. Reid SM, Meehan E, McIntyre S, et al. Temporal trends in cerebral palsy by impairment severity and birth gestation. Dev Med Child Neurol 2016; 58 25–35. [DOI] [PubMed] [Google Scholar]
- 6. Sellier E, Platt MJ, Andersen GL, et al. Decreasing prevalence in cerebral palsy: a multi‐site European population‐based study, 1980 to 2003. Dev Med Child Neurol 2016; 58: 85–92. [DOI] [PubMed] [Google Scholar]
- 7. Touyama M, Touyama J, Toyokawa S, et al. Trends in the prevalence of cerebral palsy in children born between 1988 and 2007 in Okinawa, Japan. Brain Dev 2016; 38: 792–9. [DOI] [PubMed] [Google Scholar]
- 8. Badawi N, McIntyre S, Hunt RW. Perinatal care with a view to preventing cerebral palsy. Dev Med Child Neurol 2021; 63: 156–61. [DOI] [PMC free article] [PubMed] [Google Scholar]
- 9. Donald KA, Samia P, Kakooza‐Mwesige A, et al. Pediatric cerebral palsy in Africa: a systematic review. Seminars in pediatric neurology 2014; 21: 30–5. [DOI] [PubMed] [Google Scholar]
- 10. Khandaker G, Muhit M, Karim T, et al. Epidemiology of cerebral palsy in Bangladesh: a population‐based surveillance study. Dev Med Child Neurol 2019; 61: 601–9. [DOI] [PubMed] [Google Scholar]
- 11. Kakooza‐Mwesige A, Andrews C, Peterson S, et al. Prevalence of cerebral palsy in Uganda: a population‐based study. Lancet Glob Health 2017; 5: e1275‐e82. [DOI] [PubMed] [Google Scholar]
- 12. Khandaker G, Smithers‐Sheedy H, Islam J, et al. Bangladesh Cerebral Palsy Register (BCPR): a pilot study to develop a national cerebral palsy (CP) register with surveillance of children for CP. BMC Neurol 2015; 15: 173. [DOI] [PMC free article] [PubMed] [Google Scholar]
- 13. Smithers‐Sheedy H, Badawi N, Blair E, et al. What constitutes cerebral palsy in the twenty‐first century? Dev Med Child Neurol 2014; 56: 323–8. [DOI] [PubMed] [Google Scholar]
- 14. Rosenbaum P, Paneth N, Leviton A, et al. A report: the definition and classification of cerebral palsy April 2006. Dev Med Child Neurol Suppl 2007; 109: 8–14. [PubMed] [Google Scholar]
- 15. Mann HB. Nonparametric tests against trend. Econometrica: Journal of the econometric society 1945; 13: 245–59. [Google Scholar]
- 16. Kendall MG. Rank Correlation Methods , 4th edition . London: Charles Griffin; 1975. [Google Scholar]
- 17. Freeman MF, Tukey JW. Transformations related to the angular and the square root. The Annals of Mathematical Statistics 1950: 607–11. [Google Scholar]
- 18. McLeod AI. Kendall: Kendall rank correlation and Mann‐Kendall trend test. R package version 2.2. https://CRAN.R‐project.org/package = Kendall. 2011.
- 19. Hastie T. gam: Generalized Additive Models. R package version 1.20. https://cran.r‐project.org/web/packages/gam/gam.pdf. 2020.
- 20. Wickham H. ggplot2: Elegant Graphics for Data Analysis. Springer‐Verlag; New York; 2016. [Google Scholar]
- 21. Balduzzi S, Rücker G, Schwarzer G. How to perform a meta‐analysis with R: a practical tutorial. Evidence‐Based Mental Health 2019; 22: 153–60. [DOI] [PMC free article] [PubMed] [Google Scholar]
- 22. Harrer M, Cuijpers P, Furukawa T, et al. dmetar: Companion R Package For The Guide ‘Doing Meta‐Analysis in R'. R package version 0.0.9000. http://dmetar.protectlab.org/. 2019.
- 23. Wood SN. Generalized Additive Models: An Introduction with R ( 2nd edition ). New York: Chapman and Hall/CRC; 2017. [Google Scholar]
- 24. Van Naarden Braun K, Doernberg N, Schieve L, et al. Birth Prevalence of Cerebral Palsy: A Population‐Based Study. Pediatrics 2016; 137: 1–9. [DOI] [PMC free article] [PubMed] [Google Scholar]
- 25. Yang S, Xia J, Gao J, et al. Increasing prevalence of cerebral palsy among children and adolescents in China 1988‐2020: A systematic review and meta‐analysis. J Rehabil Med 2021; 53: jrm00195. [DOI] [PMC free article] [PubMed] [Google Scholar]
- 26. Faruk T, King C, Muhit M, et al. Screening tools for early identification of children with developmental delay in low‐ and middle‐income countries: a systematic review. BMJ Open 2020; 10: e038182. [DOI] [PMC free article] [PubMed] [Google Scholar]
- 27. Thayyil S, Pant S, Montaldo P, et al. Hypothermia for moderate or severe neonatal encephalopathy in low‐income and middle‐income countries (HELIX): a randomised controlled trial in India, Sri Lanka, and Bangladesh. Lancet Glob Health 2021; 9: e1273‐e85. [DOI] [PMC free article] [PubMed] [Google Scholar]
- 28. Thayyil S, Bassett P, Shankaran S. Questions about the HELIX trial ‐ Authors' reply. Lancet Glob Health 2021; 9: e1654‐e5. [DOI] [PubMed] [Google Scholar]
- 29. Hollung SJ, Vik T, Lydersen S, et al. Decreasing prevalence and severity of cerebral palsy in Norway among children born 1999 to 2010 concomitant with improvements in perinatal health. Eur J Paediatr Neurol 2018; 22: 814–21. [DOI] [PubMed] [Google Scholar]
- 30. Larsen ML, Rackauskaite G, Greisen G, et al. Continuing decline in the prevalence of cerebral palsy in Denmark for birth years 2008‐2013. Eur J Paediatr Neurol 2020; 30: 155–61. [DOI] [PubMed] [Google Scholar]
- 31. Stoll BJ, Hansen NI, Bell EF, et al. Trends in Care Practices, Morbidity, and Mortality of Extremely Preterm Neonates, 1993‐2012. JAMA 2015; 314: 1039–51. [DOI] [PMC free article] [PubMed] [Google Scholar]
- 32. Kruja J, Beghi E, Zerbi D, et al. High prevalence of major neurological disorders in two Albanian communities: results of a door‐to‐door survey. Neuroepidemiology 2012; 38: 138–47. [DOI] [PubMed] [Google Scholar]
- 33. El‐Tallawy HN, Farghaly WM, Shehata GA, et al. Epidemiology of cerebral palsy in El‐Kharga District‐New Valley (Egypt). Brain Dev 2011; 33: 406–11. [DOI] [PubMed] [Google Scholar]
- 34. El‐Tallawy HN, Farghaly WM, Shehata GA, et al. Cerebral palsy in Al‐Quseir City, Egypt: prevalence, subtypes, and risk factors. Neuropsychiatr Dis Treat 2014; 10: 1267–72. [DOI] [PMC free article] [PubMed] [Google Scholar]
- 35. Kakooza‐Mwesige A, Andrews C, Peterson S, et al. Prevalence of cerebral palsy in Uganda: a population‐based study. The Lancet Global Health 2017; 5: e1275‐e82. [DOI] [PubMed] [Google Scholar]
- 36. Duke R, Torty C, Nwachukwu K, et al. Clinical features and aetiology of cerebral palsy in children from Cross River State, Nigeria. Archives of Disease in Childhood 2020; 105: 625–30. [DOI] [PubMed] [Google Scholar]
- 37. Jahan I, Muhit M, Hardianto D, et al. Epidemiology of cerebral palsy in za\ies: preliminary findings from an international multi‐centre cerebral palsy register. Dev Med Child Neurol 2021; 63: 1327–36. [DOI] [PubMed] [Google Scholar]
- 38. Jahan I, Al Imam MH, Karim T, et al. Epidemiology of cerebral palsy in Sumba Island, Indonesia. Dev Med Child Neurol 2020; 62: 1414–22. [DOI] [PubMed] [Google Scholar]
- 39. Sellier E, McIntyre S, Smithers‐Sheedy H, et al. European and Australian Cerebral Palsy Surveillance Networks Working Together for Collaborative Research. Neuropediatrics 2020; 51: 105–12. [DOI] [PubMed] [Google Scholar]
- 40. The National Confidential Enquiry into Patient Outcome and Death. Each and Every Need. London: National Confidential Enquiry into Patient Outcome and Death; 2018. [Google Scholar]
- 41. Goldsmith S, McIntyre S, Smithers‐Sheedy H, et al. An international survey of cerebral palsy registers and surveillance systems. Dev Med Child Neurol 2016; 58 Suppl 2: 11–7. [DOI] [PMC free article] [PubMed] [Google Scholar]
- 42. UK Research and Innovation: Economic and Social Research Council . Defining Impact. https://www.ukri.org/councils/esrc/impact‐toolkit‐for‐economic‐and‐social‐sciences/defining‐impact/ (accessed 03/12/2021
- 43. Murthy GV, Mactaggart I, Mohammad M, et al. Assessing the prevalence of sensory and motor impairments in childhood in Bangladesh using key informants. Arch Dis Child 2014; 99: 1103–8. [DOI] [PMC free article] [PubMed] [Google Scholar]
- 44. Yuan J, Wang J, Ma J, et al. Paediatric cerebral palsy prevalence and high‐risk factors in Henan province, Central China. Journal of rehabilitation medicine 2019; 51: 47–53. [DOI] [PubMed] [Google Scholar]
- 45. Raina SK, Razdan S, Nanda R. Prevalence of cerebral palsy in children < 10 years of age in R.S. Pura town of Jammu and Kashmir. Journal of Tropical Pediatrics 2011; 57: 293–5. [DOI] [PubMed] [Google Scholar]
- 46. Toyokawa S, Maeda E, Kobayashi Y. Estimation of the number of children with cerebral palsy using nationwide health insurance claims data in Japan. Developmental Medicine & Child Neurology 2017; 59: 317–21. [DOI] [PubMed] [Google Scholar]
- 47. Yamagishi H, Osaka H, Toyokawa S, et al. Survey on Children with Cerebral Palsy in Tochigi Prefecture, Japan. Pediatrics International 2020; 11: 11. [DOI] [PubMed] [Google Scholar]
- 48. Park MS, Kim SJ, Chung CY, et al. Prevalence and lifetime healthcare cost of cerebral palsy in South Korea. Health Policy 2011; 100: 234–8. [DOI] [PubMed] [Google Scholar]
- 49. Chang MJ, Ma HI, Lu TH. Estimating the prevalence of cerebral palsy in Taiwan: A comparison of different case definitions. Research in Developmental Disabilities 2015; 36: 207–12. [DOI] [PubMed] [Google Scholar]
- 50. Fejes M, Varga B, Hollody K. [Epidemiology, cost and economic impact of cerebral palsy in Hungary]. Ideggyogy Sz 2019; 72: 115–22. [DOI] [PubMed] [Google Scholar]
- 51. Gincota Bufteac E, Andersen GL, Torstein V, et al. Cerebral palsy in Moldova: subtypes, severity and associated impairments. BMC Pediatrics 2018; 18: 332. [DOI] [PMC free article] [PubMed] [Google Scholar]
- 52. Glinianaia SV, Rankin J, Colver A. Cerebral palsy rates by birth weight, gestation and severity in North of England, 1991‐2000 singleton births. Archives of Disease in Childhood 2011; 96: 180–5. [DOI] [PubMed] [Google Scholar]
- 53. Bugler KE, Gaston MS, Robb JE. Distribution and motor ability of children with cerebral palsy in Scotland: a registry analysis. Scottish Medical Journal 2019; 64: 16–21. [DOI] [PubMed] [Google Scholar]
- 54. Robertson CMT, Florencia Ricci M, O'Grady K, et al. Prevalence Estimate of Cerebral Palsy in Northern Alberta: Births, 2008‐2010. Canadian Journal of Neurological Sciences 2017; 44: 366–74. [DOI] [PubMed] [Google Scholar]
- 55. Ray JG, Redelmeier DA, Urquia ML, et al. Risk of cerebral palsy among the offspring of immigrants. PLoS One 2014; 9: e102275. [DOI] [PMC free article] [PubMed] [Google Scholar]
- 56. Oskoui M, Joseph L, Dagenais L, et al. Prevalence of cerebral palsy in Quebec: alternative approaches. Neuroepidemiology 2013; 40: 264–8. [DOI] [PubMed] [Google Scholar]
- 57. Zablotsky B, Black LI. Prevalence of Children Aged 3‐17 Years With Developmental Disabilities, by Urbanicity: United States, 2015‐2018. National health statistics reports 2020; 139: 1–7. [PubMed] [Google Scholar]
- 58. Durkin MS, Benedict RE, Christensen D, et al. Prevalence of Cerebral Palsy among 8‐Year‐Old Children in 2010 and Preliminary Evidence of Trends in Its Relationship to Low Birthweight. Paediatric and Perinatal Epidemiology 2016; 30: 496–510. [DOI] [PMC free article] [PubMed] [Google Scholar]
- 59. Li Q, Kinsman SL, Jenkins DD, et al. Decreasing prevalence of cerebral palsy in birth cohorts in South Carolina using Medicaid, disability service, and hospital discharge data, 1996 to 2009. Developmental Medicine & Child Neurology 2019; 61: 593–600. [DOI] [PMC free article] [PubMed] [Google Scholar]
Associated Data
This section collects any data citations, data availability statements, or supplementary materials included in this article.
Supplementary Materials
Figure S1: Data sources flow chart.
Figure S2: Overall regional birth prevalence of cerebral palsy.
Figure S3: Current overall birth prevalence of cerebral palsy in high‐income countries.
Appendix S1: Search strategy.
Table S1: JBI/supporting data for regions represented in birth prevalence analyses.
Table S2: JBI/supporting data for regions represented in period prevalence analyses.
Table S3: Supporting data for regional trends in pre‐/perinatal cerebral palsy and postneonatal cerebral palsy.
Data Availability Statement
Data sharing is available on request to the authors, and if data is from a register it would require approval from the individual register.