

Abstract
Objective
Anti‐Ro autoantibodies are among the most frequently detected extractable nuclear antigen autoantibodies, mainly associated with primary Sjögren's syndrome (SS), systemic lupus erythematosus (SLE), and undifferentiated connective tissue disease (UCTD). This study was undertaken to determine if there is a common signature for all patients expressing anti–Ro 60 autoantibodies regardless of their disease phenotype.
Methods
Using high‐throughput multiomics data collected from the cross‐sectional cohort in the PRECISE Systemic Autoimmune Diseases (PRECISESADS) study Innovative Medicines Initiative (IMI) project (genetic, epigenomic, and transcriptomic data, combined with flow cytometry data, multiplexed cytokines, classic serology, and clinical data), we used machine learning to assess the integrated molecular profiling of 520 anti–Ro 60+ patients compared to 511 anti–Ro 60– patients with primary SS, patients with SLE, and patients with UCTD, and 279 healthy controls.
Results
The selected clinical features for RNA‐Seq, DNA methylation, and genome‐wide association study data allowed for a clear distinction between anti–Ro 60+ and anti–Ro 60– patients. The different features selected using machine learning from the anti–Ro 60+ patients constituted specific signatures when compared to anti–Ro 60– patients and healthy controls. Remarkably, the transcript Z score of 3 genes (ATP10A, MX1, and PARP14), presenting with overexpression associated with hypomethylation and genetic variation and independently identified using the Boruta algorithm, was clearly higher in anti–Ro 60+ patients compared to anti–Ro 60– patients regardless of disease type. Our findings demonstrated that these signatures, enriched in interferon‐stimulated genes, were also found in anti–Ro 60+ patients with rheumatoid arthritis and those with systemic sclerosis and remained stable over time and were not affected by treatment.
Conclusion
Anti–Ro 60+ patients present with a specific inflammatory signature regardless of their disease type, suggesting that a dual therapeutic approach targeting both Ro‐associated RNAs and anti–Ro 60 autoantibodies should be considered.
INTRODUCTION
Anti‐Ro autoantibodies are among the most frequently detected extractable nuclear antigen (ENA) autoantibodies and are mainly associated with primary Sjögren's syndrome (SS). These autoantibodies are also frequently observed in systemic lupus erythematosus (SLE) and undifferentiated connective tissue disease (UCTD) (1, 2). Additionally, anti‐Ro autoantibodies have been reported in other autoimmune diseases such as systemic sclerosis (SSc), mixed connective tissue disease (MCTD), rheumatoid arthritis (RA), and myositis (3).
Anti‐Ro autoantibodies include reactivity against 2 autoantigens (Ro 52 and Ro 60) encoded by separate genes and are found in distinct cellular compartments (4). Ro 52 is a type I interferon (IFN)– and type II IFN–inducible protein (5, 6) and is a negative regulator of proinflammatory cytokine production (7). Ro 60 antigen binds to ~100 nucleotide noncoding RNAs called human Y RNA (8) and acts as a quality checkpoint for RNA misfolding with molecular chaperones for defective RNA (9).
Findings from previous studies have shown variation in clinical manifestations or outcomes according to the presence or absence of anti‐Ro autoantibodies. Thus, SLE subjects with anti–Ro 60 antibodies have an increased prevalence of skin disease, photosensitivity, and nephritis, along with elevated expression of IFN‐inducible genes in immune cells and tissue samples (10). In primary SS, patients with both anti–Ro 60 and Ro 52 antibodies were distinguished by a higher prevalence of markers of B cell hyperactivity and glandular inflammation (11). Those patients also had earlier disease onset and presented with more systemic extraglandular manifestations, such as leukopenia, hypergammaglobulinemia, and major salivary gland swelling (12). Recently, 2 subgroups of patients with primary SS were defined according to HLA association, Ro 60/SSB antibodies, and clinical manifestations. The Ro 60/SSB antibody–positive subgroup was younger at disease onset and diagnosis and more frequently presented with anemia, leukopenia, hypergammaglobulinemia, purpura, major salivary gland swelling, lymphadenopathy, and lymphoma. These results confirmed an overall more severe disease phenotype in patients who were Ro 60/SSB antibody–positive compared to patients negative for both anti–Ro 60 and anti‐SSB antibodies (13). Anti–Ro 60 reactivity alone strongly correlated with oral ulcers, a characteristic manifestation of SLE, while the combination of anti–Ro 60 and anti–Ro 52 was significantly more prevalent in patients with interstitial kidney disease and sicca syndrome symptoms (14).
Due to the presence of anti–Ro 60 antibodies in different autoimmune diseases and the reported clinical manifestations that characterize this expression, the question remains of if there is a common signature for all patients expressing anti–Ro 60 autoantibodies that would allow physicians to consider a suitable therapy regardless of disease phenotype.
Using algorithms derived from machine learning, the present study was undertaken to determine the precise signature of anti–Ro 60+ patients in diseases where this autoantibody is the most frequently observed (primary SS, SLE, and UCTD) using high‐throughput multiomics data collected in the PRECISE Systemic Autoimmune Diseases (PRECISESADS) study Innovative Medicines Initiative Joint Undertaking project (genetic, epigenomic, and transcriptomic data, combined with flow cytometry data, multiplexed cytokines, classic serology, and clinical data). In this study, we performed integrated molecular profiling of 520 anti–Ro 60+ patients compared to 511 anti–Ro 60– patients and 279 healthy controls. We then observed whether this signature was also present in the 41 of 725 anti–Ro 60+ patients with other autoimmune diseases such as MCTD, RA, and SSc, all from the same PRECISESADS cohort. See Appendix A for a list of members of the PRECISESADS Clinical Consortium and members of the PRECISESADS Flow Cytometry Consortium.
PATIENTS AND METHODS
Patient population
The present study was conducted in 1,755 patients (367 with primary SS, 508 with SLE, 156 with UCTD, 307 with RA, 327 with SSc, and 90 with MCTD) and 279 healthy controls included in the European multicenter cross‐sectional study of the PRECISESADS IMI consortium (15). Classification criteria were the 2010 American College of Rheumatology (ACR)/European Alliance of Associations for Rheumatology (EULAR) RA classification criteria (16), the 1997 update of 1982 ACR SLE criteria (17), 2013 ACR/EULAR SSc classification criteria (18), or the American–European Consensus Group primary SS classification criteria (19) with at least the presence of anti‐Ro and/or a positive focus score on minor salivary gland biopsy, MCTD using the Alarcon‐Segovia criteria (20), and UCTD in patients with clinical features of systemic autoimmune diseases that did not fulfill any of the above criteria or any other systemic autoimmune disease criteria for at least 2 years (with the presence of nonspecific antibodies, antinuclear antibodies [ANAs] ≥1:160). Patients fulfilling 3 of 4 SLE classification criteria and patients with early SSc (21) were not classified as having UCTD. Recruitment occurred between December 2014 and October 2017 involving 19 institutions in 9 countries (Austria, Belgium, France, Germany, Hungary, Italy, Portugal, Spain, and Switzerland).
The PRECISESADS study adhered to the standards set by International Council for Harmonisation Guidelines for Good Clinical Practice and the ethics principles that have their origin in the 2013 Declaration of Helsinki. Informed consent was obtained from each patient prior to inclusion in the study. This study protocol was approved the Ethics Review Boards of the 19 participating institutions. Protection of the confidentiality of records that could identify included subjects was ensured as defined according to the European Union Directive 2001/20/EC and the applicable national and international requirements relating to data protection in each participating country. The cross‐sectional cohort study and inception cohort study are registered on ClinicalTrials.gov (clinicalTrials.gov identifiers: NCT02890121 and NCT02890134, respectively). The anti–Ro 60+ signature identified using machine learning was validated using the transcriptome of 106 patients in the PRECISESADS inception study (ClinicalTrials.gov identifier: NCT02890134), who were followed up and had samples collected at the time of recruitment and at 6 and/or 14 months. Of note, patients in the inception cohort were diagnosed within less than a year and had not received high doses of immunosuppressants, cyclophosphamide, or belimumab at least 3 months prior to recruitment. For time points 6 and 14 months, patients could receive any standard of care therapy prescribed by their physician. Healthy controls were individuals not receiving long‐term medication, without any inflammatory autoimmune, allergic, or infectious condition, and without a history of autoimmune disease, particularly thyroid disease or other diseases that may modify cellular profiles in blood.
Determination of autoantibodies, ANAs, free light chains, and complement fractions
For all samples collected between March 2016 and June 2019, all autoantibodies were determined at a single center (University Hospital of Brest). Anti‐ENA (comprising Sm, U1 RNP, Scl‐70, Ro 52, Ro 60, and SSB) and specific autoantibodies anti–Ro 52 and anti–Ro 60, anti–cyclic citrullinated peptide 2 (anti‐CCP2), IgG and IgM anti‐β2GPI, IgG, and IgM anticardiolipin [aCL], anti–double‐stranded DNA (anti‐dsDNA), and anticentromere autoantibody levels were determined using a chemiluminescent IDS‐iSYS immunoanalyser (Immunodiagnostic Systems). Rheumatoid factor (RF) was determined regardless of the isotypes measured by turbidimetry using SPAPLUS (Binding Site), as well as C3 and C4 complement fractions and kappa and lamba free light chains. Samples from all patients and healthy controls were tested. See Supplementary Methods for more details regarding sample and data collection (available on the Arthritis & Rheumatology website at http://onlinelibrary.wiley.com/doi/10.1002/art.42243). Autoantibodies and RF distribution were described according to concentration level (negative, low, medium, or elevated/high), and the proportion and the concentration across anti–Ro 60+ patients and anti–Ro 60– patients in each disease were compared using Fisher's exact test. Complements C3 and C4 and circulating free light chains have been described in continued concentrations expressed in gm/liter and mg/liter respectively, and Kruskal‐Wallis testing was used to compare the concentration level across the anti–Ro 60+ patients and anti–Ro 60– patients in each disease. Anti–Ro 60 autoantibody–positive samples were also classified according to their degree of positivity. Patients with positive samples with concentrations between 10 and 640 arbitrary units (AU)/ml were considered anti–Ro 60low patients, whereas those with samples with a concentration > 640 AU/ml were considered anti–Ro 60high patients.
ANA detection was performed using an in‐house technique on HEp‐2 cells (ATCC strain CCL23). Each sample was systematically tested at 5 successive dilutions (1:80, 1:160, 1:320, 1:640, 1:1,280), and the threshold of positivity was set at 1:160, according to international recommendations (22). Information regarding current or past presence of hypergammaglobulinemia was collected in each center at the time of inclusion and defined as, within 12 weeks, a serum IgG value greater than the upper limit of normal and/or gammaglobulin values >20%.
Clinical data
Clinical data obtained from 520 anti–Ro 60+ patients (306 with primary SS, 175 with SLE, and 39 with UCTD), 511 anti–Ro 60– patients (61 with primary SS, 333 with SLE, and 117 with UCTD), and 279 healthy controls were collected using an electronic case report form. Clinical data included patient's age, sex, ethnicity, disease duration, the physician global assessment of disease activity (PhGA), fulfillment of Systemic Lupus Erythematosus Disease Activity Index (SLEDAI) (23) for SLE, fulfillment of EULAR Sjögren's Syndrome Disease Activity Index (ESSDAI) (24) for primary SS, and current use of treatments.
Other available data
High‐dimensional omics genotypes, RNA‐Seq data, DNA methylation data, and the proportions of relevant cell types using custom flow cytometry marker panels were analyzed in whole blood samples. Additional information, such as cytokine levels, chemokine levels, and inflammatory mediator expression levels were obtained from serum samples. All of these parameters are described in greater detail in the Supplementary Methods (http://onlinelibrary.wiley.com/doi/10.1002/art.42243), and repartition of patients with a full data set per omic type and across diseases is shown in Supplementary Table 1.
Table 1.
Demographic and clinical characteristics of the healthy controls, patients with primary SS, those with SLE, and those with UCTD according to anti–Ro 60 expression (anti–Ro 60+ patients compared to anti–Ro 60– patients)*
| Characteristic | Value |
|---|---|
| Healthy controls | |
| No. of patients | 279 |
| Age, mean ± SD years | 52 ± 9 |
| Sex, female | 262 (94) |
| Sex, male | 17 (6.1) |
| Ethnicity | |
| American Indian/Alaska Native | 0 (0) |
| Asian | 2 (0.7) |
| Black/African American | 0 (0) |
| Caucasian/White | 277 (99) |
| Native Hawaiian/Other Pacific Islander | 0 (0) |
| Other | 0 (0) |
| Obesity† | 16 (5.8) |
| Smoking‡ | 38 (14) |
| Primary SS | |
| No. of patients | 367 |
| Anti–Ro 60– | 61 |
| Anti–Ro 60+ | 306 |
| Age, mean ± SD years | |
| Anti–Ro 60– | 59 ± 13 |
| Anti–Ro 60+ | 57 ± 13 |
| P § | 0.3 |
| Sex, female | |
| Anti–Ro 60– | 57 (93) |
| Anti–Ro 60+ | 293 (96) |
| Sex, male | |
| Anti–Ro 60– | 4 (6.6) |
| Anti–Ro 60+ | 13 (4.2) |
| P | 0.5 |
| Ethnicity | |
| American Indian/Alaska Native | |
| Anti–Ro 60– | 0 (0) |
| Anti–Ro 60+ | 0 (0) |
| Asian | |
| Anti–Ro 60– | 0 (0) |
| Anti–Ro 60+ | 2 (0.7) |
| Black/African American | |
| Anti–Ro 60– | 0 (0) |
| Anti–Ro 60+ | 1 (0.3) |
| Caucasian/White | |
| Anti–Ro 60– | 61 (100) |
| Anti–Ro 60+ | 299 (98) |
| Native Hawaiian/Other Pacific Islander | |
| Anti–Ro 60– | 0 (0) |
| Anti–Ro 60+ | 0 (0) |
| Other | |
| Anti–Ro 60– | 0 (0) |
| Anti–Ro 60+ | 4 (1.3) |
| P | >0.9 |
| Obesity§ | |
| Anti–Ro 60– | 7 (12) |
| Anti–Ro 60+ | 37 (12) |
| P | >0.9 |
| Smoking¶ | |
| Anti–Ro 60– | 7 (12) |
| Anti–Ro 60+ | 29 (10.0) |
| P | 0.6 |
| Disease duration, mean ± SD years# | |
| Anti–Ro 60– | 9 ± 8 |
| Anti–Ro 60+ | 10 ± 8 |
| P | 0.2 |
| Steroid usage | |
| No | |
| Anti–Ro 60– | 45 (74) |
| Anti–Ro 60+ | 244 (80) |
| Yes | |
| Anti–Ro 60– | 16 (26) |
| Anti–Ro 60+ | 62 (20) |
| P | 0.3 |
| Antimalarials | |
| No | |
| Anti–Ro 60– | 37 (61) |
| Anti–Ro 60+ | 194 (63) |
| Yes | |
| Anti–Ro 60– | 24 (39) |
| Anti–Ro 60+ | 112 (37) |
| P | 0.7 |
| Immunosuppressants | |
| No | |
| Anti–Ro 60– | 47 (77) |
| Anti–Ro 60+ | 264 (86) |
| Yes | |
| Anti–Ro 60– | 14 (23) |
| Anti–Ro 60+ | 42 (14) |
| P | 0.067 |
| Biologics** | |
| No | |
| Anti–Ro 60– | 10 (100) |
| Anti–Ro 60+ | 29 (100) |
| Yes | |
| Anti–Ro 60– | 0 (0) |
| Anti–Ro 60+ | 0 (0) |
| P | >0.9 |
| PhGA, mean ± SD score†† | |
| Anti–Ro 60– | 30 ± 18 |
| Anti–Ro 60+ | 24 ± 19 |
| P | 0.007 |
| ESSDAI, mean ± SD score‡‡ | |
| Anti–Ro 60– | 4 ± 6 |
| Anti–Ro 60+ | 5 ± 5 |
| P | 0.11 |
| ESSPRI, mean ± SD score§§ | |
| Anti–Ro 60– | 5.59 ± 2.29 |
| Anti–Ro 60+ | 4.71 ± 2.33 |
| P | 0.029 |
| SLE | |
| No. of patients | 508 |
| Anti–Ro 60– | 333 |
| Anti–Ro 60+ | 175 |
| Age, mean ± SD years | |
| Anti–Ro 60– | 46 ± 14 |
| Anti–Ro 60+ | 45 ± 13 |
| P | 0.6 |
| Sex, female | |
| Anti–Ro 60– | 302 (91) |
| Anti–Ro 60+ | 163 (93) |
| Sex, male | |
| Anti–Ro 60– | 31 (9.3) |
| Anti–Ro 60+ | 12 (6.9) |
| P | 0.3 |
| Ethnicity | |
| American Indian/Alaska Native | |
| Anti–Ro 60– | 0 (0) |
| Anti–Ro 60+ | 0 (0) |
| Asian | |
| Anti–Ro 60– | 3 (0.9) |
| Anti–Ro 60+ | 1 (0.6) |
| Black/African American | |
| Anti–Ro 60– | 3/333 (0.9) |
| Anti–Ro 60+ | 9/175 (5.1) |
| Caucasian/White | |
| Anti–Ro 60– | 318 (95) |
| Anti–Ro 60+ | 162 (93) |
| Native Hawaiian/Other Pacific Islander | |
| Anti–Ro 60– | 0 (0) |
| Anti–Ro 60+ | 1 (0.6) |
| Other | |
| Anti–Ro 60– | 9 (2.7) |
| Anti–Ro 60+ | 2 (1.1) |
| P | 0.010 |
| Obesity¶¶ | |
| Anti–Ro 60– | 23 (7.2) |
| Anti–Ro 60+ | 15 (8.8) |
| P | 0.5 |
| Smoking## | |
| Anti–Ro 60– | 60 (19) |
| Anti–Ro 60+ | 30 (18) |
| P | 0.8 |
| Disease duration, mean ± SD years | |
| Anti–Ro 60– | 14 ± 10 |
| Anti–Ro 60+ | 12 ± 9 |
| P | 0.079 |
| Steroid usage | |
| No | |
| Anti–Ro 60– | 179 (54) |
| Anti–Ro 60+ | 77 (44) |
| Yes | |
| Anti–Ro 60– | 154 (46) |
| Anti–Ro 60+ | 98 (56) |
| P | 0.037 |
| Antimalarials | |
| No | |
| Anti–Ro 60– | 112 (34) |
| Anti–Ro 60+ | 45 (26) |
| Yes | |
| Anti–Ro 60– | 221 (66) |
| Anti–Ro 60+ | 130 (74) |
| P | 0.066 |
| Immunosuppressants | |
| No | |
| Anti–Ro 60– | 234 (70) |
| Anti–Ro 60+ | 111 (63) |
| Yes | |
| Anti–Ro 60– | 99 (30) |
| Anti–Ro 60+ | 64 (37) |
| P | 0.12 |
| Biologics*** | |
| No | |
| Anti–Ro 60– | 27 (100) |
| Anti–Ro 60+ | 17 (100) |
| Yes | |
| Anti–Ro 60– | 0 (0) |
| Anti–Ro 60+ | 0 (0) |
| P | >0.9 |
| PhGA, mean ± SD score††† | |
| Anti–Ro 60– | 19 ± 18 |
| Anti–Ro 60+ | 21 ± 17 |
| P | 0.067 |
| SLEDAI, mean ± SD score‡‡‡ | |
| Anti–Ro 60– | 4 ± 6 |
| Anti–Ro 60+ | 5 ± 5 |
| P | 0.2 |
| UCTD | |
| No. of patients | 156 |
| Anti–Ro 60– | 117 |
| Anti–Ro 60+ | 39 |
| Age, mean ± SD years | |
| Anti–Ro 60– | 47 ± 12 |
| Anti–Ro 60+ | 46 ± 12 |
| P | 0.6 |
| Sex, female | |
| Anti–Ro 60– | 108 (92) |
| Anti–Ro 60+ | 36 (92) |
| Sex, male | |
| Anti–Ro 60– | 9 (7.7) |
| Anti–Ro 60+ | 3 (7.7) |
| P | >0.9 |
| Ethnicity | |
| American Indian/Alaska Native | |
| Anti–Ro 60– | 1 (0.9) |
| Anti–Ro 60+ | 0 (0) |
| Asian | |
| Anti–Ro 60– | 0 (0) |
| Anti–Ro 60+ | 1 (2.6) |
| Black/African American | |
| Anti–Ro 60– | 1 (0.9) |
| Anti–Ro 60+ | 0 (0) |
| Caucasian/White | |
| Anti–Ro 60– | 113 (97) |
| Anti–Ro 60+ | 38 (97) |
| Native Hawaiian/Other Pacific Islander | |
| Anti–Ro 60– | 0 (0) |
| Anti–Ro 60+ | 0 (0) |
| Other | |
| Anti–Ro 60– | 2 (1.7) |
| Anti–Ro 60+ | 0 (0) |
| P | 0.6 |
| Obesity# | |
| Anti–Ro 60– | 17 (15) |
| Anti–Ro 60+ | 6 (15) |
| P | >0.9 |
| Smoking§§§ | |
| Anti–Ro 60– | 17 (15) |
| Anti–Ro 60+ | 6 (15) |
| P | >0.9 |
| Disease duration, mean ± SD years¶¶¶ | |
| Anti–Ro 60– | 6 ± 6 |
| Anti–Ro 60+ | 7 ± 8 |
| P | >0.9 |
| Steroid usage | |
| No | |
| Anti–Ro 60– | 78 (67) |
| Anti–Ro 60+ | 38 (97) |
| Yes | |
| Anti–Ro 60– | 39 (33) |
| Anti–Ro 60+ | 1 (2.6) |
| P | <0.001 |
| Antimalarials | |
| No | |
| Anti–Ro 60– | 62 (53) |
| Anti–Ro 60+ | 23 (59) |
| Yes | |
| Anti–Ro 60– | 55 (47) |
| Anti–Ro 60+ | 16 (41) |
| P | 0.5 |
| Immunosuppressants | |
| No | |
| Anti–Ro 60– | 100 (85) |
| Anti–Ro 60+ | 38 (97) |
| Yes | |
| Anti–Ro 60– | 17 (15) |
| Anti–Ro 60+ | 1 (2.6) |
| P | 0.045 |
| Biologics### | |
| No | |
| Anti–Ro 60– | 23 (85) |
| Anti–Ro 60+ | 7 (100) |
| Yes | |
| Anti–Ro 60– | 4 (15) |
| Anti–Ro 60+ | 0 (0) |
| P | 0.6 |
| PhGA, mean ± SD score**** | |
| Anti–Ro 60– | 26 ± 21 |
| Anti–Ro 60+ | 18 ± 15 |
| P | 0.12 |
Except where indicated otherwise, values are the number (%) of patients. Significance was determined by Wilcoxon's rank sum test, Fisher's exact test, or Pearson's chi‐square test. SS = Sjögren's syndrome; SLE = systemic lupus erythematosus; UCTD = undifferentiated connective tissue disease; PhGA = physician global assessment of disease activity; ESSDAI = European Alliance of Associations for Rheumatology (EULAR) Sjögren's Syndrome Disease Activity Index; ESSPRI = EULAR Sjögren's Syndrome Patient Reported Index.
Data were missing from 1 patient.
Data were missing from 10 patients.
Data were missing from 3 patients and 10 patients who were anti–Ro 60– and anti–Ro 60+, respectively.
Data were missing from 4 patients and 15 patients who were anti–Ro 60– and anti–Ro 60+, respectively.
Data were missing from 1 patient each who was anti–Ro 60– and anti–Ro 60+.
Data were missing from 51 patients and 277 patients who were anti–Ro 60– and anti–Ro 60+, respectively.
Data were missing from 2 patients and 26 patients who were anti–Ro 60– and anti–Ro 60+, respectively.
Data were missing from 15 patients and 112 patients who were anti–Ro 60– and anti–Ro 60+, respectively.
Data were missing from 17 patients and 167 patients who were anti–Ro 60– and anti–Ro 60+, respectively.
Data were missing from 12 patients and 15 patients who were anti–Ro 60– and anti–Ro 60+, respectively.
Data were missing from 21 patients and 11 patients who were anti–Ro 60– and anti–Ro 60+, respectively.
Data were missing from 306 patients and 158 patients who were anti–Ro 60– and anti–Ro 60+, respectively.
Data were missing from 16 patients and 15 patients who were anti–Ro 60– and anti–Ro 60+, respectively.
Data were missing from 159 patients and 96 patients who were anti–Ro 60– and anti–Ro 60+, respectively.
Data were missing from 2 patients who were anti–Ro 60–.
Data were missing from 1 patient who was anti–Ro 60–.
Data were missing from 90 patients and 32 patients who were anti–Ro 60– and anti–Ro 60+, respectively.
Data were missing from 5 patients and 2 patients who were anti–Ro 60– and anti–Ro 60+, respectively.
Dimensionality reduction
Our strategy for dimensionality reduction was driven by artificial intelligence approaches involving machine learning. Patients were first grouped according to their disease (primary SS, SLE, or UCTD). We then separately considered each of the data sets describing these patients (RNA‐Seq, DNA methylation, GWAS, and flow cytometry associated with cytokine expression). For each of these data sets, we performed a Boruta analysis (25) to discriminate between anti–Ro 60+ patients and anti–Ro 60– patients in order to extract features that significantly distinguish the 2 groups within each data set. The Boruta algorithm was used to create an extended data set by adding copies of each feature in the original data set. Values of the duplicated features were then shuffled, and the resulting features were called “shadow features.” The random permutation of modality within these features lead to the removal of any preexisting correlation with the target variable, in our case, anti–Ro 60 positivity. Once shadow features were generated, a random forest classifier was run on the whole data set and Z scores were computed for all clinical features (real and shadow). Shadow features were then sorted according to their Z score, and the maximum score was stored in memory as a threshold. The algorithm marked each non‐shadow feature with a Z score above this threshold. Finally, Boruta findings indicated the clinical features that had Z scores that were significantly lower than the shadow features with maximum Z scores. These features were considered unimportant and were removed from the data set before removing all shadow features and returning a clean data set.
We ran the Boruta algorithm for 300 iterations with a maximum depth set to 5. Extracted features were run on a linear discriminant analysis (LDA), which was only used to visually assess the distinction between anti–Ro 60+ patients, anti–Ro 60– patients, and healthy controls. No classification metrics were computed using LDA.
RESULTS
Specific biologic and clinical features of anti–Ro 60+ patients
We compared the characteristics of the 279 anti–Ro 60– healthy controls and 520 anti–Ro 60+ patients (306 with primary SS, 175 with SLE, and 39 with UCTD) to the 511 anti–Ro 60– patients (61 with primary SS, 333 with SLE, and 117 with UCTD) (Table 1). Regarding the antibody profile, compared to anti–Ro 60– patients, anti–Ro 60+ patients from the 3 diseases had significantly increased levels of ANAs, kappa and lambda free light chains, RF, anti–Ro 52, and anti‐SSB antibodies (Figure 1 and Supplementary Table 2). Both anti–Ro 52 autoantibody levels and anti‐SSB autoantibody levels were also significantly increased in anti–Ro 60high patients compared to anti–Ro 60low patients. Past and/or present hypergammaglobulinemia was more common in anti–Ro 60+ patients regardless of the disease (Supplementary Figure 1A, http://onlinelibrary.wiley.com/doi/10.1002/art.42243). No difference in terms of the disease activity score (ESSDAI, SLEDAI, PhGA) was observed between anti–Ro 60–patients and anti–Ro 60+ patients (Supplementary Figure 1B). However, in those with primary SS, anti–Ro 60+ patients had lower EULAR Sjögren's Syndrome Patient Reported Index (ESSPRI) (26) scores, and the higher the anti–Ro 60 scale, the lower the ESSPRI score and its components (dryness, fatigue, and pain) (Supplementary Figure 1C, http://onlinelibrary.wiley.com/doi/10.1002/art.42243).
Figure 1.
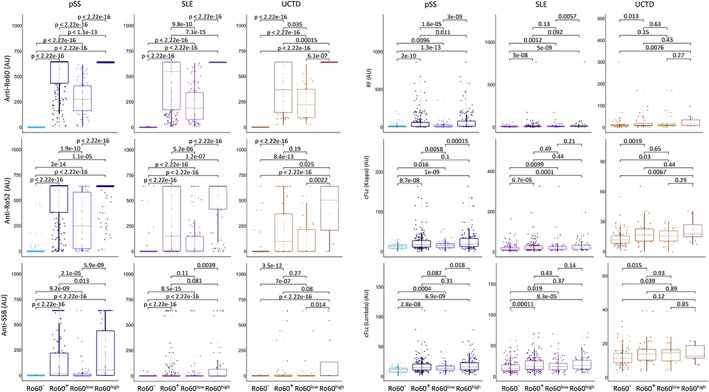
Serologic distributions in patients with primary Sjögren's syndrome (pSS), those with systemic lupus erythematosus (SLE), and those with undifferentiated connective tissue disease (UCTD). The presence of anti–Ro 52, anti–Ro 60, anti‐SSB antibodies, rheumatoid factor (RF), and circulating free light chains (cFLc) were measured in serum samples from 520 anti–Ro 60+ patients (306 with primary SS, 175 with SLE, and 39 with UCTD) and 511 anti–Ro 60– patients (61 with primary SS, with 333 SLE, and 117 with UCTD) from the same center using an automated chemiluminescent IDS‐iSYS immunoanalyser. Turbidimetry was used for the detection of RF and circulating free light chains (kappa and lambda). Anti–Ro 60+ patients were divided in 2 groups: anti–Ro 60low patients (samples with concentrations between 10 and 640 arbitrary units [AU]/ml) and anti–Ro 60high patients (samples with concentrations >640 AU/ml). Statistical significance was determined by 2‐tailed pairwise Wilcoxon's rank sum test. Results are shown as box plots, in which each box represents the interquartile range, lines inside the box represent the median, and lines outside the box represent the 10th and 90th percentiles; symbols represent individual samples. Color figure can be viewed in the online issue, which is available at http://onlinelibrary.wiley.com/doi/10.1002/art.42243/abstract.
Identification of a specific signature common to anti–Ro 60+ patients in the different omics data sets using machine learning
We used the Boruta algorithm (25) with all data sets to extract features that significantly contributed to the prediction of which patients were anti–Ro 60+ according to the different omics (RNA‐Seq, DNA methylation, GWAS, and cytokine expression associated with cell subset distribution). A total of 923 features were selected from RNA‐Seq variables, 64 features were selected from DNA methylation variables, 5,749 features were selected from GWAS variables (Supplementary Tables [Link], [Link] respectively, http://onlinelibrary.wiley.com/doi/10.1002/art.42243), and 8 features were selected from the association of cytokine expression levels and cell subset distribution. An LDA for each omics is shown in Figure 2. We considered the combined analysis of patients with primary SS, patients with SLE, and patients with UCTD within the framework of the Boruta results. Features were selected from disease data sets to capture the maximum amount of discriminating information. We then considered the combination of Boruta results for primary SS, SLE, and UCTD to generate the final signature. Of note, selected features for RNA‐Seq and GWAS data clearly distinguished between anti–Ro 60+ patients and anti–Ro 60– patients. Remarkably, even if data from healthy controls were not used for feature selection, their integration into the different LDA based on the Boruta algorithm–identified features that discriminate between anti–Ro 60+ patients and anti–Ro 60– patients, resulted in a separation from patients. These results demonstrate that the different features selected using machine learning from the anti–Ro 60+ patients constitute specific signatures when compared to anti–Ro 60– patients and healthy controls.
Figure 2.
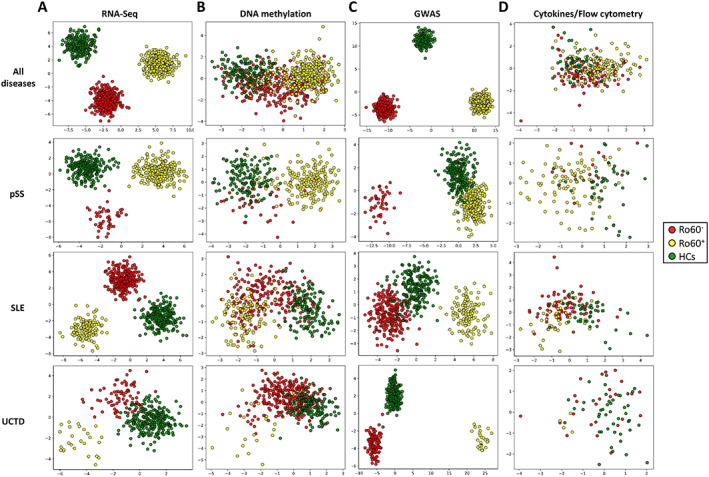
Identification of specific signatures common to anti–Ro 60+ patients in different omics data sets using machine learning. Linear discriminant analysis of features selected with the Boruta algorithm, assessed among all 3 diseases combined or separately among patients with SLE, those with UCTD, and those with primary SS. A total of 923 features were selected from RNA‐Seq data (A), 64 features were selected from methylation data (B), 5,749 features were selected from genome‐wide association study (GWAS) data (C), and 8 features were selected from flow cytometry distribution and cytokine expression data (D). Symbols represent individual samples from anti–Ro 60– patients, anti–Ro 60+ patients, and healthy controls (HCs). See Figure 1 for other definitions.
Characterization and pathway analysis of the transcriptomic signature found in anti–Ro 60+ patients
The 923 transcripts identified using machine learning to discriminate anti–Ro 60+ patients (Figure 2A) were analyzed using Reactome (27). The 25 most relevant pathways are shown in Supplementary Table 6 (http://onlinelibrary.wiley.com/doi/10.1002/art.42243). Anti–Ro 60+ patients were enriched in genes involved in IFN signaling (type I and II), cytokine signaling, activation of C3 and C5, antiviral response by IFN‐stimulated genes, and interleukin‐10 (IL‐10) signaling.
To further understand the IFN signature, we analyzed IFN‐annotated modules previously described as strongly up‐regulated in SLE (28, 29). The different type I and type II IFN Z scores were increased in anti–Ro 60+ patients regardless of the disease (Figure 3).
Figure 3.
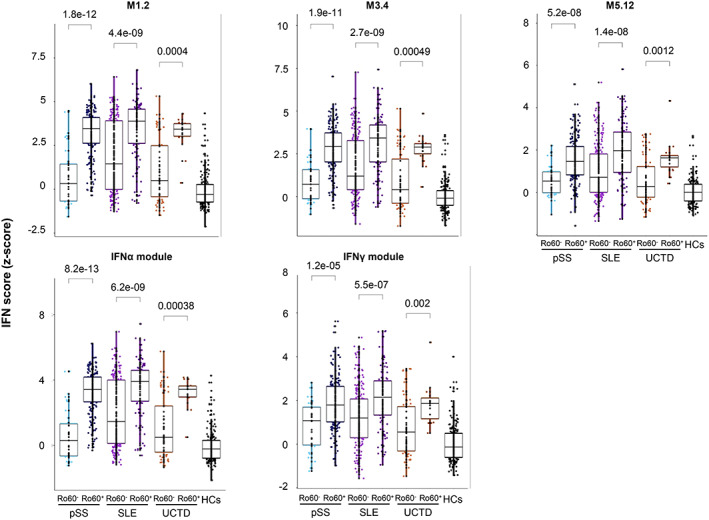
Anti–Ro 60+ patients have a higher interferon (IFN) signature regardless of the disease. IFN Z score analyses were performed with 411 anti–Ro 60+ patients (249 with primary SS, 136 with SLE, and 26 with UCTD) compared to 392 anti–Ro 60– patients (46 with primary SS, 267 with SLE, and 79 with UCTD) and 254 healthy controls. The genes from the M1.2 module (IFI44, IFI44L, IFIT1, and MX1) are induced by IFNα, while genes from both M1.2 and M3.4 (ZBP1, IFIH1, EIF2AK2, PARP9, and GBP4) are up‐regulated by IFNβ. The genes from the M5.12 module (PSMB9, NCOA7, TAP1, ISG20, and SP140) are poorly induced by IFNα and IFNβ alone, while they are up‐regulated by IFNγ. Moreover, transcripts belonging to M3.4 and M5.12 are only fully induced by a combination of type I and type II IFNs. Other modules identified genes preferentially induced by IFNα (IFIT1, IFI44, and EIF2AK2) or IFNγ (IRF1, GBP1, and SERPING1). Statistical significance was determined by 2‐tailed pairwise Wilcoxon's rank sum test. Results are shown as box plots, in which each box represents the interquartile range, lines inside the box represent the median, and lines outside the box represent the 10th and 90th percentiles; symbols represent individual samples. HCs = healthy controls (see Figure 1 for other definitions). Color figure can be viewed in the online issue, which is available at http://onlinelibrary.wiley.com/doi/10.1002/art.42243/abstract.
Characterization and pathway analysis of the DNA methylation signature found in anti–Ro 60+ patients
The 37 genes associated with the 64 CpGs identified using machine learning to discriminate anti–Ro 60+ patients (Figure 2B) were analyzed using Reactome. Interestingly, the most relevant pathways were the same as those previously found in the transcriptome analysis, such as type I and type II IFN signaling, cytokine signaling in the immune system, and antiviral response by IFN‐stimulated genes (Supplementary Table 7, http://onlinelibrary.wiley.com/doi/10.1002/art.42243).
Among these 37 differentially methylated genes, 33 methylated genes were also found using the Boruta algorithm in the RNA‐Seq analysis. The interaction networks of these 33 common genes, determined using STRING with a confidence cutoff of 0.4, revealed and confirmed the common IFN signature (Supplementary Figure 2, http://onlinelibrary.wiley.com/doi/10.1002/art.42243) (30). Of note, all transcripts were overexpressed in anti–Ro 60+ patients regardless of the disease, and global hypomethylation of CpGs was observed for all but 1 gene (ISG15). For 1 gene (IFITM1), up to 8 hypomethylated CpGs were assessed (Supplementary Figure 3, http://onlinelibrary.wiley.com/doi/10.1002/art.42243).
GWAS analysis of anti–Ro 60+ patients
Our machine learning approach identified 5,749 single‐nucleotide polymorphisms (SNPs) that were able to discriminate anti–Ro 60+ patents from anti–Ro 60– patients (Figure 2C). Interestingly, 3 of these SNPs were located on genes previously indicated by the algorithm from the previous RNA‐Seq and DNA methylation analyses (Figure 4A). The 3 corresponding genes were ATP10A, MX1, and PARP14. Remarkably, the transcript Z score of these 3 genes was clearly higher in anti–Ro 60+ patients compared to anti–Ro 60– patients but was also higher in anti–Ro 60high compared to anti–Ro 60low patients when all diseases were merged (Figure 4B). The same was true in all the diseases and constituted a clear signature (Figure 4C). Given the strong association between anti–Ro 60 and anti–Ro 52/tripartite motif–containing protein 21 (TRIM21) antibodies, we considered that positivity for anti–Ro 52/TRIM21 may define the signature. We then divided patients with primary SS, patients with SLE, and patients with UCTD into 3 groups (anti–Ro 60–/anti–Ro 52–, anti–Ro 60+/anti–Ro 52–, and anti–Ro 60+/anti–Ro 52+) and assessed the anti–Ro 60 signature identified using the transcript Z score of the 3 genes (ATP10A, MX1, and PARP14). Z scores were higher in anti–Ro 60+/Ro 52– patients compared to anti–Ro 60–/anti–Ro 52– patients with primary SS and those with SLE. In contrast, the Z scores were only higher in anti–Ro 60+/anti–Ro 52+ primary SS patients compared to anti–Ro 60+/anti–Ro 52– patients with primary SS, and no significant difference was observed in SLE patients and UCTD patients (Supplementary Figure 4A, http://onlinelibrary.wiley.com/doi/10.1002/art.42243).
Figure 4.
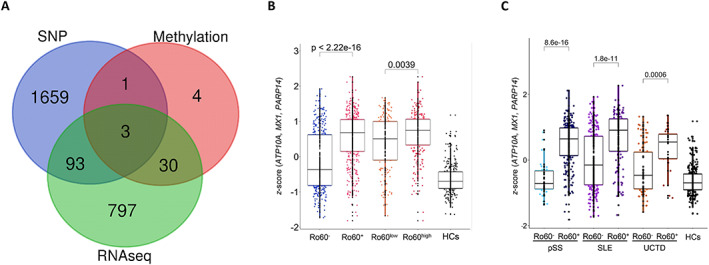
Three genes common to RNA‐Seq data, DNA methylation data, and GWAS findings used to characterize anti–Ro 60+ patients. A, Venn diagram showing the number of overlapping genes according to the different omics data analyses conducted using machine learning (RNA‐Seq, DNA methylation, and single‐nucleotide polymorphisms [SNPs]) to discriminate anti–Ro 60+ patients from anti–Ro 60– patients. B, ATP10/MX1/PARP14 Z score analyses in 803 patients and 254 healthy controls (HCs) according to anti–Ro 60 expression. C, ATP10/MX1/PARP14 Z score analyses in 295 patients with primary SS, 403 patients with SLE, and 105 patients with UCTD and 254 healthy controls. Statistical significance was determined by 2‐tailed pairwise Wilcoxon's rank sum test. Results are shown as box plots, in which each box represents the interquartile range, lines inside the box represent the median, and lines outside the box represent the 10th and 90th percentiles; symbols represent individual samples. See Figure 1 for other definitions. Color figure can be viewed in the online issue, which is available at http://onlinelibrary.wiley.com/doi/10.1002/art.42243/abstract.
We also considered that anti–Ro 60 positivity may just be a marker of B cell reactivity, given that the majority of anti–Ro 60– patients were ENA negative. We then assessed the transcript Z score of the 3 genes (ATP10A, MX1, and PARP14) in 5 groups of patients regardless of disease: patients without any autoantibodies, anti–Ro 60–/anti–Ro 52+ patients negative for any of the autoantibodies analyzed (anti‐RNP, anti‐Sm, anti‐SSB, anti–Scl‐70, anti‐CCP, anti‐dsDNA, antimyeloperoxidase, anti–proteinase 3, anti–CENP‐B), anti–Ro 60–/anti‐Ro 52+ patients who were positive for any other autoantibodies, anti–Ro 60–/anti‐Ro 52– patients who were positive for any of the autoantibodies, and anti–Ro 60+ patients. Z scores were clearly higher in anti–Ro 60+ patients compared to all the other groups (Supplementary Figure 4B, http://onlinelibrary.wiley.com/doi/10.1002/art.42243). All these data confirm that the determined signature is specific to anti–Ro 60+ patients and is not just a marker of B cell activation or due to the presence of any other autoantibody.
Characterization of the flow cytometry signature and cytokine expression in anti–Ro 60+ patients
Machine learning was used to identify 6 parameters among flow cytometry data and 2 parameters among cytokine expression data (assessed using Luminex‐based quantitative assay) to discriminate anti–Ro 60+ patients from anti–Ro 60– patients (Figure 2D). The robustness of the 6 flow cytometry features was poor and was only associated with 1 disease (Supplementary Figure 5, http://onlinelibrary.wiley.com/doi/10.1002/art.42243). Interestingly however, cytokine expression in serum samples showed an increase of IFNγ‐induced protein (CXCL10/IFNγ‐inducible 10‐kd protein) and down‐regulation of IL‐1 R2, the decoy receptor for cytokines belonging to the IL‐1 family, in anti–Ro 60+ patients regardless of disease (Supplementary Figure 5).
Established common signature between anti–Ro 60+ patients with primary SS, those with SLE, or those with UCTD and patients with RA, those with SSc, or those with MCTD expressing anti–Ro 60 antibodies and showing stable antibody expression over time
To confirm the robustness of the identified signature, we observed whether this signature was also present in an independent cohort of 106 newly diagnosed patients with primary SS, those with SLE, or those with UCTD from the inception cohort of the PRECISESADS study, which provided an additional validation data set to test the generalization of our signature in patients whose samples were not used for the feature selection process. At inclusion (first time point), our study included 46 anti–Ro 60+ patients and 60 anti–Ro 60– patients. Again, using the 923 transcripts of the RNA‐Seq signature, the LDA findings showed a clear separation between anti–Ro 60+ and anti–Ro 60– patients regardless of the disease (Supplementary Figure 6A). Furthermore, the Z scores for the 33 genes identified using the Boruta algorithm that were common to RNA‐Seq and DNA methylation data were significantly increased in anti–Ro 60+ patients (Supplementary Figure 6B). This was also true with the Z scores for the 3 genes (ATP10A, MX1, and PARP14) previously selected using the algorithm from the RNA‐Seq, GWAS, and DNA methylation analyses (Supplementary Figure 6C).
Finally, the signature's robustness was also assessed in 724 patients with other autoimmune diseases, such as MCTD, RA, and SSc, all from the PRECISESADS cross‐sectional cohort. A clear separation between anti–Ro 60+ patients (n = 40) and anti–Ro 60– patients (n = 684) using the representation space generated by the LDA is shown in Figure 5A. In all diseases except MCTD, anti–Ro 60+ patients had significantly increased Z scores for the 33 common genes (Figure 5B) and for the 3 genes constituting the signature (Figure 5C). We can therefore conclude that anti–Ro 60+ patients have a specific signature regardless of disease.
Figure 5.
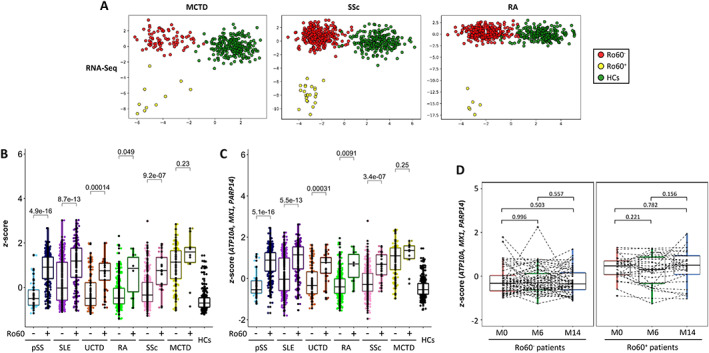
Confirmation of the established signature of anti–Ro 60+ patients common to patients with rheumatoid arthritis (RA), those with systemic sclerosis (SSc), or those with mixed connective tissue disease (MCTD) expressing anti–Ro 60 antibodies. A, Linear discriminant analysis of 923 features selected from RNA‐Seq data (obtained using the Boruta algorithm in patients with SLE, UCTD, or primary SS), to discriminate anti–Ro 60+ patients from anti–Ro 60– patients with mixed connective tissue disease (MCTD), those with systemic sclerosis (SSc), and those with rheumatoid arthritis (RA). B, Z score analyses of the 33 genes, identified using the Boruta algorithm and common to RNA‐Seq and methylome data, in 295 patients with primary SS, 403 patients with SLE, 105 patients with UCTD, 307 patients with RA, 327 patients with SSc, and 90 patients with MCTD, and 254 healthy controls (HCs). C, ATP10/MX1/PARP14 Z score analyses in 295 patients with primary SS, 403 patients with SLE, 105 patients with UCTD, 307 patients with RA, 327 patients with SSc, and 90 patients with MCTD and 254 healthy controls. Statistical significance was determined by 2‐tailed pairwise Wilcoxon's rank sum test. D, ATP10/MX1/PARP14 Z score analyses in 86 patients from the inception cohort who were followed up and had samples collected at the time of recruitment (M0) and at month 6 (M6) and/or month 14 (M14). Patients were grouped as anti–Ro 60+ (n = 29) and anti–Ro 60– (n = 57) regardless of the disease (primary SS, SLE, UCTD, RA, SSc, or MCTD). Statistical significance was determined by pairwise t‐test. Results are shown as box plots, in which each box represents the interquartile range, lines inside the box represent the median, and lines outside the box represent the 10th and 90th percentiles; symbols represent individual samples. Color figure can be viewed in the online issue, which is available at http://onlinelibrary.wiley.com/doi/10.1002/art.42243/abstract.
Additionally, we assessed the transcript Z scores of the 3 genes (ATP10A, MX1, and PARP14) in the inception cohort restricted to 86 patients (primary SS, SLE, UCTD, RA, SSc, and MCTD) who were followed up and had samples collected at 3 time points (recruitment, at 6 and/or 14 months). At the 6‐ and 14‐month time points, patients could receive any standard of care therapy prescribed by their physician (Supplementary Table 8, http://onlinelibrary.wiley.com/doi/10.1002/art.42243). Anti–Ro 60+ patients remained positive and anti–Ro 60– patients remained negative over time (data not shown). We confirmed that the Z score remained stable in anti–Ro 60+ patients and anti–Ro 60– patients over time (Figure 5D). Overall, the signature identified for anti–Ro 60+ patients does not depend on treatment and is stable over time.
DISCUSSION
Our study demonstrates that anti–Ro 60+ patients have a specific signature regardless of disease. Anti–Ro 60+ patients compared to anti–Ro 60– patients presented with the same clinical and biologic characteristics as those previously described in the literature, such as hypergammaglobulinemia (12, 13) and an association with other autoantibodies (anti–Ro 52, anti‐SSB, and RF) (14). Anti–Ro 60 positivity was reported to be higher in the low symptom burden subgroups of patients with primary SS (31) in accordance with our observation that anti–Ro 60+ patients had a lower ESSPRI score.
Our study has some limitations. First, it could be argued that this was a cross‐sectional study and it is assumed that single samples (cells and sera) were collected at an arbitrary time point during the disease course of different autoimmune diseases. However, in our inception cohort with a 14‐month follow‐up period, we demonstrated that the identified signature in anti–Ro 60+ patients remained stable over time and was not influenced by treatment. Second, virtually all subjects were Caucasian, and although common variants were expected to be old in evolution and shared across ethnicities, some risk loci show considerable ethnic differences in frequency and/or effect size.
The novelty of our study was our use of machine learning to identify a robust signature specific to anti–Ro 60+ patients through dimensionality reduction approaches, using high‐throughput multi‐omics data. Assessment of the signature's robustness occurred in 3 steps. First, we used discriminant features extracted from the different omics data sets to perform LDA. The new data representation spaces generated using the selected features through this analysis allowed for sufficient separation of anti–Ro 60+ patients and anti–Ro 60– patients in each of the 3 diseases studied (SLE, primary SS, and UCTD). Second, we considered the overlap of the selected features in RNA‐Seq data and DNA methylation data and the overlap of the selected features in RNA‐Seq data, DNA methylation data, and GWAS data, narrowing down the original selection to 2 signatures composed of 33 genes and 3 genes, respectively. Both Z scores, generated by either the 33 genes or the 3 genes, were significantly different between anti–Ro 60+ patients and anti–Ro 60– patients in SLE, primary SS, and UCTD. Third, because we used a machine learning approach to identify the features, we assessed the possibility of overfitting by testing the validity of these signatures in patients whose samples were not used in the training process of the algorithm. Generalizability of the signature was evaluated by determining RNA‐Seq features from another cohort of patients with primary SS, patients with SLE, and patients with UCTD and from RA patients, SSc patients, and MCTD patients. LDA findings consistently showed a clear distinction between anti–Ro 60+ patients and anti–Ro 60– patients.
Again, Z scores were significantly different between anti–Ro 60+ patients and anti–Ro 60– patients with RA and those with SSc but not for those with MCTD. Consequently, the discriminating properties of the representation space obtained through the computation of LDA, the statistical tests of distributions, and the generalizability to other diseases constituted strong indicators of the signature's robustness.
Reactome pathway analysis of the 33 differentially expressed and methylated genes showed a link between anti–Ro 60 antibodies and IFN signature, cytokine secretions, and IFN regulatory factor 7, which were associated with Toll‐like receptor (TLR) signaling. The notable association between anti–Ro 60 autoantibodies and inflammation in autoimmune diseases led to the hypothesis that the RNA‐binding properties of Ro 60 produce aberrant TLR signaling (32). Alu retroelements activate TLR‐7 and TLR‐8 as oligoribonucleotides and associate with Ro 60 in cell lines (33); consequently, inflammatory and IFN signatures associated with anti–Ro 60 autoantibodies may be due to the RNA‐binding properties of Ro 60.
Remarkably, the transcript Z scores of 3 genes (ATP10A, MX1, and PARP14) were clearly higher in anti–Ro 60+ patients compared to anti–Ro 60– patients in all the diseases and constituted a clear signature. The first gene, ATP10A, encoded 1 of the 5 P4 ATPase that requires interaction with transmembrane protein 30A to exit from the endoplasmic reticulum to the plasma membrane. ATP10A was recently linked to autoimmunity, as one study demonstrated that methylation qualitative trait loci regulated the methylation of the ATP10A gene in blood samples from patients with primary SS (34). Since this enzyme mainly transports 2 aminophospholipids: phosphatidylserine and phosphatidylethanolamine, which may be the target of minor autoantibodies in antiphospholipid syndrome (APS) (35), it is reasonable to speculate that there is a link between the presence of antiphospholipid antibodies and the increase in ATP10A transcript. We re‐ran the analysis excluding patients positive for the major autoantibodies found in APS (i.e., anti‐β2GPI and IgG and IgM aCLs) to exclude potential patients with secondary APS, and the signature that was identified persisted (P = 4.2 × 10⁻¹⁰) (data not shown).
Moreover, to our knowledge, no association with APS has been described in the literature to date. Thus, the signature carried by ATP10A appears to be specific to anti–Ro 60+ patients. Another GWAS study on cytokine responses found that genetic variants of ATP10A were associated with IFNα production (36). The second gene, PARP14, encoded for a member of poly(ADP‐ribose) polymerase (PARP) family proteins which contain macrodomain binding proteins influencing many biologic processes (37). PARP‐14 suppressed proinflammatory IFN/STAT1 signaling and activated the antiinflammatory IL‐4/STAT6 pathway in primary human macrophages (38). PARP‐14 also enhanced histone activation to promote transcription of type I IFN genes such as IFNB1 after lipopolysaccharide stimulation in RAW264.7 cells (39). Interestingly, PARP14 was identified as 1 of the 5 genes that can distinguish patients with primary SS from controls (40). The third gene, MX1, encoded the Mx dynamic, MX dynamin‐like GTPase 1 or MxA, which participates in the cellular antiviral response by antagonizing the replication processes of several different RNA or DNA viruses. MX1 gene expression is induced by IFN via JAK1A/Tyk‐2 followed by the activation of the STAT1/STAT2 pathway (41). Furthermore, MX1 protein levels were recently reported as a surrogate for the type I IFN gene scores in SLE (42). Consequently, these 3 overexpressed, hypomethylated, and mutated genes in anti–Ro 60+ patients were significantly associated with the IFN signature regardless of the autoimmune disease.
To control the IFN signature in anti–Ro 60+ patients with autoimmune diseases, a key challenge would be to break the continual turnover of Ro 60–specific clones that seems to drive lifelong Ro 60 humoral autoimmunity (43). This may entail a dual approach targeting both Ro 60–associated RNAs (including Alu transcripts and Y RNAs) and Ro 60–specific autoantibody clonotypes as suggested by Reed and Gordon (32).
AUTHOR CONTRIBUTIONS
All authors were involved in drafting the article or revising it critically for important intellectual content, and all authors approved the final version to be published. Dr. Pers had full access to all of the data in the study and takes responsibility for the integrity of the data and the accuracy of the data analysis.
Study conception and design
Pers.
Acquisition of data
Bettacchioli, Jamin, Alarcón‐Riquelme.
Analysis and interpretation of data
Foulquier, Le Dantec.
Supporting information
Disclosure Form
Appendix S1 Supplementary Methods
Supplementary Figure 1 Hypergammaglobulinemia and disease activity in primary Sjögren's syndrome (pSS), systemic lupus erythematosus (SLE) and undifferentiated connective tissue disease (UCTD) patients. (A) Barplots show the proportion of hypergammaglobulinemia in each disease for anti‐Ro60+ and anti‐Ro60− patients (black: negative, orange: past, red: present). (B) Distributions of ESSDAI collected for 240 pSS patients (anti‐Ro60+: 194, anti‐Ro60−: 46), SLEDAI collected for 253 SLE patients (anti‐Ro60+: 79, anti‐Ro60−: 174), and PGA collected for 149 UCTD patients (anti‐Ro60+: 37, anti‐Ro60−: 112). (C) Distributions of ESSPRI and its components collected for 182 pSS patients (anti‐Ro60+: 138, anti‐Ro60−: 44). Ro60low correspond to anti‐Ro60 positive samples with concentrations between 10 and 640 AU/ml, and Ro60high to positive samples with concentrations >640 AU/ml. Two‐tailed pairwiseWilcoxon‐rank sum test results are shown.
Supplementary Figure 2 STRING analysis of the 33 genes identified by machine learning and common to RNA‐Seq and DNA methylation analysis. (A) Interaction network of these 33 common genes. (B) The 20 most relevant pathways sorted by p‐value.
Supplementary Figure 3 Representation of the 33 genes corresponding to transcripts and differentially methylated genes jointly identified by machine learning to discriminate anti‐Ro60 + patients from anti‐Ro60 − patients. (A) Boxplots show the variance stabilizing transformation (vst) normalized expression for the 33 transcripts identified. (B) Boxplots show the methylation level analysis of the CpG associated to the corresponding gene. Statistical significance is determined by two‐tailed pairwise Wilcoxon‐rank sum test. Plots show median, with error bars indicating ± interquartile range (IQR). (pSS: primary Sjögren's syndrome, SLE: systemic lupus erythematosus, UCTD: undifferentiated connective tissue disease, HCs: healthy controls).
Supplementary Figure 4 The established common signature of anti‐Ro60+ patients is not defined by anti‐Ro52/TRIM21 positivity and not just a marker of B cell activation due to the presence of any other autoantibody. (A) ATP10/MX1/PARP14 z‐score analyses were performed for 295 pSS, 403 SLE and 105 UCTD patients and 254 HCs. Three groups of patients per disease (anti‐Ro60‐/anti‐Ro52‐, anti‐Ro60+/anti‐Ro52‐ and anti‐Ro60+/anti‐Ro52+) were constituted. (B) ATP10/MX1/PARP14 z‐score analyses were performed) in five groups of patients regardless of their disease: patients without any autoantibody, anti‐Ro60−/anti‐Ro52+ patients negative for any of the autoantibodies analyzed (anti‐RNP, anti‐Sm, anti‐SSB, anti‐Scl70, anti‐CCP, anti‐dsDNA, anti‐MPO, anti‐PR3, anti‐CentB), anti‐Ro60−/anti‐Ro52+ patients positive for any other autoantibodies, anti‐Ro60−/anti‐Ro52− patients positive for any of the autoantibodies, and anti‐Ro60+ patients. Two‐tailed pairwise Wilcoxon‐rank sum test results are shown. Plots show median, with error bars indicating ± interquartile range. (pSS: primary Sjögren's syndrome, SLE: systemic lupus erythematosus, UCTD: undifferentiated connective tissue disease, HCs: healthy controls).
Supplementary Figure 5 Representation of the 6 cell types and 2 cytokines jointly identified by machine learning to differentiate anti‐Ro60 + patients (Ro60 + ) from anti‐Ro60 − patients (Ro60‐). Boxplots on the left show the percentage of the 6 cell types. Boxplots on the right show the levels of the 2 cytokines. Statistical significance is determined by two‐tailed pairwise Wilcoxon‐rank sum test. Plots show median with error bars indicating ± interquartile range (IQR). pSS: primary Sjögren's syndrome, SLE: systemic lupus erythematosus, UCTD: undifferentiated connective tissue disease, HCs: healthy controls.
Supplementary Figure 6 The robustness of the established common signature of anti‐Ro60 + patients (Ro60 + ) was assessed in an independent cohort of 106 patients. (A) Linear discriminant analysis (LDA) representation of the patients, using the 923 features selected by the Boruta algorithm from RNA‐Seq data in an independent cohort of 106 patients, with 46 anti‐Ro60+ patients (26 pSS, 15 SLE and 5 UCTD) and 60 anti‐ Ro60− (Ro60−) patients (10 pSS, 26 SLE and 24 UCTD) and in 254 healthy controls (HCs). (B) z‐score analyses of the 33 genes, identified by the Boruta algorithm and common to RNA‐Seq and DNA methylation data, were performed in the same independent cohort. (C) ATP10/MX1/PARP14 z‐score analyses were performed for the same independent cohort. Two‐tailed pairwise Wilcoxon‐rank sum test results are shown. Plots show median, with error bars indicating ± interquartile range. (pSS: primary Sjögren's syndrome, SLE: systemic lupus erythematosus, UCTD: undifferentiated connective tissue disease, HCs: healthy controls).
Supplementary Table 1 number of patients with full dataset for primary Sjögren's syndrome (pSS), systemic lupus erythematosus (SLE) and undifferentiated connective tissue disease (UCTD), presented for each dataset type: RNA‐seq, GWAS, methylation and flow cytometry / cytokine.
Supplementary Table 2 Autoantibody, free light chain and complement fraction expressions in primary Sjögren's syndrome (pSS), systemic lupus erythematosus (SLE) and undifferentiated connective tissue disease (UCTD) patients according to anti‐Ro60 expression (AntiRo60+ versus AntiRo60−).
Supplementary Table 3 List of the 923 RNAseq features and their chromosomic locations on Hg19 genome.
Supplementary Table 4 List of the 64 CpG features with their chromosomic locations on Hg19 genome.
Supplementary Table 5 List of the 5749 SNP features with their chromosomic locations on Hg19 genome, alleles correspondence, associated gene and their consequences.
Supplementary Table 6 Reactome pathway analysis of the 923 genes identified as discriminant by the machine learning approach to separate anti‐Ro60+ from anti‐Ro60− patients.
Supplementary Table 7 Reactome pathway analysis of the 37 genes identified as discriminant by the machine learning approach to separate anti‐Ro60+ from anti‐Ro60− patients.
Supplementary Table 8 Characteristics of the 86 patients from the inception cohort. Primary Sjögren's syndrome (pSS), systemic lupus erythematosus (SLE), undifferentiated connective tissue disease (UCTD), rheumatoid arthritis (RA), Systemic sclerosis (SSc), and Mixed Connective Tissue Disease (MCTD) patients.
ACKNOWLEDGMENTS
We would like to particularly express gratitude to the patients, nurses, technicians, and many others who directly or indirectly helped in this study. We are also grateful to the Institut Français de Bioinformatique, the Roscoff Bioinformatics platform Analysis and Bioinformatics for Marine Science (URL: http://abims.sb-roscoff.fr), for providing computing and storage resources, and the HYPERION platform at Lymphocytes B et Autoimmunité, for providing flow cytometry facilities.
APPENDIX A. MEMBERS OF THE PRECISESADS CLINICAL CONSORTIUM AND FLOW CYTOMETRY CONSORTIUM
Members of the PRECISESADS Clinical consortium are as follows: Lorenzo Beretta, Barbara Vigone (Fondazione IRCCS Ca'Granda Ospedale Maggiore Policlinico di Milano, Milan, Italy); Jacques‐Olivier Pers, Alain Saraux, Valérie Devauchelle‐Pensec, Divi Cornec, Sandrine Jousse‐Joulin (B Lymphocytes, Autoimmunity and Immunotherapies laboratory, UMR 1227, Université de Brest, INSERM and Centre Hospitalier Regional Universitaire Brest, Brest, France); Bernard Lauwerys, Julie Ducreux, Anne‐Lise Maudoux (Université catholique de Louvain, Brussels, Belgium); Carlos Vasconcelos, Ana Tavares, Raquel Faria, Mariana Brandão, Ana Campar, António Marinho, Fátima Farinha, Isabel Almeida (Centro Hospitalar do Porto, Porto, Portugal); Esmeralda Neves (Centro Hospitalar and Universitário do Porto, Porto, Portugal); Miguel Ángel González‐Gay, Ricardo Blanco Alonso, Alfonso Corrales Martínez (Hospital Universitario Marqués de Valdecilla and Universidad de Cantabria, Santander, Spain); Ricard Cervera, Ignasi Rodríguez‐Pintó, Gerard Espinosa (Hospital Clinic, Institut d'Investigacions Biomèdiques August Pi i Sunyer, Barcelona, Spain); Rik Lories, Ellen De Langhe (UZ Leuven, Leuven, Belgium); Nicolas Hunzelmann, Doreen Belz (Klinikum der Universitaet zu Koeln, Cologne, Germany); Torsten Witte, Niklas Baerlecken (Medical University Hannover, Hannover, Germany); Georg Stummvoll, Michael Zauner, Michaela Lehner (Medical University Vienna, Vienna, Austria); Eduardo Collantes, Rafaela Ortega‐Castro, Maria Angeles Aguirre‐Zamorano, Alejandro Escudero‐Contreras, Carmen Castro‐Villegas, Yolanda Jiménez Gómez (Reina Sofia Hospital and University of Cordoba, Cordoba, Spain); Norberto Ortego, María Concepción Fernández Roldán (Hospital Universitario Clínico San Cecilio, Spain); Enrique Raya, Inmaculada Jiménez Moleón, Hospital Universitario Virgen a de las Nieves, Granada Spain); Enrique de Ramon, Isabel Díaz Quintero (Hospital Regional Universitario de Málaga, Málaga, Spain); Pier Luigi Meroni, Maria Gerosa, Tommaso Schioppo, Carolina Artusi (Università degli studi di Milano, Milan, Italy); Carlo Chizzolini, Aleksandra Dufour, Donatienne Wynar (University Hospital and School of Medicine, Geneva, Switzerland); Laszló Kovács, Attila Balog, Magdolna Deák, Márta Bocskai, Sonja Dulic, Gabriella Kádár (University of Szeged, Szeged, Hungary); Falk Hiepe, Velia Gerl, Silvia Thiel (Charite Universitätsmedizin Berlin, Berlin, Germany); Manuel Rodriguez Maresca, Antonio López‐Berrio, Rocío Aguilar‐Quesada, Héctor Navarro‐Linares (Andalusian Public Health System Biobank, Granada, Spain); Yiannis Ioannou, Chris Chamberlain, Jacqueline Marovac (UCB Pharma PRECISESADS Project Office, Slough, UK); Marta Alarcón Riquelme, Tania Gomes Anjos (Center for Genomics and Oncological Research, Granada, Spain).
Members of the PRECISESADS Flow Cytometry Consortium are as follows: Christophe Jamin, Bénédicte Rouvière, Jacques‐Olivier Pers (B Lymphocytes, Autoimmunity and Immunotherapies laboratory, UMR 1227, Université de Brest, INSERM, and Centre Hospitalier Regional Universitaire Brest, Brest, France); Lucas Le Lann, Quentin Simon (B Lymphocytes, Autoimmunity and Immunotherapies laboratory, UMR 1227, Université de Brest, and INSERM, Brest, France); Concepción Marañón, Nieves Varela, Brian Muchmore (Center for Genomics and Oncological Research, Granada, Spain); Aleksandra Dufour, Montserrat Alvarez, Carlo Chizzolini (University Hospital and School of Medicine, Geneva, Switzerland); Jonathan Cremer, Ellen De Langhe (UZ Leuven, Leuven, Belgium); Nuria Barbarroja (Reina Sofia Hospital and University of Cordoba, Cordoba, Spain); Chary Lopez‐Pedrera (Centro Hospitalar do Porto, Porto, Portugal); Velia Gerl, Laleh Khodadadi, Qingyu Cheng (Charite Universitätsmedizin Berlin, Berlin, Germany); Anne Buttgereit, Zuzanna Makowska (Bayer Pharma Aktiengesellschaft, Berlin, Germany); Aurélie De Groof, Julie Ducreux (Université catholique de Louvain, Brussels, Belgium); Elena Trombetta (Fondazione IRCCS Ca'Granda Ospedale Maggiore Policlinico di Milano, Milan, Italy); Tianlu Li, Damiana Alvarez‐Errico (Bellvitge Biomedical Research Institute, Barcelona, Spain); Torsten Witte, Katja Kniesch (Medical University Hannover, Hannover, Germany); Nancy Azevedo, Esmeralda Neves (Centro Hospitalar and Universitário do Porto, Porto, Portugal); Maria Hernandez‐Fuentes (UCB Pharma PRECISESADS Project Office, Slough, UK); Pierre‐Emmanuel Jouve (AltraBio SAS, Lyon, France).
Supported by the Innovative Medicines Initiative Joint Undertaking (grant 115565; PRECISE Systemic Autoimmune Diseases [PRECISESADS] study). The PRECISESADS study is supported by the European Union Seventh Framework Programme (FP7/2007–2013) and in‐kind contribution from companies in the European Federation of Pharmaceutical Industries and Associations. The B Lymphocytes, Autoimmunity and Immunotherapies Laboratory is supported by the Agence Nationale de la Recherche Investissement d'Avenir program (reference no. ANR‐11‐LABX‐0016‐001) (Laboratoire d'Excellence IGO).
Author disclosures are available at https://onlinelibrary.wiley.com/action/downloadSupplement?doi=10.1002%2Fart.42243&file=art42243‐sup‐0001‐Disclosureform.pdf.
REFERENCES
- 1. Aggarwal A. Role of autoantibody testing. Best Pract Res Clin Rheumatol 2014;28:907–20. [DOI] [PubMed] [Google Scholar]
- 2. Radin M, Rubini E, Cecchi I, Foddai SG, Barinotti A, Rossi D, et al. Disease evolution in a long‐term follow‐up of 104 undifferentiated connective tissue disease patients. Clin Exp Rheumatol 2022;40:575–80. [DOI] [PubMed] [Google Scholar]
- 3. Robbins A, Hentzien M, Toquet S, Didier K, Servettaz A, Pham BN, et al. Diagnostic utility of separate anti‐Ro60 and anti‐Ro52/TRIM21 antibody detection in autoimmune diseases. Front Immunol 2019;10:444. [DOI] [PMC free article] [PubMed] [Google Scholar]
- 4. Schulte‐Pelkum J, Fritzler M, Mahler M. Latest update on the Ro/SS‐A autoantibody system. Autoimmun Rev 2009;8:632–7. [DOI] [PubMed] [Google Scholar]
- 5. Strandberg L, Ambrosi A, Espinosa A, Ottosson L, Eloranta ML, Zhou W, et al. Interferon‐α induces up‐regulation and nuclear translocation of the Ro52 autoantigen as detected by a panel of novel Ro52‐specific monoclonal antibodies. J Clin Immunol 2008;28:220–31. [DOI] [PubMed] [Google Scholar]
- 6. Rhodes DA, Ihrke G, Reinicke AT, Malcherek G, Towey M, Isenberg DA, et al. The 52 000 MW Ro/SS‐A autoantigen in Sjögren's syndrome/systemic lupus erythematosus (Ro52) is an interferon‐γ inducible tripartite motif protein associated with membrane proximal structures. Immunology 2002;106:246–56. [DOI] [PMC free article] [PubMed] [Google Scholar]
- 7. Yoshimi R, Chang TH, Wang H, Atsumi T, Morse HC, Ozato K. Gene disruption study reveals a nonredundant role for TRIM21/Ro52 in NF‐κB‐dependent cytokine expression in fibroblasts. J Immunol 2009;182:7527–38. [DOI] [PMC free article] [PubMed] [Google Scholar]
- 8. Lerner MR, Boyle JA, Hardin JA, Steitz JA. Two novel classes of small ribonucleoproteins detected by antibodies associated with lupus erythematosus. Science 1981;211:400–2. [DOI] [PubMed] [Google Scholar]
- 9. Belisova A, Semrad K, Mayer O, Kocian G, Waigmann E, Schroeder R, et al. RNA chaperone activity of protein components of human Ro RNPs. RNA 2005;11:1084–94. [DOI] [PMC free article] [PubMed] [Google Scholar]
- 10. Kirou KA, Lee C, George S, Louca K, Peterson MG, Crow MK. Activation of the interferon‐α pathway identifies a subgroup of systemic lupus erythematosus patients with distinct serologic features and active disease. Arthritis Rheum 2005;52:1491–503. [DOI] [PubMed] [Google Scholar]
- 11. Armağan B, Robinson SA, Bazoberry A, Perin J, Grader‐Beck T, Akpek EK, et al. Antibodies to both Ro52 and Ro60 may identify Sjögren's syndrome patients best suited for clinical trials of disease‐modifying therapies. Arthritis Care Res (Hoboken) doi: 10.1002/acr.24597/abstract 2021. E‐pub ahead of print. [DOI] [PMC free article] [PubMed] [Google Scholar]
- 12. Brito‐Zerón P, Acar‐Denizli N, Ng WF, Zeher M, Rasmussen A, Mandl T, et al. How immunological profile drives clinical phenotype of primary Sjögren's syndrome at diagnosis: analysis of 10,500 patients (Sjögren Big Data Project). Clin Exp Rheumatol 2018;36 Suppl:102–12. [PubMed] [Google Scholar]
- 13. Thorlacius GE, Hultin‐Rosenberg L, Sandling JK, Bianchi M, Imgenberg‐Kreuz J, Pucholt P, et al. Genetic and clinical basis for two distinct subtypes of primary Sjögren's syndrome. Rheumatology (Oxford) 2021;60:837–48. [DOI] [PMC free article] [PubMed] [Google Scholar]
- 14. Zampeli E, Mavrommati M, Moutsopoulos HM, Skopouli FN. Anti‐Ro52 and/or anti‐Ro60 immune reactivity: autoantibody and disease associations. Clin Exp Rheumatol 2020;38 Suppl:134–41. [PubMed] [Google Scholar]
- 15. Barturen G, Babaei S, Català‐Moll F, Martínez‐Bueno M, Makowska Z, Martorell‐Marugán J, et al. Integrative analysis reveals a molecular stratification of systemic autoimmune diseases. Arthritis Rheumatol 2021;73:1073–85. [DOI] [PubMed] [Google Scholar]
- 16. Aletaha D, Neogi T, Silman AJ, Funovits J, Felson DT, Bingham CO III, et al. 2010 Rheumatoid arthritis classification criteria: an American College of Rheumatology/European League Against Rheumatism collaborative initiative. Arthritis Rheum 2010;62:2569–81. [DOI] [PubMed] [Google Scholar]
- 17. Hochberg MC, for the Diagnostic and Therapeutic Criteria Committee of the American College of Rheumatology . Updating the American College of Rheumatology revised criteria for the classification of systemic lupus erythematosus [letter]. Arthritis Rheum 1997;40:1725. [DOI] [PubMed] [Google Scholar]
- 18. Van den Hoogen F, Khanna D, Fransen J, Johnson SR, Baron M, Tyndall A, et al. 2013 classification criteria for systemic sclerosis: an American College of Rheumatology/European League Against Rheumatism collaborative initiative. Arthritis Rheum 2013;65:2737–47. [DOI] [PMC free article] [PubMed] [Google Scholar]
- 19. Vitali C, Bombardieri S, Jonsson R, Moutsopoulos HM, Alexander EL, Carsons SE, et al. Classification criteria for Sjögren's syndrome: a revised version of the European criteria proposed by the American‐European Consensus Group. Ann Rheum Dis 2002;61:554–8. [DOI] [PMC free article] [PubMed] [Google Scholar]
- 20. Alarcón‐Segovia D, Cardiel MH. Comparison between 3 diagnostic criteria for mixed connective tissue disease. Study of 593 patients. J Rheumatol 1989;16:328–34. [PubMed] [Google Scholar]
- 21. LeRoy EC, Medsger TA. Criteria for the classification of early systemic sclerosis. J Rheumatol 2001;28:1573–6. [PubMed] [Google Scholar]
- 22. Sack U, Conrad K, Csernok E, Frank I, Hiepe F, Krieger T, et al. Autoantibody detection using indirect immunofluorescence on HEp‐2 cells. Ann N Y Acad Sci 2009;1173:166–73. [DOI] [PubMed] [Google Scholar]
- 23. Bombardier C, Gladman DD, Urowitz MB, Caron D, Chang DH, and the Committee on Prognosis Studies in SLE . Derivation of the SLEDAI: a disease activity index for lupus patients. Arthritis Rheum 1992;35:630–40. [DOI] [PubMed] [Google Scholar]
- 24. Seror R, Ravaud P, Bowman SJ, Baron G, Tzioufas A, Theander E, et al, on behalf of the EULAR Sjögren's Task Force . EULAR Sjögren's Syndrome Disease Activity Index: development of a consensus systemic disease activity index for primary Sjögren's syndrome. Ann Rheum Dis 2010;69:1103–9. [DOI] [PMC free article] [PubMed] [Google Scholar]
- 25. Kursa MB, Rudnicki WR. Feature selection with the Boruta package. J Stat Softw 2010;36:1–13. [Google Scholar]
- 26. Seror R, Ravaud P, Mariette X, Bootsma H, Theander E, Hansen A, et al, on behalf of the EULAR Sjögren's Task Force . EULAR Sjögren's Syndrome Patient Reported Index (ESSPRI): development of a consensus patient index for primary Sjögren's syndrome. Ann Rheum Dis 2011;70:968–72. [DOI] [PubMed] [Google Scholar]
- 27. Fabregat A, Jupe S, Matthews L, Sidiropoulos K, Gillespie M, Garapati P, et al. The reactome pathway knowledgebase. Nucleic Acids Res 2018;46:D649–55. [DOI] [PMC free article] [PubMed] [Google Scholar]
- 28. Kirou KA, Lee C, George S, Louca K, Papagiannis IG, Peterson MG, et al. Coordinate overexpression of interferon‐α–induced genes in systemic lupus erythematosus. Arthritis Rheum 2004;50:3958–67. [DOI] [PubMed] [Google Scholar]
- 29. Chiche L, Jourde‐Chiche N, Whalen E, Presnell S, Gersuk V, Dang K, et al. Modular transcriptional repertoire analyses of adults with systemic lupus erythematosus reveal distinct type I and type II interferon signatures. Arthritis Rheumatol 2014;66:1583–95. [DOI] [PMC free article] [PubMed] [Google Scholar]
- 30. Franceschini A, Szklarczyk D, Frankild S, Kuhn M, Simonovic M, Roth A, et al. STRING v9.1: protein‐protein interaction networks, with increased coverage and integration. Nucleic Acids Res 2013;41:D808–15. [DOI] [PMC free article] [PubMed] [Google Scholar]
- 31. Tarn JR, Howard‐Tripp N, Lendrem DW, Mariette X, Saraux A, Devauchelle‐Pensec V, et al. Symptom‐based stratification of patients with primary Sjögren's syndrome: multi‐dimensional characterisation of international observational cohorts and reanalyses of randomised clinical trials. Lancet Rheumatol 2019;1:e85–94. [DOI] [PMC free article] [PubMed] [Google Scholar]
- 32. Reed JH, Gordon TP. Autoimmunity: Ro60‐associated RNA takes its toll on disease pathogenesis. Nat Rev Rheumatol 2016;12:136–8. [DOI] [PubMed] [Google Scholar]
- 33. Hung T, Pratt GA, Sundararaman B, Townsend MJ, Chaivorapol C, Bhangale T, et al. The Ro60 autoantigen binds endogenous retroelements and regulates inflammatory gene expression. Science 2015;350:455–9. [DOI] [PMC free article] [PubMed] [Google Scholar]
- 34. Teruel M, Barturen G, Martínez‐Bueno M, Castellini‐Pérez O, Barroso‐Gil M, Povedano E, et al. Integrative epigenomics in Sjögren's syndrome reveals novel pathways and a strong interaction between the HLA, autoantibodies and the interferon signature. Sci Rep 2021;11:23292. [DOI] [PMC free article] [PubMed] [Google Scholar]
- 35. Alessandri C, Conti F, Pendolino M, Mancini R, Valesini G. New autoantigens in the antiphospholipid syndrome. Autoimmun Rev 2011;10:609–16. [DOI] [PubMed] [Google Scholar]
- 36. Kennedy RB, Ovsyannikova IG, Pankratz VS, Haralambieva IH, Vierkant RA, Jacobson RM, et al. Genome‐wide genetic associations with IFNγ response to smallpox vaccine. Hum Genet 2012;131:1433–51. [DOI] [PMC free article] [PubMed] [Google Scholar]
- 37. Fehr AR, Singh SA, Kerr CM, Mukai S, Higashi H, Aikawa M. The impact of PARPs and ADP‐ribosylation on inflammation and host‐pathogen interactions. Genes Dev. 2020;34:341–59. [DOI] [PMC free article] [PubMed] [Google Scholar]
- 38. Iwata H, Goettsch C, Sharma A, Ricchiuto P, Goh WW, Halu A, et al. PARP9 and PARP14 cross‐regulate macrophage activation via STAT1 ADP‐ribosylation. Nat Commun 2016;7:12849. [DOI] [PMC free article] [PubMed] [Google Scholar]
- 39. Caprara G, Prosperini E, Piccolo V, Sigismondo G, Melacarne A, Cuomo A, et al. PARP14 controls the nuclear accumulation of a subset of type I IFN‐inducible proteins. J Immunol 2018;200:2439–54. [DOI] [PubMed] [Google Scholar]
- 40. Yao Q, Song Z, Wang B, Qin Q, Zhang JA. Identifying key genes and functionally enriched pathways in Sjögren's Syndrome by weighted gene co‐expression network analysis. Front Genet 2019;10:1142. [DOI] [PMC free article] [PubMed] [Google Scholar]
- 41. Haller O, Staeheli P, Kochs G. Protective role of interferon‐induced Mx GTPases against influenza viruses [review]. Rev Sci Tech 2009;28:219–31. [DOI] [PubMed] [Google Scholar]
- 42. Chasset F, Ribi C, Trendelenburg M, Huynh‐Do U, Roux‐Lombard P, Courvoisier DS, et al. Identification of highly active systemic lupus erythematosus by combined type I interferon and neutrophil gene scores vs classical serologic markers. Rheumatology (Oxford) 2020;59:3468–78. [DOI] [PubMed] [Google Scholar]
- 43. Lindop R, Arentz G, Bastian I, Whyte AF, Thurgood LA, Chataway TK, et al. Long‐term Ro60 humoral autoimmunity in primary Sjögren's syndrome is maintained by rapid clonal turnover. Clin Immunol 2013;148:27–34. [DOI] [PubMed] [Google Scholar]
Associated Data
This section collects any data citations, data availability statements, or supplementary materials included in this article.
Supplementary Materials
Disclosure Form
Appendix S1 Supplementary Methods
Supplementary Figure 1 Hypergammaglobulinemia and disease activity in primary Sjögren's syndrome (pSS), systemic lupus erythematosus (SLE) and undifferentiated connective tissue disease (UCTD) patients. (A) Barplots show the proportion of hypergammaglobulinemia in each disease for anti‐Ro60+ and anti‐Ro60− patients (black: negative, orange: past, red: present). (B) Distributions of ESSDAI collected for 240 pSS patients (anti‐Ro60+: 194, anti‐Ro60−: 46), SLEDAI collected for 253 SLE patients (anti‐Ro60+: 79, anti‐Ro60−: 174), and PGA collected for 149 UCTD patients (anti‐Ro60+: 37, anti‐Ro60−: 112). (C) Distributions of ESSPRI and its components collected for 182 pSS patients (anti‐Ro60+: 138, anti‐Ro60−: 44). Ro60low correspond to anti‐Ro60 positive samples with concentrations between 10 and 640 AU/ml, and Ro60high to positive samples with concentrations >640 AU/ml. Two‐tailed pairwiseWilcoxon‐rank sum test results are shown.
Supplementary Figure 2 STRING analysis of the 33 genes identified by machine learning and common to RNA‐Seq and DNA methylation analysis. (A) Interaction network of these 33 common genes. (B) The 20 most relevant pathways sorted by p‐value.
Supplementary Figure 3 Representation of the 33 genes corresponding to transcripts and differentially methylated genes jointly identified by machine learning to discriminate anti‐Ro60 + patients from anti‐Ro60 − patients. (A) Boxplots show the variance stabilizing transformation (vst) normalized expression for the 33 transcripts identified. (B) Boxplots show the methylation level analysis of the CpG associated to the corresponding gene. Statistical significance is determined by two‐tailed pairwise Wilcoxon‐rank sum test. Plots show median, with error bars indicating ± interquartile range (IQR). (pSS: primary Sjögren's syndrome, SLE: systemic lupus erythematosus, UCTD: undifferentiated connective tissue disease, HCs: healthy controls).
Supplementary Figure 4 The established common signature of anti‐Ro60+ patients is not defined by anti‐Ro52/TRIM21 positivity and not just a marker of B cell activation due to the presence of any other autoantibody. (A) ATP10/MX1/PARP14 z‐score analyses were performed for 295 pSS, 403 SLE and 105 UCTD patients and 254 HCs. Three groups of patients per disease (anti‐Ro60‐/anti‐Ro52‐, anti‐Ro60+/anti‐Ro52‐ and anti‐Ro60+/anti‐Ro52+) were constituted. (B) ATP10/MX1/PARP14 z‐score analyses were performed) in five groups of patients regardless of their disease: patients without any autoantibody, anti‐Ro60−/anti‐Ro52+ patients negative for any of the autoantibodies analyzed (anti‐RNP, anti‐Sm, anti‐SSB, anti‐Scl70, anti‐CCP, anti‐dsDNA, anti‐MPO, anti‐PR3, anti‐CentB), anti‐Ro60−/anti‐Ro52+ patients positive for any other autoantibodies, anti‐Ro60−/anti‐Ro52− patients positive for any of the autoantibodies, and anti‐Ro60+ patients. Two‐tailed pairwise Wilcoxon‐rank sum test results are shown. Plots show median, with error bars indicating ± interquartile range. (pSS: primary Sjögren's syndrome, SLE: systemic lupus erythematosus, UCTD: undifferentiated connective tissue disease, HCs: healthy controls).
Supplementary Figure 5 Representation of the 6 cell types and 2 cytokines jointly identified by machine learning to differentiate anti‐Ro60 + patients (Ro60 + ) from anti‐Ro60 − patients (Ro60‐). Boxplots on the left show the percentage of the 6 cell types. Boxplots on the right show the levels of the 2 cytokines. Statistical significance is determined by two‐tailed pairwise Wilcoxon‐rank sum test. Plots show median with error bars indicating ± interquartile range (IQR). pSS: primary Sjögren's syndrome, SLE: systemic lupus erythematosus, UCTD: undifferentiated connective tissue disease, HCs: healthy controls.
Supplementary Figure 6 The robustness of the established common signature of anti‐Ro60 + patients (Ro60 + ) was assessed in an independent cohort of 106 patients. (A) Linear discriminant analysis (LDA) representation of the patients, using the 923 features selected by the Boruta algorithm from RNA‐Seq data in an independent cohort of 106 patients, with 46 anti‐Ro60+ patients (26 pSS, 15 SLE and 5 UCTD) and 60 anti‐ Ro60− (Ro60−) patients (10 pSS, 26 SLE and 24 UCTD) and in 254 healthy controls (HCs). (B) z‐score analyses of the 33 genes, identified by the Boruta algorithm and common to RNA‐Seq and DNA methylation data, were performed in the same independent cohort. (C) ATP10/MX1/PARP14 z‐score analyses were performed for the same independent cohort. Two‐tailed pairwise Wilcoxon‐rank sum test results are shown. Plots show median, with error bars indicating ± interquartile range. (pSS: primary Sjögren's syndrome, SLE: systemic lupus erythematosus, UCTD: undifferentiated connective tissue disease, HCs: healthy controls).
Supplementary Table 1 number of patients with full dataset for primary Sjögren's syndrome (pSS), systemic lupus erythematosus (SLE) and undifferentiated connective tissue disease (UCTD), presented for each dataset type: RNA‐seq, GWAS, methylation and flow cytometry / cytokine.
Supplementary Table 2 Autoantibody, free light chain and complement fraction expressions in primary Sjögren's syndrome (pSS), systemic lupus erythematosus (SLE) and undifferentiated connective tissue disease (UCTD) patients according to anti‐Ro60 expression (AntiRo60+ versus AntiRo60−).
Supplementary Table 3 List of the 923 RNAseq features and their chromosomic locations on Hg19 genome.
Supplementary Table 4 List of the 64 CpG features with their chromosomic locations on Hg19 genome.
Supplementary Table 5 List of the 5749 SNP features with their chromosomic locations on Hg19 genome, alleles correspondence, associated gene and their consequences.
Supplementary Table 6 Reactome pathway analysis of the 923 genes identified as discriminant by the machine learning approach to separate anti‐Ro60+ from anti‐Ro60− patients.
Supplementary Table 7 Reactome pathway analysis of the 37 genes identified as discriminant by the machine learning approach to separate anti‐Ro60+ from anti‐Ro60− patients.
Supplementary Table 8 Characteristics of the 86 patients from the inception cohort. Primary Sjögren's syndrome (pSS), systemic lupus erythematosus (SLE), undifferentiated connective tissue disease (UCTD), rheumatoid arthritis (RA), Systemic sclerosis (SSc), and Mixed Connective Tissue Disease (MCTD) patients.