

Abstract
A bright and photostable fluorescent dye with a disulfide (S−S) linker and maleimide group (Rho594‐S2‐mal), as cleavable and reactive sites, was synthesized and conjugated with anti‐GFP nanobodies (NB). The binding of EGFP (FRET donor) with anti‐GFP NB labeled with one or two Rho594‐S2‐mal residues was studied in vitro and in cellulo. The linker was cleaved with dithiothreitol recovering the donor (FP) signal. The bioconjugates (FP‐NB‐dye) were applied in FRET‐FLIM assays, confocal imaging, and superresolution STED microscopy.
Keywords: dyes / pigments, fluorescence, FRET, nanobodies, STED microscopy
Conjugate and cleave? No paradox: compare! The target protein fused with a FRET donor was labeled with a nanobody bearing a FRET acceptor (synthetic dye). Then the acceptor was cleaved off, and the fluorescence outputs before and after cleavage were compared. Here are the news from FRET, FLIM and STED microscopy involving an anti‐GFP nanobody bound with a fluorophore via a disulfide bond.

Introduction
In recent years, nanobodies (NBs) have emerged as stable affinity reagents binding to antigens in cells and tissues. [1] NBs have compact structures (2–3 nm in diameter) and relatively low molecular mass (∼15 kDa); [2] they are versatile markers with highly specific binding abilities.[ 1 , 2 ] Commercial (e. g., Camelid single‐domain antibodies used in this work) or semi‐synthetic NB [3] contain in their structures one or two thiol groups capable of reacting with fluorescent dyes bearing maleimide residues. In general, the presence of distinct number of reactive sites enables to decorate NBs with fluorophores and use them as uniformly labeled light‐emitting tags in optical microscopy.[ 3 , 4 ] Even if the fluorescent dye itself is rather heavy and bulky (1–2 kDa), its conjugate with a NB often retains high specificity. [5] Due to their reduced size compared to heavy antibodies ‐ immunoglobulins which are 14 nm long and have molecular masses of about 150 kDa [2] – NBs provide tighter binding and lower error in determining the target position and area. This is important if nanobodies are decorated with fluorophores and used in superresolution microscopy[ 3 , 4 , 5 ] or FRET (Förster Resonance Energy Transfer) studies. [6] In the FRET model, the energy of a donor dye, promoted to its excited state by light absorption, is transferred to an acceptor dye (either a fluorophore, or a quencher) through non‐radiative dipole‐dipole interactions. [6a] The fluorophores participating in FRET may be chosen from synthetic dyes or fluorescent proteins (FPs). Genetically encodable FPs may be fused with nearly any protein of interest, especially those for which no specific antibody/nanobody are available. These recombinant proteins are widely used, for example, as specific fluorescent markers of cell organelles or as biosensors. [7] In particular, the Green Fluorescent Protein (GFP) [8] and its analogue (EGFP; E=enhanced) with higher fluorescence quantum yield [9] are widely applied as specific protein tags and FRET donors. Other options for FRET are synthetic dyes; they are smaller in size (M ∼1 kDa) than FPs (M∼28 kDa) and less prone to photobleaching. Because of these complementary characteristics, FRET pairs based on the dye+FP assemblies may perform better than FRET pairs involving two FPs.
In this study, we used anti‐GFP NBs with one or two thiol residues for conjugation with a fluorescent dye bearing a chemically cleavable linker (Figure 1). These commercial NBs (Camelid sdAb) recognize GFP, EGFP, as well as the most common CFP and YPF variants (C=cyan, Y=yellow). We incorporated the cleavable linker into a synthetic dye ‐ nanobody‐fluorescent protein assembly and studied its applicability in the FRET assay, as well as in FLIM (fluorescence lifetime imaging) and STED (stimulated emission depletion) superresolution microscopy. As a FRET donor, EGFP was recognized and bound with anti‐GFP NBs decorated with a FRET acceptor (commercial Alexa Fl 594 dye with red emission; Figure 1). The chemically cleavable linker connects the dye and NBs and keeps the former at a short distance from the donor (FP) to ensure efficient energy transfer. The emission intensity and the lifetime of the donor dye (EGFP) were measured before and after cleavage of the acceptor both in cuvette and in cellulo. This approach enabled to compare these values directly and in one sample. The disulfide linker between the NB as a binding site and the fluorescent reporter can be cleaved under mild conditions; the release and removal of the emitter allows further labeling and detection of other target structures using the same detection window. Finally, we realized “through‐FRET” STED imaging, by exciting the donor and depleting the acceptor with a 775 nm STED laser. This arrangement takes advantage of the genetically encoded tag, and the superior photo‐fatigue resistance of the red‐emitting synthetic dye.
Figure 1.
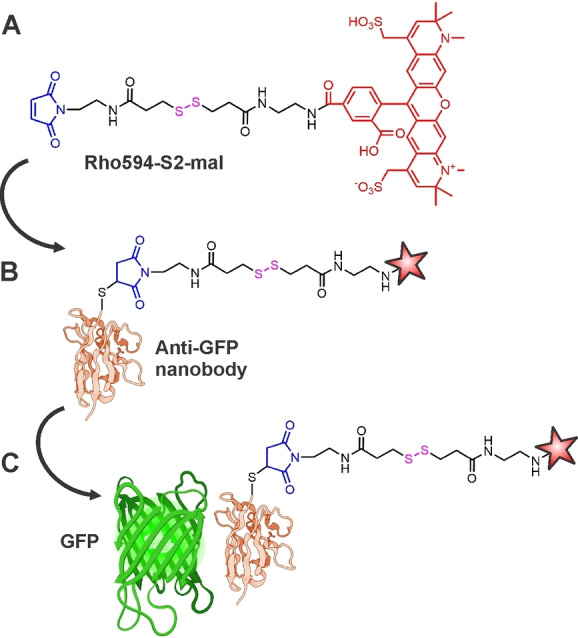
(A) Fluorescent probe Rho594‐S2‐mal incorporating the dye Alexa Fluor 594 (Rho594, shown in red), disulfide (S−S) linker (S2, black) and maleimide group (mal, blue) as cleavable and reactive sites, respectively. For synthesis, see Figures S1‐S2. (B) Anti‐GFP nanobody labelled with Rho594‐S2‐mal (another one with two cysteine residues was also labelled). (C) GFP (FRET donor) binds with the labelled anti‐GFP nanobody. [10]
Results and discussion: FRET
The distance between the donor and acceptor dipoles, as well as mutual orientation of their transition moments, are key factors influencing the FRET efficiency. [6] Due to their size and shape, FPs are not always ideal FRET dyes. However, it is possible to combine a FP and a synthetic organic dye; [11] for example, in ratiometric fluorescent probes incorporating a chemically (disulfide bond) [12] or an enzymatically cleavable linker [13] between the protein and the dye. However, this strategy requires the introduction of a conjugation site or a conjugatable cleavable linker directly into the protein structure by bioengineering, which is more complex than the straightforward approach of the present work (Figure 1).
As typical FRET donor, we used EGFP with molecular mass of ca. 27 kDa, fluorescence quantum yield 0.6, lifetime 2.6 ns, absorption / emission maxima of 488 nm (ϵ=56000 M−1 cm−1) / 507 nm, respectively. [14] The GFP has a shape that resembles a cylinder with diameter and height of 2.4 nm and 4.2 nm, respectively. [15] As FRET acceptor and bright fluorophore, we chose commercial Alexa Fluor 594 (Rho594) dye. In the free state and in aqueous PBS buffer at pH 7.4, Alexa Fluor 594 (we used 5‐carboxy isomer) has absorption and emission maxima at 590 nm and 617 nm, respectively; ϵ=92000 M−1 cm−1, fluorescence quantum yield 0.66, and fluorescence lifetime 3.9 ns. These properties make it a suitable acceptor for EGFP and an excellent dye for superresolution microscopy with 775 nm STED laser. The estimated Förster radius between EGFP and Alexa Fluor 594 is 5.2 nm. [16] If we consider the sizes of NBs (2–3 nm) [2] and GFP (2.4–4.2 nm), [15] we can conclude that in the bound state the distance between them will be 4–5 nm. A dye with a linker (Figure 1) will increase the separation between the chromophores to ca. 5–6 nm. This roughly corresponds to Förster radius (5.2 nm) ‐ at this length the FRET efficiency is 50 %, and the FRET probe is most sensitive to changes in the distance between the donor and acceptor dyes.
A disulfide bond is a good candidate for inclusion into a cleavable linker, as it is naturally occurring and thus biocompatible. Cleavage with reducing agents is well documented. [17] Hence, organic disulfides have found wide use in bioimaging, controlled drug delivery or protein purification. [18] Starting from commercially available 2‐mercaptopropionic acid, we prepared a cleavable linker bearing two distinct reactive sites: one for coupling with a fluorescent dye (amino group) and another one (the carboxylic acid group) for bioconjugation reactions (Figures 1, S1 and S2) in 3 simple steps. [19] In fact, this linker represented an amino acid with a disulfide bond between the reactive termini. After attaching the fluorescent dye, a maleimide was introduced as the reactive group for selective bioconjugation with native or genetically engineered cysteines. Thus we obtained the fluorescent probe Rho594‐S2‐mal (Figures 1 and S2); however, this approach is general and can be applied to different combinations of other dyes and reactive groups. We labeled anti‐GFP nanobodies with this probe (Figure 1 and Supporting Information) and used these conjugates for binding free EGFP, EGFP‐NUP107 or rsEGFP2‐vimentin fusion protein in cells. We measured and compared the fluorescence lifetimes of the donor (EGFP) before and after cleavage of the linker and acquired fluorescence lifetime images (FLIM). It may seem absurd first to conjugate the fluorescent probe with the target, and then cleave the linker and wash‐out the acceptor dye, but this option provides additional information, which is otherwise unavailable in one experiment and with one sample. The charts of FRET efficiency distribution (based on FLIM) may be acquired before and after cleavage of the acceptor dye, and the images compared.
We used two anti‐GFP nanobodies, containing one or two ectopic cysteines – NBq and NBx2, respectively – in order to obtain two different bioconjugates with definite degrees of labeling (DOL): one or two acceptors in FRET assemblies with one donor (EGFP). Nanobodies were selected for their stability, fast binding, high affinity (nM‐pM), small size (∼15–16 kDa), and for their availability with definite number of reactive groups (cysteines) at defined positions (i. e. N‐ and C‐terminus). The latter factor not only ensures fixed DOL values, but also provides uniform distance between the donor and acceptor fluorophores. The success of labeling was confirmed by ESI‐MS measurements (Figure S3). The main adducts have the expected molecular masses; and only minor amounts of the single labelled NBx2 and the thiol‐disulfide exchange product were formed. The properties and performance of the bioconjugates were evaluated by steady‐state and time‐resolved fluorescence experiments, by FLIM, and STED microscopy.
Before performing the measurements, we screened reducing agents for cleaving the disulfide bond in the assembly shown in Figure 1. Three common reagents, ß‐ME (beta‐mercaptoethanol), DTT (dithiothreitol) and TCEP (tris(2‐carboxyethyl)phosphine), were used. We found that both DTT and TCEP efficiently cleaved the disulfide linker and yielded the desired product (see Figure S4), while the use of ß‐ME resulted in the nucleophilic addition to the maleimide group. However, when carrying out the experiments in cellulo (after binding of EGFP with labeled NBq), we found that with TCEP the fluorescence signal from the FP was lost (see Figure S7). Thus, DTT was selected as the reducing agent and used in all further experiments.
To assess the results of the S−S bond cleavage in FRET assays, we first performed ensemble experiments (in cuvettes) with two nanobodies bearing 1 or 2 residues of Rho594‐S2‐mal, and their EGFP complexes (Figure 2). We titrated EGFP with the labeled nanobodies, until a constant reduction of its emission signal was observed, along with a concomitant increase of the acceptor emission in the red. Then, excess DTT was added (5 mM) and the changes in both signals (donor and acceptor) were monitored until the reaction was complete. The ratios of fluorescence intensity of EGFP at 508 nm, after the cleavage of the acceptor was complete and before it occurred (green and blue emission curves in Figure 2A–B), were measured for two samples, and the FRET efficiencies were calculated. The FRET efficiency was found to be 52 % for NBq. As anticipated, the FRET efficiency is higher (80 %) with the doubly labeled NBx2. This value is in good agreement with the result obtained for NBq (equal quenching probabilities of 52 % on each step). After complete cleavage of the acceptor, the emission of the donor (measured at 508 nm) is lower than the fluorescence of EGFP alone (red curves in Figure 2). Thus, the emission of EGFP is partially quenched by the NB. This effect has been previously observed [19] and explained by changes in the FP chromophore environment upon binding. In our case, it is very similar for both NBs (compare red and blue curves in Figures 2A and 2B). We also noticed a remaining emission at 612 nm corresponding to direct excitation of the acceptor (Rho594) with 470 nm light. As expected, the intensity is twice as high with NBx2 compared to NBq, because the concentration of the released dye is approximately doubled (DOL‐x2≈2*DOL‐q). Further evidence of the cleavage was assessed by the increase of the lifetime of the donor (Figure S5). The FRET efficiency (0.55) calculated for the single labeled nanobody (NBq) by this method is consistent with the value determined by the intensity changes (0.52; Figure 2). To further examine the efficiency of the disulfide bond cleavage, the nanobodies were studied by time‐resolved fluorescence anisotropy (Figure S6). The rotational correlation time of the fluorophore attached to the nanobody (NBq‐Rho594‐S2‐mal) is high (3.2 ns) and decreases after the addition of DTT to match the value of the free dye (0.45 ns), confirming the dithiol bond cleavage. For simplicity, only the NBq was used in this experiment.
Figure 2.

Emission spectra (top, ex. 470 nm, em. 480–750 nm), recorded in PBS (pH 7.4) at 25 °C, of EGFP alone (red) and EGFP in presence of Rho594‐S2‐mal labelled NBq (A) and NBx2 (C) before (green) and after (blue) cleavage of the dye by DTT. Concentration of EGFP and NB for all samples was 0.28 μM. Concentration of DTT was 5 mM. Evolution of fluorescence intensity over time (bottom) at 508 nm (black) and 612 nm (red) during cleavage from NBq (C) and NBx2 (D). DTT was added at t=0 min, and thus the first point corresponds to the protein bound with the nanobody (green line in A−B).
Confocal microscopy and FLIM
Next, we tested the applicability of bioconjugates for imaging in a confocal microscope. To this end, we selected two available cell lines with stable expression of two different GFP variants, mEGFP on NUP‐107 and rsEGFP2 on vimentin. For rsEGFP2, the emission and thus also FRET events are reversibly modulated with light of 405 nm and 488 nm. The two prepared bioconjugates showed specific labeling with both GFP variants tested, on vimentin and NUP constructs (Figures 4 and S7–8). Imaging is possible by direct excitation and detection of the donor, the acceptor, or through FRET by exciting the donor and detecting the acceptor's emission. After the addition of DTT, the signal of the acceptor is lost with a concomitant increase in the FP's signal. While an estimation of the FRET efficiency from the donor's channel is possible, the value may be poised by possible bleaching of the donor (i. e. the FP). In particular, this may happen in imaging dim NUP structures which are more prone to “apparent” bleaching than bright vimentin fibers in Figures 3 and Figure 4. A more accurate evaluation of the FRET efficiency can be obtained from fluorescence lifetime measurements. Fluorescence lifetime imaging (FLIM) experiments show a clear increase of the donor's lifetime resulting from the acceptor's cleavage upon dithiol reduction with DTT (Figures 4 and S9). It is interesting to note that EGFP and rsEGFP2 do not show monoexponential decays. This may be due to complex photophysics of the proteins, as previously reported, [22] or to the effect of the background signal. Although bleaching was observed throughout the experiment, due to consecutive imaging at different times after DTT addition, an average FRET efficiency of 10–20 % was calculated. This much lower value compared with the cuvette experiment (Figure 2) was surprising; it indicates that not every rsEGFP2 may be accessible. Remarkably, Figure 4A (acquired before cleavage of the linker) shows homogeneous lifetime distribution with relatively short lifetimes. In the course of linker cleavage, the lifetime distribution across the image becomes broader, with longer lifetimes appearing. This experiment resembles the FRET irreversible acceptor photobleaching (apFRET) approach. [23] In apFRET, two images are acquired before and after depletion of the acceptor in the sample: the first one shows FRET, the second one provides an internal reference state to calculate the FRET efficiency. This is one of the most extensively used FRET techniques, due to its speed, simplicity and broad applicability. [24] In our case, the acceptor depletion is produced by chemical cleavage, avoiding photoirradiation with high light intensities. This minimizes undesired, unspecific photobleaching. In confocal microscopes with spectral detection, it is common to simultaneously observe various structures and protein interactions.
Figure 4.
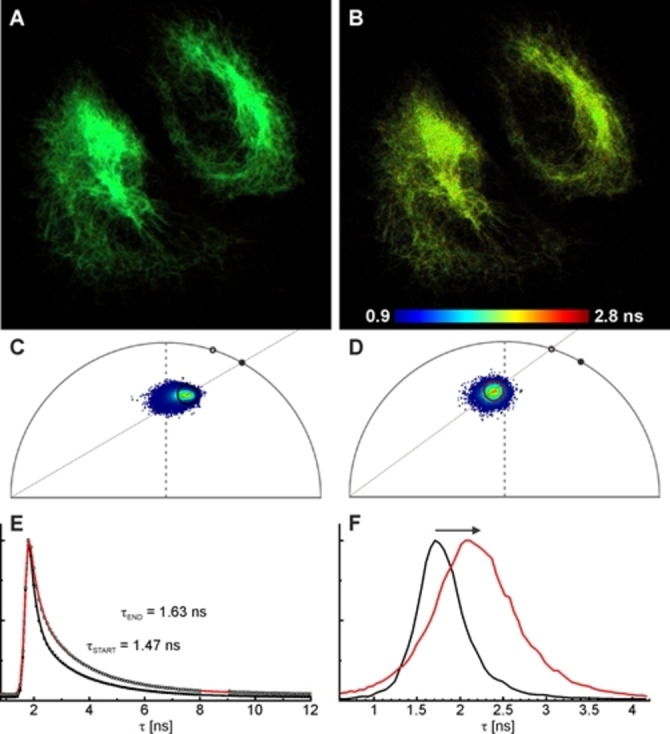
Fluorescence lifetime imaging (FLIM) with NBx2‐(Rho594‐S2‐mal)2 on U2OS cells expressing rsEGFP2 on vimentin. Fast‐FLIM images before (A) and 1 h after (B) disulfide bond cleavage with DTT (1 mM), with the corresponding phasor plots (C−D). (E) Fluorescence decay of the FP emission before (filled symbols) and after bond cleavage (hollow symbols), along with biexponential fittings (black and red lines, respectively). (F) Fast‐FLIM histograms (mean arrival time) change during the reaction, as indicated by the arrow; the black and red curves correspond to the initial and final states in (A−E). Excitation: 488 nm, detection: 510–570 nm (donor channel). The protein was activated with 405 nm irradiation (with a CW laser) on each pixel.
Figure 3.

Confocal imaging with NBq‐Rho594‐S2‐mal on U2OS cells expressing rsEGFP2 on vimentin, before (A) and 1 h after (B) disulfide bond cleavage with DTT (5 mM). The emission signal was recorded in three different channels, for the acceptor, donor and FRET (donor excitation/acceptor emission) channel. The protein was activated with 405 nm irradiation on each pixel. Excitation wavelengths / detection windows are given on top. Scale bar: 5 μm.
To demonstrate the difference and versatility of our probe, we compared acceptor depletion by photobleaching and by disulfide bond cleavage in a single field of view (Figure 5), while an additional structure was observed in a far‐red channel (Figure 5, low panel). Importantly, the photobleaching of Rho594 dye strongly affects the second far‐red channel, and results in the bleaching of AF647 dye (Figure 5B), as opposed to the chemical depletion via reduction of the disulfide bond (Figure 5C). Partial signal recovery on the far‐red channel on the last image is probably due to WGA‐AF647 diffusion.
Figure 5.

Confocal imaging with NBx2‐(Rho594‐S2‐mal)2 on U2OS cells expressing rsEGFP2 on vimentin (cyan) and co‐stained with WGA/wheat germ agglutinine‐AF647 (magenta), before (A) and after acceptor depletion experiments by photobleaching only on the indicated ROI (B), and disulfide bond cleavage (C) with DTT (5 mM, rt, 1 h). Excitation wavelengths / detection windows are given on the left side (vertically). A scheme of consecutive steps is shown on top. Scale bar: 5 μm.
Multiplexed imaging
The simultaneous observation of a large number of proteins, to assess their intracellular localization and interaction, has prompted the development of multiplexing strategies, to overcome limitations posed by antibody sources (e. g., the restricted number of animal species) and overlapping spectral channels. A public domain method of “cyclic immunofluorescence” is based on labeling with primary/secondary antibodies, image acquisition, and removal of the antibodies to start a new cycle. [25] The “antibody elution” (removal) typically involves harsh conditions, such as the use of denaturing buffers. [26] The disulfide bond cleavage ‐ a remarkably milder approach ‐ can be used as an alternative to antibody elution. To demonstrate the usefulness of our construct, we used a primary/secondary immunofluorescence method and double stained a sample for the second color (Figure 6). A standard two color image can be recorded initially (Figure 6A). The DTT treatment fully removes Rho594 markers, but leaves the primary and secondary‐AF647 antibodies intact (Figure 6B) We assign the signal reduction in the far‐red channel mostly to photobleaching. To demonstrate multiplexed imaging, we restained the vimentin filaments in situ by using an anti‐alpaca secondary antibody (Figure 6C), showing that the nanobody is still attached to the GFP. The chemical release is a very mild process and can be further repeated (Figure S10) to extend channel multiplexing.
Figure 6.

(A) Confocal imaging with NBx2‐(Rho594‐S2‐mal)2 on U2OS cells expressing rsEGFP2 on vimentin (cyan) and co‐stained with a primary antibody against NUP98 in combination with a secondary antibody labelled with AF647 (magenta). (B) Image acquired after disulfide bond cleavage with DTT (5 mM, rt, 1 h). (C) The sample was re‐labelled in situ with a secondary antibody against alpaca (340 ng/ml, rt, 10 min) and imaged without washing. Excitation wavelengths / detection windows are given on the left side (vertically). A scheme of consecutive steps is shown on top. Scale bar: 10 μm.
STED microscopy
FPs as fluorescent tags for imaging have the advantage of being genetically encodable. The main drawback of GFP and its variants is that they possess lower fatigue resistance than organic dyes and emit at around 520 nm where significant autofluorescence is observed. For STED microscopy, an additional drawback is the need of depletion at 595 nm. [22] Thus, another FPs with red‐shifted excitation and emission bands have engendered. They can be applied in STED microscopy with a 775 nm laser, but, in general, they have low emission quantum yields and slower maturation kinetics. [21] Alternatively, nanobodies against FPs were labelled with a red‐emitting synthetic dye and used in STED microscopy, applying direct excitation and detection of the dye.[ 3 , 4 ] We expected that the bioconjugates of this work would be applicable as a FRET imaging pair in STED microscopy. In this case, we could excite the donor (GFP) at 488 nm and detect the acceptor signal (Rho594) with optical superresolution by using a very powerful 775 nm STED laser. As an advantage, this would provide better separation between the excitation and STED wavelengths, excluding the re‐excitation of the donor dye (GFP) with STED light. Further on, irradiation in the near‐IR (775 nm light) reduces photodamage and undesired background emission. And indeed, superresolution “FRET‐STED” imaging was possible (Figure 7D). As a control, confocal (Figure 7A,B) and “standard” STED imaging using direct excitation/emission/depletion of the acceptor (Figure 7C) were performed. The images acquired with direct excitation had better signal‐to‐noise ratio, but the apparent optical resolution observed in single filaments was comparable for direct‐STED and FRET‐STED modes. By increasing FRET efficiency (better spectral overlap, shorted distance and higher values of the orientation factors), it should be possible to reduce the noise in the FRET‐STED image, as the lifetime of the acceptor is not altered by the FRET process. We performed a similar experiment (Figure S11) without the linker (e. g. labeling the nanobody with AF594 maleimide), to see if the length of the linker plays a certain role, and we found the images to be very similar. Thus, the cleavable linker can be used for channel multiplexing as demonstrated above, without compromising STED imaging.
Figure 7.

Confocal (A−B) and STED (C−D) images of U2OS cells expressing rsEGFP2 on vimentin, by excitation and detection of the acceptor dye Rh594 (A, C) and by excitation of the donor (GFP) and detection of the acceptor (B, D). Depletion is always performed for the acceptor with a 775 nm STED laser. (E−F) Line‐profiles (average of five pixels) on indicated places on (A) along with Gaussian (confocal data) or Lorentzian fits (STED data), showing the resolution enhancement and two neighboring filaments resolved in STED (G−H). The protein rsGFP2 was activated with 405 nm irradiation on each pixel. Scale bar: 2 μm.
Conclusion
Covalent binding of anti‐GFP nanobodies with the fluorescent dye having a cleavable linker was realized (Figure 1). The non‐covalent binding of EGFP (FRET donor) with these nanobodies bearing one or two dye residues was studied in vitro and in cellulo. The linker can be cleaved by applying a mild reducing agent (DTT) recovering the donor (GFP) signal and essentially the same type of reactive group (‐SH) attached to a nanobody ‐ FP pair. This approach enables to evaluate the FRET efficiency with one probe, within one sample and in one labeling experiment, as an alternative or addition to other methods based on acceptor depletion. For that, we compared the fluorescence intensity and lifetime of the FRET donor (GFP) before and after cleavage of the acceptor. The detachment of the acceptor confirmed that the change in donor emission lifetime (Figure 4) was due to a FRET interaction. The mapping of lifetime values may give information on the distances between the nanobodies and the target FP in the subdiffractional region of less than 10 nm (Förster radius). While the experiments performed and reported here may be considered as a proof of principle, we believe such constructs may find interesting applications in protein‐protein interaction studies, [27] such us the fluorescent‐three‐hybrid (F3H) strategy [28] and multiplexed imaging technologies. We also showed the utility of the bioconjugates (dye‐NB‐FP) in superresolution “FRET‐STED” microscopy. This option takes advantage of the higher photostability and longer lifetimes of the synthetic dyes (compared to FPs which are applied here as “light antennas” ‐ FRET donors), as well as the use of near‐IR lasers as STED sources (775 nm, instead of 595 nm light typically used for GFP).
Conflict of interest
The authors declare no conflict of interest.
1.
Supporting information
As a service to our authors and readers, this journal provides supporting information supplied by the authors. Such materials are peer reviewed and may be re‐organized for online delivery, but are not copy‐edited or typeset. Technical support issues arising from supporting information (other than missing files) should be addressed to the authors.
Supporting Information
Acknowledgements
The stable cell line U2OS‐rsEGFP2‐vimentin was a courtesy of the group of Prof. Stefan Jakobs (University Medical Center Göttingen and MPI‐NAT, Göttingen). We are grateful to Prof. Stefan Jakobs for discussion at the beginning of this work. We thank Miroslaw Tarnawski (MPI‐MR) for providing fluorescent proteins. We thank the Optical Microscopy facility of MPI‐MR for the use of the confocal and STED microscopes. We thank Ms. Birgit Koch (Department of Chemical Biology, MPI‐MR) for the availability and the assistance on FLIM imaging. We thank the MS Core Facility in MPI‐MR for recording mass‐spectra of proteins. We are grateful to Mr. Jürgen Bienert (MPI‐NAT) for performing HPLC separations and Dr. Holm Frauendorf with co‐workers (Institut für organische und biomolekulare Chemie, Georg‐August‐Universität Göttingen) for measuring high resolution mass‐spectra. Open Access funding enabled and organized by Projekt DEAL.
A. Aktalay, F. Ponsot, M. L. Bossi, V. N. Belov, S. W. Hell, ChemBioChem 2022, 23, e202200395.
Contributor Information
Dr. Vladimir N. Belov, Email: vladimir.belov@mpinat.mpg.de.
Prof. Stefan W. Hell, Email: Stefan.Hell@mpinat.mpg.de.
Data Availability Statement
The data that support the findings of this study are available in the supplementary material of this article.
References
- 1. Schumacher D., Helma J., Schneider A. F. L., Leonhardt H., Hackenberger C. P. R., Angew. Chem. Int. Ed. 2018, 57, 2314–2333; [DOI] [PMC free article] [PubMed] [Google Scholar]; Angew. Chem. 2018, 130, 2336–2357. [Google Scholar]
- 2. de Beer M. A., Giepmans B. N. G., Front. Cell. Neurosci. 2020, 14, 573278. [DOI] [PMC free article] [PubMed] [Google Scholar]
- 3. Schneider A. F. L., Benz L. S., Lehmann M., Hackenberger C. P. R., Angew. Chem. Int. Ed. 2021, 60, 22075–22080; [DOI] [PMC free article] [PubMed] [Google Scholar]; Angew. Chem. 2021, 133, 22246–222512. [Google Scholar]
- 4. Cramer K., Bolender A.-L., Stockmar I., Jungmann R., Kasper R., Shin J. Y., Int. J. Mol. Sci. 2019, 20, 3376. [DOI] [PMC free article] [PubMed] [Google Scholar]
- 5. Uno K., Aktalay A., Bossi M. L., Irie M., Belov V. N., Hell S. W., Proc. Nat. Acad. Sci USA 2021, 118, e2100165118. [DOI] [PMC free article] [PubMed] [Google Scholar]
- 6.
- 6a.B. Wieb van der Meer, Förster Theory, in: FRET: Förster Resonance Energy Transfer: From Theory to Applications (Eds.: I. Medintz, N. Hildebrandt), Wiley-VCH, Weinheim, 2013, pp. 23–62;
- 6b.E. Beghein, J. Gettemans, Front. Immunol. 2017, 8, https://www.frontiersin.org/article/10.3389/fimmu.2017.00771. [DOI] [PMC free article] [PubMed]
- 7.
- 7a. Ibraheem A., Campbell R. E., Curr. Opin. Chem. Biol. 2010, 14, 30–36; [DOI] [PubMed] [Google Scholar]
- 7b. Soleja N., Manzoor O., Khan I., Ahmad A., Mohsin M., J. Biosci. 2018, 43, 763–784. [PubMed] [Google Scholar]
- 8. Prasher D. C., Eckenrode V. K., Ward W. W., Prendergast F. G., Cormier M. J., Gene 1992, 111, 229–233. [DOI] [PubMed] [Google Scholar]
- 9. Cormack B. P., Valdivia R. H., Falkow S., Gene 1996, 173, 33–38. [DOI] [PubMed] [Google Scholar]
- 10.Structures of GFP and nanobodies (PDB ID: 5IVO) used in figures were created with BioRender.com: Braun M. B., Traenkle B., Koch P. A., Emele F., Weiss F., Poetz O., Stehle T., Rothbauer U., Sci. Rep. 2016, 6, 19211. [DOI] [PMC free article] [PubMed] [Google Scholar]
- 11.
- 11a. Griffin B. A., Adams S. R., Tsien R. Y., Science 1998, 281, 269–272; [DOI] [PubMed] [Google Scholar]
- 11b.B. A. Griffin, S. R. Adams, J. Jones, R. Y. Tsien, in Methods in Enzymology, Vol. 327 (Eds.: J. Thorner, S. D. Emr, J. N. Abelson), Academic Press, 2000, pp. 565–578;
- 11c. Suzuki M., Ito Y., Savage H. E., Husimi Y., Douglas K. T., Chem. Lett. 2003, 32, 306–307; [Google Scholar]
- 11d. Abraham B. G., Tkachenko N. V., Santala V., Lemmetyinen H., Karp M., Bioconjugate Chem. 2011, 22, 227–234; [DOI] [PubMed] [Google Scholar]
- 11e. Kuhn S. M., Rubini M., Müller M. A., Skerra A., J. Am. Chem. Soc. 2011, 133, 3708–3711; [DOI] [PubMed] [Google Scholar]
- 11f. Voss S., Zhao L., Chen X., Gerhard F., Wu Y.-W., J. Pept. Sci. 2014, 20, 115–120; [DOI] [PubMed] [Google Scholar]
- 11g. Casiraghi A., Longhena F., Straniero V., Faustini G., Newman A. H., Bellucci A., Valoti E., ChemMedChem 2020, 15, 1330–1337. [DOI] [PMC free article] [PubMed] [Google Scholar]
- 12. Zhang W., Suzuki M., Ito Y., Douglas K. T., Chem. Lett. 2005, 34, 766–767. [Google Scholar]
- 13.
- 13a. Suzuki M., Ito Y., Savage H. E., Husimi Y., Douglas K. T., Biochim. Biophys. Acta Gene Struct. Expression 2004, 1679, 222–229; [DOI] [PubMed] [Google Scholar]
- 13b. Suzuki M., Ito Y., Sakata I., Sakai T., Husimi Y., Douglas K. T., Biochem. Biophys. Res. Commun. 2005, 330, 454–460; [DOI] [PubMed] [Google Scholar]
- 13c. Kihara T., Nakamura C., Suzuki M., Han S.-W., Fukazawa K., Ishihara K., Miyake J., Biosens. Bioelectron. 2009, 25, 22–27; [DOI] [PubMed] [Google Scholar]
- 13d. Suzuki M., Tanaka S., Ito Y., Inoue M., Sakai T., Nishigaki K., Biochim. Biophys. Acta Mol. Cell Res. 2012, 1823, 215–226; [DOI] [PubMed] [Google Scholar]
- 13e. Suzuki M., Sakata I., Sakai T., Tomioka H., Nishigaki K., Tramier M., Coppey-Moisan M., Anal. Biochem. 2015, 491, 10-17; [DOI] [PubMed] [Google Scholar]
- 13f. Nichani K., Li J., Suzuki M., Houston J. P., Cytometry Part A 2020, 97, 1265–1275. [DOI] [PMC free article] [PubMed] [Google Scholar]
- 14. McRae S. R., Brown C. L., Bushell G. R., Protein Expression Purif. 2005, 41, 121–127. [DOI] [PubMed] [Google Scholar]
- 15. Ormö M., Cubitt A. B., Kallio K., Gross L. A., Tsien R. Y., Remington S. J., Science 1996, 273, 1392–1395. [DOI] [PubMed] [Google Scholar]
- 16. http://www.fpbase.org/fret.
- 17. Mthembu S. N., Sharma A., Albericio F., de la Torre B. G., ChemBioChem 2020, 21, 1947–1954. [DOI] [PubMed] [Google Scholar]
- 18. Leriche G., Chisholm L., Wagner A., Bioorg. Med. Chem. 2012, 20, 571–582. [DOI] [PubMed] [Google Scholar]
- 19. Danieli B., Giardini A., Lesma G., Passarella D., Peretto B., Sacchetti A., Silvani A., Pratesi G., Zunino F., J. Org. Chem. 2006, 71, 2848–2853. [DOI] [PubMed] [Google Scholar]
- 20. Kirchhofer A, Helma J., Schmidthals K., Frauer C., Cui S., Karcher A., Pellis M., Muyldermans S., Casas-Delucchi C. S., Cardoso M. C., Leonhardt H., Hopfner K.-P., Rothbauer U., Nat. Struct. Mol. Biol. 2010, 17, 133–138. [DOI] [PubMed] [Google Scholar]
- 21.
- 21a. Heikal A. A., Hess S. T., Webb W. W., Chem. Phys. 2001, 274, 37–55; [Google Scholar]
- 21b. Cotlet M., Hofkens J., Maus M., Gensch T., van der Auweraer M., Michiels J., Dirix G., van Guyse M., Vanderleyden J., Visser A. J. W. G., De Schryver F. C., J. Phys. Chem. B 2001, 105, 4999–5006; [Google Scholar]
- 21c. Testa I., D′Este E., Urban N. T., Balzarotti F., Hell S. W., Nano Lett. 2015, 15, 103–106. [DOI] [PubMed] [Google Scholar]
- 22.
- 22a. Hein B., Willig K., Hell S. W., Proc. Nat. Acad. Sci. USA 2008, 105, 14271–14276; [DOI] [PMC free article] [PubMed] [Google Scholar]
- 22b. Tønnesen J., Katona G., Rózsa B., Nägerl U. V., Nat. Neurosci. 2014, 17, 678–685. [DOI] [PubMed] [Google Scholar]
- 23. Jares-Erijman E. A., Jovin T. M., Nat. Biotechnol. 2003, 21, 1387–1395. [DOI] [PubMed] [Google Scholar]
- 24. Jares-Erijman E. A., Jovin T. M., Curr. Opin. Chem. Biol. 2006, 10, 409–416. [DOI] [PubMed] [Google Scholar]
- 25.
- 25a. Lin J.-R., Fallahi-Sichani M., Sorger P. K., Nat. Comm. 2015, 6, 8390; [DOI] [PMC free article] [PubMed] [Google Scholar]
- 25b. Lin J.-R., Fallahi-Sichani M., Chen J.-Y., Sorger P. K., Curr. Prot. Chem. Biol. 2017, 8, 251–264. [DOI] [PMC free article] [PubMed] [Google Scholar]
- 26.
- 26a. Gut G., Herrmann M., Pelkmans L., Science 2018, 361, eaar7042; [DOI] [PubMed] [Google Scholar]
- 26b. Pham T., Nazaroff C. D., Labaer J., Guo J., Int. J. Mol. Sci. 2021, 22, 8644. [DOI] [PMC free article] [PubMed] [Google Scholar]
- 27. Drees C., Raj A. N., Kurre R., Busch K. B., Haase M., Piehler J., Angew. Chem. Int. Ed. 2016, 55, 11668–11672; [DOI] [PubMed] [Google Scholar]; Angew. Chem. 2016, 128, 11840–11845. [Google Scholar]
- 28. Herce H. D., Deng W., Helma J., Leonhardt H., Cardoso M. C., Nat. Commun. 2013, 4, 2660. [DOI] [PMC free article] [PubMed] [Google Scholar]
Associated Data
This section collects any data citations, data availability statements, or supplementary materials included in this article.
Supplementary Materials
As a service to our authors and readers, this journal provides supporting information supplied by the authors. Such materials are peer reviewed and may be re‐organized for online delivery, but are not copy‐edited or typeset. Technical support issues arising from supporting information (other than missing files) should be addressed to the authors.
Supporting Information
Data Availability Statement
The data that support the findings of this study are available in the supplementary material of this article.