

Abstract
In recent years, the number of people suffering from cancer has risen rapidly and the World Health Organization and U.S. and European governments have identified this pathology as a priority issue. It is known that most bioactive anticancer molecules do not target a single protein but exert pleiotropic effects, simultaneously affecting multiple pathways. In our study, we designed and synthesized a new series of silver N‐heterocyclic carbene (NHC) complexes [(NHC)2Ag]+[AgX2]− (X=iodide or acetate). The new complexes were active against two human breast cancer cell lines, MCF‐7 and MDA‐MB‐231. These compounds showed multiple target actions as anticancer, by inhibiting in vitro the activity of the human topoisomerases I and II and interfering with the cytoskeleton dynamic, as also confirmed by in silico studies. Moreover, the antimicrobial activity of these silver complexes was studied against Gram‐positive/negative bacteria. These dual properties provide a two‐tiered approach, making these compounds of interest to be further deepened for the development of new chemotherapeutic agents.
Keywords: human topoisomerases, actin, silver N-heterocyclic carbine complexes, breast cancer, docking studies
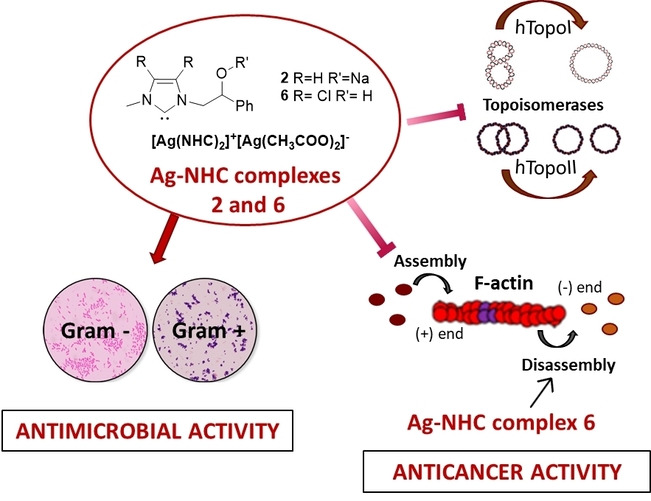
It is known that most bioactive anticancer molecules do not target a single protein but exert pleiotropic effects, simultaneously affecting multiple pathways. We designed and synthesized a new series of silver N‐heterocyclic carbene (NHC) complexes that are active against two human breast cancer cell lines and that show multiple target actions by inhibiting human topoisomerase I and II activity in vitro and interfering with cytoskeleton dynamics. The antimicrobial activity of these silver complexes was also studied against Gram‐positive/negative bacteria. Compounds 2 and 6 inhibit human topoisomerases I and II and actin polymerization. Compound 6 also induces F‐actin depolymerization.
Introduction
In 2021, 1,898,160 new cancer cases and 608,570 cancer deaths were expected to occur in the United States, as assessed by the American Cancer Society (ACS). [1] Current treatment strategies for cancer are represented by surgery, radiation, chemotherapy, laser, and combination therapy. However, the failure of chemotherapy is reported regularly and is mainly ascribable to the drugs side effects and the evolution of drug‐resistant cancer cells. The impact of cancer on women's health is unquestionable. In 2018, approximately 2.1 million people worldwide were diagnosed with breast cancer. [2] Particularly, triple‐negative breast cancer (TNBC), in which the three major receptors, namely estrogen receptor (ER), progesterone receptor (PR), and human epidermal growth factor receptor 2 (HER2), are absent or not overexpressed, presents as an aggressive disease recurring and often metastasizing, generally resulting in the development of resistance to chemotherapy. [3]
For this reason, the search for new treatment strategies is needed. In recent years, multitarget therapy has been considered an effective strategy, [4] and metal complexes, [5] mostly those with N‐heterocyclic carbene (NHC) ligands, received great consideration. [6] NHC ligands are strong σ‐donors enhancing the catalytic activity of their transition metal complexes; they confer increased stability to complexes and are endowed with great synthetic flexibility. [7] Organometallic pharmaceutical research has been primarily focused on NHC platinum and gold complexes; less is known about NHC silver complexes, despite their numerous medicinal applications have been well demonstrated. [8] Silver compounds have been used for centuries as antimicrobial agents for the ability of the silver cation to interact with the membrane or with the thiol groups of bacterial enzymes. [9] Nowadays, silver is still extensively utilized to prevent infections in wounds, burns, ulcers, and coating catheters. It has no effects on mammalian cell membranes and its toxicity in humans is very low within the determined exposure limits of 0.01–0.1 mg/m3. [10] Over the years, the binding of different ligands to silver atom allowed to obtain new anticancer and antimicrobial agents with improved pharmacological properties. Indeed, silver(I) complexes containing 2,6‐bis(substituted)pyridine derivatives displayed a higher anticancer activity than doxorubicin (used as reference drug) and the corresponding ligands against different human cancer cells (HePG2, A549, HT29, MCF7). [11] Mohd Sofyan et al. synthetized five silver(I) complexes containing a mixed ligand system of phosphine and thiazolidine. These complexes showed a good antiplasmodial properties on chloroquine‐resistant P. falciparum parasite and an in vitro antiproliferative activity towards MDA‐MB‐231 and MCF‐7 breast cancer cell lines, as well as HT‐29 colon cancer cell line. [12] Moreover, Ag(I) complexes with heterocyclic thioamides and phosphine ligands exhibited high in vitro antimicrobial potency and cytotoxicity on HeLa and MCF‐7 cancer cells. [13] Recently the anticancer activity of NHC silver complexes is receiving also rising interest. [14] Indeed, silver complexes have demonstrated antitumor properties, with higher activities, lower side effects, and resistance development than cisplatin, carboplatin, and oxaliplatin. [15] Recently, the dual action of NHC−Ag complexes, both as anticancer against different tumor cell lines and antimicrobial agents, has been reported. [16] However, unlike NHC−Au complexes, for which different mechanisms have been proposed by our research group, [17] that of NHC−Ag complexes as antitumor agents has not been fully elucidated yet. [18] Herein, we report the synthesis and investigation of new NHC silver complexes as anticancer agents (Scheme 1).
Scheme 1.

Structures of silver N‐heterocyclic carbene (NHC) complexes.
It is worth note that between the mono and bis carbene species, reported in the Scheme 1, there is an equilibrium that makes both species particularly interesting in biological field. [19] The anticancer activity was evaluated towards two breast cancer cell lines, MCF‐7 and MDA‐MB‐231. The most active compounds exert multiple target action against human topoisomerases I and II (namely hTopo I and hTopo II) and actin. Indeed, in vitro and in silico studies demonstrated the capability of the most active compounds, 2 and 6, to inhibit both hTopo I and hTopo II, essential enzymes catalyzing changes in the torsional and flexural state of DNA that are implicated in replication, transcription and other cellular processes. Both compounds were also able to interfere with the actin cytoskeleton, a critical system existing in eukaryotic cells, which determines cell shape and plays multiple roles in cell motility, morphology, and division. Particularly, as assessed by specific in vitro assays, compounds 2 and 6 were found to be inhibitors of the actin polymerization and, in addition, compound 6 was also able to accelerate the actin depolymerization. Moreover, most of the newly synthesized compounds were endowed with dual anticancer and antibacterial activity. In particular, they evidenced a good antibacterial activity against some Gram‐positive and Gram‐negative bacteria belonging to the ATCC collection (Staphylococcus aureus and Escherichia coli). Thus, based on the above findings, we propose compounds 2 and 6 as new NHC−Ag complexes to be studied as effective anticancer agents and deepened for treatment of the bacterial infections.
Results and Discussion
Chemistry
Complexes [N‐methyl,N’‐[(2‐sodiumalcholate‐2‐phenyl)ethyl])‐imidazole‐2‐ylidine]‐silver(I)]+ [iodide]− 1a and [N‐methyl,N’‐(2‐metoxy‐2‐phenyl) ethyl‐imidazole2‐ylidene‐silver(I)]+ [iodide]− 3a were synthesized according to a previously described procedure. [20]
The new silver acetate complexes [(N‐methyl‐N’‐[(2‐sodium alcoholate‐2‐phenylethyl)imidazole‐2‐ylidine]silver(I)] acetate 2 a, [(N‐methyl‐N’‐(2‐methoxy‐2‐phenylethyl)imidazole‐2‐ylidine]silver(I)] acetate 4 a, [N‐methyl‐N’‐[(2‐hydroxy‐2‐phenyl)ethyl])imidazole‐2‐ylidine]silver(I)] acetate 5 a and [4,5‐dichloro‐(N‐methyl‐N’‐(2‐hydroxy‐2‐phenyl)ethylimidazole‐2‐ylidene]silver(I)] acetate 6 a were synthesized according to Scheme 2 by the salt metathesis reactions between the corresponding bis asymmetric NHC silver(I) iodide complexes[ 20 , 21 ] and silver acetate (1.0 equiv) in dichloromethane or methanol at room temperature for 6 h under the exclusion of light, obtaining yields in the range of 59–71 %. [22]
Scheme 2.

Synthesis of NHC silver(I) acetate 2, 4, 5, and 6 complexes.
The complexes are soluble in polar solvents, such as dimethyl sulfoxide and chloroform; they are stable in air and towards moisture. Silver complexes were successfully characterized using 1H and 13C{1H} NMR spectroscopy and mass spectrometry (ESI or MALDI) and elemental analysis techniques. The success of the counterion exchange reaction was confirmed, in the 1H and 13C spectra, by the presence of signals attributable to the acetate anion. The 1H NMR spectrum of 2 (CDCl3) shows one singlet for the methyl hydrogens of the acetate ligand at 2.01 ppm; accordingly, in 13C NMR singlet for the carbonyl carbon at 179.0 ppm and at 23.0 ppm for the methyl carbon of the acetate ligand have been observed, whereas the carbenic carbon was observed at 179.5 ppm. For complex 4, the 1H NMR spectrum, (DMSO‐d6) shows singlet for the protons of methyl of the acetate ligand at 1.98 ppm; in 13C NMR the carbenic carbon was assigned at 182.7 ppm, whereas the carbonyl carbon is at 173.4 ppm and the methyl carbon of the acetate ligand is at 24.1 ppm. In the 1H NMR spectra in DMSO‐d6 of the complexes 5 and 6 the signal at 1.73 ppm is attributable to the methyl group. In the 13C NMR spectra the resonances of carbenic carbons are at 179.3 and 182.2 ppm, and the carbonyl carbons at 175.2 and 174.5 ppm, respectively. The resonances of methyl carbons give signals at 24.1 and 24.7 ppm, respectively.
For all complexes, the elemental analysis gives the predictable composition in C, H, N, whereas their structure in the gas phase can be elucidated by mass spectrometry. In fact, ESI or MALDI spectra show the peaks due to [Ag(NHC)2]+ species. This is in line with several scientific papers that reported a dynamic equilibrium in solution between mono (NHC‐MX) and bis carbenic metallic species [(NCH)2M]+ [MX2]−. [19c]
Antibacterial activity evaluation
Silver compounds have been used for many years as effective antimicrobial agents. [23] Among the several Ag complexes, the Ag‐NHC ones are of considerable importance as they exhibit a high activity against various types of Gram‐positive and negative bacteria and others microorganisms. Indeed, in a recent work Slimani et al. demonstrated that silver(I)‐NHC complexes were effective against Salmonella Typhimurium, Listeria monocytogenes and Micrococcus luteus with moderate to high activity. [24] Moreover, others new Ag(I)‐NHC complexes showed a high antimicrobial activity against several microorganisms tested, reducing also E. coli and C. albicans biofilms significantly. [25]
Starting from these encouraging results, all the synthesized silver complexes (1‐6) were investigated for their antibacterial activity against both Gram‐positive and Gram‐negative bacteria. Minimum inhibitory concentration (MIC) and Minimum bactericidal concentration (MBC) were determined for the synthesized silver compounds according to CLSI guidelines. [26]
DMSO did not exhibit any antimicrobial activity; conversely, all strains used resulted ampicillin‐sensible. The antimicrobial activities of all the Ag complexes, expressed in μg/mL, are reported in Table 1. Our data showed that many of the tested compounds possessed a significant antibacterial activity. Particularly, most of the compounds evidenced antibacterial activity in E. coli and S. aureus strains at a concentration of 5 or 10 μg/mL. Conversely, higher concentrations of the tested Ag complexes were required to inhibit the E. faecalis strain growth (10 or 20 μg/mL).
Table 1.
MIC results of the Ag complexes (1–6).
|
Complex |
MIC [μg/mL][a] |
||
|---|---|---|---|
|
E. coli [b] |
S. aureus [b] |
E. faecalis [b] |
|
|
1 |
5 |
10 |
10 |
|
2 |
5 |
5 |
10 |
|
3 |
5 |
5 |
10 |
|
4 |
5 |
5 |
20 |
|
5 |
10 |
5 |
20 |
|
6 |
10 |
5 |
10 |
[a] Minimum inhibitory concentration. [b] Ampicillin‐sensitive.
Specifically, the complexes 1–4 inhibited E. coli at the same concentration of 5 μg/mL, while complexes 5 and 6 exerted their inhibitory growth effects at a higher concentration on the same strain (10 μg/mL). Concerning the S. aureus strain, all the Ag complexes inhibited its growth at the concentration of 5 μg/mL, except for compound 1 (MIC=10 μg/mL). Moreover, a similar activity was found against E. faecalis strain, on which compounds 1–3 and 6 showed MIC values of 10 μg/mL, while compounds 4 and 5 presented a higher antibacterial activity (20 μg/mL).
Regarding the determination of the lowest concentration capable of completely killing bacteria (MBC), our data showed that all complexes exhibited an MBC greater than or equal to 100 μg/mL.
Overall, our results showed that the synthesized silver complexes represent very promising candidates to be used as antibacterial compounds both alone and in adjuvant therapies.
Anticancer activity of the complexes 1–6
NHC silver complexes are effective against various human cancer cell lines.[ 14d , 17a , 17b , 27 ] In order to assess the ability of the newly synthesized Ag complexes (1–6) to inhibit the cancer cells growth, we used the MTT assay on two breast cancer cells, the triple‐negative MDA‐MB‐231 and the ERα(+) MCF‐7 cells. Some of the studied compounds demonstrated activity on both the breast cancer cells and as reference molecule Cisplatin (Table 2), an alkylating agent used to treat various forms of cancer, has been used. Particularly, two Ag complexes (2 and 6) resulted able to decrease the viability of the cells with a better activity than Cisplatin itself. Indeed, compound 2 was more active on the triple‐negative MDA‐MB‐231 cells with an IC50 value of 7.0±0.4 μM, while compound 6 displayed a better anticancer activity on the MCF‐7 cells with an IC50 value of 13.2±0.3 μM. The treatment with the other Ag complexes showed a moderate inhibitory effect on both the breast cancer cells proliferation with IC50 value ranging from 18.4 to 52.6 μM. The anticancer activity of all the studied compounds was also compared to another reference molecule, Latrunculin A (LA), a reversible inhibitor of actin assembly, and was lower than that of LA. Cytotoxicity of the newly synthesized compounds was also studied against the normal human mammary epithelium cell line MCF‐10 A, used as a model in toxicity studies. Both LA and Cisplatin exerted strong cytotoxicity towards MCF‐10 A with IC50 values of 4.5x10⁻²±1.2 and 81.3±0.6 μM, respectively. Conversely, all the Ag‐complexes did not show any cytotoxic effect on the same normal cells, displaying IC50 values higher than 200 μM, with the exception of compound 1 which instead caused a reduction in the MCF‐10 A proliferation with an IC50 value of 71.7±1.3 μM, similar to that of Cisplatin.
Table 2.
IC50 values of Ag metal complexes (1‐6), Cisplatin, and Latrunculin A, expressed in μM. MTT assay was used to evaluate the anticancer activity of all the studied Ag‐complexes, incubating the cells with different concentrations of the compounds for 72 h. The means ± standard deviations are shown.
|
Compound |
IC50 [μM] |
||
|---|---|---|---|
|
|
MDA‐MB‐231 |
MCF‐7 |
MCF‐10A |
|
1 |
43.5±0.6 |
36.2±1.1 |
71.7±1.3 |
|
2 |
7.0±0.4 |
18.3±0.8 |
>200 |
|
3 |
52.6±0.3 |
31.8±0.8 |
>200 |
|
4 |
20.9±1.1 |
30.7±0.7 |
>200 |
|
5 |
>100 |
18.4±0.6 |
>200 |
|
6 |
38.1±0.8 |
13.2±0.3 |
>200 |
|
Latrunculin A |
2.4x10⁻²±0.9 |
0.14±1.0 |
4.5x10⁻²±1.2 |
|
Cisplatin |
28.7±0.4 |
35.8±0.7 |
81.3±0.6 |
In the attempt to rationalize the behavior of complexes 1–6, molecular modeling studies were conducted to clarify some structural aspects of the involved species. Minimum energy geometries of monomeric NHC‐AgX complexes 1–6 are depicted in Figure 1.
Figure 1.

Minimum energy structures of 1–6. Distance is in Å. Part of hydrogens of NHC skeleton have been omitted for clarity.
According to results of Table 2, complexes NHC‐AgX with X=Ac resulted more active on MDA‐MB‐231 and MCF‐7 than their analogues with X=I (2>1 and 4>3). Moreover, complex 6 presenting chlorides on the NHC backbone performs better than 5 bearing hydrogens. We believe that, besides the nature of the NHC ligand, different performances of analogues complexes could be related to the Ag−X interaction. Indeed, the metal‐X bond in the monomeric complex (NHC‐AgX) represents a crucial parameter to evaluate the stability of the latter toward the formation of bis carbene species [(NCH)2Ag]+ [MX2]−. The dynamic equilibrium in solution between mono (NHC‐AgX) and bis carbene species could influence the activity on the cancer cells. In this framework, we evaluated the BDE (Bond Dissociation Energy) of counterion X in the NHC‐AgX species by DFT calculations (Table 3).
Table 3.
Bond‐dissociation energies (BDE) of counterion groups for 1–6 complexes. Values obtained with DFT calculations using the PBE0/6–311 G(d,p) basis set.
|
Compound (NHC‐AgX) |
BDE (X) [kcal/mol] |
|---|---|
|
1 |
31.9 |
|
2 |
48.7 |
|
3 |
124.4 |
|
4 |
146.6 |
|
5 |
141.1 |
|
6 |
143.7 |
As shown in Table 3, BDE can be very different depending on the nature of the complex, nevertheless, we can observe that the Ag−I bond is always weaker than the Ag−Ac bond for analogous complexes (BDE 2>1 and 4>3). Moreover, when electron‐withdrawing substituents are located on the NHC backbone (as for complex 6) Ag−Ac bond strength is enhanced with respect to the hydrogen analogous substituted 5. In conclusion, the activity of the considered complexes can be influenced by the nature of the NHC ligand, but, according to computational results, would also strongly depend on the strength of the Ag−X bond. In some cases, differences in the complex activity are more relevant when X changes (see for example IC50 values in Table 2 for complexes 1 and 2) than when NHC skeleton changes (see for example IC50 values in Table 2 for complexes 1 and 3).
Complexes 2 and 6 interfere with the actin organization
Considering that the treatment with the Ag complexes under study produced a dramatic shape transformation in both the breast cancer cells, with the formation of cytoplasmic extensions or round cells, their involvement in altering the cytoskeleton dynamic was hypothesized. The principal cytoskeletal components are represented by microtubules and actin filaments that regulate essential processes involved in tumor development and progression, such as morphological changes or cell migration, and play vital roles in cell signaling, division, and motility. [28]
The important role of the cytoskeleton in tumorigenesis and metastasis formation pushed us to assess the ability of the most active Ag complexes 2 and 6 to interfere with actin, one of the main components of the cell cytoskeleton. The correct equilibrium between the monomeric actin, namely G‐actin, and its filamentous form, the F‐actin, is substantially altered in tumor cells and is involved in the uncontrolled growth of tumor cells and in their ability to give rise to metastases. [29] Research efforts are aimed at discovering new molecules capable of interfering with the actin polymerization and depolymerization processes. Different types of cytochalasin and Latrunculin have been employed in many research studies, due to their easy membrane permeation and different types of behavior against actin polymerization and depolymerization. Indeed, Latrunculin A (LA) can bind and sequester G‐actin monomers, inhibiting actin polymerization and, at the same time, favoring the dissociation of actin filaments. [30] Conversely, cytochalasin B (CB) inhibits actin polymerization, impeding the addition of monomers to the actin filaments, but it does not increase the depolymerization reaction. [31] However, both the fungal toxins are characterized by a dramatic cytotoxicity on the normal cells, thus their use as agents able to disrupt the cytoskeleton organization is hampered by this severe limitation. In this context, finding compounds that interfere with actin polymerization and depolymerization and that do not affect normal cell viability represents a significant goal in the fight against cancer. With this in mind, we carried out specific in vitro actin polymerization and depolymerization assays.
The results of the polymerization assay, plotted in Figure 2a, demonstrated that in the control reaction, where only DMSO is present, G‐actin monomers polymerize very quickly; indeed, the CTRL curve reaches a value of about 37,000 relative fluorescence units (RFU) after only 6 minutes, then maintaining the plateau until the end of the experiment.
Figure 2.
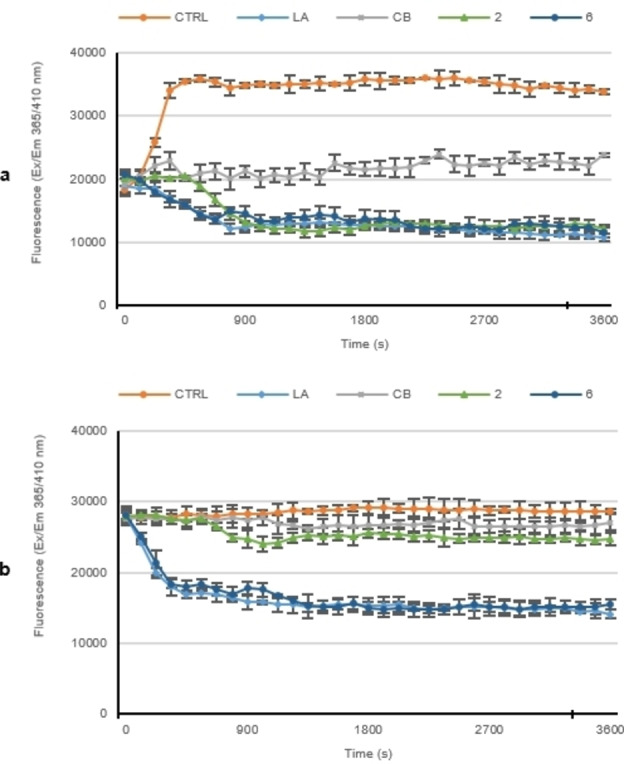
a) In vitro actin polymerization assay. The effect of compounds 2 and 6 (5 μM) on in vitro actin polymerization was evaluated, incubating them with the labeled rabbit muscle actin. In vitro actin polymerization assay: compounds 1 and 6. b) In vitro actin depolymerization assay. Compounds 2 or 6 were added to the reaction mixture after actin polymerization, in order to determine their ability to interfere with the depolymerization process. For both the assays, DMSO was used as a negative control, while actin‐targeting agents, LA and CB (5 μM), were used as reference molecules. The assembly of actin filaments was determined by measuring the fluorescence (λex/em: 365/410 nm) in kinetic mode for 1 h at room temperature using a microplate reader. The graphics are representative of three separated tests.
Conversely, LA and CB, used at a concentration of 5 μM, totally impeded the actin polymerization as visible from the curve, where the initial rapid polymerization of G‐monomers, seen in the CTRL reaction, was totally absent. Indeed, the LA curve decreased until it reached a value of approximately 12,000 RFU after 10 minutes, maintaining it until the end of the experiment. The incubation of actin monomers with CB also impeded the actin polymerization, producing a curve that maintained a constant RFU of approximately 20,000 from the beginning to the end of the reaction.
Finally, compounds 2 and 6, used at a concentration equal to 5 μM, showed an inhibitory activity on the polymerization of G‐actin, higher than that of CB, and with a similar efficiency of LA. As plotted in Figure 2a, the compound 2 curve reaches its lowest point, with a value of about 12,000 RFU, after about 9 minutes, maintaining it until the end of the reaction. Similarly, compound 6 produced a curve that reached its lowest point at around 12 minutes with a value of approximately 13,000 RFU. The trend of both the Ag complexes curves were superimposable to that obtained from LA and lower than that of CB, thus demonstrating the good activity of compounds 2 and 6 as actin polymerization activity inhibitors.
Next, we carried out a depolymerization assay for both the Ag complexes, in order to determine whether they could act also as actin depolymerization favoring agents (Figure 2b). The actin polymerization was allowed for one hour, under the same experimental conditions used in the previous assay, then compounds 2 and 6, used at the concentration of 5 μM, were added and the reactions monitored for another hour. LA (5 μM) was also used as a positive control, since it is a known actin depolymerization inductor, and CB was used as a negative control.
The results reported in Figure 2b show that the control (vehicle alone) and CB reactions, showed no relevant changes in RFU, maintaining the same initial value (about 28,000 RFU) and indicating that F‐actin did not depolymerize.
Conversely, the LA curve, from an initial value of 28,000 RFU, significantly decreased, up to a value of about 14,000 RFU in the first 15 minutes, maintaining this value until the end of the experiment, which means that actin depolymerization has occurred.
The trend of the compound 2 curve was similar to that from DMSO or CB, thus it did not favor the actin depolymerization. On the contrary, compound 6 produced a depolymerization curve superimposable to that obtained for LA, indicating that it was able to act as a depolymerization inducer.
Taken together, these data demonstrated that both the Ag complexes 2 and 6, at the concentration of 5 μM, were actin polymerization inhibitors, with the same efficacy of LA and a better activity than CB. Moreover, compound 6 was also able to induce the actin depolymerization, with the same efficacy of LA.
The ability of both Ag complexes 2 and 6 to directly interfere with actin polymerization and depolymerization processes results in a dramatic cell cytoskeleton disorganization, as evidenced by immunofluorescence studies. Indeed, in this assay we expose the MDA‐MB‐231 and MCF‐7 cells to compounds 2 and 6 respectively, used at their IC50 values.
Results for compound 2 against MDA‐MB‐231 cells are shown in Figure 3. The MDA‐MB‐231 cells treated with the vehicle alone (DMSO) exhibited a normal arrangement and organization of the actin network (Figure 3, panel B, CTRL). In contrast, breast cancer cells exposed to LA (Figure 3, panel B, LA) appear round, showing very thick and bright actin piles, if compared to the vehicle‐treated MDA‐MB‐231 cells. The treatment of MDA‐MB‐231 cells with compound 2 (Figure 3, panel B, compound 2), induce a noticeable change in cells morphology, indeed they became elongated and tapered and the actin is aggregated in distinct and thicker bundles, instead of to be evenly distributed all along cell cytoplasm, as in the control (Figure 3, panel B, CTRL). The different cell morphology visible in LA‐ and complex 2‐treated cells could depend on their different activity; indeed, LA blocks the actin polymerization and promotes the depolymerization, whereas the complex 2 is only an actin polymerization inhibitor, as observed in the previous assays.
Figure 3.

Immunofluorescence analysis. MDA‐MB‐231 cells were exposed for 24 h to DMSO (CTRL), to LA or compound 2, both used at the concentration of 5 μM. The cells were further processed and imaged under an inverted fluorescence microscope at 20× magnification (see experimental section). The treatment with compound 2 induced the formation of prominent actin cords at the level of the MDA‐MB‐231 cell periphery. Panels A: nuclear stain with DAPI (λex/λem=350/460 nm); Panels B: β‐actin (Alexa Fluor® 568; λex/λem=644/665 nm); Panels C: show the overlay channel. Representative fields of three independent experiments are shown.
Similarly to the MDA‐MB‐231 cells, the MCF‐7 cells treated with the DMSO showed a regular cytoskeleton organization (Figure 4, panel B, CTRL), whereas LA and compound 6 caused comparable disorganization of this structure. In particular, the MCF‐7 cells lost their normal morphology, assuming a round shape and a reduced cytoplasm, with very bright actin filaments (Figure 4, panel B, LA and 6). It is evident that the complex 6 produced a similar effect to LA in MCF‐7 cells because of the double activity exerted toward the actin filaments formation, previously demonstrated, being a polymerization inhibitor and a depolymerization promoter as LA.
Figure 4.

Immunofluorescence analysis. MCF‐7 cells were exposed for 24 h to DMSO (CTRL), to LA or compound 6, both used at the concentration of 5 μM. The cells were further processed (see experimental section) and imaged under an inverted fluorescence microscope at 20× magnification. The treatment with compound 6, similarly to LA, induced the formation of cytoplasm with a thread‐like structure or abnormally enlarged, with very bright actin filaments arranged in dot‐like structures. Panels A: nuclear stain with DAPI (λex/λem=350/460 nm); Panels B: β‐actin (Alexa Fluor® 568; λex/λem=644/665 nm); Panels C: show the overlay channel. Representative fields of three independent experiments are shown.
Compounds 2 and 6 inhibited the human topoisomerases I and II
Due to the complexity of this pathology, the future in anticancer drug development is represented by compounds able to act against multiple targets. Indeed, the use of multi‐target agents can enhance efficacy and lower drug resistance. [32] Bearing this in mind and considering our expertise in this research field, we studied the ability of the most active complexes 2 and 6 to interfere with two other important biological targets involved in cancer onset and progression, i. e. the human topoisomerases I and II (hTopo I and hTopoII). DNA topoisomerases are essential enzymes involved in regulating the topological state of DNA during its replication, transcription, recombination, and chromatin remodeling. However, in pathological cases such as the onset of cancer, these enzymes are overexpressed, supporting an uncontrolled proliferation. [33] For these reasons, the ability to interfere with these enzymes is an effective strategy in cancer‐fighting. [34] To evaluate the ability of compounds 2 and 6 to inhibit human topoisomerases, we performed specific enzymatic in vitro assays.
Figure 5 shows the result from hTopoI assays, where the compounds 2 and 6 induced a total inhibition of the enzyme activity, as evidenced by the presence of a single band in the lower part of the gel (see arrows), corresponding to the supercoiled pHOT1 (Figure 5, lanes 3 and 4, respectively). The exposure of the enzyme to DMSO alone demonstrated the full hTopo I activity, under the same experimental conditions. It is possible to notice the multiple bands of DNA, corresponding to the relaxed DNA (Figure 5, lane 2). The supercoiled pHOT1 and the relaxed DNA (Figure 5, lane 1 and 5, respectively) were used as markers.
Figure 5.
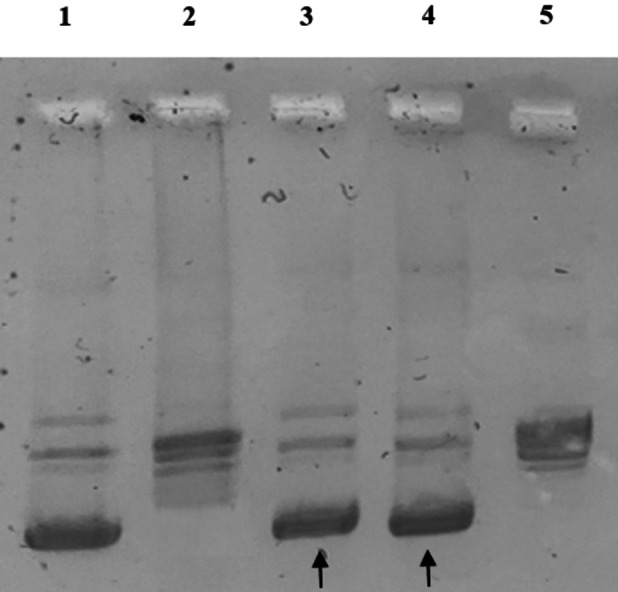
Human Topoisomerases I relaxation assays. Supercoiled DNA was used as substrate and incubated with hTopoI in the absence or presence of the tested compounds. Lane 1, pHOT1 DNA; lane 2, CTRL (DMSO); lane 3, compound 2 1 μM; lane 4, compound 6 1 μM; lane 5, a marker of relaxed DNA.
The in vitro assay for the evaluation of the hTopo II activity was carried out by exposing the enzyme to compounds 2 and 6 used at the concentrations of 1 or 10 μM and using the kDNA as substrate. As shown in Figure 6, the CTRL reaction (only vehicle) allowed the full hTopo II activity, as demonstrated by the presence of two bands related to the decatenation products of the kDNA (Figures 6a,b, lane 4). Exposure of hTopo II to the compounds 2 and 6 used at the concentration of 1 μM did not produce the enzyme inhibition, indeed, similarly to the CTRL reaction, the two bands corresponding to the decatenated products in the bottom of the gel are clearly visible (Figure 6a, lanes 5 and 6, respectively). The same complexes, used at the concentration of 10 μM were able to totally inhibit the hTopo II activity, as confirmed by the presence of the single DNA band at the top of the gel, representing the kDNA (Figure 6b, lanes 5 and 6, respectively). Linear kDNA (Figure 6a,b, lane 1), decatenated kDNA (Figures 6a,b, lane 2) and concatenated kDNA (Figures 6a,b, lane 3) were used as markers.
Figure 6.
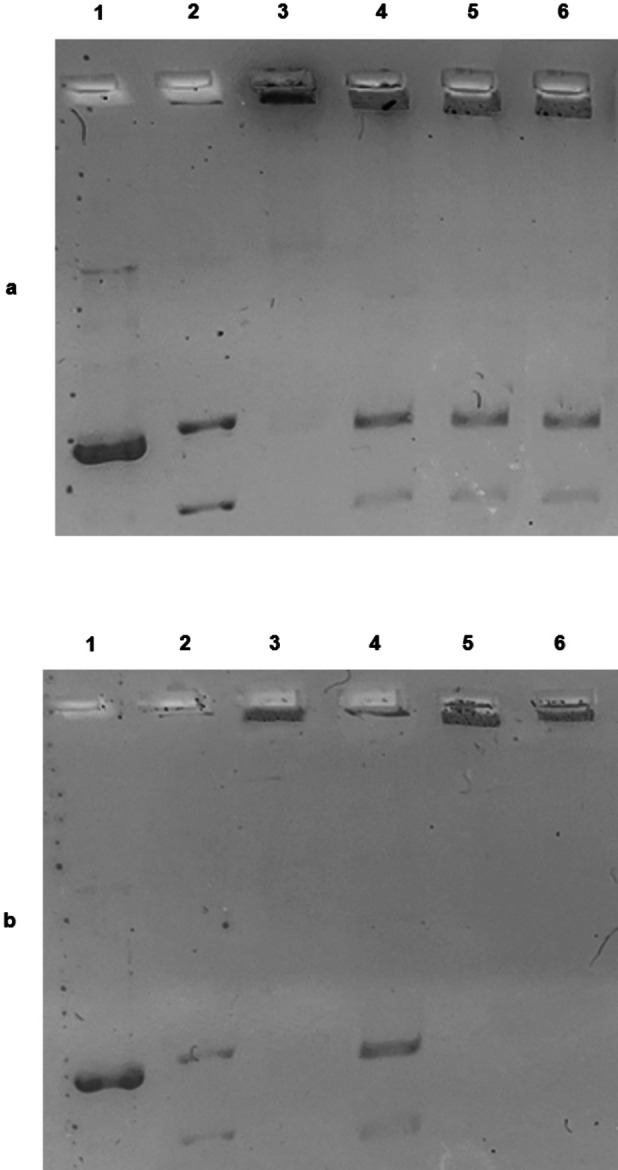
Human Topoisomerase II decatenation assay. Kinetoplast DNA (kDNA) was used as substrate and incubated with hTopoII, in the absence or presence of the tested compounds. (a) Lane 1, linear kDNA, lane 2, decatenated kDNA, lane 3, kDNA; lane 4, CTRL (DMSO); lane 5, compound 2 1 μM; lane 6, compound 6 1 μM. (b) Lane 1, linear kDNA, lane 2, decatenated kDNA, lane 3, kDNA; lane 4, CTRL (DMSO); lane 5, compound 2 10 μM; lane 6, compound 6 10 μM.
Docking studies
We initially analyzed the binding modes of compounds 2 and 6 and we calculated their binding affinities to Actin by the program AutoDock. This program calculates a binding affinity constant Ki based on the binding energy between the two entities, according to the equation K i=exp(ΔG/(R×T)). The two compounds were able to bind the target protein with a relatively good binding energy (see Table 4), forming several hydrogen and hydrophobic interactions. Particularly, both the compounds bind to the same area that is occupied by Latrunculin B as previously shown by X‐ray crystallography experiments (Figure 7). [35] In a deeper view, compound 2 forms hydrogen bonds to Lys 18, Glu 214, and Lys 336, the Ag atom bond to Lys 18, and the carboxyl moiety of Gly 302. Hydrophobic interactions with Met 16, Met 305, and Tyr 306 side chains contribute to stabilize the complex. On the other side, compound 6 is bound to Lys 18, Thr 303, Tyr 306, and Lys 336 while the Ag atom is coordinated by Glu 214. The binding pocket is further delimited by hydrophobic residues Met 16 and Met 305.
Table 4.
Binding energies for both complexes 2 and 6, as resulting from in silico simulations, towards actin.
|
Binding energies [kcal/mol] | |
|---|---|
|
Compounds |
Actin |
|
2 |
−9.07 |
|
6 |
−8.25 |
Figure 7.

Schematic representation of compound 2 (Panel A, blue sticks), 6 (Panel B, yellow sticks), and Latrunculin B (Panel C, orange sticks) binding modes to Actin (Pink ribbons).
In parallel, we also simulated the docking of compounds 2 and 6 to both Topoisomerase I and II. The two molecules were able to bind, with relatively high energy, both the hTopoI and II (see Table 5), forming different hydrogen and hydrophobic interactions. In particular, compound 2 interacts with hTopoI by forming hydrogen bonds with residues Arg 324, Lys 368, and Tyr 559. The aromatic ring of Tyr 559 is involved in a π‐π stacking with the phenyl group of compound 2 (Figure 8A). Compound 6, on the other side, is hydrogen‐bonded to Arg 324, Asn 327, Lys 329, Thr 337, and Tyr 559 (Figure 8B). The visual inspection of docking simulation results showed that hTopoII utilizes residues Asn 492, Arg 661, and Lys 665 to form hydrogen bonds to compound 2 and residues Asn 492, His 548, Arg 661, Lys 665, and Thr 858 to bind compound 6 (Figures 8C and 8D, respectively).
Table 5.
Binding energies for both complexes 2 and 6, as resulting from in silico simulations, towards hTopo I and II.
|
Binding energies [kcal/mol] | ||
|---|---|---|
|
Compounds |
h Topo I |
h Topo II |
|
2 |
−10.3 |
−8.34 |
|
6 |
−7.84 |
−7.96 |
Figure 8.

Panels A and B show the binding modes of compounds 2 (pink) and 6 (violet) to human Topoisomerase I (sandy ribbons). Panels C and D illustrate the two compounds (same colors) poses within human Topoisomerase II (green ribbons).
Compounds 2 and 6 trigger apoptosis in breast cancer cells
Cytoskeleton proteins and hTopo I and hTopo II represent good targets for clinically significant anticancer agents. The ability of different compounds to interfere with these biological targets produces permanent DNA damage, triggering cell death by apoptosis. [36] In order to assess if compounds 2 and 6 were capable of inducing apoptosis in breast cancer cells, we performed the TUNEL assay, a specific enzymatic test that allows to detect DNA fragmentation, a characteristic hallmark of apoptosis. The experiment was conducted by incubating the MDA‐MB‐231 and MCF‐7 cells for 24 h with compounds 2 and 6, respectively, used at their IC50 values. Figures 9 a, and b showed that both compounds induced apoptosis in the breast cancer cells where they resulted more active. Indeed, in the MDA‐MB‐231 cells treated with compound 2 (Figure 9a, Panel B, compounds 2) and in the MCF‐7 cells incubated with compound 6 (Figure 9b, Panel B, compounds 6) a green nuclear fluorescence is appreciable, as a result of the apoptotic mechanism. Conversely, in both breast cancer cells exposed to the vehicle (DMSO), there was no evident green fluorescence, indicating the lack of DNA damage (Figures 9 a,b, Panels B, CTRL).
Figure 9.

TUNEL assay. MDA‐MB‐231 cells treated with compound 2 (a) or MCF‐7 cells treated with compound 6 (b), both at concentrations equal to their IC50 o with vehicle (CTRL) for 24 h. The presence of the green nuclear fluorescence indicates apoptotic death. Panels A: DAPI (CTRL, compounds 2 and 6) excitation/emission wavelength 350 nm/460 nm. Panels B: CF™488 A (CTRL, compounds 2 and 6) excitation/emission wavelength 490 nm/515 nm. Panels C: a merge of panels A and B. Fields are representative of three independent experiments.
Conclusion
This report depicts a novel and successful attempt to develop new NHC silver complexes and explore their activity as anticancer agents against two breast cancer cell lines, MCF‐7, and MDA‐MB‐231 cells. Besides, the antibacterial activity against Gram‐positive and Gram‐negative bacteria has been also evaluated. Amongst the new NHC−Ag complexes, 2 and 6 showed high antibacterial and anticancer activity, without any cytotoxic effect on the normal cells.
Using in silico and in vitro assays, we demonstrated that the lead complexes inhibited the hTopoI and II, opening new perspectives for the design of complexes targeting both the hTopos. Moreover, using IF and direct assays on the purified actin, we demonstrated that both the complexes block the actin polymerization and that the complex 6 induces a clear F‐actin depolymerization. These data are important for a better understanding of targeting actin in the fight against cancer, since this field of research is still fuzzy and not well investigated. The combined and final effect of both complexes was to push breast cancer cells to die by the apoptotic pathway. Considering that the search for anticancer agents targeting multiple pathways represents a big challenge, these complexes could gain attention due to their versatility and ability to interfere with more than one protein involved in cancer onset and progression and represent a good starting point for future preclinical developments.
Experimental Section
Chemistry
Reagents and solvents. All chemicals were commercially available (TCI chemicals) and were used as received unless stated otherwise. The solvents were dried and distilled before use. NMR Analysis: the NMR spectra were recorded on Bruker Advance 300, 400, and 600 MHz spectrometers at 25 °C. The 1H and 13C NMR chemical shifts are referenced to SiMe4 (δ=0 ppm) using the residual proton impurities of the deuterated solvents as internal standards. 1H NMR spectra are referenced using the residual solvent peak δ 7.27 for CDCl3, δ 5.32 for CD2Cl2, and δ 2.50 for DMSO‐d 6. 13C NMR spectra are referenced using the residual solvent peak at δ 77.23 for CDCl3, δ 54.00 for CD2Cl2, and δ 39.51 for DMSO‐d 6. Chemical shifts (δ) are expressed as parts per million. Multiplicities are abbreviated as follows: singlet (s), doublet (d), triplet (t), quartet (q), multiplet (m), and broad (br). Elemental analysis was recorded on a with a PERKIN‐Elmer 240‐C analyzer.
The complexes [N‐methyl,N’‐[(2‐sodiumalcholate‐2‐phenyl)ethyl])‐imidazole‐2‐ylidine]silver(I)] iodide (1) and [N‐methyl,N’‐(2‐metoxy‐2‐phenyl) ethyl‐imidazole‐2‐ylidene silver(I)] iodide (3) were obtained following the procedure reported in rif.. [20]
General procedure for the synthesis of NHC‐Ag(I) acetate complexes 2, 4, 5 and 6
NHC−Ag(I) iodide complex[ 20 , 21 ] and silver acetate (1.0 equiv) were added in dichloromethane or methanol and stirred for 6 h under the exclusion of light at room temperature. The mixture was filtered through a celite pad to remove the AgI by‐product and the solvent was removed under reduced pressure. The product was washed with diethyl ether and hexane, filtered, and dried under reduced pressure.
Synthesis of [(N‐methyl, N’‐[(2‐sodium alcoholate‐2‐phenyl‐ethyl)imidazole‐2‐ylidine]silver(I)] acetate (2)
[(N‐methyl, N’‐[(2‐sodium alcoholate‐2‐phenyl‐ethyl)imidazole‐2‐ylidine]silver(I)] iodide (1) (0.150 g, 0.326 mmol), silver acetate (1.0 equiv) and 9.5 ml of dichloromethane. The complex 2 was obtained in 71 % yield.
1 H NMR (400 MHz, CDCl3): δ 7.32 (m, 5H, aromatic protons); 6.86 (d, 2H, NCHCHN); 5.19 (s, 1H, CHO−, Janti 7.24 Hz, Jgauche 5.60 Hz); 4.40 (dd, 1H, NCH 2, Jgem 14.66 Hz, Jgauche 5.60 Hz); 4.18 (dd, 1H, NCH2 , Jgem 14.66 Hz, Janti 7.24 Hz,); 3.80 (s, 3H, NCH3 ); 2.01 (s, 3H, OCOCH3 ).
13 C{1H} NMR (100 MHz, CDCl3): δ 179.5 (NCN), 179.0 (CH3 COO), 140.9 (ipso carbon aromatic ring), 128.6, 127.9, 126.1, (aromatic carbons), 123.0 (backbone carbon), 121.5 (backbone carbon), 73.4 (CHO−), 59.7 (NCH2), 38.9 (NCH3), 23.0 (COCH3).
Elemental analysis: calcd. for C14H16AgN2O3: C, 42.99; H, 4.12; N, 7.16. Found: C, 42.93; H, 4.10; N, 7.10. [ESI‐MS] m/z: 528.1 Dalton attributable to [C22H20AgN4Na2O2]+.
Synthesis of [(N‐methyl, N’‐[(2‐methoxy‐2‐phenyl‐ethyl)imidazole‐2‐ylidine]silver(I)] acetate (4)
[N‐methyl,N’‐(2‐metoxy‐2‐phenyl)ethyl‐imidazole‐2‐ylidene silver(I)] iodide (3) (0.100 g, 0.221 mmol), silver acetate (1.0 equiv) and 6.5 ml of dichloromethane. The complex 4 was obtained in 59 % yield.
1 H NMR (400 MHz, DMSO‐d6): δ 7.34‐7.26 (m, 7H, aromatic protons); 4.60 (m, 1H, OCH, Janti 7.35 Hz, Jgauche 5.71 Hz); 4.30‐4.27 (m, 2H, NCH 2, Jgem 14.49 Hz, Janti 7.35 Hz, Jgauche 5.71 Hz ); 3.74 (s, 3H, NCH3 ); 3.07 (s, 3H, OCH3 );1.98 (s, 3H, CH3 COO).
13 C{1H} NMR (100 MHz, DMSO‐d6): δ 182.7 (NCN), 173.4 (CH3 COO) 137.2 (ipso carbon of Ph ring), 128.7, 128.3, 126.6 (aromatic carbons, Ph ring), 122.6, 122.3 (backbone carbons), 83.3 (CHO), 56.7 (NCH2), 54.2 (OCH3), 38.2 (NCH3) 24.1(CH3 COO).
Elemental analysis: calcd. for C15H19AgN2O3: C, 47.02; H, 5.00; N, 7.31. Found: C, 47.00; H, 4.98; N, 7.27. [ESI‐MS] m/z: 540.4 Dalton attributable to [C26H32AgN4O2]+.
Synthesis of [N‐methyl,N’‐[(2‐hydroxy‐2‐phenyl‐ethyl)imidazole‐2‐ylidine]silver(I)] acetate (5)
[N‐methyl,N’‐[(2‐hydroxy‐2‐phenyl)ethyl])‐imidazole‐2‐ylidine]silver(I)] iodide [21a] (0.393 g, 1.00 mmol), silver acetate (1.0 equiv) and 25 ml of methanol. The complex 5 was obtained in 67 % yield.
1 H NMR (400 MHz, DMSO‐d6): δ 7.41‐7.24 (m, 7H, aromatic protons); 6.05(b, 1H, OH); 4.94 (t, 1H, OCH, Janti 8.37 Hz, Jgauche 4.80 Hz); 4.29‐4.21 (m, 2H, NCH2, Jgem 14.02 Hz, Janti 8.37 Hz, Jgauche 4.80 Hz); 3.75 (s, 3H, NCH3 ); 1.73 (s, 3H, CH3 COO).
13 C{1H} NMR (100 MHz, DMSO‐d6): δ 179.3 (NCN), 175.2 (CH3 COO), 142.4 (ipso carbon of Ph ring), 128.1, 127.3, 126.0 (aromatic carbons Ph ring), 122.9 (backbone carbon), 122.1 (backbone carbon), 72.4 (OCH), 58.2 (NCH2), 38.0 (NCH3), 24.1 (CH3COO).
Elemental analysis: calcd. for C14H17AgN2O3: C, 45.55; H, 4.64; N, 7.59. Found: C, 45.49; H, 4.61; N, 7.52. [MALDI‐ToF] m/z: 309.16101 Dalton attributable to [C12H14AgN2O]+ , 203.11873 Dalton attributable to [C12H15N2O]+.
Synthesis of [4,5‐dichloro‐[(N‐methyl‐N’(2‐hydroxy‐2‐phenyl‐ethyl)imidazole‐2‐ylidene]silver(I)] acetate (6)
[4,5‐dichloro‐(N‐methy‐N’(2‐hydroxy‐2‐phenyl)ethyl‐imidazole‐2‐ylidene]silver(I)] iodide [21b] (0.505 g, 1.00 mmol), silver acetate (1.0 equiv) and 20 ml of methanol. The complex 6 was obtained in 60 % yield.
1 H NMR (400 MHz, DMSO‐d6): δ 7.40‐7.28 (m, 5H, aromatic protons); 6.05(br, 1H, OH); 4.95 (m, 1H, OCH, Janti 7.99 Hz, Jgauche 5.99 Hz); 4.32‐4.23 (m, 2H, NCH 2, Jgem 14.48 Hz, Janti 7.99 Hz, Jgauche 5.99 Hz); 3.81 (s, 3H, NCH3 ); 1.73 (s, 3H, CH3 COO−)
13 C{1H} NMR (100 MHz, DMSO‐d6): δ 182.2 (NCN), 174.5 (CH3 COO), 141.7 (ipso carbon of Ph ring), 128.2, 127.5, 126.0, (aromatic carbons Ph ring), 117.1 (backbone carbon), 116.6 (backbone carbon), 71.4 (OCH), 57.1 (NCH2), 37.5 (NCH3), 24.7 (CH3 COO).
Elemental analysis: calcd. for C14H15AgCl2N2O3: C, 38.39; H, 3.45; N, 6.40. Found: C, 38.36; H, 3.41; N, 6.37. [MALDI‐ToF] m/z: 389.09143 Dalton attributable to [C12H12AgCl2N2O]+, 271.04105 Dalton attributable to [C12H13Cl2N2O]+.
Determination of the minimum inhibitory concentration (MIC) and minimum bactericidal concentration (MBC)
One Gram‐negative bacterial strain [Escherichia coli (ATCC® 25922TM)] and two Gram‐positive bacterial strains [Enterococcus faecalis (ATCC® 19433TM) and Staphylococcus aureus (ATCC® 23235TM)] were used in the antibacterial tests to measure the MIC and MBC values. The MIC and MBC of the tested compounds were determined according to CLSI guidelines. [26] The MIC represents the lowest concentration of compound able to inhibit the visible microbial growth expressed in μg/mL, whereas the MBC is the lowest concentration of a given compound that can completely kill the bacteria; both determinations were carried out using the broth dilution method. Bacteria were grown overnight in LB medium (2 %), diluted at a density of 4000 colony forming units (CFUs) per mL, plated in sterile 96‐well microplates to obtain a total inoculum load of ca. 105 cells/ well, and then treated with increasing concentrations of the tested complexes (1, 5, 10, 20, 50, 100 μg/mL). After microplates incubation at 37 °C for 18 h (overnight), bacterial growth was checked at a wavelength of 600 nm using a Multiskan spectrophotometer (model Multiskan Ex Microplate; Thermo Scientific, Nyon, Switzerland), and the MIC or MBC values of each compound was determined by comparing the cell densities with a positive control in which bacterial cells are grown in LB medium without the addition of any compound (only vehicle, DMSO). No bacterium with only compound was used as negative control to maintain the sterility. For each experiment, carried out five times, triplicate assays were performed. Finally, to verify the strain's sensibility, Ampicillin (Sigma Aldrich A9393) standard antibiotic was used as control.
Cell culture
The three cell lines employed in this work (MCF‐7, MDA‐MB‐231, MCF‐10 A) were purchased from American Type Culture Collection (ATCC, Manassas, VA, USA) and cultured as already described. [17b]
MTT assay
The in vitro anticancer activity of all the studied compounds was detected by using the MTT (Sigma) assay. [37] Briefly, cells were seeded in a 48‐well plate, then starved in serum‐free medium and incubated with the target compounds dissolved in DMSO (0.1‐200 μM) for 72 h, as already described. [38] GraphPad Prism 9 (GraphPad Software, La Jolla, CA, USA) was used for the calculation of the IC50 value. All the experiments are performed in triplicate.
Actin polymerization/depolymerization assay
Polymerization/Depolymerization Assay Kit (Abcam, Cambridge, UK) was employed to test the ability of the compounds to interfere with the actin polymerization and depolymerization reaction. Both polymerization and depolymerization reactions occur in a 96‐well plate using Labeled Rabbit Muscle actin, as already described by Iacopetta et al.. [39] Latrunculin A and Cytochalasin B were used as control molecules at a concentration of 5 μM. The assembly of actin filaments was determined by measuring the fluorescence (Ex/Em: 365/410 nm) in kinetic mode for 1 hour at room temperature using a microplate reader.
Immunofluorescence analysis
Cells were seeded in 48‐well culture plates containing glass slides and then serum‐deprived for 24 h and incubated with the most active compound for 24 h (concentration equal to its IC50 value), as previously described. [40] The primary antibody used was mouse anti‐β‐actin (Santa Cruz Biotechnology, Dallas, USA) and the secondary antibody was Alexa Fluor® 568 conjugate goat‐anti‐mouse (Thermo Fisher Scientific, MA, USA). Fluorescence was detected using a fluorescence microscope (Leica DM 6000, 20x magnification). LAS−X software was used to acquire and process all images. Images are representative of three independent experiments.
Human topoisomerase I relaxation assay
DNA relaxation assays were performed using 0.25 μg of supercoiled pHOT1 and 2 U of recombinant human topo I (TopoGEN, Port Orange, FL), as already described by Iacopetta et al.. [38] The final solution was loaded onto a 1 % agarose gel containing 1X TAE buffer without ethidium bromide (EB). After the run, agarose gel was visualized using a UV transilluminator.
Human topoisomerase II decatenation assay
DNA decatenation assays were performed using 0.3 μg of kinetoplast DNA (kDNA) and 3 U of human topoisomerase II (TopoGEN, Port Orange, FL), as already described by Iacopetta et al.. [38] In the end, the solution was loaded on a 1 % agarose gel containing 1X TAE buffer with EB (0.5 μg/ml) and visualized using an UV transilluminator.
Docking studies
As previously described in several publications by our group,[ 15 , 41 ] we performed our docking simulations using the program AutoDock 4.2.2 [42] and its graphic interface ADT. [43] In each case, we used a blind‐docking approach in which we did not show the program for any information concerning the protein binding site. We used the atomic coordinates of the human Topoisomerase I in complex with DNA (PDB code 1A35) [44] and of Topoisomerase IIα in complex with a DNA fragment and etoposide (PDB Code 5gwk) [45] as targets for the human Topoisomerases (hTopoI and hTopoII). The crystal structure of the complex formed between the Beta/Gamma‐Actin with Profilin and the acetyltransferase AnCoA‐NAA80 [35] (PDB code 6nbw) was used as a model target for Actin. The 3D coordinates of the compounds 2 and 6 have been retrieved using the program MarvinSketch [ChemAxon Ltd, Budapest, Hu]. We used the program default values for all the simulations, considering the protein targets as rigid objects and the compounds 2 and 6 as fully flexible. We carried over the simulations with a Lamarckian Genetic Algorithm (LGA) where 100 individuals evolved for 100 generations with a genetic mutation rate of 0.02 and we analyzed the results by clustering the different ligand poses on the base of their binding energies to the respective targets. All the figures were drawn using the program Chimera. [46]
TUNEL assay
The ability of the most active compounds to induce cell death by apoptosis was detected using the TUNEL assay using the CFTM488A TUNEL Assay Apoptosis Detection Kit (Biotium, Hayward, CA, USA). The cells were grown on glass coverslips, treated with the tested compounds, and then further processed as previously described [17a] . The cells were observed under a fluorescence microscope (Leica DM6000; 20x magnification). The images are demonstrative of three separate experiments.
Conflict of interest
The authors declare no conflict of interest.
1.
Supporting information
As a service to our authors and readers, this journal provides supporting information supplied by the authors. Such materials are peer reviewed and may be re‐organized for online delivery, but are not copy‐edited or typeset. Technical support issues arising from supporting information (other than missing files) should be addressed to the authors.
Supporting Information
Acknowledgements
C.R. work was supported by the Italian Ministry of Health (Ricerca Corrente 2021). S.A. was supported by PRIN (Progetti di Rilevante Interesse Nazionale) Grant 2017M8R7N9_004 and 2020KSY3KL_005 from MUR, Italy. M.S.S. was supported by PON “R&I” 2014–2020 – project from Area di Specializzazione “Salute”, ARS01_00568 titled “SI.F.I.PA.CRO.DE. – Sviluppo e industrializzazione farmaci innovativi per terapia molecolare personalizzata PA. CRO. DE.” for providing lab tools. Open Access funding provided by Universita della Calabria within the CRUI‐CARE Agreement.
A. Mariconda, D. Iacopetta, M. Sirignano, J. Ceramella, C. Costabile, M. Pellegrino, C. Rosano, A. Catalano, C. Saturnino, H. El-Kashef, S. Aquaro, M. S. Sinicropi, P. Longo, ChemMedChem 2022, 17, e202200345.
Data Availability Statement
The data that support the findings of this study are available from the corresponding author upon reasonable request.
References
- 1. Siegel R. L., Miller K. D., Fuchs H. E., Jemal A., Ca-Cancer J. Clin. 2021, 71, 7–33. [DOI] [PubMed] [Google Scholar]
- 2.
- 2a. Bray F., Ferlay J., Soerjomataram I., Siegel R. L., Torre L. A., Jemal A., Ca-Cancer J. Clin. 2018, 68, 394–424; [DOI] [PubMed] [Google Scholar]
- 2b. Scrivano L., Parisi O. I., Iacopetta D., Ruffo M., Ceramella J., Sinicropi M. S., Puoci F., Polym. Adv. Technol. 2019, 30, 743–748. [Google Scholar]
- 3. Hossain F., Majumder S., David J., Miele L., Cancers 2021, 13, 3739. [DOI] [PMC free article] [PubMed] [Google Scholar]
- 4. Shuai W., Wang G., Zhang Y., Bu F., Zhang S., Miller D. D., Li W., Ouyang L., Wang Y., J. Med. Chem. 2021, 64, 7963–7990. [DOI] [PubMed] [Google Scholar]
- 5.
- 5a. Bruno G., Nicolò F., Lo Schiavo S., Sinicropi M. S., Tresoldi G., J. Chem. Soc. Dalton Trans. 1995, 17–24; [Google Scholar]
- 5b. Li Y., Liu B., Shi H., Wang Y., Sun Q., Zhang Q., Dalton Trans. 2021, 50, 14498–14512; [DOI] [PubMed] [Google Scholar]
- 5c. Ndagi U., Mhlongo N., Soliman M. E., Drug Des. Dev. Ther. 2017, 11, 599–616. [DOI] [PMC free article] [PubMed] [Google Scholar]
- 6.
- 6a. Hussaini S. Y., Haque R. A., Razali M. R., J. Organomet. Chem. 2019, 882, 96–111; [Google Scholar]
- 6b. Marichev K. O., Patil S. A., Patil S. A., Heras Martinez H. M., Bugarin A., Expert Opin. Ther. Pat. 2022, 32, 47–61. [DOI] [PubMed] [Google Scholar]
- 7. Guarra F., Busto N., Guerri A., Marchetti L., Marzo T., Garcia B., Biver T., Gabbiani C., J. Inorg. Biochem. 2020, 205, 110998. [DOI] [PubMed] [Google Scholar]
- 8.
- 8a. Medici S., Peana M., Crisponi G., Nurchi V. M., Lachowicz J. I., Remelli M., Zoroddu M. A., Coord. Chem. Rev. 2016, 327–328, 349–359; [Google Scholar]
- 8b. Sierra M. A., Casarrubios L., de la Torre M. C., Chem. Eur. J. 2019, 25, 7232–7242. [DOI] [PubMed] [Google Scholar]
- 9.
- 9a. Johnson N. A., Southerland M. R., Youngs W. J., Molecules 2017, 22; [DOI] [PMC free article] [PubMed] [Google Scholar]
- 9b. Roymahapatra G., Mandal S. M., Porto W. F., Samanta T., Giri S., Dinda J., Franco O. L., Chattaraj P. K., Curr. Med. Chem. 2012, 19, 4184–4193. [DOI] [PubMed] [Google Scholar]
- 10. Hadrup N., Lam H. R., Regul. Toxicol. Pharmacol. 2014, 68, 1–7. [DOI] [PubMed] [Google Scholar]
- 11. Ali K. A., Abd-Elzaher M. M., Mahmoud K., Int. J. Med. Chem. 2013, 2013. [DOI] [PMC free article] [PubMed] [Google Scholar]
- 12. Mohd Sofyan N. R. F., Nordin F. J., Mohd Abd Razak M. R., Abdul Halim S. N. A., Mohd Khir N. A. F., Muhammad A., Rajab N. F., Sarip R., J. Chem. 2018, 2018, 8395374, 10.1155/2018/8395374.. [DOI] [Google Scholar]
- 13. Varna D., Geromichalou E., Papachristou E., Papi R., Hatzidimitriou A. G., Panteris E., Psomas G., Geromichalos G. D., Aslanidis P., Choli-Papadopoulou T., Angaridis P. A., J. Inorg. Biochem. 2022, 228, 111695. [DOI] [PubMed] [Google Scholar]
- 14.
- 14a. Aktaş A., Keleştemur Ü., Gök Y., Balcıoğlu S., Ateş B., Aygün M., J. Iran. Chem. Soc. 2018, 15, 131–139; [Google Scholar]
- 14b. Ashraf R., Bhatti H. N., Iqbal M. A., Jamil Y., Inorg. Chem. Commun. 2020, 119, 108077; [Google Scholar]
- 14c. Çevik-Yıldız E., Şahin N., Şahin-Bölükbaşı S., J. Mol. Struct. 2020, 1199, 126987; [Google Scholar]
- 14d. Şahin-Bölükbaşı S., Şahin N., J. Organomet. Chem. 2019, 891, 78–84. [Google Scholar]
- 15. Ceramella J., Mariconda A., Iacopetta D., Saturnino C., Barbarossa A., Caruso A., Rosano C., Sinicropi M. S., Longo P., Bioorg. Med. Chem. Lett. 2020, 30, 126905. [DOI] [PubMed] [Google Scholar]
- 16.
- 16a. Haque R. A., Choo S. Y., Budagumpi S., Iqbal M. A., Al-Ashraf Abdullah A., Eur. J. Med. Chem. 2015, 90, 82–92; [DOI] [PubMed] [Google Scholar]
- 16b. Jakob C. H. G., Muñoz A. W., Schlagintweit J. F., Weiß V., Reich R. M., Sieber S. A., Correia J. D. G., Kühn F. E., J. Organomet. Chem. 2021, 932, 121643; [Google Scholar]
- 16c. Slimani I., Chakchouk-Mtibaa A., Mellouli L., Mansour L., Ozdemir I., Gurbuz N., Hamdi N., J. Braz. Chem. Soc. 2020, 31. [Google Scholar]
- 17.
- 17a. Iacopetta D., Mariconda A., Saturnino C., Caruso A., Palma G., Ceramella J., Muia N., Perri M., Sinicropi M. S., Caroleo M. C., Longo P., ChemMedChem 2017, 12, 2054–2065; [DOI] [PubMed] [Google Scholar]
- 17b. Iacopetta D., Rosano C., Sirignano M., Mariconda A., Ceramella J., Ponassi M., Saturnino C., Sinicropi M. S., Longo P., Pharmaceuticals (Basel) 2020, 13; [DOI] [PMC free article] [PubMed] [Google Scholar]
- 17c. Ceramella J., Mariconda A., Sirignano M., Iacopetta D., Rosano C., Catalano A., Saturnino C., Sinicropi M. S., Longo P., Pharmaceuticals 2022, 15, 507. [DOI] [PMC free article] [PubMed] [Google Scholar]
- 18.
- 18a. Asekunowo P. O., Haque R. A., Razali M. R., Avicor S. W., Wajidi M. F. F., Appl. Organomet. Chem. 2017, 31, e3655; [Google Scholar]
- 18b. Binacchi F., Guarra F., Cirri D., Marzo T., Pratesi A., Messori L., Gabbiani C., Biver T., Molecules 2020, 25. [DOI] [PMC free article] [PubMed] [Google Scholar]
- 19.
- 19a. Wang H. M., Lin I. J., Organometallics 1998, 17, 972–975; [Google Scholar]
- 19b. Caytan E., Roland S., Organometallics 2014, 33, 2115—2118; [Google Scholar]
- 19c. Mariconda A., Grisi F., Costabile C., Falcone S., Bertolasi V., Longo P., New J. Chem. 2014, 38, 762–769. [Google Scholar]
- 20. Costabile C., Mariconda A., Sirignano M., Crispini A., Scarpelli F., Longo P., New J. Chem. 2021, 45, 18509–18517. [DOI] [PMC free article] [PubMed] [Google Scholar]
- 21.
- 21a. Napoli M., Saturnino C., Cianciulli E. I., Varcamonti M., Zanfardino A., Tommonaro G., Longo P., J. Organomet. Chem. 2013, 725, 46–53; [Google Scholar]
- 21b. Mariconda A., Sirignano M., Costabile C., Longo P., J. Mol. Catal. 2020, 480, 110570. [Google Scholar]
- 22. Atif M., Bhatti H. N., Haque R. A., Iqbal M. A., Ahamed Khadeer M. B., Majid A., Appl. Biochem. Biotechnol. 2020, 191, 1171–1189. [DOI] [PubMed] [Google Scholar]
- 23. Lobana T. S., Coord. Chem. Rev. 2021, 441, 213884. [Google Scholar]
- 24. Slimani I., Mansour L., Abutaha N., Harrath A. H., Al-Tamimi J., Gürbüz N., Özdemir I., Hamdi N., J. King Saud University - Science 2020, 32, 1544–1554. [Google Scholar]
- 25.
- 25a. Üstün E., Şahin N., Çelik C., Tutar U., Özdemir N., Gürbüz N., Özdemir İ., Dalton Trans. 2021, 50, 15400–15412; [DOI] [PubMed] [Google Scholar]
- 25b. Şahin N., Üstün E., Tutar U., Çelik C., Gürbüz N., Özdemir İ., J. Organomet. Chem. 2021, 954–955, 122082. [Google Scholar]
- 26.C. a. L. S. I. (CLSI), Performance Standards for Antimicrobial Susceptibility Testing, 32nd ed. ed., Clinical and Laboratory Standards Institute, USA, 2022.
- 27. Eloy L., Jarrousse A.-S., Teyssot M.-L., Gautier A., Morel L., Jolivalt C., Cresteil T., Roland S., ChemMedChem 2012, 7, 805–814. [DOI] [PubMed] [Google Scholar]
- 28. Pasquier E., Kavallaris M., IUBMB Life 2008, 60, 165–170. [DOI] [PubMed] [Google Scholar]
- 29.
- 29a. Aseervatham J., Biology (Basel) 2020, 9; [DOI] [PMC free article] [PubMed] [Google Scholar]
- 29b. Yamaguchi H., Condeelis J., Biochim. Biophys. Acta 2007, 1773, 642–652. [DOI] [PMC free article] [PubMed] [Google Scholar]
- 30. Fujiwara I., Zweifel M. E., Courtemanche N., Pollard T. D., Curr. Biol. 2018, 28, 3183–3192.e3182. [DOI] [PMC free article] [PubMed] [Google Scholar]
- 31. Foissner I., Wasteneys G. O., Plant Cell Physiol. 2007, 48, 585–597. [DOI] [PubMed] [Google Scholar]
- 32. Zheng W., Zhao Y., Luo Q., Zhang Y., Wu K., Wang F., Curr. Top. Med. Chem. 2017, 17, 3084–3098. [DOI] [PubMed] [Google Scholar]
- 33. You F., Gao C., Curr. Top. Med. Chem. 2019, 19, 713–729. [DOI] [PubMed] [Google Scholar]
- 34. Delgado J. L., Hsieh C. M., Chan N. L., Hiasa H., Biochem. J. 2018, 475, 373–398. [DOI] [PMC free article] [PubMed] [Google Scholar]
- 35. Rebowski G., Boczkowska M., Drazic A., Ree R., Goris M., Arnesen T., Dominguez R., Sci. Adv. 2020, 6, eaay8793. [DOI] [PMC free article] [PubMed] [Google Scholar]
- 36.
- 36a. Desouza M., Gunning P. W., Stehn J. R., Bioarchitecture 2012, 2, 75–87; [DOI] [PMC free article] [PubMed] [Google Scholar]
- 36b. Rudolf K., Cervinka M., Rudolf E., Neoplasma 2010, 57, 316–324. [DOI] [PubMed] [Google Scholar]
- 37. Fazio A., Iacopetta D., La Torre C., Ceramella J., Muià N., Catalano A., Carocci A., Sinicropi M. S., Food Funct. 2018, 9, 6618–6631. [DOI] [PubMed] [Google Scholar]
- 38. Iacopetta D., Rosano C., Puoci F., Parisi O. I., Saturnino C., Caruso A., Longo P., Ceramella J., Malzert-Freon A., Dallemagne P., Rault S., Sinicropi M. S., Eur. J. Pharm. Sci. 2017, 96, 263–272. [DOI] [PubMed] [Google Scholar]
- 39. Iacopetta D., Ceramella J., Rosano C., Mariconda A., Pellegrino M., Sirignano M., Saturnino C., Catalano A., Aquaro S., Longo P., Sinicropi M. S., Appl. Sci. 2021, 11, 5626. [Google Scholar]
- 40. Ceramella J., Loizzo M. R., Iacopetta D., Bonesi M., Sicari V., Pellicanò T. M., Saturnino C., Malzert-Fréon A., Tundis R., Sinicropi M. S., Food Funct. 2019, 10, 4280–4290. [DOI] [PubMed] [Google Scholar]
- 41.
- 41a. Rosano C., Lappano R., Santolla M. F., Ponassi M., Donadini A., Maggiolini M., Curr. Med. Chem. 2012, 19, 6199–6206; [PubMed] [Google Scholar]
- 41b. Rosano C., Ponassi M., Santolla M. F., Pisano A., Felli L., Vivacqua A., Maggiolini M., Lappano R., AAPS J. 2016, 18, 41–46. [DOI] [PMC free article] [PubMed] [Google Scholar]
- 42. Morris G. M., Huey R., Lindstrom W., Sanner M. F., Belew R. K., Goodsell D. S., Olson A. J., J. Comput. Chem. 2009, 30, 2785–2791. [DOI] [PMC free article] [PubMed] [Google Scholar]
- 43. Sanner M. F., Duncan B. S., Carrillo C. J., Olson A. J., Pac. Symp. Biocomput. 1999, 401–412. [DOI] [PubMed] [Google Scholar]
- 44. Redinbo M. R., Stewart L., Kuhn P., Champoux J. J., Hol W. G., Science 1998, 279, 1504–1513. [DOI] [PubMed] [Google Scholar]
- 45. Wang Y. R., Chen S. F., Wu C. C., Liao Y. W., Lin T. S., Liu K. T., Chen Y. S., Li T. K., Chien T. C., Chan N. L., Nucleic Acids Res. 2017, 45, 10861–10871. [DOI] [PMC free article] [PubMed] [Google Scholar]
- 46. Pettersen E. F., Goddard T. D., Huang C. C., Couch G. S., Greenblatt D. M., Meng E. C., Ferrin T. E., J. Comput. Chem. 2004, 25, 1605–1612. [DOI] [PubMed] [Google Scholar]
Associated Data
This section collects any data citations, data availability statements, or supplementary materials included in this article.
Supplementary Materials
As a service to our authors and readers, this journal provides supporting information supplied by the authors. Such materials are peer reviewed and may be re‐organized for online delivery, but are not copy‐edited or typeset. Technical support issues arising from supporting information (other than missing files) should be addressed to the authors.
Supporting Information
Data Availability Statement
The data that support the findings of this study are available from the corresponding author upon reasonable request.