

Abstract
Purpose
To determine factors associated with improvement in urinary incontinence (UI) for long‐stay postacute, complex continuing care (CCC) patients.
Design
A retrospective cohort investigation of patients in a CCC setting using data obtained from the Canadian Institute for Health Information's Continuing Care Reporting System collected with interRAI Minimum Data Set 2.0.
Setting and participants
Individuals aged 18 years and older, were admitted to CCC hospitals in Ontario, Canada, between 2010 and 2018.
Methods
Multivariable logistic regression was used to determine the independent effects of predictors on UI improvement, for patients who were somewhat or completely incontinent on admission and therefore had the potential for improvement.
Results
The study cohort consisted of 18 584 patients, 74% (13 779) of which were somewhat or completely incontinent upon admission. Among those patients with potential for improvement, receiving bladder training, starting a new medication 90 days prior (odds ratio, OR: 1.54 [95% confidence interval, CI: 1.36–1.75]), and triggering the interRAI Urinary Incontinence Clinical Assessment Protocol to facilitate improvement (OR: 1.36 [95% CI: 1.08–1.71]) or to prevent decline (OR: 1.32 [95% CI: 1.13–1.53]) were the strongest predictors of improvement. Conversely, being totally dependent on others for transfer (OR: 0.62 [95% CI: 0.42–0.92]), is rarely or never understood (OR: 0.65 [95% CI: 0.50–0.85]), having a major comorbidity count of ≥3 (OR: 0.72 [95% CI: 0.59–0.88]), Parkinson's disease, OR: 0.77 (95% CI: 0.62–0.95), Alzheimer/other dementia, OR: 0.83 (95% CI: 0.74–0.93), and respiratory infections, OR: 0.57 (95% CI: 0.39–0.85) independently predicted less likelihood of improvement in UI.
Conclusions and Implications
Findings of this study suggest that improving physical function, including bed mobility, and providing bladder retraining have strong positive impacts on improvement in UI for postacute care patients. Evidence generated from this study provides useful care planning information for care providers in identifying patients and targeting the care that may lead to better success with the management of UI.
Keywords: aging, cohort study, interRAI, postacute care, predictors, urinary incontinence
1. INTRODUCTION
Urinary incontinence (UI), any involuntary loss of urine, is a common problem for patients in postacute settings, with reported prevalence rates from 36.2% to 40%. 1 , 2 UI has a detrimental effect on hospitalized patients as it is associated with poor quality of life and self‐image, falls and fractures, and dermatitis and skin breakdown. 3 , 4 , 5 Development and persistence of UI during hospitalization can also influence discharge location or the need for additional care if a person cannot independently manage their incontinence. 6
In Ontario, some postacute care is provided in complex continuing care (CCC) hospitals by a team of interprofessional providers including physicians, nurses, and physical and occupational therapists. These settings are mandated to use the interRAI Minimum Data Set 2.0 (MDS) instrument as the standardized, comprehensive assessment to inform patient‐centered care planning. 7 A feature of the MDS is that when deployed on a software platform, subsets of items identify patients who would benefit from care planning in certain domains, and clinical assessment protocols (CAPs) are triggered, providing evidence‐based recommendations for care planning.
The correlates of UI for patients in this setting are not well understood. A cross‐sectional study of older inpatients transitioning to postacute care found that UI was associated with lower health literacy, poorer cognition, and need for assistance with toileting 8 but it is unclear what factors contribute to worsening or improving UI. A retrospective cohort study of inpatient rehabilitation patients in the US, found patients who were older, had cognitive impairment, had made less functional gains, and had a longer length of stay were more likely to remain incontinent at discharge. 6 Furthermore, institutional practices around continence assessment and care planning in postacute care have not been comprehensively explored. Knowledge of the prevalence and correlates of UI in the postacute setting will inform person‐centered care planning, targeting evidence‐based factors associated with UI to improve patient experience and quality of care in this setting. Thus, the purpose of this retrospective cohort study was to determine the factors associated with improvement in UI in long‐stay adult patients of postacute care facilities in Ontario, Canada.
2. MATERIALS and METHODS
2.1. Study design
This was a retrospective cohort study of patients admitted to the CCC facilities in Ontario, between January 1st, 2010 and December 31st, 2018.
2.2. Data sources
We analyzed data obtained from the Canadian Institute for Health Information's Continuing Care Reporting System (CCRS). The CCRS contains patient‐level data that are collected through multidimensional health assessments using the interRAI MDS 2.0.
All MDS assessments are completed by trained assessors within 14 days of patients' admission to CCC settings and repeated every 90 days thereafter, or sooner in the case of a significant change in health status. The reliability and the validity of the assessment items, outcome measures, and summary scales are well established. 9 The MDS is deployed within a software application allowing for the generation of scales and CAP, which facilitates care planning at the patient level as well as program and system‐level quality performance assessment.
2.3. Study setting and cohort
The study cohort included patients admitted to CCC facilities who had at least two (2) assessments: an initial admission and a follow‐up 90‐day reassessment. A comparison of residents discharged before the 90‐day assessment and those who stayed 90 days and beyond are presented in Supporting Information: File 1.
For all regression analyses, we excluded all residents who were fully continent on admission. We also excluded patients who were quadriplegic, paraplegic, or comatose from the analysis because it was not possible to identify patients with a complete spinal cord injury, who are unlikely to improve, from patients with partial injury. All analysis was restricted to patients 18 years and older.
2.4. Outcome of interest
The study's primary outcome of interest was an improvement in UI between admission and 90‐day reassessment. For this, we created a binary outcome variable that defined UI improvement as any category change where the 90‐day bladder continence status was better than the admission bladder continence status. In MDS 2.0, bladder continence over the last 14 days is assessed as a continent (complete control), usually continent (incontinent episodes once a week or less), occasionally incontinent (incontinence episodes two or more times per week but not daily), frequently incontinent (incontinent daily but some control present), and incontinent (inadequate control). 7 For the study analysis, usually, occasionally, and frequently incontinent were grouped together as “somewhat incontinent.”
2.5. Independent variables selection
Through an iterative deliberative process, informed by a literature search (UI best practice guidelines and literature related to postacute setting), and consultation with field experts (geriatricians, physiotherapists, and registered nurses), the research team selected variables that were known to affect UI. 10 , 11 This process led to a list of variables (Table 1, refer to Supporting Information: File 2 for the full list of variables) selected a priori for inclusion in the modeling. Included variables were a range of sociodemographic (e.g., age, sex), clinical (e.g., major comorbidity count, frailty index, chronic conditions), and functional (e.g., bed mobility, transfer) characteristics. The UI CAP one of the care planning protocols developed using the interRAI data 7 , 22 was included in the analysis. The UI CAP is a composite categorical variable consisting of four levels: 0—not triggered (continent at baseline); 1—not triggered (poor decision making at baseline); 2—triggered to prevent decline; and 3—triggered to facilitate improvement. 22 The level of the UI CAP is automatically calculated based on an algorithm derived from a set of variables including the level of continence, cognitive abilities, dependence for mobility, and indicators that suggest a patient may fluctuating statuses, such as a recent infection or hip fracture. We also included bladder retraining, defined in MDS 2.0 as a retraining program for the management of urgency incontinence where the patient is taught to consciously delay voiding or resist the urge to void and instead void on a schedule. 16 As well, we included the perceived rehabilitation potential variable that captures if the patient, their direct care staff, or both believe the patient is capable of increased independence in at least some activities of daily living (ADL). We also included the interRAI ADL hierarchy scale, which is a six‐category composite variable obtained by scoring four ADL items (locomotion, eating, toilet, and personal hygiene). 12
Table 1.
Select independent predictors – interRAI Scales, risk stratification tools, and clinical assessment protocols
| Variable | Description | Range and Levels | Included in the final model | Reference | |
|---|---|---|---|---|---|
| 1 | ADL hierarchy scale | A measure of functional performance in four activities of daily living from early to late loss (hygiene, moving around in the home, toilet use, and eating) |
0–6 independent to dependent |
No | Morris et al., 12 , 13 |
| 2 | Acute frailty Index | Measures the proportion of assessed deficit present |
0.0–1.0 robust to frail |
Yes | Hubbard et al., 14 |
| 3 | Major morbidity count | Identifies individuals with six major morbidities: Heart, lung, liver, kidney, neurological conditions, and cancer. Measures risk of mortality if infected with COVID‐19 |
Scale 0–6 none to six major comorbidities present Ordinal 0–2 low to high risk of mortality |
Yes | Canadian Institute for Health Information, 15 |
| 4 | Urinary incontinence clinical assessment protocol (CAP) | Measures the risk of urinary incontinence and suggests the appropriate type of intervention |
0–3 none to risk present with a suggestion to facilitate improvement |
Yes | Morris et al., 16 |
| 5 | Bowel incontinence CAP | Measures the risk of bowel incontinence and suggests the appropriate type of intervention |
0–2 no risk to risk present with the suggestion to prevent avoidable bowel decline |
No | |
| 6 | Cognitive performance scale | Measures cognition |
0–6 intact to severe impairment |
No | Morris et al., 17 |
| 7 | Depression rating scale | Measures depression |
0–6 no symptoms to severe symptoms |
No | Burrows et al., 18 |
| 8 | Pain scale | Measures frequency and intensity of pain | 0–5 | Yes | Fries et al., 19 |
| 9 | CHESS scale | Measures medical complexity and instability |
0–5 most stable to most unstable |
No | Hirdes et al., 20 , 21 |
| 10 | Restraint CAP | Identifies people who are restrained and are at risk of decline in physical function |
0–2 no problem to ADL disability present |
No |
Abbreviations: ADL, activities of daily living; CHESS,changes in health, end‐stage disease, and signs and symptoms.
2.6. Statistical analysis
We used descriptive analysis of frequency and percentages using the Cochran–Armitage χ 2 trend test to describe the distribution of independent categorical variables between incontinent categories in our study cohort. Bivariate logistic regression was performed to test the null hypothesis of no statistically significant predictive relationship between independent variables and improvement in UI.
Multivariable logistic regression analysis was performed to investigate the independent effect of predictors on UI improvement. This generated an adjusted odds ratio (OR) and 95% confidence interval (CI) for the effect of predictors included in the final model on UI improvement. All the independent variables were included in the initial model. Modeled independent variables were then selected using the backward selection process, with a significance level of entry and stay set at 20% and 5%, respectively. In the final step, independent variables that had no significant independent effect in the initial model (p > 0.05) but are known in the literature or suggested by experts to be significantly associated with UI, were then included in the final model (e.g., body mass index, number of medications, sex, and ability to understand others).
We included interaction terms in the initial model based on possible interactions suggested by experts and literature evidence. Interaction terms that were not highly significant (>0.001) were excluded from the final model. We also performed a check for multicollinearity between the independent variables using variance inflation factor (VIF) and tolerance as well as expert knowledge.
We checked the final model's goodness of fit using the Hosmer–Lemeshow test. The model's predictive power was then determined by plotting the receiver operating characteristics and obtaining the area under the curve as well as the c‐statistics.
The RECORD 23 guidelines for reporting observational studies and routinely collected data were adhered to in preparing this manuscript (refer to Supporting Information: File 3).
All statistical analysis was performed using SAS v9.4 (SAS Institute Inc.).
3. RESULTS
3.1. Patient characteristics
A total of 18 584 patients met the initial inclusion criteria, that is, they stayed 90 days or more from the time of admission. A comparison between residents discharged before the 90‐day assessment who were excluded from this study, and those who stayed till 90 days and beyond (included in this study), is presented in Supporting Information: File 1.
Among those patients who met our initial eligibility, on admission, 74% (n = 13 779) did not have complete bladder control (37.3% [n = 6923] were somewhat incontinent, while 36.9% [n = 6856] were incontinent), 25.9% (n = 4805) were continent with complete bladder control. For the patients who were continent on admission, 81.0% remained continent by the 90‐day reassessment, while the remaining 19.0% became somewhat incontinent (15.0%) or incontinent (4.0%). Of the patients who were incontinent on admission, 82.3% remained incontinent after 90 days on admission, 11.4% became somewhat incontinent while 6.3% regained complete bladder control. Our study cohort consisted of 13 779 patients who did not have complete bladder control on admission and therefore had room to improve in UI. The baseline characteristics of patients with some level of UI (n = 13 779) selected for subsequent analysis in this study are presented in Table 2.
Table 2.
Characteristics of the baseline study cohort (patients with room to improve in UI)
| Column 1 | Column 2 | Total n = 13 779 | Somewhat incontinent | Incontinent | |
|---|---|---|---|---|---|
| Variable | Category | N (%) | n = 6923 | n = 6856 | p‐Values |
| Age group | <65 | 2404 (17.5) | 1049 (15.2) | 1355 (19.8) | <0.0001 |
| 65–74 | 2236 (16.2) | 1110 (16.0) | 1126 (16.4) | ||
| 75–84 | 4262 (30.9) | 2168 (31.3) | 2094 (30.5) | ||
| 85+ | 4877 (35.4) | 2596 (37.5) | 2281 (33.3) | ||
| Sex | Female | 7478 (54.3) | 3757 (54.3) | 3721 (54.3) | >0.05 |
| Male | 6301 (45.7) | 3166 (45.7) | 3135 (45.7) | ||
| ADL hierarchy scale | 0 | 98 (0.71) | 88 (1.3) | 10 (0.2) | <0.0001 |
| 1–2 | 1422 (10.3) | 1255 (18.1) | 167 (2.4) | ||
| 3–4 | 4994 (36.2) | 3210 (46.4) | 1784 (26.0) | ||
| 5–6 | 7265 (52.7) | 2370 (34.2) | 4895 (71.4) | ||
| CPS scale | 0 | 1876 (13.6) | 1185 (17.1) | 691 (10.1) | <0.0001 |
| 1–2 | 4137 (30.0) | 2570 (37.1) | 1567 (22.9) | ||
| 3–4 | 4604 (33.4) | 2281 (33.0) | 2323 (33.9) | ||
| 5–6 | 3162 (23.0) | 887 (12.8) | 2275 (33.2) | ||
| CHESS scale | 0 | 3309 (24.0) | 1593 (23.0) | 1716 (25.0) | 0.02 |
| 1–2 | 7027 (51.0) | 3583 (51.8) | 3444 (50.2) | ||
| 3+ | 3443 (25.0) | 1747 (25.2) | 1696 (24.8) | ||
| Pain scale | 0 | 5040 (36.6) | 2315 (33.4) | 2725 (39.8) | <0.0001 |
| 1 | 4509 (32.7) | 2321 (33.5) | 2188 (31.9) | ||
| 2 | 3638 (26.4) | 1975 (28.5) | 1663 (24.3) | ||
| 3 | 592 (4.3) | 312 (4.5) | 280 (4.1) | ||
| BMI category | Underweight | 2069 (15.0) | 1054 (15.2) | 1015 (14.8) | >0.05 |
| Normal | 6010 (43.6) | 2941 (42.5) | 3069 (44.8) | ||
| Overweight | 3361 (43.6) | 1700 (24.6) | 1661 (24.2) | ||
| Obese | 2339 (17.0) | 1228 (17.7) | 1111 (16.2) | ||
| Bed mobility | Independent | 1607 (11.6) | 1282 (18.5) | 325 (4.7) | <0.0001 |
| Supervision | 505 (3.7) | 406 (5.9) | 99 (1.4) | ||
| Limited assistance | 2856 (20.7) | 1999 (28.9) | 857 (12.5) | ||
| Extensive assistance | 4860 (35.3) | 2381 (34.4) | 2479 (36.2) | ||
| Total dependence | 3096 (28.7) | 855 (12.3) | 3096 (45.2) | ||
| Transfer | Independent | 733 (5.3) | 622 (9.0) | 111 (1.6) | <0.0001 |
| Supervision | 540 (3.9) | 465 (6.7) | 75 (1.1) | ||
| Limited assistance | 2373 (17.2) | 1793 (25.9) | 580 (8.5) | ||
| Extensive assistance | 4161 (30.2) | 2413 (34.9) | 1748 (25.5) | ||
| Total dependence | 5972 (34.3) | 1630 (23.5) | 4342 (63.3) | ||
| Walk in room | Independent | 786 (5.7) | 649 (9.4) | 137 (2.0) | <0.0001 |
| Supervision | 664 (4.8) | 552 (8.0) | 112 (1.6) | ||
| Limited assistance | 1676 (12.2) | 1301 (18.8) | 375 (5.5) | ||
| Extensive assistance | 1766 (12.8) | 1056 (15.3) | 710 (10.4) | ||
| Total dependence/activity did not occur | 8887 (64.5) | 3365 (48.6) | 5522 (80.5) | ||
| Toilet use | Independent | 367 (2.7) | 332 (4.8) | 35 (0.5) | <0.0001 |
| Supervision | 309 (2.2) | 287 (4.2) | 22 (0.3) | ||
| Limited assistance | 1764 (12.8) | 1502 (21.7) | 262 (3.8) | ||
| Extensive assistance | 4193 (30.4) | 2910 (42.0) | 1283 (18.7) | ||
| Total dependence | 7146 (51.9) | 1892 (27.3) | 5254 (76.6) | ||
| Vision | Adequate | 7589 (63.8) | 4 031 (64.0) | 3558 (63.5) | 0.009 |
| Impaired | 2945 (24.8) | 1 599 (25.4) | 1346 (24.0) | ||
| Moderately impaired | 802 (6.7) | 413 (6.6) | 389 (7.0) | ||
| Highly impaired | 345 (2.9) | 144 (2.3) | 201 (3.6) | ||
| Severely impaired | 213 (1.8) | 106 (1.7) | 107 (1.9) | ||
| Perceived rehabilitation potential | No | 7795 (56.6) | 3305 (47.7) | <0.0001 | |
| Yes | 5984 (43.4) | 3618 (52.3) | |||
| Urinary | Not triggered | 3162 (23.00) | 887 (12.8) | 2275 (33.2) | |
| Incontinence | Triggered to prevent decline | 9422 (68.4) | 5001 (72.2) | 4421 (64.5) | <0.0001 |
| CAP | Triggered to facilitate improvement | 1195 (8.7) | 1035 (15.0) | 160 (2.3) | |
| Frailty index | 0.01–0.20 | 1041 (7.6) | 739 (10.7) | 302 (4.4) | <0.0001 |
| 0.21–0.30 | 4743 (34.4) | 2706 (39.1) | 2037 (29.7) | ||
| 0.31–0.40 | 5686 (41.3) | 2528 (36.5) | 3158 (46.1) | ||
| >0.40 | 2309 (16.8) | 950 (13.7) | 1359 (19.8) | ||
| Major comorbidity count | 0 | 1290 (10.9) | 815 (13.0) | 475 (8.5) | <0.0001 |
| 1–2 | 8688 (73.1) | 4485 (71.3) | 4203 (75.0) | ||
| 3+ | 1916 (16.1) | 993 (15.8) | 923 (16.5) | ||
| Making self‐understood | Understood | 6583 (47.8) | 3935 (56.8) | 2648 (38.6) | <0.0001 |
| Usually understood | 3633 (26.4) | 1938 (28.0) | 1695 (24.7) | ||
| Sometimes | 2350 (17.1) | 850 (12.3) | 1500 (21.9) | ||
| Rarely or never | 1213 (8.8) | 200 (2.9) | 1013 (14.8) |
Abbreviations: ADL, activities of daily living; BMI, body mass index; CAP, clinical assessment protocol; CHESS, changes in health, end‐stage disease, and signs and symptoms; UI, urinary incontinence.
3.2. Bivariate analysis
Following descriptive analysis of all patients in the baseline cohort, we conducted a further bivariate analysis with only those patients with some degree of incontinence on admission and therefore the chance to improve. This subgroup of patients differed significantly in both demographic and clinical features when compared to the patients who were continent of urine at the time of admission (Table 3). The patients with room to improve in UI status were more likely to be in the older age categories compared to those with no room to improve, 85+ (35% vs. 25%), 75–84 (30% vs. 29%), 65–74 (16% vs. 20%), and <65 (18% vs. 27) (Table 3) with median age and SD, 80 (14) versus 76 (14) years, p < 0.0001. They also have higher mean acute frailty index score 0.32 (SD = ±0.09) versus 0.23 (SD = ±0.08), p < 0.0001, and higher mean major comorbidity count 1.59 (SD = ±1.0) versus 1.34 (SD = ± 1.0), p < 0.0001. There was no statistically significant difference between the two groups in the mean number of medications used at the time of admission, 12.4 ± 5.5 versus 12.5 ± 5.2, p > 0. 05.
Table 3.
Comparison of patients who were continent on admission with those who were somewhat or completely incontinent
| Continent on admission | Somewhat or completely incontinent | |||
|---|---|---|---|---|
| Column1 | Column2 | Total | Total | |
| Variable | Category | N (%) | N (%) | p‐Value |
| Age (mean [SD]) | 73.2 [14.4] | 77.0 [14.0] | ||
| Age group | <65 | 1 289 (26.8) | 2 404 (17.5) | <0.0001 |
| 65–74 | 936 (19.5) | 2 236 (16.2) | ||
| 75–84 | 1 381 (28.7) | 4 262 (30.9) | ||
| 85+ | 1 199 (25.0) | 4 877 (35.4) | ||
| Sex | Female | 2 433 (50.6) | 7 478 (54.3) | <0.0001 |
| Male | 2 372 (49.4) | 6 301 (45.7) | ||
| Number of medications used | 12.5 (5.5) | 12.5 (5.2) | >0.05 | |
| ADL hierarchy | 0 | 539 (11.2) | 98 (0.7) | <0.0001 |
| 1–2 | 1 806 (37.6) | 1 422 (10.3) | ||
| 3–4 | 1 362 (28.3) | 4 994 (36.3) | ||
| 5–6 | 1 098 (22.9) | 7 265 (52.7) | ||
| CPS scale | 0 | 1 767 (36.8) | 1 876 (13.6) | <0.0001 |
| 1–2 | 1 849 (38.5) | 4 137 (30.0) | ||
| 3–4 | 907 (18.9) | 4 604 (33.4) | ||
| 5–6 | 282 (5.8) | 3 162 (23.0) | ||
| Bed mobility | Independent | 2 109 (43.9) | 1 607 (11.7) | <0.0001 |
| Supervision | 383 (8.0) | 505 (3.7) | ||
| Limited assistance | 1 234 (25.7) | 2 856 (20.7) | ||
| Extensive assistance | 745 (15.5) | 4 860 (35.3) | ||
| Total dependence | 334 (6.9) | 3 951 (28.6) | ||
| Activity did not occur | 0 | 0 | ||
| Rehabilitation potential | No | 2 386 (49.7) | 7 795 (56.6) | <0.0001 |
| Yes | 2 419 (50.3) | 5 984 (43.4) | ||
| Frailty index (mean [SD]) | 0.23 [0.08] | 0.32 [0.09] | <0.0001 | |
| Frailty index | 0.00–0.20 | 1 710 (35.6) | 1 041 (7.6) | <0.0001 |
| 0.21–0.30 | 2 191 (45.6) | 4 743 (34.4) | ||
| 0.31–0.40 | 754 (15.7) | 5 686 (41.3) | ||
| >0.40 | 150 (3.1) | 2 309 (16.7) | ||
| Morbidity count (mean [SD]) | 1.36 [1.0] | 1.59 [1.0] | <0.0001 | |
| Morbidity count | 0 | 789 (18.3) | 1 290 (10.9) | <0.0001 |
| 1–2 | 2 989 (69.4) | 8 688 (73.0) | ||
| 3+ | 532 (12.3) | 1 916 (16.1) |
Abbreviations: ADL, activities of daily living; CPS, cognitive performance scale; UI, urinary incontinence.
Continent on admission = no further chance to improve in UI.
Somewhat or completely continent = some chance to improve in UI.
We then used bivariate regression analysis to obtain the unadjusted OR of factors predictive of improvement in UI. In bivariate regression analysis reporting the unadjusted OR, the strongest positive predictors of improvement in UI were: triggered to facilitate improvement on the UI CAP (OR: 3.31 [95% CI: 2.81–3.91]), or to prevent decline (OR: 2.30 [95% CI: 2.04–2.59]) versus not triggered, receiving bladder retraining (OR: 2.51 [95% CI: 2.20–2.87]), and being independent or requiring some assistance with bed mobility, toilet use, and transfer (Table 4). For bivariate regression analysis, we checked separately for the effect of using the composite interRAI ADL hierarchy scale or the individual ADL items. Patients in the worst ADL hierarchy category (5–6, most dependent) were significantly less likely to improve in UI compared to those with no ADL impairment OR: 0.47 (95% CI: 0.30–0.72) (Table 4). However, the individual ADL components bed mobility and transfer had larger effect sizes and therefore were chosen for the multivariable regression analysis. In patients with the potential to improve, age group and sex did not significantly predict improvement in UI.
Table 4.
Bivariate regression analysis with an unadjusted odds ratio (OR) and 95% confidence interval (CI) for improvement in urinary incontinence
| Unadjusted OR with 95% CI | |||||
|---|---|---|---|---|---|
| Variable | Category | Parameter estimate | SE | OR | p‐Value |
| Age group | <65 | Ref | |||
| 65–74 | −0.01 | 0.07 | 0.99 (0.83–1.14) | 0.29 | |
| 75–84 | −0.05 | 0.06 | 0.95 (0.84–1.07) | ||
| 85+ | −0.10 | 0.06 | 0.91 (0.80–1.02) | ||
| Sex | Female | Ref | |||
| Male | −0.06 | 0.04 | 0.94 (0.87–1.02) | 0.16 | |
| ADL hierarchy scale | 0 | Ref | |||
| 1–2 | −0.19 | 0.22 | 0.82 (0.53–1.27) | <0.0001 | |
| 3–4 | −0.35 | 0.22 | 0.69 (0.45–1.07) | ||
| 5–6 | −0.75 | 0.22 | 0.47 (0.30–0.72) | ||
| CPS scale | 0 | Ref | |||
| 1–2 | −0.26 | 0.06 | 0.76 (0.67–0.86) | <0.0001 | |
| 3–4 | −0.46 | 0.06 | 0.62 (0.55–0.70) | ||
| 5–6 | −1.18 | 0.07 | 0.31 (0.26–0.35) | ||
| Making self‐understood | Understood | Ref | |||
| Rarely/never understood | −1.35 | 0.11 | 0.26 (0.21–0.32) | <0.0001 | |
| Sometimes understood | −0.61 | 0.06 | 0.55 (0.48–0.62) | ||
| Usually understood | −0.25 | 0.05 | 0.77 (0.70–0.85) | ||
| CHESS scale | 0 | Ref | |||
| 1–2 | 0.16 | 0.05 | 1.16 (1.05–1.29) | 0.0001 | |
| 3+ | 0.26 | 0.06 | 1.27 (1.13–1.42) | ||
| Pain scale | 0 | Ref | |||
| 1 | 0.32 | 0.05 | 1.37 (1.24–1.52) | <0.0001 | |
| 2 | 0.35 | 0.05 | 1.42 (1.28–1.58) | ||
| 3 | 0.48 | 0.10 | 1.62 (1.32–1.97) | ||
| BMI category | Normal | Ref | |||
| Underweight | 0.02 | 0.06 | 1.02 (0.90–1.16) | 0.02 | |
| Overweight | 0.12 | 0.05 | 1.13 (1.02–1.25) | ||
| Obese | 0.15 | 0.06 | 1.16 (1.03–1.30) | ||
| Bed mobility | Independent | Ref | |||
| Supervision | 0.10 | 0.12 | 1.11 (0.88–1.39) | <0.0001 | |
| Limited assistance | 0.09 | 0.07 | 1.10 (0.95–1.26) | ||
| Extensive assistance | −0.07 | 0.07 | 0.93 (0.82–1.06) | ||
| Total dependence | −0.72 | 0.07 | 0.49 (0.42–0.56) | ||
| Transfer | Independent | Ref | |||
| Supervision | 0.35 | 0.13 | 1.42 (1.11–1.83) | <0.0001 | |
| Limited assistance | 0.17 | 0.10 | 1.18 (0.98–1.44) | ||
| Extensive assistance | 0.14 | 0.09 | 1.15 (0.95–1.38) | ||
| Total dependence | −0.54 | 0.09 | 0.58 (0.49–0.70) | ||
| Walk in room | Independent | Ref | |||
| Supervision | 0.34 | 0.12 | 1.41 (1.11–1.80) | <0.0001 | |
| Limited assistance | 0.33 | 0.10 | 1.39 (1.13–1.70) | ||
| Extensive assistance | 0.22 | 0.10 | 1.25 (1.02–1.52) | ||
| Total dependence/activity did not occur | −0.13 | 0.09 | 0.88 (0.74–1.06) | ||
| Toilet use | Independent | Ref | |||
| Supervision | −0.05 | 0.17 | 0.95 (0.68–1.32) | <0.0001 | |
| Limited assistance | −0.15 | 0.13 | 0.86 (0.67–1.10) | ||
| Extensive assistance | −0.18 | 0.12 | 0.83 (0.66–1.05) | ||
| Total dependence | −0.80 | 0.12 | 0.45 (0.36–0.57) | ||
| Vision | Adequate | Ref | |||
| Impaired | −0.01 | 0.05 | 0.99 (0.90–1.10) | <0.0001 | |
| Moderately impaired | −0.42 | 0.10 | 0.66 (0.55–0.80) | ||
| Highly impaired | −0.64 | 0.16 | 0.53 (0.39–0.72) | ||
| Severely impaired | −0.49 | 0.19 | 0.61 (0.43–0.88) | ||
| Urinary | Not triggered | Ref | |||
| Incontinence | Prevent decline | 0.84 | 0.06 | 2.30 (2.04–2.59) | <0.0001 |
| CAP | Facilitate improvement | 1.20 | 0.08 | 3.31 (2.81–3.91) | |
| Bladder retraining | No | Ref | |||
| Yes | 0.93 | 0.07 | 2.51 (2.20–2.87) | <0.0001 | |
| Perceived rehabilitation potential | No | Ref | |||
| Yes | 0.58 | 0.04 | 1.77 (1.62–1.92) | <0.0001 | |
| Frailty index | 0.01–0.20 | Ref | |||
| 0.21–0.30 | −0.07 | 0.08 | 0.93 (0.80–1.09) | <0.0001 | |
| 0.31–0.40 | −0.26 | 0.08 | 0.77 (0.66–0.90) | ||
| >0.40 | −0.39 | 0.09 | 0.68 (0.57–0.81) | ||
| Major comorbidity count | 0 | Ref | |||
| 1–2 | −0.43 | 0.07 | 0.65 (0.57–0.74) | <0.0001 | |
| 3+ | −0.53 | 0.08 | 0.59 (0.50–0.69) | ||
Abbreviations: ADL, activities of daily living; BMI, body mass index; CAP, clinical assessment protocol; CHESS,changes in health, end‐stage disease, and signs and symptoms; CPS, cognitive performance scale.
3.3. Multivariable regression model
The strongest positive independent predictors of improvement in UI after adjusting for other variables, were receiving bladder retraining, starting any new medication in the past 90 days (OR: 1.54 [95% CI: 1.36–1.75]), and triggering to facilitate improvement in the UI CAP (OR: 1.36 [95% CI: 1.08–1.71]), or to prevent decline (OR: 1.32 [95% CI: 1.13–1.53]). We found strong positive interaction between bladder retraining and bed mobility. Bladder retraining significantly improved UI for patients requiring any form of assistance with bed mobility (Figure 1). We found no significant independent effect of sex on improvement in UI.
Figure 1.
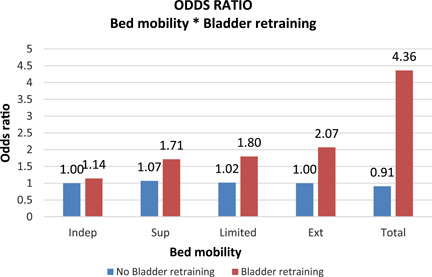
Interaction effects for bed mobility and bladder retraining, Note: This is a graphical representation of the net effect of bed mobility accounting for the interaction with bladder training. The blue bars show the effect size of bed mobility on UI improvement without bladder training, while the red bars show the net effect size after accounting for the interaction between bed mobility and bladder training. UI, urinary incontinence.
The strongest independent predictors of less likelihood for UI improvement were being totally dependent on others for transfer (OR: 0.62 [95% CI: 0.42–0.92)], “is being rarely or never understood” (OR: 0.65 [95% CI: 0.50–0.85]) and having a major morbidity count of ≥3 (OR: 0.72 [95% CI: 0.59–0.88]) (Table 5). Having Parkinson's disease (OR: 0.77 [95% CI: 0.62–0.95]), Alzheimer/other dementia (OR: 0.83 [95% CI: 0.74–0.93]), and respiratory infections (OR: 0.57 [95% CI: 0.39–0.85]) also independently predicted a lesser likelihood of UI improvement.
Table 5.
Multivariable logistic regression results adjusted odds ratio (OR) and 95% confidence interval (CI) of improvement in urinary incontinence
| Variable | Category | Parameter estimate | SE | Adjusted odds ratio (95% CI) OR | p‐Value | |
|---|---|---|---|---|---|---|
| Frailty index | 0.01–0.2 | Ref | ||||
| 0.21–0.30 | −0.06 | 0.10 | 0.94 (0.77–1.14) | 0.01 | ||
| 0.31–0.40 | −0.17 | 0.11 | 0.84 (0.68–1.04) | |||
| >0.40 | −0.35 | 0.13 | 0.71 (0.54–0.91) | |||
| Major comorbidity count | 0 | Ref | ||||
| 1–2 | −0.20 | 0.07 | 0.82 (0.71–0.95) | 0.004 | ||
| 3+ | −0.33 | 0.10 | 0.72 (0.59–0.88) | |||
| Vision | Adequate | Ref | ||||
| Impaired | 0.04 | 0.05 | 1.05 (0.94–1.17) | 0.005 | ||
| Moderately Impaired | −0.28 | 0.10 | 0.76 (0.62–0.92) | |||
| Highly Impaired | −0.30 | 0.16 | 0.74 (0.53–1.02) | |||
| Severely Impaired | −0.31 | 0.20 | 0.73 (0.49–1.06) | |||
| Urinary incontinence CAP | Not triggered | Ref | ||||
| Triggered (prevent decline) | 0.28 | 0.08 | 1.32 (1.13–1.53) | 0.001 | ||
| Triggered (facilitate improvement) | 0.31 | 0.12 | 1.36 (1.08–1.71) | |||
| Pain scale | 0 | Ref | ||||
| 1 | 0.18 | 0.06 | 1.20 (1.06–1.34) | 0.02 | ||
| 2 | 0.09 | 0.06 | 1.09 (0.96–1.23) | |||
| 3 | 0.13 | 0.11 | 1.14 (0.91–1.41) | |||
| Age group | <65 | Ref | ||||
| 65–74 | ‐0.14 | 0.08 | 0.87 (0.75–1.02) | <0.0001 | ||
| 75–84 | −0.24 | 0.07 | 0.79 (0.68–0.91) | |||
| 85+ | −0.34 | 0.08 | 0.71 (0.61–0.82) | |||
| Making self‐understood | Understood | Ref | ||||
| Usually understood | −0.06 | 0.06 | 0.94 (0.84–1.05) | 0.01 | ||
| Sometimes understood | −0.15 | 0.08 | 0.86 (0.74–1.01) | |||
| Rarely/never understood | −0.42 | 0.14 | 0.65 (0.50–0.85) | |||
| Bladder retraining | Received | 0.28 | 0.22 | 1.10 (0.64–1.89) | >0.05 | |
| Perceived rehabilitation potential | Yes | 0.22 | 0.05 | 1.24 (1.12–1.36) | <0.0001 | |
| Bed mobilitya | Independent | Ref | ||||
| Supervision | 0.07 | 0.14 | 1.07 (0.82–1.40) | >0.05 | ||
| Limited assistance | 0.02 | 0.10 | 1.02 (0.84–1.24) | |||
| Extensive assistance | −0.001 | 0.11 | 1.00 (0.81–1.23) | |||
| Total dependence | −0.10 | 0.11 | 0.91 (0.71–1.16) | |||
| Transfers | Independent | Ref | ||||
| Supervision | 0.07 | 0.19 | 1.07 (0.71–1.49) | 0.000 | ||
| Limited assistance | −0.17 | 0.18 | 0.85 (0.57–1.19) | |||
| Extensive assistance | −0.17 | 0.19 | 0.84 (0.56–1.21) | |||
| Total dependence | −0.46 | 0.20 | 0.63 (0.42–0.92) | |||
| Disease/illness | ||||||
| Hypertension | Yes | 0.16 | 0.05 | 1.18 (1.06–1.29) | 0.002 | |
| Hemiplegia/hemiparesis | Yes | 0.20 | 0.07 | 1.23 (1.05–1.40) | 0.008 | |
| Parkinson's disease | Yes | −0.27 | 0.11 | 0.77 (0.62–0.95) | 0.02 | |
| Clostridium difficile | Yes | 0.33 | 0.14 | 1.40 (1.05–1.84) | 0.02 | |
| Respiratory infection | Yes | −0.58 | 0.20 | 0.57 (0.39–0.85) | 0.005 | |
| Urinary tract infection | Yes | 0.18 | 0.06 | 1.20 (1.06–1.35) | 0.004 | |
| Wound infection | Yes | 0.37 | 0.11 | 1.45 (1.17–1.80) | 0.001 | |
| Alzheimer's or other dementias | Yes | −0.19 | 0.06 | 0.83 (0.74–0.93) | 0.002 | |
| Hip fracture | Yes | 0.23 | 0.07 | 1.25 (1.09–1.42) | 0.0007 | |
| Other health conditions | ||||||
| Dizziness/vertigo | Yes | 0.20 | 0.08 | 1.22 (1.03–1.42) | 0.02 | |
| Shortness of breath | Yes | 0.22 | 0.06 | 1.25 (1.12–1.44) | <0.0001 | |
| Unsteady gait | Yes | 0.10 | 0.05 | 1.11 (1.00–1.22) | 0.03 | |
| Fall last 30 days | Yes | 0.16 | 0.05 | 1.11 (1.05–1.29) | 0.002 | |
| New meds last 90 days | Yes | 0.45 | 0.06 | 1.56 (1.36–1.75) | <0.0001 | |
| New meds last 90 days | Unknown | 0.47 | 0.09 | 1.60 (1.33–1.92) | <0.0001 | |
| No. of days on hypnotics | −0.02 | 0.01 | 0.98 (0.96–0.99) | 0.01 | ||
| Bladder retraining × bed mobility | Independent | Ref | ||||
| Supervision | 0.33 | 0.59 | 1.50 (0.49–4.63) | 0.01 | ||
| Limited assistance | 0.45 | 0.31 | 1.60 (0.88–2.90) | |||
| Extensive assistance | 0.59 | 0.30 | 1.81 (1.01–3.23) | |||
| Total dependence | 1.10 | 0.33 | 2.72 (1.43–5.19) | |||
See Figure 1 for interaction net effect.
Hosmer–Lemeshow goodness‐of‐fit test for our final model suggested the model was a reasonable fit for the dataset used (χ 2 = 9.015, p = 0.341). The check for multicollinearity showed no significant collinearity between the independent variables included in the final model, as none of the variables returned VIF above 5. Our model's predictive accuracy was determined to show a C‐statistics of 67.3%.
4. DISCUSSION
In this cohort of patients with potential for improvement in UI who received care at CCC facilities in Ontario between 2009 and 2018, receiving bladder retraining while being totally dependent on others for bed mobility, starting a new medication in the past 90 days, triggering the UI CAP to facilitate improvement or prevent decline, and patient or care staff perceiving rehabilitation potential strongly predicted a higher likelihood of improvement in UI. Conversely, being fully dependent on others for transfer, not being understood by others, having a count of three or more major health condition domains (or having specific health conditions like respiratory infection, Parkinson's disease, Alzheimer/other dementia), being frail, and increasing older age strongly predicted less likelihood of improvement, among patients with room for improvement in continence.
Most patients in this longer‐stay study cohort (74%) had some level of UI on admission, a very high prevalence more similar to long‐term care (nursing home) settings 24 , 25 than rates cited for all length of stay patients in other post‐acute settings. 2 Patients in this cohort were somewhat more likely to develop UI between admission and 90‐day reassessment (20%) than they were to improve in UI during the same period (18%). Though 18% of patients who were incontinent on admission improved in UI, only 6.4% regained complete bladder control. This highlights the importance of identifying factors associated with the improvement that could be targeted for care planning.
Bladder retraining showed a stronger positive effect on UI improvement when provided to patients who required any form of assistance for bed mobility, with an incrementally positive effect as the level of assistance required increased. Bladder retraining is a form of behavioral therapy that consists of patient education and timed micturition, with an attempt to intentionally delay voiding, 26 with evidence suggesting some benefit for UI control. 26 It requires patients to be motivated and committed to the plan for it to work. Supporting this, our analysis showed that where patients believe themself to be capable of improving in physical function or where the direct staff overseeing them believes the same, such patients were more likely to improve in their UI. This also suggests the critical importance of recognizing the potential for rehabilitation and providing necessary interventions.
This incremental effect of bladder training on UI seen in patients with some level of physical impairment lends credence to the previously reported critical role for optimal physical function in maintaining continence. 27 Having, for example, total dependency on bed mobility, in transfers, or to walk in a room, significantly predicted less likelihood of improving in UI. This implies that improving physical functioning and mobility could be the most crucial step toward improving UI. 27
The reasons for the improvement in those starting a new medication in the last 90 days are unknown. Medications may be beneficial 10 or adversely affect 28 continence. It is also possible that medications may have been targeted at improving comorbid conditions which also made successful toileting more likely. 11
Multimorbidity and frailty had similar relationships to UI in our study, likely related to their correlation with function. 29 , 30 Patients in the worst frailty category (>0.4) were significantly less likely to improve in UI, compared to those in the least frail category. Frailty and UI are suggested to have a bidirectional relationship, with UI a triggering factor for frailty and vice‐versa. 11 The major comorbidity count was incrementally more predictive of less likelihood of UI improvement. Our study showed that multimorbidity is more predictive of UI compared to individual diseases, 31 although individual diseases, like Parkinson's disease and Alzheimer's disease, are strongly associated with the development of UI and a less likelihood of improvement. 32 , 33
In addition to the presence of comorbid conditions, patients' cognitive status or sensory impairment were significant predictors of change in UI. Making oneself understood and other cognition‐related conditions had significant effects on improving UI. Patients who were “rarely or never understood” and those with Alzheimer's/other dementias were less likely to improve. However, the effect of cognition on UI improvement was not as pronounced as that of poor physical function. The stronger predictive effect of ADL further supports the argument of the importance of physical rehabilitation for continence promotion. 34
Findings from this study provide further evidence for the usefulness of the interRAI UI CAP in assisting care staff in the identification of individuals with the potential to improve in UI. Patients in this cohort who triggered the UI CAP to prevent decline or to facilitate improvement in UI were more likely to improve in UI after 90 days. As part of orientation to MDS instruments, care staff is taught to use the UI CAP (and other interRAI CAPs) to identify areas of concern and then use this information to collaboratively care plan with the patient for the priority functional, cognitive, social, and/or clinical issues. Whether this higher likelihood of improvement was due to the subsequent provision of beneficial intervention to those who triggered the UI CAP is not known and requires future research. Another potential question for future research includes understanding the subsequent care planning for patients who triggered the UI CAP in the postacute setting.
5. LIMITATIONS
This study cohort consisted only of patients who stayed in CCC up to and above 90 days. Many (58.1%) of the CCC patients were discharged home before 90 days and therefore are excluded from this analysis because they would not provide the initial and follow‐up assessment data required for the study. Therefore, there is no information on improvement or deterioration in UI for shorter‐stay patients. Detailed information about what medications were started in the past 90 days was not examined in this study.
6. CONCLUSION
Improving physical function, including bed mobility, and providing bladder retraining have a positive impact on improving UI for patients in post‐acute care. Evidence generated from this study provides useful care planning information for providers in identifying patients and targeting the care that will lead to better success in UI management in post‐acute care settings.
AUTHOR CONTRIBUTIONS
Bonaventure A. Egbujie and John P. Hirdes conceived of the presented idea. Caitlin McArthur, Melissa Northwood, Adrian S. Wagg, George A. Heckman, and Katherine Berg provided clinical guidance on the analytical framework. Bonaventure A. Egbujie and Luke A. Turcotte performed the data analysis. John P. Hirdes verified the analytical methods. Bonaventure A. Egbujie and Melissa Northwood wrote the manuscript. All authors contributed to the interpretation of the results and contributed to the final manuscript.
CONFLICT OF INTEREST
Dr. Adrian S. Wagg declares the following financial conflicts, unrelated to the components of this study and content of the manuscript: Pfizer Corp. (research support), Essity Hygiene & Health AB (research support, consultancy), and Urovant Sciences (speaker honoraria). The remaining authors declare no conflict of interest.
ETHICS STATEMENT
The full ethical approval for the secondary use of the data for this study has been obtained through the University of Waterloo's Office of Research Ethics (ORE# 30372).
Supporting information
Supplementary information.
Supplementary information.
Supplementary information.
ACKNOWLEDGMENTS
Dr. John P. Hirdes is supported in part by funding from the Government of Canada's New Frontiers in Research Fund for the Individualized CARE for Older Persons with Complex Chronic Conditions in Home Care and Nursing Homes (I‐CARE4OLD) study. Salary support for Dr. Heckman is provided by the Schlegel Research Chair in Geriatric Medicine.
Egbujie BA, Northwood M, Turcotte LA, et al. Predictors of improvement in urinary incontinence in the postacute setting: a Canadian cohort study. Neurourol Urodyn. 2022;41:1749‐1763. 10.1002/nau.25018
DATA AVAILABILITY STATEMENT
The data that support the findings of this study are available from Canadian Institute for Health Information. Restrictions apply to the availability of these data, which were used under license for this study.
REFERENCES
- 1. Abrams P, Cardozo L, Fall M, et al. The standardisation of terminology of lower urinary tract function: Report from the standardisation sub‐committee of the International Continence Society. Neurourol Urodyn. 2002;21(2):167‐178. [DOI] [PubMed] [Google Scholar]
- 2. Mixon AS, Yeh VM, Simmons S, et al. Improving care transitions for hospitalized veterans discharged to skilled nursing facilities: a focus on polypharmacy and geriatric syndromes. Geriatrics. 2019;4(1):19. [DOI] [PMC free article] [PubMed] [Google Scholar]
- 3. Turcotte LA, Daniel I, Hirdes JP. The post‐acute delayed discharge risk scale: derivation and validation with Ontario alternate level of care patients in Ontario complex continuing care hospitals. J Am Med Dir Assoc. 2020;21(4):538‐544. [DOI] [PubMed] [Google Scholar]
- 4. Shaw C, Wagg A. Urinary and faecal incontinence in older adults. Medicine. 2021;49(1):44‐50. [Google Scholar]
- 5. Zarowitz BJ, Allen C, O'Shea T, Tangalos E, Berner T, Ouslander JG. Clinical burden and nonpharmacologic management of nursing facility residents with overactive bladder and/or urinary incontinence. Consult Pharm. 2015;30(9):533‐542. https://pubmed.ncbi.nlm.nih.gov/26350894/ [DOI] [PubMed] [Google Scholar]
- 6. Mallinson T, Fitzgerald CM, Neville CE, et al. Impact of urinary incontinence on medical rehabilitation inpatients. Neurourol Urodyn. 2017;36(1):176‐183. [DOI] [PubMed] [Google Scholar]
- 7. Morris JN, Berg K, Björkgren M, et al. interRAI Clinical Assessment Protocols (CAPs) for Use With Community and Long‐Term Care Assessment Instruments (Standard English Edition). interRAI; 2010. [Google Scholar]
- 8. Cohn JA, Shah AS, Goggins KM, et al. Health literacy, cognition, and urinary incontinence among geriatric inpatients discharged to skilled nursing facilities. Neurourol Urodyn. 2018;37(2):854‐860. [DOI] [PMC free article] [PubMed] [Google Scholar]
- 9. Hirdes JP, Ljunggren G, Morris JN, et al. Reliability of the interRAI suite of assessment instruments: a 12‐country study of an integrated health information system. BMC Health Serv Res. 2008;8:277. [DOI] [PMC free article] [PubMed] [Google Scholar]
- 10. Abrams P, Andersson KE, Apostolidis A, et al. 6th International Consultation on Incontinence. Recommendations of the International Scientific Committee: evaluation and treatment of urinary incontinence, pelvic organ prolapse and faecal incontinence. Neurourol Urodyn. 2018;37:2271‐2272. [DOI] [PubMed] [Google Scholar]
- 11. Gibson W, Johnson T, Kirschner‐Hermanns R, et al. Incontinence in frail elderly persons: report of the 6th International Consultation on Incontinence. Neurourol Urodyn. 2021;40:38‐54. [DOI] [PubMed] [Google Scholar]
- 12. Morris JN, Fries B, Morris SA. Scaling ADLs within the MDS. J Gerontol A Biol Sci Med Sci. 1999;54(11):M546‐M553. https://academic.oup.com/biomedgerontology/article/54/11/M546/544783 [DOI] [PubMed] [Google Scholar]
- 13. Morris JN, Berg K, Fries BE, Steel K, Howard EP. Scaling functional status within the interRAI suite of assessment instruments. BMC Geriatr. 2013;13:128. 10.1186/1471-2318-13-128 [DOI] [PMC free article] [PubMed] [Google Scholar]
- 14. Hubbard RE, Peel NM, Samanta M, et al. Derivation of a frailty index from the interRAI acute care instrument. BMC Geriatr. 2015;15:27. 10.1186/s12877-015-0026-z [DOI] [PMC free article] [PubMed] [Google Scholar]
- 15. Canadian Institute for Health Information . Pandemic experience in the long‐term care sector: How does Canada compare with other Countries? CIHI; 2020.
- 16. Morris JN, Hawes C, Mor V, et al. Resident Assessment Instrument (RAI): RAI‐MDS 2.0 User's Manual, Canadian Version. interRAI; 2010. https://secure.cihi.ca/estore/productSeries.htm?pc=PCC127 [Google Scholar]
- 17. Morris JN, Howard EP, Steel K, et al. Updating the cognitive performance scale. J Geriatr Psychiatry Neurol. 2016;29(1):47‐55. 10.1177/0891988715598231 [DOI] [PubMed] [Google Scholar]
- 18. Burrows AB, Morris JN, Simon SE, Hirdes JP, Phillips C. Development of a minimum data set‐based depression rating scale for use in nursing homes. Age Ageing. 2000;29(2):165‐172. 10.1093/ageing/29.2.165 [DOI] [PubMed] [Google Scholar]
- 19. Fries BE, Simon SE, Morris JN, Flodstrom C, Bookstein FL. Pain in U.S. nursing homes: validating a pain scale for the minimum data set. Gerontologist. 2001;41(2):173‐179. 10.1093/geront/41.2.173 [DOI] [PubMed] [Google Scholar]
- 20. Hirdes JP, Frijters DH, Teare GF. The MDS‐CHESS scale: a new measure to predict mortality in institutionalized older people. J Am Geriatr Soc. 2003;51(1):96‐100. 10.1034/j.1601-5215.2002.51017.x [DOI] [PubMed] [Google Scholar]
- 21. Hirdes JP, Poss JW, Mitchell L, Korngut L, Heckman G. Use of the interRAI CHESS scale to predict mortality among persons with neurological conditions in three care settings. PLoS One. 2014;9(6):e99066. 10.1371/journal.pone.0099066 [DOI] [PMC free article] [PubMed] [Google Scholar]
- 22. Morris JN, Belleville‐Taylor P, Berg K, et al, eds. interRAI Clinical Assessment Protocols (HC‐LTCF‐CHA CAPs) for Use With Community and Long‐Term Care Assessment Instruments, Version 9.1. interRAI; 2008. [Google Scholar]
- 23. Benchimol EI, Smeeth L, Guttmann A, et al. The reporting of studies conducted using observational routinely‐collected health data (RECORD) statement. PLoS Med. 2015;12(10):e1001885. [DOI] [PMC free article] [PubMed] [Google Scholar]
- 24. Ouslander JG, Kane RL, Abrass IB. Urinary incontinence in elderly nursing home patients. JAMA. 1982;248(10):1194‐1198. [PubMed] [Google Scholar]
- 25. Anger JT, Saigal CS, Pace J, Rodríguez LV, Litwin MS. True prevalence of urinary incontinence among female nursing home residents. Urology. 2006;67(2):281‐287. [DOI] [PubMed] [Google Scholar]
- 26. Fantl JA, Wyman JF, Mcclish DK, et al. Efficacy of bladder training in older women with urinary incontinence. JAMA. 1991;265(5):609‐613. [PubMed] [Google Scholar]
- 27. Jachan DE, Müller‐Werdan U, Lahmann NA. Impaired mobility and urinary incontinence in nursing home residents: a multicenter study. J Wound Ostomy Continence Nurs. 2019;46(6):524‐529. [DOI] [PubMed] [Google Scholar]
- 28. Tsakiris P, Oelke M, Michel MC. Drug‐induced urinary incontinence. Drugs and Aging. 2008;25(7):541‐549. [DOI] [PubMed] [Google Scholar]
- 29. Fried LP, Ferrucci L, Darer J, Williamson JD, Anderson G. Untangling the concepts of disability, frailty, and comorbidity: implications for improved targeting and care. J Gerontol A Biol Sci Med Sci. 2004;59:255‐263. [DOI] [PubMed] [Google Scholar]
- 30. Cesari M, Pérez‐Zepeda MU, Marzetti E. Frailty and multimorbidity: different ways of thinking about geriatrics. J Am Med Dir Assoc. 2017;18(4):361‐364. [DOI] [PubMed] [Google Scholar]
- 31. Gammack JK. Urinary incontinence in the frail elder. Clin Geriatr Med. 2004;20(3):453‐466. [DOI] [PubMed] [Google Scholar]
- 32. Lee HY, Li CC, Juan YS, et al. Urinary incontinence in Alzheimer's disease. Am J Alzheimers Dis Other Demen. 2017. 32(1):51‐55. [DOI] [PMC free article] [PubMed] [Google Scholar]
- 33. Lee SH, Cho ST, Na HR, Ko SB, Park MH. Urinary incontinence in patients with Alzheimer's disease: relationship between symptom status and urodynamic diagnoses. Int J Urol. 2014;21(7):683‐687. [DOI] [PubMed] [Google Scholar]
- 34. Schumpf LF, Theill N, Scheiner DA, Fink D, Riese F, Betschart C. Urinary incontinence and its association with functional physical and cognitive health among female nursing home residents in Switzerland. BMC Geriatr. 2017;17(1):17. [DOI] [PMC free article] [PubMed] [Google Scholar]
Associated Data
This section collects any data citations, data availability statements, or supplementary materials included in this article.
Supplementary Materials
Supplementary information.
Supplementary information.
Supplementary information.
Data Availability Statement
The data that support the findings of this study are available from Canadian Institute for Health Information. Restrictions apply to the availability of these data, which were used under license for this study.