

Abstract
pKa values in non‐aqueous solvents are of critical importance in many areas of chemistry. Our knowledge is, despite their relevance, still limited to the most fundamental properties and few pKa values in the most common solvents. Taking advantage of a recently introduced computationally efficient procedure we computed the pKa values of 182 compounds in 21 solvents. This data set is used to establish for the first time universal trends between all solvents. Our computations indicate, that the total charge of the molecule and the charge of the acidic group combined with the Kamlet‐Taft solvatochromic parameters are sufficient to predict pKa values with at least semi‐ quantitative accuracy. We find, that neutral acids such as alcohols are strongly affected by the solvent properties. This is contrasted by cationic acids like ammonium ions whose pKa is often almost completely independent from the choice of solvent.
Keywords: pKa, non-aqueous solvents, DFT, pharmacology, morphine, diazepam, ibuprofen
The ToC entry is the shortest summary of your article. It is always freely available online for anyone to view, and we use it to promote your work in social media. Please provide a shorttext(between 200 and 400 characters) connected to your ToC graphic.

1. Introduction
Acids have been known and used within the European cultural area already for more than 2000 years. Initially, the (al)chemists of these times were restricted to only rather week organic acids like vinegar. Reported uses comprise for example food preparation and preservation [1] but also extremely questionable applications like calming the stormy seas. [2] From these humble beginnings it took more than a millennium until the first mineral acids were synthesized by Arab and European alchemists through heating niter (KNO3), vitriol ((Fe,Cu) SO4) and/or alum to afford for example impure sulfuric acid or nitric acid.[ 3 , 4 ] Naturally, these new acids immediately gained significant attention but little was known regarding their true nature. However, over the following centuries the fundamental understanding of chemistry developed to a level which allowed Davy and von Liebig to suggest that hydrogen atoms are involved in the dissociation of acids. [5] Their early empirical theory was then refined by Arrhenius [5] and Brønsted [6] by stressing the role of dissolved protons for acid‐base chemistry. These dissolved protons were later shown to display a rather complex solvation shell. [7]
Building on these insights we nowadays posses an excellent understanding of acid‐base chemistry in water and determining pKa values in water experimentally[ 8 , 9 , 10 ] or through computations[ 11 , 12 , 13 , 14 , 15 , 16 , 17 , 18 ] is a routine task. For non‐aqueous solvents on the other hand no comparable level of understanding has been achieved so far. Indeed, in solvents other than water our knowledge is restricted to the most fundamental properties. It is by now agreed upon, that acid base reactions in non‐aqueous solvents do, in contrast to water, not necessarily proceed through proton‐solvent complexes.[ 11 , 19 , 20 ] Instead, they are exchanged through a direct interaction of the acidic and basic group.[ 19 , 20 ] Naturally this significantly alters the kinetic profile of the acid‐base reaction. The reason for this change in mechanism is the less negative energy of solvation of protons in non‐aqueous solvents[ 11 , 19 , 21 , 22 , 23 , 24 ] which renders their presence unfavorable.
Additionally, also a less comprehensive set of pKa values in only a rather limited number of solvents has been determined so far experimentally.[ 8 , 25 , 26 , 27 , 28 , 29 , 30 , 31 ] Indeed, most of the reported data refer to the most common solvents such as dimethyl sulfoxide (DMSO) or tetrahydrofurane (THF). However, even these experimental data are often of questionable accuracy and can vary significantly between different measurements. [11] Taking for example the pKa of picric acid in 1,2‐dichloroethane, pKa values of 13.7 [25] and 45 [19] have been suggested. Similar but less extreme variations are also observed in other solvents. [25] Furthermore, measured and computed pKa values in dimethyl sulfoxide suggest, that acids should posses comparable or lower pKa values than in water.[ 25 , 26 , 32 ] The origin of this unexpected behavior can be traced back to the predicted higher proton solvation energy of the proton in DMSO.[ 21 , 22 , 24 , 33 , 34 , 35 , 36 , 37 , 38 , 39 ] The proton solvation energy corresponds to the energy required to transfer a proton from vacuum into the solvent of interest. The validity of these counter‐intuitive results has recently been questioned.[ 11 , 40 ] These deviations are among others the result of experimental complications such as the almost unavoidable presence of impurities like water[ 41 , 42 ] or the possible formation of ion pairs which is corrected for in some but not all measurements. [26] However, these contributions typical cancel within a series of measurements and therefore affect the obtained pKa values to a lesser extend.[ 11 , 26 ] More critical are errors associated with the need to convert the measured relative pKa values to an absolute scale. This conversion relies on the pKa of a reference compound which has already been determined experimentally or computationally in an earlier study. [26] Through statistical analysis comparing computed and measured pKa values, this conversion was identified as the main source of uncertainties. [11]
The situation is complicated further by the fact, that also computational modeling typically requires a reference value. In most cases an experimental pKa value, which has been determined in the solvent of interest, is used for this purpose.[ 14 , 43 , 44 , 45 , 46 ] Owing to this direct relationship with experimentally obtained pKa values also these computational results are subject to the problems associated with determining a suitable reference to offset the measured pKa values. In the context of the “electrostatic transform method” this problem was avoided by using the accurate proton solvation energy in the solvent of interest to convert the pKa values between different solvents.[ 47 , 48 ] However, proton solvation energies are again only known in the most common solvents and often also subject to significant uncertainties between different studies.[ 11 , 21 , 22 , 24 , 33 , 34 , 35 , 36 , 37 , 38 , 39 ] Experimentally, proton solvation energies are obtained for example through electrochemical measurements in a Kenrick cell[ 38 , 49 , 50 , 51 ] and tend to vary strongly between different experiments.[ 11 , 38 , 49 , 50 ] Computations of the proton solvation energy on the other hand typically rely on the experimental pKa of selected molecules in the solvent of interest[ 21 , 22 , 37 ] and thus, again suffer from the aforementioned problem of requiring a reference pKa in the experiments. Similarly, also meta‐dynamics simulations, which in principle do not require an experimental pKa,[ 52 , 53 ] are only partly suitable for determining a reference pKa. The reason for this is that these simulations require the accurate description of the dissolved proton in the solvent of interest. These simulations are already complex and expensive in water and, owing to the rather large size and complexity of solvent molecules, unfeasible in most non‐aqueous solvents and ionic liquids. Building on these rather limited data for pKa values obtained from experiments and computations some trends between different solvents have been suggested, [26] but a truly global perspective is still missing.
In what follows we will develop for the first time a general semi‐quantitative understanding of the behavior of different organic acids in a wide range of solvents. In contrast to earlier work we rely on pKa values which have been computed using a recently developed procedure for pKa prediction which only requires an experimental pKa value in water combined with density functional theory (DFT) computations and a suitable solvation model as input.[ 11 , 40 ] Thus, any experimental or computational shortcomings of the above described methods can be avoided. Our results indicate, that acids can be divided in different groups based on the charge of the acidic functional group. The pKa of cationic acids like ammonium or iminium ions remains almost completely unaffected by the choice of solvent whereas the pKa of neutral acids like alcohols or carboxylic acids strongly increases when moving from highly polarizable protic solvents like water to apolar aprotic media like cyclohexane. Zwitterions finally are found to display an intermediate behavior.
Methods
Computational Details
pKa values reported in this contribution were either taken from our previous work [11] or computed using Gaussian 16 Rev C.01. [54] Independent of the origin of the data, the M06‐2X functional [55] was used in combination with a triple‐ζ 6–311++G basis set with diffuse and polarization functions on all atoms and the SMD solvation model as implemented into Gaussian 16. [56] The ground state structures were considered to be converged if the lowest vibrational mode was larger than −100 . Following earlier work, pKa values were computed using the method described below and in references 11 and 40. The dissociation of formic acid (pKa in water: 3.77 [8] ) was used as reference reaction. Note that in principle also any other reference point could be used. However, owing to a method inherent error cancellation [11] this should not affect the relative stability between protons in different solvents. Kamlet‐Taft parameters for the fits were taken from experiments.[ 57 , 58 ] Solvation energies were computed by explicitly optimizing the structures both in vacuum and the implicit solvent. The test set of molecules was chosen such, that it spans a large range of pKa values for a diverse set of molecules and functional groups of compounds of chemical and pharmaceutical interest. Similarly, also the solvents were selected such that they comprise a set of diverse protic and aprotic polar and apolar media.
Computation of Acid Dissociation Constants
Acid dissociation constants were computed using our recently introduced procedure to compute proton solvation energies in any solvent using only a reference pKa in water.[ 11 , 40 ] The method relies on a thermodynamic cycle which expresses the acid dissociation as a series of a proton‐coupled electron transfer (PCET) oxidation step (reaction 1
| (1) |
and an electron transfer (ET) reduction reaction (reactio 2) in the solvent of interest (e. g. toluene).
| (2) |
Computing the electrochemical potential of the ET step requires knowledge of the (effective) absolute potential ( ) which connects the absolute reaction energy to the the standard hydrogen electrode (SHE). For the sake of improved error cancellation an effective absolute potential is computed for a given computational setup using equation 3: [59]
| (3) |
Here, n corresponds to the number of transferred electrons (n=1), F to the Faraday constant and G(H2), G(A−) and G(A−H) to the total Gibbs free energies of hydrogen, the reference acid and its corresponding base obtained from the computations performed assuming the solvent in which the experimental value has been measured in (typically water). ΔG(Dissociation) finally is the experimental Gibbs free energy computed from an experimental pKa in water. Taking advantage of the effective absolute potential, the Gibbs Free energy of the ET reduction step (ΔG(ET)) is then obtained through equation 4:
| (4) |
The details of the procedure are described in Ref. [59]. This method relies on the absolute potential in water. Thus, it will predict the potential versus the SHE in water, despite using the solvation model parameters of the non‐aqueous solvent of interest.
This is opposed to the redox potential of the PCET oxidation step (ΔG(PCET)) which is computed using the computational normal hydrogen electrode. [60] This method uses H2 in the gas phase as reference.
| (5) |
The term “RT ln([H+])” is obtained from the Nernst equation and corrects for the pH dependence of PCET steps. In the case of standard conditions (pH 0) it is 0. Since the solvent only enters through the chosen solvation model, PCET steps are predicted versus the SHE in the solvent of interest. Accordingly, the Born‐Haber cycle which connects the PCET and ET steps with the acid‐dissociation reaction (ΔG(Dissociation)) is no longer simply defined by the sum of the energetics of the electrochemical steps but instead needs to be corrected by a conversion factor to accout for the differences in the proton solvation energy in water and the solvent of interest (“SolvX”) and thus, puts both reaction onto the same reference scale (equation 6.
| (6) |
The difference between the reference solvent of the SHE can be exploited to compute the (effective) proton solvation energy in the solvent of interest (“SolvX”) via equations 7 and 8:
| (7) |
| (8) |
Here, G(A−H;SolvX) and G(A−;SolvX) correspond to the total Gibbs free energy of the reference acid from equation 3 in the considered solvent while is the conversion factor between different solvents. The obtained effective proton solvation energy can then be used to predict the pKa in the solvent of interest.
In contrast to other procedures which either rely on an experimental pKa in the solvent of interest[ 21 , 22 , 37 ] or knowledge of the exact structure of the solvent‐proton complex[ 23 , 24 , 33 , 34 , 61 , 62 , 63 ] only the protonated and unprotonated states of the reference acid in water and the non‐aqueous solvent need to be computed. This can easily be achieved using a standard implicit solvation model. The obtained relative stabilities using this procedure are robust with respect to different implicit solvation models and the choice of ab‐initio or DFT method.[ 11 , 40 ]
By combining the relative stability of the proton with the effective proton solvation energy using the above described computational setup, the pKa can be computed. Owing to the shortcomings of implicit solvation models, it is nevertheless still necessary to scale the obtained raw pKa values. For protic solvents, Equation 9 was found most appropriate when using the the above computational setup and formic acid as reference. [11]
| (9) |
pKa values in aprotic media were corrected using Equation 10., [11]
| (10) |
Note that the scaling relations can vary between different functional groups and solvents. [11] Considering, however, that the experimental data required to determine the scaling relations are often of questionable accuracy in non‐aqueous solvents [11] or even completely missing we opted for this general approach. Tests for solvents for which reasonably reliable experimental data were available showed that this ansatz is sufficiently accurate to at least reproduce semi‐quantitative trends between solvents. [11] An increased accuracy would require the use of explicit solvation models which do not suffer from the same shortcomings of the SMD model used in the present study. Using explicit solvation would, however, require extensive molecular dynamics simulations which are not affordable, owing to the size of non‐aqueous solvents and the number of solvents in the present study. Owing to the poor reliability of experimental data no exact error estimated for the presented pKa values can be provided. Nevertheless, experimental and computed pKa values typically differ by 1 to 3 pKa units but larger deviations are possible. This is, however, not necessarily a sign of the poor quality of our data. [11]
2. Results and Discussion
2.1. Acid Dissociation Constants in Non‐aqueous Solvents
General trends between the acid dissociation constants were extracted from a test set comprising 182 molecules (240 pKa values) in 21 solvents. This extensive data set contains carboxylic acids, alcohols, primary/secondary/tertiary amines, imines and CH acids. Additionally, also few thiols and mineral acids were included. The pKa values of these compounds were computed in a wide range of solvents which covers the full spectrum from highly polar (e. g. DMSO or formamide) to extremely nonpolar (e. g. cyclohexane or dimethylamine) protic and aprotic solvents.
The behavior of one representative compound for some of the most common functional groups in different solvents is summarized in Figure 1. For convenience the solvent properties, plotted at the x‐axis, are described by simply using the sum of the Kamlet‐Taft solvatochromic parameters α, β and . α and β correspond to the solvent's ability for hydrogen bond donation and acceptance while corresponds to the polarizability. Using this descriptor, aprotic apolar solvents such as cyclohexane or toluene are placed at the left in Figure 1 while protic polar solvents such as water or formamide are placed at the far right in Figure 1. Solvents displaying intermediate properties such as protic apolar solvents like acetic acid or polar aprotic media like acetonitrile can be found between these two extremes.
Figure 1.

Behavior of the computed acid dissociation constants of common acidic functional groups in common solvents. The solvent properties are described by an effective solvatochromic parameter computed from the experimental values[ 57 , 58 ] which corresponds to the sum over the 3 Kamlet‐Taft parameters α (hydrogen bond donation), β (hydrogen bond acceptance) and π*(polarizability). The corresponding acid dissociation sites are marked in red in the chemical structures.
Our data clearly indicate, that the trends in the pKa vary strongly between different classes of acids when moving from protic/polar solvents such as water to apolar/aprotic solvents like cyclohexane. Carboxylic acids are represented by Ibuprofen, which is typically used to treat weak to moderate pain. For Ibuprofen we predict a pKa of 5.8 in water which is in reasonable agreement with the experimentally obtained value of 4.5. [10] Upon moving towards less polar and aprotic solvents, the acid strength decreases significantly (Figure 1a). In isopropanol for example, which is still a rather polar/protic solvent, the pKa rises to 10.7. This is in good agreement with the experimentally observed increase to 11.8. [64] Even higher pKa values of 21.1 and 22.1 are observed for acetonitrile and DMSO. It is noteworthy, that the pKa values in these two solvents are almost identical. This is contrasted by earlier studies which suggested, that pKa values in DMSO should be significantly lower than those in acetonitrile.[ 25 , 26 , 27 , 32 ] In line with these trends, also protons in DMSO were predicted[ 21 , 22 , 24 , 33 , 34 , 35 , 36 , 37 , 38 , 39 ] to be equally or more stable than in water while our computations again indicated, that protons in both media should be approximately equally stable. [11] These results were confirmed by us through CCSD(T) computations and by using different DFT functionals.[ 11 , 40 ] Furthermore, they were also found to be stable with respect to the choice of implicit solvation model and its parametrization.[ 11 , 40 ] We are therefore reasonably confident, that our method is able to capture the trends between DMSO and acetonitrile correctly. Using statistical analysis the experimental pKa values in non‐aqueous solvents on the other hand were found to be of questionable quality. [11] In cyclohexane, which has the least ability for hydrogen bonding or dipole interactions [57] of all solvents considered in this study, the pKa increases even by 42.7 units to 48.5.
The observed behavior for carboxylic acids is not unexpected when considering, that it dissociates into two charged species, a carboxylate anion and a solvated proton. The computed relative solvation energies in different solvents for all involved species are summarized in Figure 2. Both the carboxylate anion and the solvated proton are well stabilized in water owing to its high polarizability and ability for hydrogen bonding (Figure 2a). Moving towards less polarizable solvents, which eventually also possess a reduced ability for hydrogen bonding, their relative solvation energies increase which corresponds to a decrease in their overall stability. The acid on the other hand is only to a minor degree affected by the change of solvent, i. e. the solvation energy remains almost constant independent of whether Ibuprofen is dissolved in water or cyclohexane. As a result of this, the relative pKa in less polar solvents, which is completely determined by the difference in the solvation energies ( ), increases.
Figure 2.

Dependence of the solvation energy of the acid, its corresponding base and the free proton for Ibuprofen (a) and the first dissociation step of Morphine (b) in relation to their solvatochromic parameters. The quality of the fits are shown in c) and d). The relative solvation energies are offset with respect to water.
Similar to carboxylic acids also the dissociation of alcohols results in two charged species, an alcoholate anion and a proton. It is therefore not surprising that an almost identical dependence of the pKa from the choice of solvent is observed (Figure 1b). This is exemplified for the second dissociation step of morphine. Morphine is used to treat strong pain and needs to be transported across the lipophilic blood‐brain barrier, which renders its acid‐base properties both in aqueous and non‐aqueous media of relevance.[ 65 , 66 ] According to our calculations and in agreement with experiment [8] Morphine possesses a pKa of approximately 9.8 in water. When dissolved in cyclohexane, the acid dissociation constant rises, identical to the carboxylic acids, by approximately 42 pKa units to 52. A qualitatively similar behavior is also observed for C−H acids.
The behavior of the alcohol and the carboxylic acid is contrasted by protonated ammonium and iminium ions. Considering for example aniline (primary amine), Propranolol (secondary amine), Morphine (tertiary amine) and Diazepam (imine) (Figure 1c to f) we find that the relative changes to the pKa are affected by the change to extremely apolar, aprotic solvents to a much lesser degree. For primary amines the pKa remains, with a shift of only 4 pKa units upon moving from water to cyclohexane, almost constant. For secondary and tertiary amines as well as imines the shift rises to roughly 10 pKa units. Similar shifts are also observed for all other considered non‐aqueous media. This strongly suggests, that the pKa is almost independent from the choice of solvent. Thus, similar minor changes in the acidity can also be expected under physiological conditions such as in the lipophilic blood‐brain barrier which needs to be crossed by Diazepam and Morphine. [66]
The significant difference in the behavior of the pKa of ammonium and iminium ions in different solvents compared to carboxylic acids, alcohols and CH acids can again be understood from the changes in the solvation energies of the acids and their corresponding base. Considering Morphine, which was taken as an example for a tertiary amine (Figure 1f), we find that the positively charged ammonium ion behaves qualitatively similar to the carboxylate anion, e. g. it is destabilized in cyclohexane by roughly 1.5 eV compared to water (Figure 2b). This is again not surprising when considering that the apolar, aprotic solvent is to a much lesser degree able to stabilize the charged molecule. Since the changes in the proton solvation energy and the difference in the solvation energies between the acid and its corresponding base (Figure 2d) possess opposite signs and an approximately equal magnitude no significant changes in the pKa of the compounds in cyclohexane and water are observed.
Note that the scatter observed in Figure 1 is mainly the result of the incompatibility between the effective solvatochromic parameter which simply corresponds to the sum of α, β and and the true relationship with the solvatochromic parameters. Indeed, using the exact expression to predict the difference in solvation energies between the acid and its corresponding base results in many cases in errors which are comparable to those found for carboxylic acids (Figure 2c and d). It must, however, be cautioned that the detailed relationship between the three parameters depends to some extend on the size of the dataset and in parts also on the fitting method which prohibits any more detailed interpretation of the results.
2.2. Exploring the Extreme: Trends in Cyclohexane
Equivalent trends are also found for the full data set, e. g. the pKa values of all carboxylic acids, alcohols and C−H acids are strongly affected by the choice of solvent while it changes only slightly for most ammonium and iminium cations. However, while the qualitative trends are very similar within a class of functional groups, significant differences in the relative pKa shift are apparent between different molecules. Taking for example alcohols, the relative pKa values in cyclohexane compared to water vary between 24 pKa units and 100 pKa units (Figure 3). Strong variations are also observed in other solvents. In line with this, the mean absolute error (MAE) associated with the predicted pKa shift using only the Kamlet‐Taft solvatochromic parameters is with 4.7 pKa units high. Owing to the presence of the very high bandwidth of relative pKa values, the standard deviation is with 7.8 pKa units even worse. A similarly poor performance of this oversimplified model is also observed for other functional groups (see SI). This strong scatter between the molecules can be rationalized from a detailed analysis of their origin.
Figure 3.

Comparison of the relative shift in the pKa between water and cyclohexane for the considered functional groups.
2.2.1. Carboxylic Acids
Let us start the discussion with the carboxylic acids. Here, we find in many cases only rather minor deviations (Figure 3), e. g. 17 of the 31 considered acids display a relative shift which is within 2 pKa units compared to what is found for Ibuprofen. More extreme deviations ( 10 pKa units) are only observed for the second deprotonation step of oxalic and phthalic acid, Bendamustine, Cephradine, L–DOPA and L‐Ornithine. Qualitatively similar trends are, with the exception of L–DOPA and L‐Ornithine also observed in all other solvents.
The dissociation of Bendamustine (reaction 11) and Cephradine (reaction 12) results in the formation of a zwitterion with a cationic ammonium or iminium species and an anionic carboxylate.

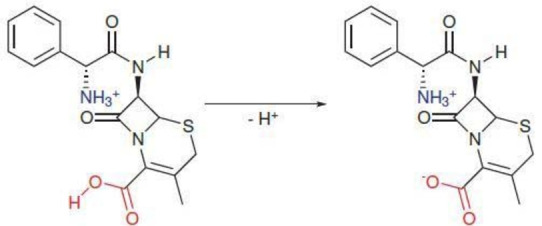
This likely allows for a charge compensation effect which in turn reduces the impact of the formation of the carboxylate group on the solvation energy. As a result of this, reduced positive pKa shifts of only 21 (Bendamustine) and 27 pKa units (Cephradine) are observed. The slightly larger impact on Bendamustine might be a result of the fact, that the cationic group is somewhat closer to the R‐COOH in this molecule compared to Cephradine but a larger data set containing more versatile zwitterions would be required to confirm this hypothesis. Even more extreme deviations are found for L–DOPA and L‐Ornithine, which behave similar to ammonium and iminium ions. It is also noteworthy, that this effect is only present for toluene and cyclohexane which comprise the two most apolar, aprotic solvents. The origin of this anomalous behavior can be traced back to the structure of the two molecules. Here, the ammonium group is placed in α‐position to the carboxylic acid which enables a proton transfer from the positively charged functional group to the carboxylate. This in turn quenches the negative charge and allows for the formation of a more favorable charge neutral system for L–DOPA (reaction 13.

For L‐Ornithine on the other hand the full deprotonation sequence is reversed with the protons at the ammonium groups leaving first followed by the deprotonation of the carboxylic acid (reaction 14). This again minimizes the charge of the system at each deprotonation step.

Naturally a similar inversion of the deprotonation sequence may also be observed in reality at other molecules which display both a carboxylic acid group and positively charged ammonium or iminium species.
Exchanging these data points with the respective formal dissociation of the ammonium ions which in reality correspond to a dissociation of a carboxylic acid, these compounds display shifts of approximately 46 pKa units which is in agreement with the other carboxylic acids. A similar proton transfer is likely also thermodynamically favorable for the other zwitterions but may be hindered kinetically in solvents which lack free protons. For solvents where this proton shift is absent, the carboxylic groups behave similar to the other zwitterions included in this data set. It is noteworthy, that the shift is even less positive than that observed for the other zwitterions which would support our hypothesis, that the proximity between the charged groups is decisive for the magnitude of the effect.
In contrast to the above cases, an increase of the relative pKa shift is observed for the second deprotonation step of oxalic and phthalic acid (reactions 15 and 16.


It is noteworthy, that the first deprotonation steps roughly behave similar to ibuprofen which indicates that these molecules themselves do not possess any special structural features which could explain these differences. Instead, the increase in the relative pKa shift coincides with the presence of a negatively charged functional group from the first deprotonation step. Opposite to the presence of positively charged ammonium and iminium groups, which allow for charge compensation and the formation of a net charge neutral system, this additional negative charge results in a further destabilization of the alcoholate in apolar/aprotic solvents such as cyclohexane.
2.2.2. Alcohols
More significant scatter is observed for the alcohols. Among the 53 data points only 17 display a relative pKa shift in cyclohexane which is within 5 pKa units of that observed for Ibuprofen. All other compounds are spread between a relative pKa shift of 24 pKa units and 100 pKa units. The rather large spread can partly be explained by the much stronger sensitivity to changes in the chemical environment which allows for the delocalization of the charge in the R−O− group. For the more extreme examples which display shifts below 35 pKa units, this is typically complemented by the presence of one or more electron withdrawing groups such as cyano or nitro (R−NO2) groups.
The trends observed in the relative pKa shifts between water cyclohexane are also mirrored by the relative pKa values between the molecules in water which varies between that of very strong acids and very strong bases. Taking for example phenol (reaction 17), which has a computed pKa of 10 in water, we observe an increase by approximately 42 pKa units to 52 in cyclohexane.

Similar increases are also found for other compounds such as Morphine (reaction 18) whose alcoholic functional group possesses an almost identical pKa in water (computed pKa: 9.8.

Moving towards more acidic alcohols, the shift relative to water drops significantly. The most extreme example in our data set is pentacyanophenol (reaction 19) which has a computed pKa of 0 in water.

For this compound the pKa increases by only 24 pKa units. This decrease in the relative shift coincides with the presence of a delocalized π electron system in the phenol ring and 5 strongly electron withdrawing cyano groups as substituents which is also responsible for the more acidic pKa in water. Comparable effects are also observed for picric acid or dinoseb where the acidic OH group is directly attached to an electron‐poor aromatic π electron system.
The presence of electron donating groups at the ring on the other hand pushes additional electron density to the negatively charged phenolate group which in turn results in a higher pKa in water. In non‐aqueous solvents such as cyclohexane, this translates into a more positive shift of the relative pKa with respect to water. Similarly, also the absence of a conjugated π electron system results in a higher pKa in water and accordingly also in an increased shift of the relative pKa in cyclohexane compared to water. Examples of this are the second deprotonation steps of Propranolol (reaction 20) and Scopolamine (reaction 21.


Both compounds lack a conjugated π electron system close to the alcoholic group and are therefore unable to delocalize the negative charge of the alcoholate anion which renders them strong bases with pKa values of roughly 15 in water. In line with this, the relative shift of the pKa in cyclohexane versus water increases from 42 for phenol to approximately 50 for both compounds. The most extreme example is finally the deprotonation of water to hydroxide. Despite a pKa of 14 in water, which is slightly lower than those of the other examples of non‐phenolic alcohols, it displays an even more positive shift of 57 pKa units in cyclohexane with respect to water. This extreme behavior is not completely unexpected when considering that the hydroxide ion displays a significantly higher negative Mulliken charge of roughly −1.26 electrons at the oxygen in water which is only slightly reduced to −1.14 in cyclohexane. The alcoholate ions of Propranolol and Scopolamine on the other hand posses only Mulliken charges of −0.53 and −0.58 electrons at the oxygen adjacent to the acidic proton and are therefore somewhat less affected by highly apolar solvents. The importance of the molecules’ ability to delocalize the negative charge at the oxygen anion for the relative shift has also been reported in previous work for other solvents. [28]
Identical to the carboxylic acids, compounds which display shifts of 55 or more pKa units in cyclohexane compared to water typically possess corresponding bases with two or more negatively charged functional groups. An example of such a system is 2,4‐Dihydroxybenzoicacid (reaction 22) which displays an increase of 60 pKa units for the second proton resulting in the formation of an alcoholate group in para position to the anionic carboxylate group.

Interestingly, the influence of the negatively charged functional group decreases with its increased distance to the acidic proton. This can for example be seen for the deprotonation of the alcoholic group in Salicylic acid, where the negatively charged carboxylate is in ortho position (reaction 23.

Accordingly, its effect on the alcohol is increased as shown by the increased relative shift in the pKa to 73 pKa units. This increased shift again correlates with the increased computed pKa of the phenolic group in water which increases from 9.2 for the second deprotonation step in 2,4‐Dihydroxybenzoicacid to 12.5 for Salicylic acid. Moving towards bases with even higher negative charges such as the third deprotonation step of 2,4‐Dihydroxybenzoicacid, the relative shift of the pKa increases even further. For this final deprotonation step a relative shift of 89 pKa units compared to water is found. A similarly high shift is also observed for Dimercaprol where 2 thiol groups are deprotonated prior to the alcohol. Here, an increase of the pKa of the alcoholate group by 99 units compared to water is found. The increased shift is in line with the established trends in multi‐protonic acids which indicate that each subsequent deprotonation step has a higher pKa.
2.2.3. Ammonium and Iminium Acids
The trends observed for the individual ammonium and iminium cations (Figure 1) are also found for most other compounds of this class, e. g. the shift in the pKa from water to cyclohexane is typically of the order of 5 to 10 pKa units. All acids which follow these trends display only a single positively charged functional group. If a second positively charged group is present, the shift becomes negative by approximately −10 pKa units which indicates that these systems are stronger acids in cyclohexane compared to water provided they could be dissolved in this highly apolar and aprotic solvent. Even more extreme negative shifts are observed if more than 2 positively charged groups are present in the acid. One of the most extreme negative shifts is for example observed for Chloroquine's first deprotonation step (reaction 24) which possesses in total three positively charged ammonium or iminium groups and displays a negative shift of −32 pKa units in cyclohexane compared to water.

This increased shift is likely again a result of the interaction between the positively charged functional groups which render the acid less stable in aprotic/apolar solvents. In line with this hypothesis we find, that such an interaction is only possible if these groups are sufficiently close. The opposite trend is observed for zwitterionic ammonium and iminium compounds and neutral amines which react further to negatively charged amid anions. In case of the former we observe a shift which is comparable to that observed in the case of the formation of zwitterionic bases, e. g. the pKa has a moderate positive shift of the order of 20 pKa units. The latter systems on the other hand behave similar to carboxylic acids and alcohols as indicated by a shift of 40 pKa units for the first deprotonation step forming a single negatively charged group and more than 50 pKa units for the second step.
2.2.4. C‐H Acids
The last class of interest are C−H acids. In contrast to the previous classes of acids we observe only a rather minor scattering between the data points, e. g. the relative pKa shifts from water to cyclohexane varies by only 8 pKa units. This is not surprising when considering that the included acids are rather homogeneous with respect to the chemical environment. In practice this means that our data set only includes C−H acids where the negative charge is strongly stabilized through a π electron system and electron withdrawing groups. Furthermore, no zwitterionic molecules or compounds with multiple charged groups are present. As an additional result of the good stabilization of the negative charge in the corresponding base, pKa values in water are, in comparison to the common acidity of C−H groups, with pKa values between −1 and 10 already rather low. Following the above discussion for the alcohols, this already indicates, that the relative pKa shifts will be at the lower end of the spectrum that could be expected for neutral acids. This is indeed observed for all considered compounds, e. g. the relative shift is of the order of 30 to 35 pKa units.
2.3. Global Perspective
Building on the detailed analysis in cyclohexane, a universal picture of the behavior of different acids in non‐aqueous solvents can be developed. Our data clearly show that the relative shift of the pKa in different solvents mostly depends on the presence of additional anionic or cationic groups and the charge of the acidic functional group. A similar dependence has also been suggested by Rossini et al. [48] Other factors like the exact chemical environment or the nature of the functional group have a much smaller impact. In the absence of any other charged functional groups neutral acids display a shift of 40 pKa units in cyclohexane (Figure 4). Naturally the impact is smaller for more polar/protic solvents and also decreases with stabilizing factors such as conjugated π electron systems and electron withdrawing groups. Equivalent shifts are also found for the thiol and the mineral acids which are present in our data set but were neglected during the previous analysis. In line with our above analysis we again find rather minor shifts for triflic acid and fluorosulfonic acid whose corresponding bases are both stabilized by strongly electron withdrawing groups. If one or more anionic groups are already present in the acid, the relative shift increases by 15 pKa units per anionic group. In the presence of a cationic group, which corresponds to the formation of a zwitterionic base, the shift decreases by the same amount (Figure 4). A shift similar to that associated with the formation of a zwitterionic base is also observed for the deprotonation of a cationic functional group in a zwitterionic acid (Figure 4). In the absence of an anionic group, the relative shift decreases additionally by 10 to 20 pKa units to roughly 5 to 10 pKa units. A similar decrease is also approximately observed for each additional cationic group in the molecule (Figure 4).
Figure 4.

Schematic summary of the relative shift of the pKa in cyclohexane compared to water.
The trends observed for cyclohexane can be generalized to other solvents through an empirical model. For the sake of simplicity we only include the absolute shift in the absence of any other charged groups and the electrostatic interactions, which we identified as the main factor for determining the relative shift of the pKa with respect to water. These contributions are scaled by the solvatochromic parameters which describe the solvents’ properties. The fitting parameters are obtained from a LAD fit using the solvatochromic parameters reported in reference [57] and our computed pKa values. We additionally divided all acids into 2 groups based on the charge of the acidic functional group. Group I acids possess a cationic acidic group while group II acids are characterized by a neutral acidic group. This division is necessary in order to properly describe the behavior of zwitterionic acids and bases. Other contributions such as the detailed chemical structure into which the acidic group is embedded in are neglected. Similarly, also the influence of the spatial distance between charged groups is not taken into account. Including these factors would require a significantly larger and more diverse data set and could potentially be achieved using machine learning or related algorithms. Using our simple empirical relationship we obtain the equations 25 (group I acids) and 26 (group II acids).
| (25) |
| (26) |
Here, corresponds to the effective charge of the acid. In most cases the effective charge corresponds to the total charge of the molecule but deviations are possible if some of the innocent charged groups are unable to interact with the acidic group or its corresponding base owing to the spatial distance between them or other inhibiting factors.
The validity of the fits is tested through comparison of predicted and explicitly computed pKa values in different solvents (Figure 5). Considering the simplicity of the model we observe in many cases a surprisingly good agreement between the predictions obtained from DFT and the model summarized in Equations 25 and 26 (Figure 5). For non‐zwitterionic group I acids the predicted pKa values are within a mean absolute error (MAE) of 2.5 pKa units (σ=3.5 pKa units). The error decreases even to a MAE of 1.9 pKa units (σ=2.5 pKa units) for zwitterionic group I acids but is increased to a very high MAE of 3.9 pKa units (σ=5.9 pKa units) for group II acids. The rather high error bars observed for the latter class of compounds reflects the high diversity of pKa values for alcohols and neutral imines. This is especially visible in the very high standard deviations which points at the existence of significant outliers which are also apparent from visually evaluating the agreement between predictions and computations (Figure 5). These deviations are a result of the direct interactions with conjugated π electron systems and electron donating or withdrawing functional groups. In line with this, we do find a rather good agreement for cationic acids which typically are unable to stabilize the charge through interaction with a π electron system. Naturally, these effects are not captured by our simple model which only relies on the solvatochromic parameters which describe the solvent properties and the total charge of the molecule. Overall, this simple model nevertheless provides at least a qualitative description of the expected trends which often agree surprisingly well with the predictions obtained from DFT modeling. However, the deviations of the model increase when moving towards more extreme pKa values. Thus, it is clear that an improved machine learning model which also includes structural information would be needed to achieve sufficiently good accuracy for most applications.
Figure 5.

Comparison of computed and predicted pKa shifts. The predicted pKa values are computed using equations 25 and 26. a) Group I acids; b) group II acids.
Nevertheless, the qualitative trends may be used to obtain some global understanding on the factors which affect the pKa shifts the most. Evaluating the prefactors to the solvatochromic parameters in equations 25 and 26, we see that both classes of acids behave very differently. According to our fit, the relative pKa shift is, in the absence of any additional charged groups, almost exclusively affected by the hydrogen bond donation ability (α) which results in a decrease. As a result of this, all aprotic solvents behave rather similar while a significant stabilization resulting in a reduced pKa shift is only observed for protic solvents. However, in the presence of charged groups, this picture changes. Here, the the solvents ability for hydrogen bond acceptance (β) and its polarizability are most important for minimizing the influence of charged functional groups while the hydrogen bond donation is less relevant. This is not surprising when considering that the former contributions allow the solvent to buffer the influence of additional charges and thus, reduce their effect on the cationic acid.
Neutral group II acids on the other hand are affected equally by the solvents polarizability and its ability for hydrogen bond acceptance and donation. As a result of this, the relative pKa shift continuously increases with a decrease in the hydrogen bonding ability of the solvent and its polarizability. Similarly also the effect of charged groups is countered equally by the polarizability and the hydrogen bond donation and acceptance properties of the solvent. Thus, the additional shift in the presence of additional charged groups increases again upon moving towards more aprotic apolar solvents. It must, however, be cautioned that the pKa shifts also depend on structural details of the molecule such as the closeness between the charged groups or the ability for delocalizing the charges which renders the fit not necessarily fully reliable.
3. Conclusions
In summary we have shown global trends between the pKa values of more than 180 compounds of general and pharmacological interest in 21 solvents. Our computations indicate, that the influence of the solvent on the pKa is mostly determined by the charge of the functional group and the presence of other charged groups in the molecule. The pKa of neutral acids such as alcohols or carboxylic acids are strongly affected by the solvents’ ability to stabilize the involved species through dipole interactions or hydrogen bonding whereas this effect cancels for cationic acids like ammonium or iminium ions. Structural details such as the possibility to delocalize through a conjugated π electron system or the presence of electron donating or withdrawing groups are of relevance but typically have a much lower influence. Overall, the magnitude of the relative shift between water and non‐aqueous solvents resembles the trends between pKa values of the different compounds in water.
Based on our results we developed a simple empirical model to estimate the pKa of any acid in a freely chosen solvent based on its pKa in water and the solvatochromic parameters. This allows for easy prediction of pKa values in all solvents with fair accuracy. Further improvements of the model to also include more subtle contributions such as mesomeric and inductive effects or the distance between charged groups will be needed to achieve chemical accuracy.
Conflict of interest
The authors declare no conflict of interest.
4.
Supporting information
As a service to our authors and readers, this journal provides supporting information supplied by the authors. Such materials are peer reviewed and may be re‐organized for online delivery, but are not copy‐edited or typeset. Technical support issues arising from supporting information (other than missing files) should be addressed to the authors.
Supporting Information
Acknowledgements
Calculations were performed at the Chalmers Centre for Computational Science and Engineering (C3SE) and the Finnish IT centre for science (CSC). M.B. and K.L. acknowledge financial support from the Jane and Aatos Erkko Foundation through the “Renewable energy storage to high value chemicals” project. M.B. also acknowledges support from the Dr. Barbara‐Mez‐Starck foundation. Open Access funding enabled and organized by Projekt DEAL.
M. Busch, E. Ahlberg, K. Laasonen, Chem. Eur. J. 2022, 28, e202201667.
Data Availability Statement
The data that support the findings of this study are available in the supplementary material of this article.
References
- 1.Apicius, Apicii librorum X qui dicuntur De re coquinaria quae extant, Teubner [Republished as Project Gutenberg Ebook 16439], 1922 (republished).
- 2.G. Plinius Secundus Maior, Naturalis Historia [The Natural History of Pliny], Taylor and Francis [Republished as Project Gutenberg EBook], Reprint and Translated edn., 1855, vol. Liber II.
- 3.V. Karpenko and J. Norris, Chem. Listy, 2002, 96, 997–1005.
- 4.E. Darmstaedter, in Die Alchemie des Geber. Übers. und erklärt von Ernst Darmstaedter, Springer, Berlin, 1922, ch. Liber de inventione veritatis - Chapter 23, pp. 113–114.
- 5.A. F. Hollemannn and N. Wiberg, Anorganische Chemie, Walter de Gruyter, Berlin, 102nd edn., 2007.
- 6.J. N. Brønsted, Recl. Trav. Chim. Pays-Bas, 1923, 42, 718–728.
- 7.D. Marx, M. Tuckerman, J. Hutter and M. Parrinello, Nature, 1999, 397, 601–604.
- 8. CRC Handbook of Chemistry and Physics, ed. D. R. Lide, CRC Press, Boca Raton, 85th edn., 2004.
- 9.E. Serjeant and B. Dempsey, Ionisation Constants of Organic Acids in Aqueous Solution, ergamon Press, Inc., New York, 1979.
- 10.H. Wan, A. Holmen, M. Någård and W. Lindberg, J. Chromatogr. A, 2002, 979, 369–377. [DOI] [PubMed]
- 11.M. Busch, E. Ahlberg, E. Ahlberg and K. Laasonen, ACS Omega, 2022, 7, 17369–17383. [DOI] [PMC free article] [PubMed]
- 12.J. Ho and M. Coote, Theor. Chem. Acc., 2010, 125, 3–21.
- 13.J. Ho, Aust. J. Chem., 2014, 67, 1441–1460.
- 14.J. Muckerman, J. Skone, M. Ning and Y. Wasada-Tsutsui, Biochim. Biophys. Acta, 2013, 1827, 882–891. [DOI] [PubMed]
- 15.R. Roszak, W. Beker, K. Molga and B. Grzybowski, J. Am. Chem. Soc., 2019, 141, 17142–17149. [DOI] [PubMed]
- 16.R. Casasnovas, J. Ortega-Castro, J. Frau, J. Donoso and. Munoz, Int. J. Quantum Chem., 2014, 114, 1350–1363.
- 17.K. Alongi and G. Shields, Annu. Rep. Comput. Chem., 2010, 6, 113–138.
- 18.J. Jensen, C. Swain and L. Olsen, J. Phys. Chem. A, 2017, 121, 699–707. [DOI] [PubMed]
- 19.E. Paenurk, K. Kaupmees, D. Himmel, A. Kütt, I. Kaljurand, I. Koppel, I. Krossing and I. Leito, Chem. Sci., 2017, 8, 6964–6973. [DOI] [PMC free article] [PubMed]
- 20.C. Lee, H. Son and S. Park, Phys. Chem. Chem. Phys., 2015, 17, 17557–17561. [DOI] [PubMed]
- 21.E. Rossini and E. Knapp, J. Comput. Chem., 2016, 37, 1082–1091. [DOI] [PubMed]
- 22.E. Rossini and E. Knapp, J. Comput. Chem., 2016, 37, 2163–2164. [DOI] [PubMed]
- 23.A. Malloum and J. Conradie, J. Mol. Liq., 2021, 335, 116032.
- 24.A. Malloum, J. Fifen and J. Conradie, J. Mol. Liq., 2021, 322, 114919.
- 25. Internet Bond-energy Databank (pKa and BDE)–iBonD, 1–12 | 11 http://ibond.nankai.edu.cn, http://ibond.nankai. edu..n.
- 26.A. Kütt, S. Selberg, I. Kaljurand, S. Tshepelevitsh, A. Heering, A. Darnell, K. Kaupmees, M. Piirsalu and I. Leito, Tetrahedron Lett., 2018, 59, 3738–3748.
- 27.A. Kütt, I. Leito, I. Kaljurand, L. Sooväli, V. Vlasov, L. Yagupolskii and I. Koppel, J. Org. Chem., 2006, 71, 2829–2838. [DOI] [PubMed]
- 28.E. Raamat, K. Kaupmees, G. Ovsjannikov, A. Trummal, A. Kütt, J. Saame, I. Koppel, I. Kaljurand, L. Lipping, T. Rodima, V. Pihl, I. Koppel and I. Leito, J. Phys. Org. Chem., 2013, 26, 162–170.
- 29.T. Rodima, I. Kaljurand, A. Pihl, V. Mäemets, I. Leito and I. Koppel, J. Org. Chem., 2002, 67, 1873–1881. [DOI] [PubMed]
- 30.F. Bordwell, Acc. Chem. Res., 1988, 21, 456–463.
- 31.R. Taft and F. Bordwell, Acc. Chem. Res., 1988, 21, 463–469.
- 32.S. Tshepelevitsh, A. Kütt, M. Lökov, I. Kaljurand, J. Saame, A. Heering, P. Plieger, R. Vianello and I. Leito, Eur. J. Org. Chem., 2019, 2019, 6735–6748.
- 33.Z. Markovic, J. Tosovic, D. Milenkovi and S. Markovic, Comput. Theor. Chem., 2016, 1077, 11–17.
- 34.D. Himmel, S. Goll, I. Leito and I. Krossing, Chem. Eur. J., 2011, 17, 5808–5826. [DOI] [PubMed]
- 35.Y. Fu, L. Liu, R. Li, R. Liu and Q. Guo, J. Am. Chem. Soc., 2004, 126, 814–822. [DOI] [PubMed]
- 36.E. Westphal and J. Pliego, J. Chem. Phys., 2005, 123, 074508. [DOI] [PubMed]
- 37.C. Kelly, C. Cramer and D. Truhlar, J. Phys. Chem. B, 2007, 111, 408–422. [DOI] [PMC free article] [PubMed]
- 38.W. Fawcett, Langmuir, 2008, 24, 9868–9875. [DOI] [PubMed]
- 39.C. Kalidas, G. Hefter and Y. Marcus, Chem. Rev., 2000, 100, 819–852. [DOI] [PubMed]
- 40.M. Busch, E. Ahlberg and K. Laasonen, Phys. Chem. Chem. Phys., 2021, 23, 11727–11737. [DOI] [PubMed]
- 41.C. Xiao, A. Weremfo, C. Wan and C. Zhao, Electroanalysis, 2014, 26, 596–601.
- 42.B. Jensen and V. Parker, J. Chem. Soc., Chem. Commun., 1974, 367–368.
- 43.X. Zhu, C. Wang and H. Liang, J. Org. Chem., 2010, 75, 7240–7257. [DOI] [PubMed]
- 44.A. Magill, K. Cavell and B. Yates, J. Am. Chem. Soc., 2004, 126, 8717–8724. [DOI] [PubMed]
- 45.Z. Wang, Y. Zheng, Y. Zheng, X. Xue and P. Ji, J. Phys. Chem. A, 2018, 122, 5750–5755. [DOI] [PubMed]
- 46.C. Yang, X. Xue, J. Jin, X. Li and J. Cheng, J. Org. Chem., 2013, 78, 7076–7085. [DOI] [PubMed]
- 47.E. Rossini, R. Netz and E. Knapp, J. Chem. Theory Comput., 2016, 12, 3360–3369. [DOI] [PubMed]
- 48.E. Rossini, A. Bochevarov and E. Knapp, ACS Omega, 2018, 3, 1653–1662. [DOI] [PMC free article] [PubMed]
- 49.S. Trasatti, Pure & Appl Chem., 1986, 58, 955–966.
- 50.B. Case and R. Parsons, Trans. Faraday Soc., 1967, 63, 1224–1239.
- 51.F. Kenrick, Z. Phys. Chem., 1896, 19 U, 625–656.
- 52.A. Sakti, Y. Nishimura and H. Nakai, J. Chem. Theory Comput., 2018, 14, 351–356. [DOI] [PubMed]
- 53.J. Cheng, X. Liu, J. Van de Vondele, M. Sulpizi and M. Sprik, Acc. Chem. Res., 2014, 47, 3522–3529. [DOI] [PubMed]
- 54.M. J. Frisch, G. W. Trucks, H. B. Schlegel, G. E. Scuseria, M. A. Robb, J. R. Cheeseman, G. Scalmani, V. Barone, G. A. Peters- son, H. Nakatsuji, X. Li, M. Caricato, A. V. Marenich, J. Bloino, B. G. Janesko, R. Gomperts, B. Mennucci, H. P. Hratchian, J. V. Ortiz, A. F. Izmaylov, J. L. Sonnenberg, D. Williams- Young, F. Ding, F. Lipparini, F. Egidi, J. Goings, B. Peng, A. Petrone, T. Henderson, D. Ranasinghe, V. G. Zakrzewski, J. Gao, N. Rega, G. Zheng, W. Liang, M. Hada, M. Ehara, K. Toyota, R. Fukuda, J. Hasegawa, M. Ishida, T. Nakajima, Y. Honda, O. Kitao, H. Nakai, T. Vreven, K. Throssell, J. A. Montgomery, Jr., J. E. Peralta, F. Ogliaro, M. J. Bearpark, J. J. Heyd, E. N. Brothers, K. N. Kudin, V. N. Staroverov, T. A. Keith, R. Kobayashi, J. Normand, K. Raghavachari, A. P. Ren- dell, J. C. Burant, S. S. Iyengar, J. Tomasi, M. Cossi, J. M. Millam, M. Klene, C. Adamo, R. Cammi, J. W. Ochterski, R. L. Martin, K. Morokuma, O. Farkas, J. B. Foresman and D. J. Fox, Gaussian 16 Revision B.01, 2016, Gaussian Inc. Wallingford CT.
- 55.Y. Zhao and D. Truhlar, Theor. Chem. Acc., 2008, 120, 215–241.
- 56.A. Marenich, C. Cramer and D. Truhlar, J. Phys. Chem. B, 2009, 113, 6378–6396. [DOI] [PubMed]
- 57.Y. Marcus, J. Solution Chem., 1991, 20, 929–944.
- 58.P. Jessop, D. Jessop, D. Fu and L. Phan, Green Chem., 2012, 14, 1245–1259.
- 59.M. Busch, K. Laasonen and E. Ahlberg, Phys. Chem. Chem. Phys., 2020, 22, 25833–25840. [DOI] [PubMed]
- 60.J. K. Nørskov„ J. Rossmeisl, A. Logadottir, L. Lindqvist, J. R. Kitchin, T. Bligaard and H. Jónsson, J. Phys. Chem. B, 2004, 108, 17886–17892.
- 61.S. Hwang and D. Chung, Bull. Korean Chem. Soc., 2005, 26, 589–593.
- 62.A. Malloum, J. Fifen and J. Conradie, Phys. Chem. Chem. Phys., 2018, 20, 29184–29206. [DOI] [PubMed]
- 63.N. Carvalho and J. Pliego, Phys. Chem. Chem. Phys., 2015, 17, 26745–26755. [DOI] [PubMed]
- 64.C. Ràfols, M. Rosés and E. Bosch, Anal. Chim. Acta, 1997, 350, 249–255.
- 65.S. Harilal, J. Jose, D. G. T. Parambi, R. Kumar, M. K. Unnikr- ishnan, M. S. Uddin, G. E. Mathew, R. Pratap, A. Marathakam and B. Mathew, Brain Res. Bull., 2020, 160, 121–140. [DOI] [PubMed]
- 66.M. Neal, Medicinal Pharmacology, Wiley-Blackwell, Oxford, 7th edn., 2012.
Associated Data
This section collects any data citations, data availability statements, or supplementary materials included in this article.
Supplementary Materials
As a service to our authors and readers, this journal provides supporting information supplied by the authors. Such materials are peer reviewed and may be re‐organized for online delivery, but are not copy‐edited or typeset. Technical support issues arising from supporting information (other than missing files) should be addressed to the authors.
Supporting Information
Data Availability Statement
The data that support the findings of this study are available in the supplementary material of this article.