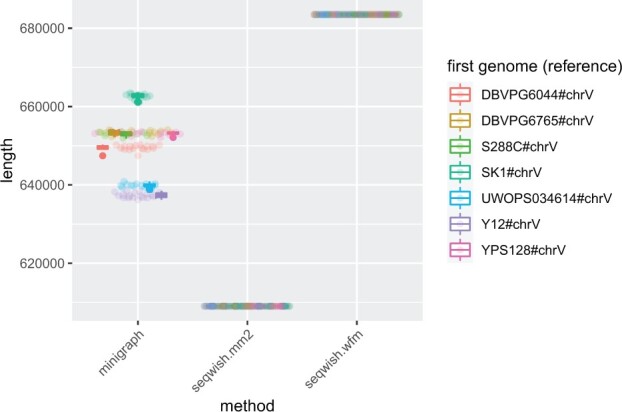
Fig. 3.

Base-pair lengths of graphs built from 100 permutations of yeast chrV. Each point corresponds to the length of a graph built from a specific permutation and the given method. We color each point by the first genome in the order (the ‘reference’ in minigraph). A boxplot per first genome group provides the mean and the first and third quartile intervals for each reference grouping
