

Abstract
Despite advances in immunotherapy for the treatment of cancers, not all patients can benefit from programmed cell death ligand 1 (PD-L1) immune checkpoint blockade therapy. Anti-PD-L1 therapeutic effects reportedly correlate with the PD-L1 expression level; hence, accurate detection of PD-L1 expression can guide immunotherapy to achieve better therapeutic effects. Therefore, based on the high affinity antibody Nb109, a new site-specifically radiolabeled tracer, 68Ga-NODA-cysteine, aspartic acid, and valine (CDV)-Nb109, was designed and synthesized to accurately monitor PD-L1 expression. The tracer 68Ga-NODA-CDV-Nb109 was obtained using a site-specific conjugation strategy with a radiochemical yield of about 95% and radiochemical purity of 97%. It showed high affinity for PD-L1 with a dissociation constant of 12.34 ± 1.65 nM. Both the cell uptake assay and positron emission tomography (PET) imaging revealed higher tracer uptake in PD-L1-positive A375-hPD-L1 and U87 tumor cells than in PD-L1-negative A375 tumor cells. Meanwhile, dynamic PET imaging of a NCI-H1299 xenograft indicated that doxorubicin could upregulate PD-L1 expression, allowing timely interventional immunotherapy. In conclusion, this tracer could sensitively and dynamically monitor changes in PD-L1 expression levels in different cancers and help screen patients who can benefit from anti-PD-L1 immunotherapy.
Keywords: Single-domain antibody, Site-specific labeling, Immuno-PET imaging, PD-L1
Graphical abstract
Highlights
-
•
Development of a radiolabeled site-specific single-domain antibody PET probe.
-
•
High affinity to PD-L1 in vitro and in vivo.
-
•
This tracer can noninvasively report PD-L1 expression in different tumors.
-
•
Changes in PD-L1 expression induced by chemotherapy can be sensitively detected.
1. Introduction
Immune checkpoint blockade therapy provokes an antitumor immune response to eradicate tumors and has shown promise in cancer therapy [1,2]. Programmed cell death-ligand 1 (PD-L1) is a typical checkpoint for the immune system, naturally expressed in a variety of cancer cells [3,4]. Several studies have indicated that the interaction of PD-L1 with programmed cell death protein 1 (PD-1) results in tumor immune escape, consequently promoting tumor development and metastasis. Inhibiting these interactions can reactivate the toxic effect of T-cells and inhibit tumor proliferation [[5], [6], [7]]. However, clinical research showed that only a small group of patients can benefit from anti-PD-L1 inhibitors; the overall response rate is <30% [[8], [9], [10]]. Various studies have demonstrated a certain link between PD-L1 expression and the efficacy of immune checkpoint medication [[11], [12], [13]]. On the whole, patients with high PD-L1 expression showed a higher objective response rate than those with low PD-L1 expression after receiving anti-PD-L1 therapy. Therefore, precisely determining PD-L1 expression has become essential for enhancing the response rate to immunotherapy [14].
Currently, PD-L1 expression is usually detected through immunohistochemistry (IHC), and is a generally accepted predictor of treatment response to immunotherapy. Nevertheless, IHC is an invasive test that only tests PD-L1 expression in the local tumor at a specific time [15]. Due to tumor spatial and temporal heterogeneity, it is difficult to track slight variations in PD-L1 expression throughout the entire therapy course using IHC [16,17]. In addition, the occurrence and development of PD-L1 expression in malignancies is a complex process, which may be related to therapeutic interventions, such as radiotherapy, chemotherapy, and interferon-γ. Therefore, it is necessary to develop molecular imaging techniques that can comprehensively and precisely detect PD-L1 expression [18,19]. Positron emission tomography (PET) imaging can monitor PD-L1 expression in the whole body non-invasively and quantitatively [20], and can be used to effectively select patients suitable for immunotherapy, providing meaningful guidance for developing a treatment strategy [21].
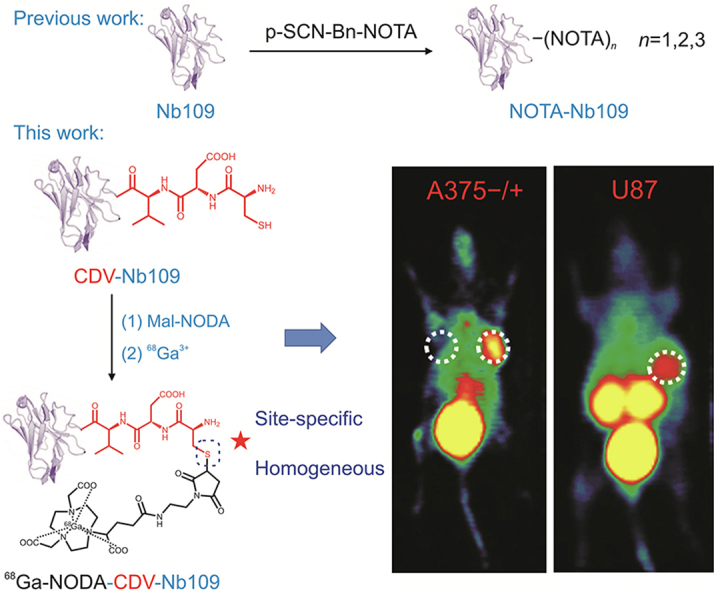
In recent years, research on PD-L1 targeted tracers has achieved positive results [22]. Several radionuclide-labeled monoclonal antibodies with high affinity for PD-L1 have been reported and successfully applied to monitor PD-L1 expression in lung cancer in real time [23]. Furthermore, a novel tracer 89Zr-C4 based on a monoclonal antibody has been developed to sensitively detect PD-L1 expression change in malignancies caused by standard chemotherapy (doxorubicin (DOX) and paclitaxel) in real time, and could provide guidance for clinical immunotherapy [24,25]. However, the antibody-based tracer needs to be labeled with a radioisotope with a long physical half-life (e.g., 64Cu and 89Zr). To obtain high contrast images, these antibody-based tracers would require a long circulation period, because of their slow elimination from the blood and normal organs, and might miss the optimal treatment time, limiting their clinical applications [26,27]. Therefore, it is necessary to develop tracers that can be quickly cleared from non-target tissues to achieve fast visualization of PD-L1 dynamic expression. Over the last decade, a variety of small-size tracers, such as the peptide-based tracer 68Ga-WL12, have been developed and successfully applied to detect PD-L1 expression in various malignancies [28]. Compared with the peptide, however, the single-domain antibody has a higher affinity for PD-L1. The tracer 68Ga-NOTA-Nb109, based on the single-domain antibody Nb109 previously developed by our group, could quickly identify PD-L1-positive tumors; the clear tumor contour persisted for a long time [29]. Nonetheless, since the Nb109 framework contains three lysine units, the conjugation between the metal-chelator and the antibody cannot be controlled during preparation. Therefore, the radiotracer precursor structure was heterogeneous: a mixture of single- and double-NOTA coupled with nanobody [29]. With the development of antibody-based cancer treatment methods, increasing attention has been paid to alternative conjugation techniques, such as cysteine–maleimide site-specific strategy [30,31]. Numerous studies on tracers with cysteine-based site-specificity have shown a higher signal-to-noise (S/N) ratio than those with random conjugation, demonstrating that this strategy improves tracer properties in vitro and in vivo [32,33]. Moreover, site-specific conjugation could maintain the high affinity of the single-domain antibody and minimize the loss of immune-reactivity [[34], [35], [36]]. For improved clinical application, the conjugation site between chelator and antibody should be precisely controlled to prepare a tracer with a homogeneous structure.
Here, a tripeptide, i.e., cysteine, aspartic acid, and valine (CDV), was site-specifically inserted into an Nb109 sequence, which contained no cysteine residue by genetic engineering. Then, the metal-chelator reacted with the exposed cysteine sulfhydryl group of Nb109 (1:1) to obtain the precursor NODA-CDV-Nb109 with a homogeneous structure, thereby achieving site-specific labeling. This kind of site-specific conjugation strategy provided stoichiometric control and maintained the high affinity of Nb109 for PD-L1 [37,38]. The present results demonstrated that the radiolabeled site-specific tracer 68Ga-NODA-CDV-Nb109 exhibited promising clinical value for sensitively and accurately monitoring changes in PD-L1 expression and possessed great potential in guiding tumor immunotherapy under PET imaging.
2. Materials and methods
2.1. Materials
Maleimide-NODA was purchased from Qiyue Biology Co., Ltd. (Xi'an, China). Mass spectra were recorded on a high-resolution LTQ-Orbitrap XL mass spectrometer (Thermo Fisher Scientific Inc., Waltham, MA, USA). An Eckert and Ziegler AG 68Ge/68Ga generator (ITG GmbH, Berlin, Germany) was used to produce the radioisotope [68Ga]3+. High performance liquid chromatography (HPLC) or radio-HPLC analysis was performed on a Waters 2998 (Waters, Milford, MA, USA) with SuperGalaxy-SEC-S2000 chromatographic column purchased from FLM Scientific Instrument Co., Ltd. (Guangzhou, China). All centrifugations were performed in a GL-12MD centrifuge from Ruijiang Analytical Instrument Co., Ltd. (Wuxi, China). Radio-thin layer chromatography (radio-TLC) analysis was performed on the Mini-Scan TLC scanner (Bioscan, Santa Barbara, CA, USA) using 10 mM citric acid buffer as developing agent. All chemicals and reagents were bought from China National Pharmaceutical Group Co., Ltd. (Wuxi, China) unless otherwise stated. All cell culture and biological experiment related reagents were bought from Biological Industries (Migdal HaeMek, Israel) and Beyotime Biotechnology Co., Ltd. (Shanghai, China) unless otherwise stated.
2.2. Preparation of 68Ga-NODA-CDV-Nb109
Based on our previous research [29], a tripeptide consisting of cysteine, aspartic acid, and valine was inserted into the Nb109 sequence by genetic engineering. Since the original Nb109 sequence did not contain the cysteine residue, the DNA fragment corresponding to these three amino acids was introduced at the tail of the known nanobody Nb109. Next, the newly obtained fragment was cloned in a vector pcDNA4 (Invitrogen, Carlsbad, CA, USA). After further transient transfection and purification according to the method reported previously [29], the antibody fragment CDV-Nb109 was obtained. Then, the precursor NODA-CDV-Nb109 was prepared by binding maleimide-NODA to the amino acid modified single-domain antibody CDV-Nb109. CDV-Nb109 was blended with maleimide-NODA at a molar ratio of 1:2, dissolved in NH4OAc, and agitated at 37 °C for 2 h. The reaction was then purified via ultrafiltration, and the purified NODA-CDV-Nb109 was collected in pure water and stored at −80 °C.
For radiolabeling, the radioisotope [68Ga]3+ was eluted from the 68Ge/68Ga generator using hydrochloric acid (0.05 M, 4 mL). The middle fraction (1.4 mL) with >85% of radioactivity was transferred into a reaction vial containing the single-domain antibody NODA-CDV-Nb109 (60 μg). After adjusting the pH of the reaction system to 4.0 with sodium acetate buffer (0.25 M, 340 μL), the reaction mixture was incubated at 37 °C for 15 min and purified with a PD-10 column (GE Healthcare, Boston, MA, USA).
2.3. Stability assay
During the in vitro stability assay, the radiotracer 68Ga-NODA-CDV-Nb109 (1.85 × 10⁷ Bq) was incubated with 500 μL of serum from SenBeiJia Biological Technology Co., Ltd. (Nanjing, China) or 500 μL of phosphate-buffered saline (PBS) at 37 °C for different time (0.5, 1, 2, and 4 h), respectively. The percentage of the parent compound 68Ga-NODA-CDV-Nb109 at each time point was assessed by radio-HPLC. For the in vivo stability assay, mice were injected with 68Ga-NODA-CDV-Nb109 (1.3 × 10⁷ Bq) via the tail vein. At 1 h post injection, blood was obtained from the tail vein and tested using radio-HPLC to estimate the percentage of the parent compound in the blood sample.
2.4. Cell culture and Western blot analysis
Human melanoma cells A375 and human PD-L1 gene-transfected A375 cells (A375-hPD-L1) were provided by Smart Nuclide Biopharma Co., Ltd. (Suzhou, China). Human glioma cells U87 and lung cancer cells NCI-H1299 were acquired from the Chinese Academy of Sciences (Shanghai, China). All cell lines were cultured at 37 °C under 5% CO2 in Dulbecco’s modified Eagle medium or 1640 medium with 10% fetal bovine serum and 1% penicillin-streptomycin.
To determine PD-L1 expression level in these cancer cell lines, Western blot analysis was performed at first. A375, A375-hPD-L1, and U87 cells were harvested and lysed by RIPA, respectively. The supernatant was collected after centrifugation (12,000 r/min, 15 min) and then Western blot analysis was performed with standard procedures using the following reagents: rabbit anti-human PD-L1 (Abcam, Cambridge, UK), β-actin, and secondary antibody (Santa Cruz Biotechnology, Santa Cruz, CA, USA). PD-L1 expression level measured by Western blot was quantified with ImageJ software.
2.5. Binding affinity assay
The binding affinity of 68Ga-NODA-CDV-Nb109 in vitro was assessed by saturation assay. In brief, A375-hPD-L1 cells were seeded into 12-well plates (3 × 10⁵ per well) and incubated with increasing concentrations (0–125 nM) of 68Ga-NODA-CDV-Nb109 alone total binding (TB) or an additional 100-fold excess of NODA-CDV-Nb109 non-specific binding (NSB) at 37 °C for 1 h, respectively. After washed twice, the radioactivity was measured with a γ counter (1470 Wizard, Perkins Elmer Corp., Norwalk, CT, USA). The specific binding was plotted against the 68Ga-NODA-CDV-Nb109 concentration, and the dissociation constant (KD) was calculated using nonlinear regression as implemented in the SPSS13.0 software.
2.6. Effect of DOX on cell viability and PD-L1 expression
First, the cytotoxicity of DOX purchased from Aladdin Co., Ltd. (Shanghai, China) against NCI-H1299 cells was studied using a traditional methyl thiazolyl tetrazolium (MTT) assay. Cells were seeded into a 96-well plate (8 × 10³ per well) and incubated overnight. Fresh medium containing different DOX concentrations (0, 0.625, 1.25, 2.5, 5, 10, 20, and 40 μM) was added to each well. After 48 h, MTT (20 μL/well, 5 mg/mL) was added and incubated for another 4 h. Then dimethylsulfoxide (150 μL/well) was added to each well to lyse the formazan crystal, and the absorbance was recorded at 490 nm (Model 3550, Bio-Rad, Hercules, CA, USA). Finally, the half-inhibition concentration (IC50) of DOX against NCI-H1299 cells was determined by nonlinear regression as implemented in SPSS13.0.
Second, the change in PD-L1 expression in DOX-treated NCI-H1299 cells was detected by Western blot. Cells were seeded into a 6-well plate (3 × 10⁵ per well) and incubated with DOX at different concentrations (0, 0.3125, 0.625, 1.25, 2.5, and 5 μM) for 48 h, respectively. Then, cell lysis, protein quantification, and Western blot analysis were carried out according to instruction manuals. Finally, PD-L1 expression measured by Western blot was quantified with ImageJ software.
2.7. Cellular uptake
Uptake of 68Ga-NODA-CDV-Nb109 in different cancer cells was explored to assess its specificity and sensitivity in detecting PD-L1 expression. In brief, A375, A375-hPD-L1, and U87 cells (1 × 10⁶ cells/200 μL) were transferred to test tubes, respectively. Then, the tracer 68Ga-NODA-CDV-Nb109 (3.7 × 10⁴ Bq) was added to each tube, and subsequently incubated at 37 °C for 15, 30, 60, and 120 min, respectively. In the blocking group, cells were pre-treated with 500-fold precursor 30 min in advance. Then, cells were collected by centrifugation (1,500 r/min, 5 min) after washing twice and a γ counter was used to measure the radioactivity. Cellular uptake of tracer was expressed as the percentage of radioactivity retained in cells after incubation for different time relative to the total radioactive tracer added (AD%).
To further investigate the ability of 68Ga-NODA-CDV-Nb109 to detect changes in PD-L1 expression, a cellular uptake assay was carried out for NCI-H1299 cells before and after DOX treatment. NCI-H1299 cells were seeded into 6-well plates (3 × 10⁵ per well) and incubated with fresh medium or DOX (2.5 μM) for 48 h, respectively. Afterwards, the same procedure as the above-mentioned one was performed, including 68Ga-NODA-CDV-Nb109 addition, cells incubation and collection (trypsin enzymic digestion and centrifugation), washing, and radioactivity measurement. Considering that the cytotoxic effect of DOX might affect the tracer uptake in cells to a certain extent, the protein concentration at each time point was measured by the Bradford method. Finally, the cellular uptake was expressed as the radioactivity per milligram of protein (AD%/mg).
2.8. Animal models
Female BALB/c nude mice (4–5 weeks old) were purchased from Cavens Laboratory Animal Co., Ltd. (Changzhou, China). Tumors were implanted at the right shoulder by a subcutaneous injection of different cancer cells (5 × 10⁶) in 100 μL of PBS, respectively. To eliminate individual differences as much as possible, A375 and A375-hPD-L1 cells were subcutaneously inoculated into the left and right shoulder of the same mouse, respectively. When the tumor volume reached 300–500 mm3, small animal PET imaging and other biological experiments could be performed. NCI-H1299 tumor-bearing mice were categorized into two groups. One received DOX (2 mg/kg) intravenously once every two days for 5 to 7 times, and the other received saline as a control. All experiments involving animals were approved by the Animal Care and Ethics Committee of Jiangsu Institute of Nuclear Medicine, China.
2.9. PET imaging
Tumor-bearing mice (3–4 mice/group, n = 4) were anesthetized with isoflurane: O2 (2% (V/V), 2 mL/min) and scanned using a micro-PET scanner (Siemens, Nürnberg, Germany) after intravenous injection of 68Ga-NODA-CDV-Nb109 (4.0–5.0 MBq). Whole-body PET imaging was performed by dynamic scanning for 1 h and static imaging for 10 min. The tissue uptake of tracer was estimated using the technique of region of interest (ROI) and the results were expressed as percentage of radiotracer in the ROI relative to the injected total radioactive dose (%ID/mL).
2.10. Biodistribution and pharmacokinetics study
Biodistribution of the tracer in normal mice, A375-hPD-L1/A375, and U87 tumor-bearing mice (n = 5) was studied and compared after intravenous injection of 68Ga-NODA-CDV-Nb109 (5 × 10⁶ Bq). At 1 h post injection, mice were sacrificed and tissues or organs of interest were harvested and weighed, including tumor and major normal organs. Then, the radioactivity was measured with a γ counter. Finally, biodistribution of the tracer was expressed as percentage of the injected dose per gram of tissue (%ID/g).
For the pharmacokinetics study, blood samples were collected at different time points (1, 3, 5, 7, 10, 15, 20, 25, 30, 45, 60, 90, and 120 min) via the end of the tail vein of normal nude mice (n = 4). The blood sample was weighed, and the radioactivity was measured with a γ counter. Then, pharmacokinetic parameters were analyzed using the DAS 2.1 program.
2.11. Statistical analysis
All results are expressed as mean ± SD (n = 3). Statistical analysis was conducted with the software Origin2018. One-way analysis of variance and the least significant difference t-test were used for data analysis. P < 0.05 was considered statistically significant.
3. Results and discussion
3.1. Synthesis and characterization
To synthesize a tracer with a uniform structure, a tripeptide (CDV) was inserted at a specific site in the nonblocking antibody (Nb109), and maleimide-NODA reacted with the exposed cysteine sulfhydryl group (1:1) to obtain the homogeneous precursor NODA-CDV-Nb109. The representative HPLC chromatogram showed >96% purity of NODA-CDV-Nb109 (Fig. S1). Electrospray-quadrupole-time of flight-mass spectrometry (ESI-Q-TOF-MS) indicated a molecular weight of NODA-CDV-Nb109 of 14,426 (Fig. S2), which confirmed that the product was a single-NODA chelator conjugated with each single-domain antibody. Subsequently, the radiochemical synthesis of 68Ga-NODA-CDV-Nb109 was performed as shown in Scheme 1. 68Ga-NODA-CDV-Nb109 was produced at 95% radiochemical yield and 97% radiochemical purity (Fig. S3), and the molar activity was measured to be 26.17 ± 3.32 GBq/μmol (n = 3). The representative radio-HPLC chromatogram further verified the high yield and purity of 68Ga-NODA-CDV-Nb109 (Fig. 1A).
Scheme 1.

Synthetic route of 68Ga-NODA-CDV-Nb109. CDV: cysteine, aspartic acid, and valine.
Fig. 1.

Radiolabeling and stability evaluation of 68Ga-NODA-cysteine, aspartic acid, and valine (CDV)-Nb109. (A) High performance liquid chromatography (HPLC) analysis of 68Ga-NODA-CDV-Nb109. (B) In vitro stability assay of 68Ga-NODA-CDV-Nb109 in phosphate-buffered saline (PBS) for 4 h. (C) In vitro stability assay of 68Ga-NODA-CDV-Nb109 in serum for 2 h. (D) In vivo stability assay of 68Ga-NODA-CDV-Nb109 in nude mice at 1 h post injection.
3.2. Stability evaluation
Tracer stability was evaluated first given its critical importance for in vivo biological applications. After incubated with PBS at 37 °C for 4 h, the percentage of parent compound 68Ga-NODA-CDV-Nb109 was determined to be >95% (Fig. 1B), suggesting that the tracer was stable enough in PBS. Radio-HPLC analysis showed some impurity peaks over time during incubation in serum, but still accounting for <10% (Fig. 1C). After incubation for 2 h, the percentage of parent compound 68Ga-NODA-CDV-Nb109 was still high (approximately 92%), revealing good stability in serum. Furthermore, in vivo stability was also investigated. The percentage of the parent compound analyzed by radio-HPLC in blood samples from mice was >90% (Fig. 1D), indicating satisfactory stability in vivo. Together, the tracer 68Ga-NODA-CDV-Nb109 was found to have excellent stability and could be used for further experiments.
3.3. In vitro specificity assay
To identify the PD-L1 targeting specificity of 68Ga-NODA-CDV-Nb109, the PD-L1 expression in various cancer cells was detected. As shown in Fig. 2A, PD-L1 expression in A375-hPD-L1 cells was 5 times higher than that in non-transfected A375 cells; U87 is a wild-type cancer cell with high PD-L1 expression, two times as high as that in A375. However, compared with A375-hPD-L1, PD-L1 expression in U87 cells was approximately half that in A375-hPD-L1 cells (Fig. 2B). Subsequently, these cell lines were chosen to assess the targeting ability of 68Ga-NODA-CDV-Nb109.
Fig. 2.

In vitro specificity assay. (A) Western blot analysis of programmed cell death ligand 1 (PD-L1) expression in U87, A375, and A375-hPD-L1 cell lines. (B) Quantification of PD-L1 expression in Western blot analysis. (C) Binding affinity assay of 68Ga-NODA-CDV-Nb109 to A375-hPD-L1 cells. (D) Cellular uptake of 68Ga-NODA-CDV-Nb109 in U87, A375, A375-hPD-L1, and A375-hPD-L1 pre-treated with 500-fold NODA-CDV-Nb109 at different times. ∗P < 0.05; ∗∗P < 0.01; ∗∗∗P < 0.001. TB: total binding; SB: specific binding; NSB: non-specific binding; CDV: cysteine, aspartic acid, and valine.
To investigate whether the site-specific conjugation strategy would affect the tracer affinity, saturation assay was performed to measure the affinity of 68Ga-NODA-CDV-Nb109 to PD-L1. The KD of 68Ga-NODA-CDV-Nb109 was 12.34 ± 1.65 nM (Fig. 2C). Compared with similar tracers 124I-anti-hPD-L1 Nb6 (KD = 2.19 nM) [39] and [18F]LG-1 (KD = 63.13 nM) [40], ours showed a higher affinity for PD-L1. The saturation assay proved that site-specific conjugation did not alter the characteristics of single-domain antibody and that the tracer still had a strong affinity for PD-L1.
A cellular uptake assay was carried out to investigate the tracer specificity for measuring PD-L1 expression levels in cancer cells. Compared with A375-hPD-L1 and U87 cells, 68Ga-NODA-CDV-Nb109 had low uptake in A375 cells at all time points. Tracer uptake in A375-hPD-L1 cells was nearly three times as much as that in non-transfected A375 cells (Fig. 2D). Tracer uptake in U87 cells decreased slightly in comparison with that in A375-hPD-L1 but was still higher than that in PD-L1 negative A375 cells (Fig. 2D). After incubating for 30 min, the tracer uptake in U87, A375, and A375-hPD-L1 cells reached an equilibrium value of 2.26% ± 0.32%, 1.36% ± 0.24%, and 3.35% ± 0.21%, respectively. After pretreatment with 500-fold excess of NODA-CDV-Nb109 for 30 min, the maximum tracer uptake in A375-hPD-L1 cells decreased to 1.56% ± 0.23%, almost as that in A375 cells (Fig. 2D).
3.4. Effect of DOX on PD-L1 expression in cancer cells
DOX, a member of anthracycline family, can kill cancer cells by inhibiting the synthesis of RNA and DNA, and has been found to upregulate PD-L1 expression in colorectal cancer [41]. In the present study, the ability of the tracer to detect the DOX-induced variation in PD-L1 expression of NCI-H1299 cells, one type of non-small cell lung cancer (NSCLC) cell line with low PD-L1 expression [42], was investigated. First, the IC50 of DOX against NCI-H1299 cells was measured to be 1.05 ± 0.15 μM (Fig. 3A). Then, change in PD-L1 expression of NCI-H1299 cells induced by different DOX concentrations (0, 0.3125, 0.625, 1.25, 2.5, and 5 μM) was evaluated (Fig. 3B). According to Western blot analysis, DOX-treated NCI-H1299 cells showed increased PD-L1 expression compared with the DOX-untreated group. For 2.5 μM DOX, the PD-L1 expression in NCI-H1299 reached the peak, 2.1 times higher than in the control group (Fig. 3C).
Fig. 3.

Effects of doxorubicin (DOX) on NCI-H1299 cell viability and programmed cell death ligand 1 (PD-L1) expression. (A) Cytotoxicity assay of DOX against cells. (B) Western blot analysis of PD-L1 expression in cells treated with different concentrations of DOX for 48 h. (C) Quantification of Western blot analysis. (D) Cellular uptake of 68Ga-NODA-CDV-Nb109 in non-treated and DOX-treated cells (2.5 μM DOX) for 48 h. ∗∗P < 0.01; ∗∗∗P < 0.001. CDV: cysteine, aspartic acid, and valine.
Moreover, 68Ga-NODA-CDV-Nb109 was applied to monitor the increased PD-L1 expression caused by DOX. The uptake of 68Ga-NODA-CDV-Nb109 in NCI-H1299 cells incubated with DOX (2.5 μM) for 48 h was twice as much as that in DOX-untreated cells. The maximum tracer uptake in DOX-treated and untreated groups was 2.25 ± 0.34 and 0.80 ± 0.26 AD%/mg, respectively, based on protein quantification (Fig. 3D). All cellular uptake assays were also consistent with Western blot analysis. This demonstrated that the upregulation of PD-L1 in DOX-treated NCI-H1299 cells could be specifically detected by 68Ga-NODA-CDV-Nb109.
3.5. In vivo PET imaging
Considering the in vitro superior PD-L1 targeting ability of 68Ga-NODA-CDV-Nb109, PET imaging was used to investigate its potential utility in monitoring PD-L1 expression in vivo. At 10 min post injection, representative PET images exhibited rapid and high accumulation of 68Ga-NODA-CDV-Nb109 in A375-hPD-L1 xenografts (right), and the radioactive signal in the tumor could persist for >1 h (Fig. 4A). On the contrary, the PD-L1-negative A375 tumor (left) was invisible throughout the whole imaging process. The maximum tracer uptake in A375-hPD-L1 tumor was 4.99 ± 0.42 %ID/mL (Fig. 4B), nearly three times that in A375 tumor (1.96 ± 0.36 %ID/mL) and muscle (1.56 ± 0.31 %ID/mL). The tracer had a favorable tumor-to-muscle (T/M) uptake ratio in the A375-hPD-L1 tumor and increased gradually from 3.03 at 10 min post injection to 5.84 at 60 min post injection. However, the T/M ratio in A375 tumor was relatively low (1.51 ± 0.14) and showed no significant change in the whole imaging process (Fig. 4E).
Fig. 4.

Micro-positron emission tomography (PET) imaging of A375, A375-hPD-L1, and U87-bearing mice. (A) Representative PET images of A375 and A375-hPD-L1 tumor-bearing mice after injection of 68Ga-NODA-CDV-Nb109 (4.0–5.0 MBq). (B) Tumor and muscle uptake of 68Ga-NODA-CDV-Nb109 in A375 and A375-hPD-L1 mice. (C) Representative PET images of U87 tumor-bearing mice after injection of 68Ga-NODA-CDV-Nb109 (4.0–5.0 MBq). (D) Tumor and muscle uptake of 68Ga-NODA-CDV-Nb109 in U87 tumor-bearing mice. (E) Tumor-to-muscle (T/M) uptake ratio determined from quantification of PET images. ∗∗∗P < 0.001. NS: no significant difference in statistics; CDV: cysteine, aspartic acid, and valine.
Since wild-type cancer is more convincing than a genetically modified model, PET imaging of 68Ga-NODA-CDV-Nb109 in wild-type U87 xenograft was also performed. Representative PET images of the U87 xenograft exhibited a favorable tumor uptake of 68Ga-NODA-CDV-Nb109 at different time points (Fig. 4C). According to ROI analysis (Fig. 4D), uptake of 68Ga-NODA-CDV-Nb109 in U87 tumor reached a maximum uptake of 3.01 ± 0.52 %ID/mL at 10 min post injection and then slowly reduced to 1.16 ± 0.34 %ID/mL at 60 min. The T/M ratio was relatively constant over time and the highest uptake ratio could reach 4.40 ± 0.53 at 30 min (Fig. 4E). The tracer could quickly identify tumors with high PD-L1 expression and rapidly clear from non-target tissues, thus providing a high tumor-to-background PET image within a short time. The tumor uptake of 68Ga-NODA-CDV-Nb109 in PET imaging was consistent with the cellular uptake assay. Although 68Ga-NODA-CDV-Nb109 showed favorable accumulation in U87 tumor, its tumor uptake was remarkably lower than that in A375-hPD-L1, mainly attributed to different PD-L1 expression levels in various cancers. These results illustrated that 68Ga-NODA-CDV-Nb109 could measure PD-L1 expression in different tumors in a non-invasive and sensitive manner.
Furthermore, considering that chemotherapy could modulate PD-L1 expression levels in malignancies, 68Ga-NODA-CDV-Nb109 was used to track changes in PD-L1 expression in NCI-H1299 xenograft after DOX treatment. This treatment significantly inhibited tumor growth and the mice showed no obvious abnormality. According to PET imaging (Figs. 5A and B), a substantial difference in tracer accumulation was observed in the presence and absence of DOX treatment. In the DOX-untreated group, the tracer accumulation in the tumor reached the maximum of 1.18 ± 0.12 %ID/mL at 10 min post injection; but no significant difference could be found between tumor and muscle uptake during the first 60 min PET scanning (Fig. 5C). In contrast, the tumor uptake of 68Ga-NODA-CDV-Nb109 in DOX-treated mice was 3.50 ± 0.43 %ID/mL at 10 min and then declined to 1.45 ± 0.32 %ID/mL at 60 min, still higher than the maximum tumor uptake in DOX-untreated mice (Fig. 5D). However, the muscle uptake of the tracer did not significantly differ between DOX-treated and DOX-untreated groups. Hence, DOX-treated mice produced a favorable T/M uptake ratio of 3.98 ± 0.52 (Fig. 5E). Although the overall background uptake of 68Ga-NODA-CDV-Nb109 in DOX-treated NCI-H1299-bearing mice was higher than that in DOX-untreated mice, which might be due to the systemic toxicity of DOX, 68Ga-NODA-CDV-Nb109 could sensitively and accurately identify the upregulation of PD-L1 caused by DOX. Together, these findings proved that DOX could upregulate PD-L1 expression in tumors and that 68Ga-NODA-CDV-Nb109 could be used to monitor this change sensitively and dynamically. In addition, all PET images clearly revealed high tracer accumulation in the kidney and bladder, suggesting that 68Ga-NODA-CDV-Nb109 was primarily metabolized through the kidney and bladder.
Fig. 5.

Micro-positron emission tomography (PET) imaging of NCI-H1299-bearing mice with or without doxorubicin (DOX) treatment. (A) Dynamic PET images of the xenograft with injection of 68Ga-NODA-CDV-Nb109 (4.0–5.0 MBq). (B) Representative PET images of DOX-treated xenograft with injection of 68Ga-NODA-CDV-Nb109 (4.0–5.0 MBq). (C) Tumor and muscle uptake of 68Ga-NODA-CDV-Nb109 in DOX-untreated xenograft. (D) Tumor and muscle uptake of 68Ga-NODA-CDV-Nb109 in DOX-treated xenograft. (E) Tumor-to-muscle (T/M) uptake ratio determined from quantification of PET images. ∗∗∗P < 0.001. NS: no significant difference in statistics; CDV: cysteine, aspartic acid, and valine.
3.6. Biodistribution and pharmacokinetics study
Biodistribution of 68Ga-NODA-CDV-Nb109 in normal mice, A375-hPD-L1/A375 tumor-bearing mice, and U87 tumor-bearing mice was investigated and compared. As observed from Fig. 6 and Table S1, the radioactivity in the blood of normal mice, A375-hPD-L1/A375, and U87 tumor-bearing mice at 1 h post injection was 1.65 ± 0.94, 1.75 ± 0.21, and 1.21 ± 0.49 %ID/g, respectively. The kidneys in normal mice and tumor-bearing mice all exhibited remarkably high tracer uptake at 1 h (45.23 ± 3.77, 48.72 ± 0.70, and 44.77 ± 6.88 %ID/g, respectively), consistent with PET imaging. This further demonstrated that the tracer 68Ga-NODA-CDV-Nb109 was excreted mainly from the urinary system. Compared with the A375 tumor uptake (1.05 ± 0.21 %ID/g), the A375-hPD-L1 tumor displayed higher tracer uptake (4.02 ± 0.35 %ID/g). In U87 tumor-bearing mice, tracer accumulation in the tumor was 1.51 ± 0.22 %ID/g, 1.5-times as high as that of A375 tumor. According to the biodistribution analysis (Fig. 6 inset), the T/M uptake ratio in A375-hPD-L1 and U87 tumor-bearing mice was 6.77 ± 0.38 and 4.02 ± 0.17, respectively, 3.9- and 2.4-fold of that in A375 tumor-bearing mice (1.77 ± 0.44). This further confirmed the results of PET imaging and verified the high specificity of 68Ga-NODA-CDV-Nb109 to PD-L1.
Fig. 6.

Biodistribution of 68Ga-NODA-CDV-Nb109 in normal mice, A375-hPD-L1/A375, and U87-tumor bearing mice at 1 h post injection. Insert: Tumor-to-muscle (T/M) uptake ratio of 68Ga-NODA-CDV-Nb109 in A375-hPD-L1/A375 and U87 tumor-bearing mice. ∗∗∗P < 0.001. CDV: cysteine, aspartic acid, and valine.
As shown in Fig. 7, the metabolism of 68Ga-NODA-CDV-Nb109 in normal mice displayed linear kinetics and its concentration-time curve conformed to a two-compartment pharmacokinetics model. The clearance half-life of 68Ga-NODA-CDV-Nb109 was determined to be about 49.24 min and the total clearance rate was 0.021 L/min/kg, indicating that 68Ga-NODA-CDV-Nb109 could be quickly cleared from the blood resulting in a high S/N ratio.
Fig. 7.

Pharmacokinetics behavior of 68Ga-NODA-CDV-Nb109 in normal mice.
As a whole, the site-specific radiolabeled 68Ga-NODA-CDV-Nb109 was also produced at high radiochemical yield and purity, compared with our previously reported tracer 68Ga-NOTA-Nb109 that was prepared using stochastic radiolabeling (Table 1) [29,42]. The percentage of the parent compound 68Ga-NODA-CDV-Nb109 and 68Ga-NOTA-Nb109 analyzed by HPLC was >90% in both cases after incubation in serum and PBS for 2 h, suggesting that both tracers had satisfactory stability. The cellular uptake assay showed remarkably higher uptake of the site-specifically radiolabeled tracer 68Ga-NODA-CDV-Nb109 in PD-L1 positive cells than in PD-L1 negative cells, indicating that it possessed a high targeting ability to PD-L1. This was similar to the tracer 68Ga-NOTA-Nb109. Moreover, the low KD value also demonstrated the high affinity of 68Ga-NODA-CDV-Nb109 to PD-L1. All experimental results indicated that the affinity of 68Ga-NODA-CDV-Nb109 to PD-L1 did not change with the introduction of the cysteine–maleimide group for site-specifically radiolabeling. PET imaging showed that the maximum uptake of 68Ga-NODA-CDV-Nb109 in A375-hPD-L1 and U87 tumor-bearing mice was comparable to that of 68Ga-NOTA-Nb109, but the T/M uptake ratio of 68Ga-NODA-CDV-Nb109 was slightly lower than that of 68Ga-NOTA-Nb109 [29,42]. This was probably because the overall charge of 68Ga-NODA-CDV-Nb109 was increased by the CDV-Mal group, leading to a higher background than that of 68Ga-NOTA-Nb109 [43]. However, the site-specifically radiolabeled tracer 68Ga-NODA-CDV-Nb109 could still provide PET images with a high S/N ratio within a short time. Most importantly, 68Ga-NODA-CDV-Nb109 could be prepared with a homogeneous structure using site-specific radiolabeling, which was more conducive to clinical applications than 68Ga-NOTA-Nb109. On the other hand, it is necessary to screen more wild-type malignancies with endogenous PD-L1, and the efficacy of the site-specifically radiolabeled tracer in detecting endogenous PD-L1 in other tumor-bearing models needs to be further explored. Although the influence of PD-L1 expression in normal tissues and the dose of 68Ga-NODA-CDV-Nb109 on PET imaging need to be further explored, this tracer exhibited great application prospects in guiding immunotherapy, owing to its strong specificity to PD-L1.
Table 1.
Comparison of 68Ga-NOTA-Nb109 and 68Ga-NODA-CDV-Nb109.
| Analytes | Labeling method | Homogeneous structure | RCY (%) | RCP (%) | Molar activity (GBq/mol) | RCP of probe in serum for 2 h (%) | RCP of probe in PBS for 2 h (%) | Maximum tumor uptake of A375-hPD-L1 (%ID/mL) | Maximum tumor uptake of U87 (%ID/mL) | Maximum T/M ratio in A375-hPD-L1 | Maximum T/M ratio in U87 | Refs. |
|---|---|---|---|---|---|---|---|---|---|---|---|---|
| 68Ga-NOTA-Nb109 | Random | No | >95 | >98 | 25.17 ± 3.26 | >90 | >90 | 5.32 ± 0.47 | 2.84 ± 0.32 | 11.03 | 9.12 | [29,42] |
| 68Ga-NODA-CDV-Nb109 | Site-specific | Yes | >95 | >97 | 26.17 ± 3.32 | >90 | >90 | 4.99 ± 0.42 | 3.01 ± 0.52 | 5.84 | 4.40 | This work |
CDV: cysteine, aspartic acid, and valine; RCY: radiochemical yield; RCP: radiochemical purity; PBS: phosphate-buffered saline; T/M: tumor-to-muscle.
4. Conclusions
In the present study, site-specific conjugation was applied to prepare the PD-L1 targeted PET imaging tracer 68Ga-NODA-CDV-Nb109, with high radiochemical yield, radiochemical purity, and stability. It could not only accurately and noninvasively detect PD-L1 expression in real time, but also sensitively monitor the upregulation of PD-L1 expression caused by chemotherapeutic drugs. Hence, PET imaging with this tracer might be useful for screening patients who may benefit from anti-PD-L1 immunotherapy and monitor therapeutic effects. Meanwhile, it can provide guidance for the development of a personalized treatment plan or adjustment of immunotherapy/chemotherapy regimens. However, this study had some limitations. DOX treatment probably induced systemic toxicity as it up-regulated the expression level of PD-L1 in the tumor region, resulting in high non-specific signals apart from the tumor region. This may limit its application for monitoring PD-L1 in orthotopic tumors. In the future, other tumor-bearing models and treatments with less toxicity to non-target tissues will be further investigated to evaluate the tracer suitability for therapeutic monitoring.
CRediT author statement
Yinfei Chen: Investigation, Methodology, Software, Formal analysis, Data curation, Writing - Original draft preparation, Reviewing and Editing, Visualization; Shiyu Zhu: Investigation, Methodology, Software, Formal analysis, Data curation, Writing - Original draft preparation; Jiayu Fu: Investigation, Methodology, Software, Formal analysis, Data curation; Jianguo Lin: Conceptualization, Investigation, Resources, Validation; Yan Sun: Methodology, Software, Formal analysis; Gaochao Lv: Methodology, Software, Formal analysis; Minhao Xie: Resources, Validation, Supervision; Tao Xu: Investigation, Resources, Validation, Supervision; Ling Qiu: Conceptualization, Methodology, Investigation, Resources, Validation, Writing - Reviewing and Editing, Supervision.
Declaration of competing interest
The authors declare that there are no conflicts of interest.
Acknowledgments
The authors acknowledge the financial support from the National Natural Science Foundation of China (Grant No.: 22076069), the Natural Science Foundation of Jiangsu Province (Grant No.: BK20201135), the Major Scientific Research Project of Jiangsu Commission of Health (Grant No.: ZDA2020007), and the Science Technology and Development Project of Wuxi (Grant No.: Y20212013).
Footnotes
Peer review under responsibility of Xi'an Jiaotong University.
Supplementary data to this article can be found online at https://doi.org/10.1016/j.jpha.2022.09.001.
Contributor Information
Tao Xu, Email: tao.xu@smartnucl.com.
Ling Qiu, Email: qiuling@jsinm.org.
Appendix A. Supplementary data
The following is the Supplementary data to this article:
References
- 1.Mellman I., Coukos G., Dranoff G. Cancer immunotherapy comes of age. Nature. 2011;480:480–489. doi: 10.1038/nature10673. [DOI] [PMC free article] [PubMed] [Google Scholar]
- 2.Pardoll D.M. The blockade of immune checkpoints in cancer immunotherapy. Nat. Rev. Cancer. 2012;12:252–264. doi: 10.1038/nrc3239. [DOI] [PMC free article] [PubMed] [Google Scholar]
- 3.Topalian S.L., Hodi F.S., Brahmer J.R., et al. Safety, activity, and immune correlates of anti-PD-1 antibody in cancer. N. Engl. J. Med. 2012;366:2443–2454. doi: 10.1056/NEJMoa1200690. [DOI] [PMC free article] [PubMed] [Google Scholar]
- 4.Alsaab H.O., Sau S., Alzhrani R., et al. PD-1 and PD-L1 checkpoint signaling inhibition for cancer immunotherapy: Mechanism, combinations, and clinical outcome. Front. Pharmacol. 2017;8 doi: 10.3389/fphar.2017.00561. [DOI] [PMC free article] [PubMed] [Google Scholar]
- 5.Francisco L.M., Sage P.T., Sharpe A.H. The PD-1 pathway in tolerance and autoimmunity. Immunol. Rev. 2010;236:219–242. doi: 10.1111/j.1600-065X.2010.00923.x. [DOI] [PMC free article] [PubMed] [Google Scholar]
- 6.Francisco L.M., Salinas V.H., Brown K.E., et al. PD-L1 regulates the development, maintenance, and function of induced regulatory T cells. J. Exp. Med. 2009;206:3015–3029. doi: 10.1084/jem.20090847. [DOI] [PMC free article] [PubMed] [Google Scholar]
- 7.Al Mamun A., Mei Z., Qiu L., et al. Theoretical investigation on QSAR of (2-methyl-3-biphenylyl) methanol analogs as PD-L1 inhibitor. Chin. J. Chem. Phys. 2020;33:459–467. [Google Scholar]
- 8.Brahmer J.R., Tykodi S.S., Chow L.Q.M., et al. Safety and activity of anti-PD-L1 antibody in patients with advanced cancer. N. Engl. J. Med. 2012;366:2455–2465. doi: 10.1056/NEJMoa1200694. [DOI] [PMC free article] [PubMed] [Google Scholar]
- 9.Carretero-González A., Lora D., Ghanem I., et al. Analysis of response rate with anti-PD1/PD-L1 monoclonal antibodies in advanced solid tumors: A meta-analysis of randomized clinical trials. Oncotarget. 2018;9:8706–8715. doi: 10.18632/oncotarget.24283. [DOI] [PMC free article] [PubMed] [Google Scholar]
- 10.Brahmer J., Reckamp K.L., Baas P., et al. Nivolumab versus docetaxel in advanced squamous-cell non-small-cell lung cancer. N. Engl. J. Med. 2015;373:123–135. doi: 10.1056/NEJMoa1504627. [DOI] [PMC free article] [PubMed] [Google Scholar]
- 11.Daud A.I., Wolchok J.D., Robert C., et al. Programmed death-ligand 1 expression and response to the anti-programmed death 1 antibody pembrolizumab in melanoma. J. Clin. Oncol. 2016;34:4102–4109. doi: 10.1200/JCO.2016.67.2477. [DOI] [PMC free article] [PubMed] [Google Scholar]
- 12.Carbognin L., Pilotto S., Milella M., et al. Differential activity of nivolumab, pembrolizumab and MPDL3280A according to the tumor expression of programmed death-ligand-1 (PD-L1): Sensitivity analysis of trials in melanoma, lung and genitourinary cancers. PLoS One. 2015;10 doi: 10.1371/journal.pone.0130142. [DOI] [PMC free article] [PubMed] [Google Scholar]
- 13.Taube J.M., Klein A., Brahmer J.R., et al. Association of PD-1, PD-1 ligands, and other features of the tumor immune microenvironment with response to anti-PD-1 therapy. Clin. Cancer Res. 2014;20:5064–5074. doi: 10.1158/1078-0432.CCR-13-3271. [DOI] [PMC free article] [PubMed] [Google Scholar]
- 14.Gao H., Wu Y., Shi J., et al. Nuclear imaging-guided PD-L1 blockade therapy increases effectiveness of cancer immunotherapy. J. Immunother. Cancer. 2020;8 doi: 10.1136/jitc-2020-001156. [DOI] [PMC free article] [PubMed] [Google Scholar]
- 15.Meng X., Huang Z., Teng F., et al. Predictive biomarkers in PD-1/PD-L1 checkpoint blockade immunotherapy. Cancer Treat. Rev. 2015;41:868–876. doi: 10.1016/j.ctrv.2015.11.001. [DOI] [PubMed] [Google Scholar]
- 16.Tibaldi C., Lunghi A., Baldini E. Use of programmed cell death protein ligand 1 assay to predict the outcomes of non-small cell lung cancer patients treated with immune checkpoint inhibitors. World J. Clin. Oncol. 2017;8:320–328. doi: 10.5306/wjco.v8.i4.320. [DOI] [PMC free article] [PubMed] [Google Scholar]
- 17.Tsao M.S., Kerr K.M., Kockx M., et al. PD-L1 immunohistochemistry comparability study in real-life clinical samples: Results of blueprint phase 2 project. J. Thorac. Oncol. 2018;13:1302–1311. doi: 10.1016/j.jtho.2018.05.013. [DOI] [PMC free article] [PubMed] [Google Scholar]
- 18.Bensch F., van der Veen E.L., Lub-de Hooge M.N., et al. 89Zr-atezolizumab imaging as a non-invasive approach to assess clinical response to PD-L1 blockade in cancer. Nat. Med. 2018;24:1852–1858. doi: 10.1038/s41591-018-0255-8. [DOI] [PubMed] [Google Scholar]
- 19.Hu K., Kuan H., Hanyu M., et al. Developing native peptide-based radiotracers for PD-L1 PET imaging and improving imaging contrast by pegylation. Chem. Commun. 2019;55:4162–4165. doi: 10.1039/c9cc00445a. [DOI] [PubMed] [Google Scholar]
- 20.Wang Q., Hai W., Shi S., et al. Oral uptake and persistence of the FnAb-8 protein characterized by in situ radio-labeling and PET/CT imaging. Asian J. Pharm. Sci. 2020;15:752–758. doi: 10.1016/j.ajps.2020.03.002. [DOI] [PMC free article] [PubMed] [Google Scholar]
- 21.Delso G., Fürst S., Jakoby B., et al. Performance measurements of the Siemens mMR integrated whole-body PET/MR scanner. J. Nucl. Med. 2011;52:1914–1922. doi: 10.2967/jnumed.111.092726. [DOI] [PubMed] [Google Scholar]
- 22.He K., Zeng S., Qian L. Recent progress in the molecular imaging of therapeutic monoclonal antibodies. J. Pharm. Anal. 2020;10:397–413. doi: 10.1016/j.jpha.2020.07.006. [DOI] [PMC free article] [PubMed] [Google Scholar]
- 23.Lesniak W.G., Chatterjee S., Gabrielson M., et al. PD-L1 detection in tumors using [64Cu]atezolizumab with PET. Bioconjugate Chem. 2016;27:2103–2110. doi: 10.1021/acs.bioconjchem.6b00348. [DOI] [PMC free article] [PubMed] [Google Scholar]
- 24.Truillet C., Oh H.L.J., Yeo S.P., et al. Imaging PD-L1 expression with immunoPET. Bioconjugate Chem. 2018;29:96–103. doi: 10.1021/acs.bioconjchem.7b00631. [DOI] [PMC free article] [PubMed] [Google Scholar]
- 25.Wei J., Wang Y.H., Lee C.Y., et al. An analysis of isoclonal antibody formats suggests a role for measuring PD-L1 with low molecular weight PET radiotracers. Mol. Imaging Biol. 2020;22:1553–1561. doi: 10.1007/s11307-020-01527-3. [DOI] [PMC free article] [PubMed] [Google Scholar]
- 26.Tinianow J.N., Gill H.S., Ogasawara A., et al. Site-specifically 89Zr-labeled monoclonal antibodies for immunoPET. Nucl. Med. Biol. 2010;37:289–297. doi: 10.1016/j.nucmedbio.2009.11.010. [DOI] [PubMed] [Google Scholar]
- 27.Liu Z., Li Z.-B., Cao Q., et al. Small-animal PET of tumors with 64Cu-labeled RGD-bombesin heterodimer. J. Nucl. Med. 2009;50:1168–1177. doi: 10.2967/jnumed.108.061739. [DOI] [PubMed] [Google Scholar]
- 28.De Silva R.A., Kumar D., Lisok A., et al. Peptide-based 68Ga-PET radiotracer for imaging PD-L1 expression in cancer, Mol. Pharm. 2018;15:3946–3952. doi: 10.1021/acs.molpharmaceut.8b00399. [DOI] [PMC free article] [PubMed] [Google Scholar]
- 29.Lv G., Sun X., Qiu L., et al. PET imaging of tumor PD-L1 expression with a highly specific nonblocking single-domain antibody. J. Nucl. Med. 2020;61:117–122. doi: 10.2967/jnumed.119.226712. [DOI] [PMC free article] [PubMed] [Google Scholar]
- 30.Kristensen L.K., Christensen C., Jensen M.M., et al. Site-specifically labeled 89Zr-DFO-trastuzumab improves immuno-reactivity and tumor uptake for immuno-PET in a subcutaneous HER2-positive xenograft mouse model. Theranostics. 2019;9:4409–4420. doi: 10.7150/thno.32883. [DOI] [PMC free article] [PubMed] [Google Scholar]
- 31.Sukhanova A., Even-Desrumeaux K., Kisserli A., et al. Oriented conjugates of single-domain antibodies and quantum dots: Toward a new generation of ultrasmall diagnostic nanoprobes. Nanomedicine. 2012;8:516–525. doi: 10.1016/j.nano.2011.07.007. [DOI] [PubMed] [Google Scholar]
- 32.Sussman D., Westendorf L., Meyer D.W., et al. Engineered cysteine antibodies: An improved antibody-drug conjugate platform with a novel mechanism of drug-linker stability. Protein Eng. Des. Sel. 2018;31:47–54. doi: 10.1093/protein/gzx067. [DOI] [PubMed] [Google Scholar]
- 33.Zettlitz K.A., Waldmann C.M., Tsai W.K., et al. A dual-modality linker enables site-specific conjugation of antibody fragments for 18F-immuno-PET and fluorescence imaging. J. Nucl. Med. 2019;60:1467–1473. doi: 10.2967/jnumed.118.223560. [DOI] [PMC free article] [PubMed] [Google Scholar]
- 34.Wissler H.L., Ehlerding E.B., Lyu Z., et al. Site-specific immuno-PET tracer to image PD-L1. Mol. Pharm. 2019;16:2028–2036. doi: 10.1021/acs.molpharmaceut.9b00010. [DOI] [PMC free article] [PubMed] [Google Scholar]
- 35.Tian B., Wong W.Y., Uger M.D., et al. Development and characterization of a camelid single domain antibody-urease conjugate that targets vascular endothelial growth factor receptor 2. Front. Immunol. 2017;8 doi: 10.3389/fimmu.2017.00956. [DOI] [PMC free article] [PubMed] [Google Scholar]
- 36.Massa S., Vikani N., Betti C., et al. Sortase A-mediated site-specific labeling of camelid single-domain antibody-fragments: A versatile strategy for multiple molecular imaging modalities. Contrast Media Mol. Imaging. 2016;11:328–339. doi: 10.1002/cmmi.1696. [DOI] [PubMed] [Google Scholar]
- 37.Junutula J.R., Raab H., Clark S., et al. Site-specific conjugation of a cytotoxic drug to an antibody improves the therapeutic index. Nat. Biotechnol. 2008;26:925–932. doi: 10.1038/nbt.1480. [DOI] [PubMed] [Google Scholar]
- 38.Pillow T.H., Tien J., Parsons-Reponte K.L., et al. Site-specific trastuzumab maytansinoid antibody-drug conjugates with improved therapeutic activity through linker and antibody engineering. J. Med. Chem. 2014;57:7890–7899. doi: 10.1021/jm500552c. [DOI] [PubMed] [Google Scholar]
- 39.Heskamp S., Hobo W., Molkenboer-Kuenen J.D., et al. Noninvasive imaging of tumor PD-L1 expression using radiolabeled anti-PD-L1 antibodies. Cancer Res. 2015;75:2928–2936. doi: 10.1158/0008-5472.CAN-14-3477. [DOI] [PubMed] [Google Scholar]
- 40.Lv G., Miao Y., Chen Y., et al. Promising potential of a 18F-labelled small-molecular radiotracer to evaluate PD-L1 expression in tumors by PET imaging. Bioorg. Chem. 2021;115 doi: 10.1016/j.bioorg.2021.105294. [DOI] [PubMed] [Google Scholar]
- 41.Naba N.M., Tolay N., Erman B., et al. Doxorubicin inhibits miR-140 expression and upregulates PD-L1 expression in HCT116 cells, opposite to its effects on MDA-MB-231 cells, Turk. J. Biol. 2020;44:15–23. doi: 10.3906/biy-1909-12. [DOI] [PMC free article] [PubMed] [Google Scholar]
- 42.Liu Q., Jiang L., Li K., et al. Immuno-PET imaging of 68Ga-labeled nanobody Nb109 for dynamic monitoring the PD-L1 expression in cancers. Cancer Immunol. Immunother. 2021;70:1721–1733. doi: 10.1007/s00262-020-02818-y. [DOI] [PMC free article] [PubMed] [Google Scholar]
- 43.Chigoho D.M., Lecocq Q., Awad R.M., et al. Site-specific radiolabeling of a human PD-L1 nanobody via maleimide-cysteine chemistry. Pharmaceuticals. 2021;14 doi: 10.3390/ph14060550. [DOI] [PMC free article] [PubMed] [Google Scholar]
Associated Data
This section collects any data citations, data availability statements, or supplementary materials included in this article.