Abstract
Purpose
To investigate whether coronary flow kinetic energy has incremental value over simulated fractional flow reserve (sFFR) in diagnosing hemodynamically significant stenosis assessed with coronary CT angiography and invasive fractional flow reserve (FFR).
Materials and Methods
This single-center retrospective study included 113 patients (mean age, 68 years ± 9 [SD]; 80 men) who underwent coronary CT angiography showing intermediate stenosis (30%–70% stenosis) and subsequent invasive FFR between December 2015 and March 2020. Kinetic energy was calculated using proximal coronary diameter and myocardial mass of the stenotic region. A mesh-free simulation was performed to calculate the sFFR. Invasive FFR of 0.80 or less indicated hemodynamically significant stenosis. Models using diameter stenosis, kinetic energy, and sFFR were compared by analyzing the receiver operating characteristic curve.
Results
Of the 144 vessels evaluated, 53 vessels (37%) had hemodynamically significant stenosis. Kinetic energy of vessels with significant stenosis was higher than that of vessels with nonsignificant stenosis (79 mJ/kg [IQR, 58–104 mJ/kg] vs 36 mJ/kg [IQR, 23–59 mJ/kg]; P < .001). Multivariable analysis including diameter stenosis and sFFR showed that kinetic energy (per 20 mJ/kg; odds ratio, 1.92; 95% CI: 1.37, 2.95; P < .001) was a predictor of hemodynamically significant stenosis. Adding kinetic energy to diameter stenosis and sFFR improved the area under the receiver operating characteristic curve from 0.89 (95% CI: 0.84, 0.95) to 0.93 (95% CI: 0.89, 0.97) (P = .04).
Conclusion
Kinetic energy had incremental value over sFFR in detecting hemodynamically significant stenosis assessed with invasive FFR.
Keywords: Coronary CT Angiography, Coronary Arteries, Fractional Flow Reserve, Kinetic Energy, Cardiac
Supplemental material is available for this article
© RSNA, 2022
Keywords: Coronary CT Angiography, Coronary Arteries, Fractional Flow Reserve, Kinetic Energy, Cardiac
Summary
In this feasibility study, kinetic energy of coronary flow had incremental value over simulated fractional flow reserve, derived from coronary CT angiography by computational fluid dynamics, in diagnosing hemodynamically significant stenosis.
Key Points
■ Vessels with hemodynamically significant stenosis had higher kinetic energy (79 mJ/kg [IQR, 58–104 mJ/kg] vs 36 mJ/kg [IQR, 23–59 mJ/kg]; P < .001) than other vessels.
■ When diameter stenosis, simulated fractional flow reserve (sFFR), and kinetic energy were included in multivariable analysis, kinetic energy (per 20 mJ/kg; odds ratio, 1.92 [95% CI: 1.37, 2.95]; P < .001) remained a significant predictor of hemodynamically significant stenosis.
■ The area under the receiver operating characteristic curve in a model that included diameter stenosis and sFFR was 0.89 (95% CI: 0.84, 0.95), which improved to 0.93 (95% CI: 0.89, 0.97; P = .04) when kinetic energy was included.
Introduction
Fractional flow reserve (FFR) calculated using computational fluid dynamics has been validated against invasive FFR, with accuracies ranging from 74% to 84% (1–4). Previous studies using the Bernoulli equation have shown that the sum of the prestenosis kinetic energy, calculated using the velocity of the coronary artery, directly affects severity of pressure decrease at the area of stenosis (5–7).
We assumed that kinetic energy would have additional value for diagnosing hemodynamically significant stenosis with use of invasive FFR. Therefore, the objectives of our feasibility study were to compare the diagnostic performance of morphologic stenosis with kinetic energy and simulated FFR (sFFR) calculated using CT angiography and to determine whether kinetic energy has incremental value over sFFR for the diagnosis of hemodynamically significant stenosis.
Materials and Methods
Patients
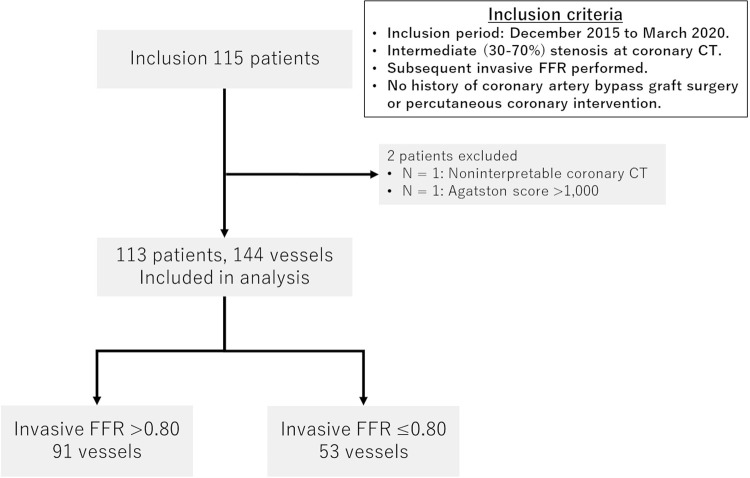
This single-center retrospective study was approved by the institutional review board, and the requirement for written informed consent was waived. The study included patients who underwent coronary CT angiography showing intermediate stenosis (30%–70% stenosis) in at least one major vessel (diameter, >2 mm), with subsequent invasive FFR between December 2015 and March 2020, and who had not undergone previous coronary bypass graft surgery or percutaneous coronary intervention. Exclusion criteria were as follows: noninterpretable coronary CT angiographic image and Agatston score greater than 1000 (Fig 1). Patient data were obtained from medical records.
Figure 1:
Patient flowchart. The study initially included 115 consecutive patients who underwent coronary CT angiography showing intermediate stenosis (30%–70% stenosis) and subsequent invasive fractional flow reserve (FFR), and who had not undergone previous coronary bypass graft surgery or percutaneous coronary intervention. Two patients were excluded, leaving 113 patients (144 vessels) in the final study group. Of the 144 vessels, 53 vessels (37%) had hemodynamically significant stenosis (invasive FFR ≤ 0.80).
Coronary CT Angiography
A 320-row CT scanner was used to perform coronary CT angiography (Aquilion One, Genesis edition; Canon Medical Systems). The detailed CT acquisition protocol is provided in Appendix E1 (supplement). The mean effective dose was derived by multiplying the dose-length product by a conversion coefficient for the chest (κ = 0.014 mSv · mGy−1 · cm−1). Images were reconstructed with a section thickness of 0.50 mm and increment of 0.25 mm, using a convolution kernel of FC04 with iterative reconstruction (AIRD 3D [adaptive iterative dose reduction using a three-dimensional processing algorithm]; Canon Medical Systems). Images were transferred to a workstation for postprocessing (Synapse Vincent; Fujifilm Medical).
Coronary Stenosis Analysis
Measurements were performed by a cardiovascular radiologist (N.T., with 15 years of experience) who was blinded to FFR results. Diameter stenosis was obtained using dedicated workstation software (Coronary Analysis; Fujifilm Medical). As a second observer, a radiation technician (R.F., with 5 years of experience in cardiovascular analysis) analyzed the diameter stenosis in the 30 randomly selected vessels. Left ventricular myocardial volume of the stenotic region (Vsten, in grams) was estimated by performing myocardial segmentation using the Voronoi method (Myocardial Analysis; Fujifilm Medical) (Fig 2B) (6).
Figure 2:
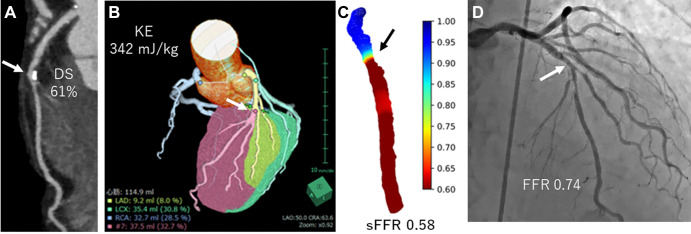
Images in a 73-year-old man with effort angina. (A) Coronary CT angiogram shows intermediate stenosis (arrows in A–D) at the mid left anterior descending (LAD) artery (61%). (B) The calculated kinetic energy (KE) was high (342 mJ/kg), and (C) simulated fractional flow reserve (sFFR) showed hemodynamically significant stenosis (sFFR, 0.58). (D) Invasive FFR showed pressure loss (FFR, 0.74). DS = diameter stenosis, LCX = left circumflex artery, RCA = right coronary artery.
Kinetic Energy Calculation
Kinetic energy (KE, in millijoules per kilogram) proximal to the stenotic segment was calculated using Vsten, peak myocardial flow during maximal hyperemia (fmax, in milliliters per minute per gram), and the proximal vessel diameter at 1 cm proximal to the stenosis (dprox, in millimeters) as follows (8):
 |
Equation 1 could be simplified as follows:
 |
We assumed the peak myocardial flow during maximal hyperemia was 8.0 mL/min/g (9). As a second observer, a cardiologist (Y.N., with 5 years of experience in cardiovascular analysis) calculated the kinetic energy in the 30 randomly selected vessels. After a 3-month washout period, this author repeated the kinetic energy calculations of these 30 vessels to determine intraobserver variability.
The processing time for myocardial segmentations and kinetic energy calculations was about 5 minutes.
sFFR Calculation
We used a mesh-free method (OpenMPS) to perform computational fluid dynamics analysis. OpenMPS software is an open-source implementation of the moving particle semi-implicit method available at GitHub (https://github.com/OpenMps/openmps) (9). In brief, a three-dimensional computational fluid dynamics algorithm was used from approximately 1 cm proximal to 2 cm distal to the stenosis. For simplicity, we calculated coronary flow as a steady flow at the peak velocity during the cardiac phase. The sFFR value at 2 cm distal to the stenosis was recorded (Fig 2).
Invasive Coronary Angiography and FFR Measurement
Invasive coronary angiography and FFR were performed according to standard clinical practice. FFR was performed at the decision of an operator with a 0.014-inch pressure guidewire (Verrata Pressure Guide Wire, Volcano; or Pressure Wire Certus, St Jude Medical System). Hyperemia was induced by administration of intracoronary isosorbide dinitrate (0.5–1.0 mg) and intracoronary papaverine hydrochloride (left coronary artery, 12 mg; and right coronary artery, 8 mg) or adenosine triphosphate (140 μg/kg/min). FFR was calculated automatically by dividing the mean diastole coronary pressure and the mean aortic pressure during hyperemia.
Statistical Analysis
Continuous variables are reported as the means ± SDs and categorical variables as numbers with percentages unless otherwise described. Student t test was used to compare continuous variables. The χ2 test and Fisher exact test were used to compare categorical variables and skewed variables. Intraclass correlation coefficient was used to investigate intraobserver and interobserver variability.
Logistic regression analysis was used to predict hemodynamically significant stenosis (FFR ≤ 0.80) using diameter stenosis, sFFR, and kinetic energy. Receiver operating characteristic curve analysis was used to compare the diagnostic performance of the following models: model 1, diameter stenosis; model 2, diameter stenosis and kinetic energy; model 3, diameter stenosis and sFFR; and model 4, diameter stenosis, sFFR, and kinetic energy. Global χ2 values were calculated to evaluate the incremental diagnostic value of kinetic energy and sFFR. Akaike information criterion and Bayesian information criterion were calculated.
A necessary sample size of 105 vessels was calculated with 95% power (α = .05) to detect 20% superiority in the area under the receiver operating characteristic curve of diameter stenosis vs diameter stenosis and kinetic energy. Differences in area under the receiver operating characteristic curve values were assessed by the DeLong method. Global χ2 and intraclass correlation coefficients were calculated using software (R version 4.0.2; R Foundation for Statistical Computing). The remaining statistical analyses were performed using JMP software, version 12.2.0 (SAS Institute). A P value less than .05 was considered to indicate a statistically significant difference.
Results
Patient and Lesion Characteristics
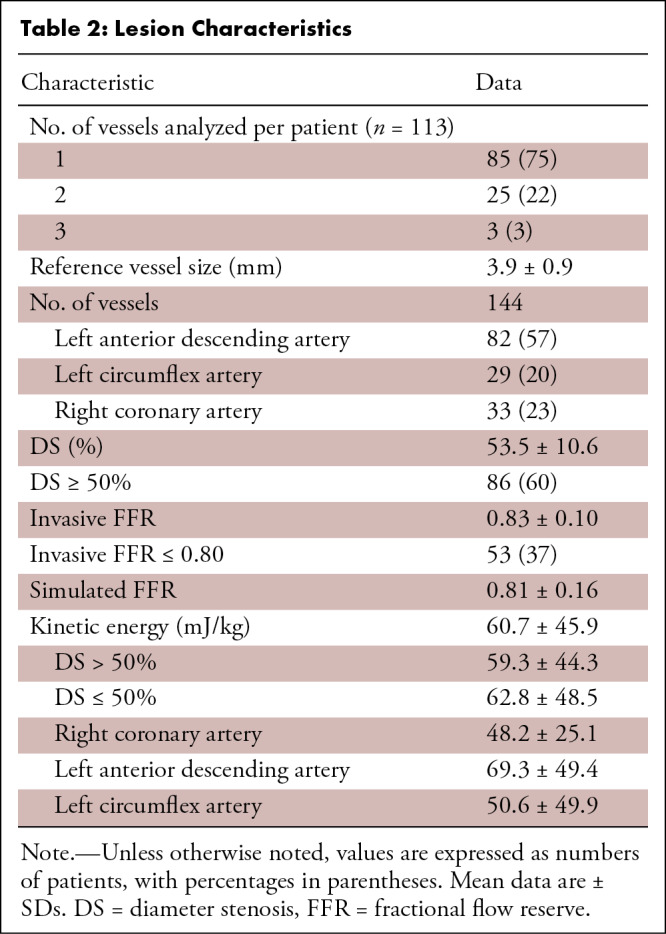
Our study included 113 patients (mean age, 68 years ± 9 [SD]; 80 men) (Table 1). More than half of the patients had at least one underlying cardiovascular risk factor. A total of 144 vessels with intermediate stenosis were analyzed. In order of decreasing frequency, coronary stenoses were located in the left anterior descending artery (82 vessels; 57%), right coronary artery (33 vessels; 23%), and left circumflex artery (29 vessels; 20%) (Table 2). Fifty-eight of the 144 vessels (40%) showed mild stenosis (≤50%), and the remaining 86 vessels (60%) had moderate stenosis (>50%). The median (interquartile range) Agatston score was 21.5 (0.0–66.1). The intraclass correlation coefficient for diameter stenosis was 0.85 (95% CI: 0.72, 0.93), indicating good interobserver agreement. The mean effective dose for coronary CT was 2.5 mSv ± 1.2.
Table 1:
Patient Demographic Characteristics
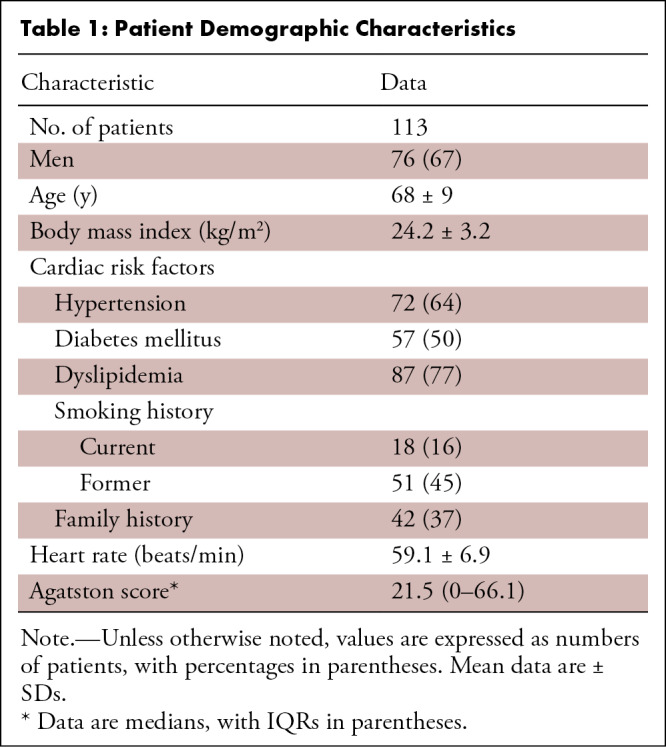
Table 2:
Lesion Characteristics
FFR and CT-derived Parameters
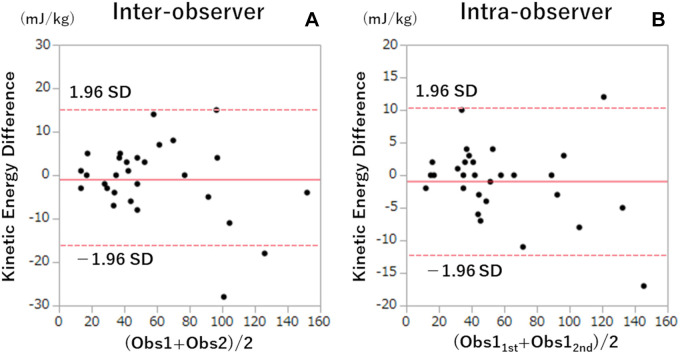
The median duration between CT angiography and coronary angiography was 29 days (IQR, 20–48 days). The mean FFR value was 0.83 ± 0.10, and 53 of 144 vessels (37%) showed FFR of 0.80 or less (Table 2). Vessels with hemodynamically significant stenosis had lower sFFR values (0.67 ± 0.71 vs 0.89 ± 0.08, P < .001), higher diameter stenosis values (P < .001), and higher kinetic energy values (79 mJ/kg [IQR, 58–104 mJ/kg] vs 36 mJ/kg [IQR, 23–59 mJ/kg], P < .001) than the remaining vessels (Fig 2). Mean kinetic energy did not differ between vessels with diameter stenosis greater than 50% and diameter stenosis of 50% or less (59.3 mJ/kg ± 44.3 vs 62.8 mJ/kg ± 48.5; P = .66) (Table 2). Kinetic energy was highest for the left anterior descending artery, followed by the left circumflex artery and right coronary artery (69.3 mJ/kg ± 49.4 vs 50.6 mJ/kg ± 49.9 vs 48.2 mJ/kg ± 25.1, P = .03). Inter- and intraobserver intraclass correlation coefficients of kinetic energy were 0.95 (95% CI: 0.91, 0.98) and 0.99 (95% CI: 0.98, 1.0), respectively, indicating good agreement. There were no statistically significant differences in kinetic energy values (Fig 3) between (mean difference, −0.93 ± 8.5; P = .57) or within (mean difference, −0.90 ± 5.6; P = .40) observers. There was a systematic bias, with greater difference in agreement at higher kinetic energy values.
Figure 3:
Bland-Altman plots of inter- and intraobserver analysis of kinetic energy calculation. The solid red line represents the mean difference, and the dashed red lines represent 95% CIs. Obs1 = observer 1, Obs2 = observer 2, Obs11st = N.T., Obs12nd = Y.N.
Logistic Regression Analysis
Univariable logistic regression analysis showed that sFFR (per 0.05 decrease; odds ratio, 2.21; 95% CI: 1.76, 2.93; P < .001), diameter stenosis (per 5%; odds ratio, 1.32; 95% CI: 1.11, 1.59; P = .001), and kinetic energy (per 20 mJ/kg; odds ratio, 2.33; 95% CI: 1.75, 3.23; P < .001) were predictors of hemodynamically significant stenosis. Statistical significance remained when the parameters were included in multivariable analysis: sFFR (per 0.05 decrease; odds ratio, 1.79; 95% CI: 1.37, 2.46; P < .001), diameter stenosis (per 5%; odds ratio, 1.35; 95% CI: 1.02, 1.84; P = .034), and kinetic energy (per 20 mJ/kg; odds ratio, 1.92; 95% CI: 1.37, 2.95; P < .001).
Receiver Operating Characteristic Curve Analysis
In the receiver operating characteristic curve diagnosing hemodynamically significant stenosis, the area under the receiver operating characteristic curve improved when kinetic energy was added to diameter stenosis (model 1 [diameter stenosis] vs model 2 [diameter stenosis and kinetic energy], 0.67 [95% CI: 0.57, 0.76] vs 0.89 [95% CI: 0.84, 0.95]; P < .001) (Fig 4). The areas under the receiver operating characteristic curve of model 2 (diameter stenosis and kinetic energy) and model 3 (diameter stenosis and sFFR) (0.89; 95% CI: 0.84, 0.95) were not significantly different (P = .99). Furthermore, when all three parameters were included in the analysis, the area under the receiver operating characteristic curve was improved to 0.93 (95% CI: 0.89, 0.97) compared with model 2 (P = .02) and model 3 (P = .04).
Figure 4:
![Comparison of receiver operating characteristic curves to predict hemodynamically significant stenosis. The areas under the receiver operating characteristic curve (AUCs) of models 1–4 were as follows: model 1 (diameter stenosis [DS]), 0.67 (95% CI: 0.57, 0.76); model 2 (DS, kinetic energy [KE]), 0.89 (95% CI: 0.84, 0.95); model 3 (DS, simulated fractional flow reserve [sFFR]), 0.89 (95% CI: 0.84, 0.95); and model 4 (DS, KE, sFFR), 0.93 (95% CI: 0.89, 0.97). There were significant differences between models 1 and 2 (P < .001) and models 1 and 3 (P < .001), with no evidence of a difference between models 2 and 3 (P = .99). The AUC in model 4 was significantly higher than those in model 2 (P = .02) and model 3 (P = .04). Shaded areas represent 95% confidence band.](https://cdn.ncbi.nlm.nih.gov/pmc/blobs/6faa/9806723/6005e8ae97bb/ryct.220147.fig4.jpg)
Comparison of receiver operating characteristic curves to predict hemodynamically significant stenosis. The areas under the receiver operating characteristic curve (AUCs) of models 1–4 were as follows: model 1 (diameter stenosis [DS]), 0.67 (95% CI: 0.57, 0.76); model 2 (DS, kinetic energy [KE]), 0.89 (95% CI: 0.84, 0.95); model 3 (DS, simulated fractional flow reserve [sFFR]), 0.89 (95% CI: 0.84, 0.95); and model 4 (DS, KE, sFFR), 0.93 (95% CI: 0.89, 0.97). There were significant differences between models 1 and 2 (P < .001) and models 1 and 3 (P < .001), with no evidence of a difference between models 2 and 3 (P = .99). The AUC in model 4 was significantly higher than those in model 2 (P = .02) and model 3 (P = .04). Shaded areas represent 95% confidence band.
Global χ2 Analysis, Akaike Information Criterion, and Bayesian Information Criterion
Global χ2 value analysis (Fig 5) showed that adding kinetic energy or sFFR to diameter stenosis improved the global χ2 value (model 1 [diameter stenosis], 10.5; model 2 [diameter stenosis and kinetic energy], 75.5; model 3 [diameter stenosis and sFFR], 81.2; model 1 vs model 2, P < .05; model 1 vs model 3, P < .05). In model 4, which included diameter stenosis, kinetic energy, and sFFR, the global χ2 value further improved to 98.3 (compared with models 2 and 3, P < .05).
Figure 5:
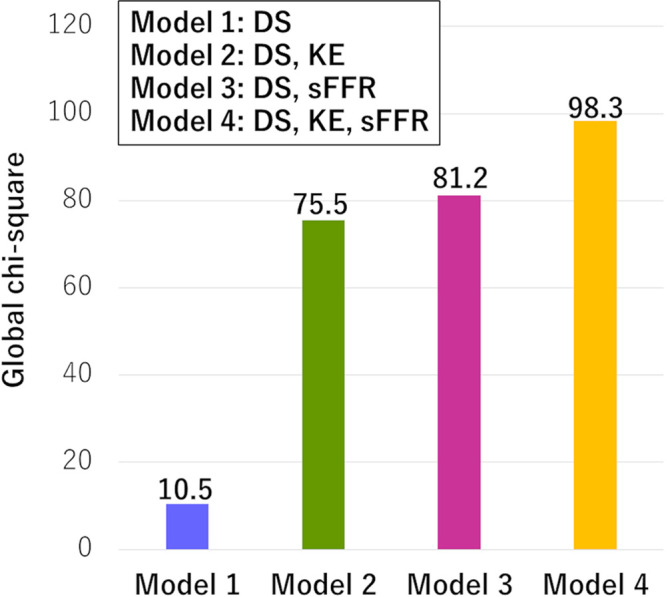
Comparison of global χ2 values between different models. To detect hemodynamically significant stenosis, both kinetic energy (KE) and simulated fractional flow reserve (sFFR) with diameter stenosis (DS) had incremental value over DS alone (P < .05). KE had a higher χ2 value than the model that included DS and sFFR (P < .05).
The Akaike information criterion values of models 1, 2, 3, and 4 were 183, 120, 114, and 99, respectively. The Bayesian information criterion values were 189, 129, 123, and 111, respectively.
Discussion
Our study showed that coronary CT angiography–derived kinetic energy improved the diagnostic performance of diameter stenosis to diagnose vessels with FFR of 0.80 or less in moderate stenosis by increasing the area under the receiver operating characteristic curve from 0.67 (95% CI: 0.57, 0.76) to 0.89 (95% CI: 0.84, 0.95; P < .001). The diagnostic value of diameter stenosis with kinetic energy was similar to that of diameter stenosis with sFFR (area under the receiver operating characteristic curve, 0.89; 95% CI: 0.84, 0.95). Some FFR simulation algorithms require transfer of CT data to a supercomputer outside the hospital, with an extended turnaround time of a few hours (10). Kinetic energy is clinically practical because it can be calculated without the need for transmitting CT data externally, and the calculation time is about 5 minutes. Although interobserver agreement was good, there was a systematic bias with greater difference in agreement at higher kinetic energy values.
Previous studies have shown that the simplified Bernoulli equation, which uses lesion length and minimum lumen area in addition to the subtended myocardial mass, may help improve the diagnostic capability of coronary CT to diagnose hemodynamically significant stenosis (5,6). The advantage of kinetic energy is that it requires only myocardial mass and is not affected by blooming from coronary calcification (5,6). Because kinetic energy improved diagnostic performance in detecting hemodynamically significant stenosis compared with diameter stenosis with sFFR, our study findings imply that kinetic energy might have additive value to other computational fluid dynamics methods, especially when the sFFR shows intermediate values (sFFR, 0.70−0.80).
Our study had limitations. First, this was a single-center study using a single CT system, and the body mass index of the patient population was low, with low calcium scores. Second, we performed computational fluid dynamics analysis in a limited segment of coronary arteries because calculated FFR values in far-distal segments tend to be underestimated (11–13). Current guidelines recommend using calculated FFR values 1–2 cm distal to the lower border of the stenosis (14). Third, we did not verify the incremental value of kinetic energy obtained using other FFR calculation methods. Fourth, although we used papaverine as a stress agent in some patients, it is shown that papaverine, adenosine triphosphate, and adenosine result in similar stress FFR values (15). Finally, because we ignored the correlation between different vessels from the same patient, this may have yielded incorrect P values.
In conclusion, our feasibility study demonstrated that the addition of kinetic energy to diameter stenosis improved the diagnostic performance of coronary CT in detecting hemodynamically significant stenosis and had incremental diagnostic value over sFFR.
Part of this study was supported by the Japan Society for the Promotion of Science KAKENHI grant no. 21K07573.
Disclosures of conflicts of interest: N.T. JSPS Kakenhi grant (21K07573). Y.N. No relevant relationships. S.F. No relevant relationships. R.F. No relevant relationships. D.T. No relevant relationships. A.K. No relevant relationships. Y. Kamo No relevant relationships. C.A. No relevant relationships. Y. Kawaguchi No relevant relationships. K.T. No relevant relationships. M.H. No relevant relationships. T.D. No relevant relationships. S.O. No relevant relationships. K.K.K. No relevant relationships. T.M. No relevant relationships. S.A. No relevant relationships.
Abbreviations:
- FFR
- fractional flow reserve
- sFFR
- simulated FFR
References
- 1. Nørgaard BL , Leipsic J , Gaur S , et al. ; NXT Trial Study Group . Diagnostic performance of noninvasive fractional flow reserve derived from coronary computed tomography angiography in suspected coronary artery disease: the NXT trial (Analysis of Coronary Blood Flow Using CT Angiography: Next Steps) . J Am Coll Cardiol 2014. ; 63 ( 12 ): 1145 – 1155 . [DOI] [PubMed] [Google Scholar]
- 2. Ko BS , Cameron JD , Munnur RK , et al . Noninvasive CT-derived FFR based on structural and fluid analysis: a comparison with invasive FFR for detection of functionally significant stenosis . JACC Cardiovasc Imaging 2017. ; 10 ( 6 ): 663 – 673 . [DOI] [PubMed] [Google Scholar]
- 3. Wardziak Ł , Kruk M , Pleban W , et al . Coronary CTA enhanced with CTA based FFR analysis provides higher diagnostic value than invasive coronary angiography in patients with intermediate coronary stenosis . J Cardiovasc Comput Tomogr 2019. ; 13 ( 1 ): 62 – 67 . [DOI] [PubMed] [Google Scholar]
- 4. Coenen A , Kim Y-H , Kruk M , et al . Diagnostic accuracy of a machine-learning approach to coronary computed tomographic angiography-based fractional flow reserve: result from the MACHINE consortium . Circ Cardiovasc Imaging 2018. ; 11 ( 6 ): e007217 . [DOI] [PubMed] [Google Scholar]
- 5. Tomizawa N , Arakawa H , Yamamoto K , Inoh S , Nojo T , Nakamura S . Simplified Bernoulli formula to diagnose ischemia-causing stenosis at coronary CT angiography: comparison with SPECT . Adv Comput Tomogr 2019. ; 8 ( 2 ): 11 – 23 . [Google Scholar]
- 6. Tomizawa N , Yamamoto K , Inoh S , Nojo T , Nakamura S . Simplified Bernoulli formula to predict flow limiting stenosis at coronary computed tomography angiography . Clin Imaging 2018. ; 51 : 104 – 110 . [DOI] [PubMed] [Google Scholar]
- 7. Takehara Y . 4D Flow when and how? Radiol Med (Torino) 2020. ; 125 ( 9 ): 838 – 850 . [DOI] [PubMed] [Google Scholar]
- 8. Imanparast A , Fatouraee N , Sharif F . The impact of valve simplifications on left ventricular hemodynamics in a three dimensional simulation based on in vivo MRI data . J Biomech 2016. ; 49 ( 9 ): 1482 – 1489 . [DOI] [PubMed] [Google Scholar]
- 9. Tomizawa N , Nozaki Y , Fujimoto S , et al . A phantom and in vivo simulation of coronary flow to calculate fractional flow reserve using a mesh-free model . Int J Cardiovasc Imaging 2022. ; 38 : 895 – 903 . [DOI] [PubMed] [Google Scholar]
- 10. Torii R , Yacoub MH . CT-based fractional flow reserve: development and expanded application . Glob Cardiol Sci Pract 2021. ; 2021 ( 3 ): e202120 . [DOI] [PMC free article] [PubMed] [Google Scholar]
- 11. Omori H , Hara M , Sobue Y , et al . Determination of the optimal measurement point for fractional flow reserve derived from CTA using pressure wire assessment as reference . AJR Am J Roentgenol 2021. ; 216 ( 6 ): 1492 – 1499 . [DOI] [PubMed] [Google Scholar]
- 12. Solecki M , Kruk M , Demkow M , et al . What is the optimal anatomic location for coronary artery pressure measurement at CT-derived FFR? J Cardiovasc Comput Tomogr 2017. ; 11 ( 5 ): 397 – 403 . [DOI] [PubMed] [Google Scholar]
- 13. Nozaki YO , Fujimoto S , Aoshima C , et al . Comparison of diagnostic performance in on-site based CT-derived fractional flow reserve measurements . Int J Cardiol Heart Vasc 2021. ; 35 : 100815 . [DOI] [PMC free article] [PubMed] [Google Scholar]
- 14. Nørgaard BL , Fairbairn TA , Safian RD , et al . Coronary CT angiography-derived fractional flow reserve testing in patients with stable coronary artery disease: recommendations on interpretation and reporting . Radiol Cardiothorac Imaging 2019. ; 1 ( 5 ): e190050 . [DOI] [PMC free article] [PubMed] [Google Scholar]
- 15. De Bruyne B , Pijls NHJ , Barbato E , et al . Intracoronary and intravenous adenosine 5′-triphosphate, adenosine, papaverine, and contrast medium to assess fractional flow reserve in humans . Circulation 2003. ; 107 ( 14 ): 1877 – 1883 . [DOI] [PubMed] [Google Scholar]


