

Abstract
Native electrospray ionization-ion mobility mass spectrometry (N-ESI/IM-MS) is a powerful approach for low-resolution structural studies of DNAs in the free state and in complex with ligands. Solvent vaporization is coupled with proton transfers from ammonium ions to the DNA, resulting in a reduction of the DNA charge. Here we provide insight into these processes by classical molecular dynamics and quantum mechanics/molecular mechanics free energy calculations on the d(GpCpGpApApGpC) heptamer, for which a wealth of experiments is available. Our multiscale simulations, consistent with experimental data, reveal a highly complex scenario. The proton either sits on one of the molecules or is fully delocalized on both, depending on the level of hydration of the analytes and the size of the droplets formed during the electrospray experiments. This work complements our previous study of the intramolecular proton transfer on the same heptamer occurring after the processes studied here, and together, they provide a first molecular view of proton transfer in N-ESI/IM-MS.
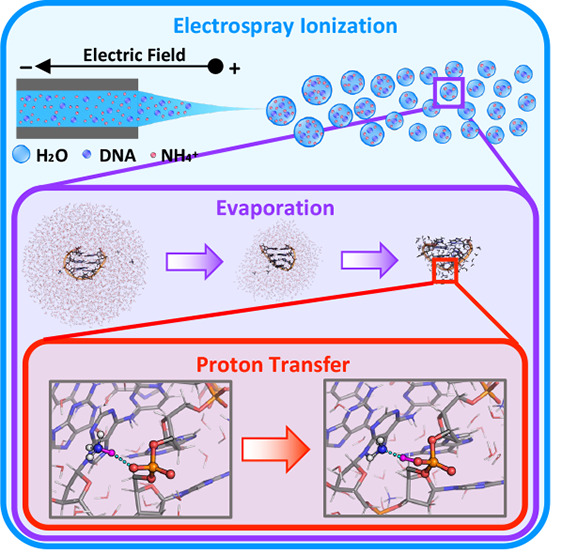
Native electrospray ionization-ion mobility mass spectrometry (N-ESI/IM-MS) is a very powerful tool for low-resolution structural studies of DNA oligomers and their complexes with ligands.1−4 It requires quantities much smaller than those required for high-resolution techniques, such as nuclear magnetic resonance, X-ray crystallography, or cryo-electron microscopy.5,6 The biomolecular analytes are sprayed from solution under quasi-physiological conditions (aqueous ammonium solutions at neutral pH, without organic cosolvents)7,8 into the gas phase through a capillary applied to an electric field.9,10 The initially formed droplets are shrunk by fast solvent evaporation and jet fission events to yield ESI nanodroplets. The analyte ions are released into the gas phase from the latter. The so-called “charged residue model” is generally used to describe the final ESI evaporation mechanism for biomolecular systems.11,12 Hereby, the biomolecule is located in the center of the droplet and surrounded with small counterions, like ammonium ions. Eventually, the droplets evaporate to give a complete loss of solvation.11,12 Originally, ammonia is positively charged and phosphates are negatively charged, but as solvent evaporates, the ammonium ions transfer protons to the DNA phosphates, which is consistent with the gas phase basicities of NH3 (819 kJ mol–1)13 and dimethyl phosphate (DMP; 1360 kJ mol–1).14 This leads to a decrease in the absolute value of the analyte’s charge (along with a loss of NH3), in turn associated with a high signal-to-noise ratio.15
Molecular dynamics (MD) studies have provided important insight into DNA oligomers in the gas phase.16 They suggested that duplex,17 triplex,18 and G-quadruplex19 oligomers maintain several structural determinants upon passing from the solution to the gas phase. They have also described the impact of the vaporization process in the structural ensemble.20 Furthermore, when combined with quantum calculations, MD simulations show that once protons are transferred to the DNA, they can jump from different basic sites in the oligos, leading to some structural changes and to a complex fuzzy change density in the analyte.21 The remaining questions are then how the intermolecular proton transfer events, from ammonium to DNA, occur during vaporization and what their structural impact is.
Here we perform molecular simulations on the d(GpCpGpApApGpC) heptamer and ammonium ions in water and gas phase to investigate ammonium–DNA proton transfers. First, we simulate the evaporation process under native ESI-MS conditions by batches of classical MD simulations of the heptamer immersed in a water droplet containing ammonium ions. We remove dissociating water molecules progressively. Second, we study the proton transfer phenomena between the ammonium ion and the heptamer, represented either as DMP [I (Figure 2)] or in its integrity [II (Figure 4)], in the partially dehydrated droplets. For this purpose, we use quantum mechanics/molecular mechanics (QM/MM) MD and umbrella sampling-based free energy simulations, exploiting QM/MM interfaces recently developed with the support of the EU projects BioExcel and BioExcel-2 (www.bioexcel.eu).
Figure 2.
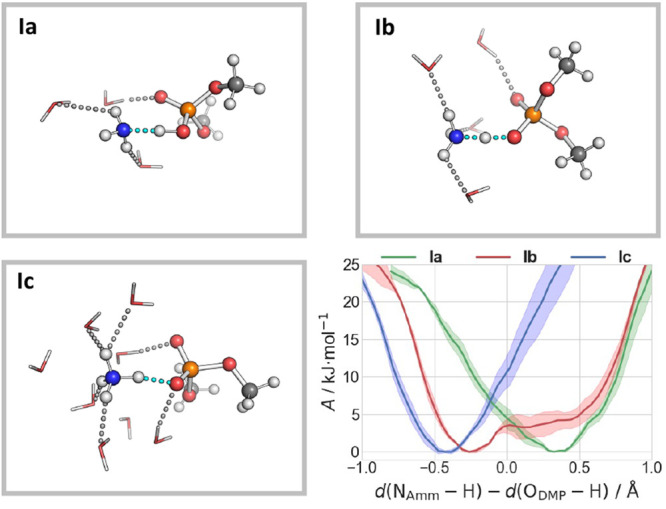
Snapshots of Ia–Ic, indicating the preferred protonation state of the ammonium and DMP moieties. The atomic species are colored gray (C), white (H), red (O), blue (N), and orange (P). H-Bonds are shown as dashed lines. The bottom right panel shows the free energies as a function of the difference in the breaking/forming NAmm–H and H–ODMP bond distances.
Figure 4.
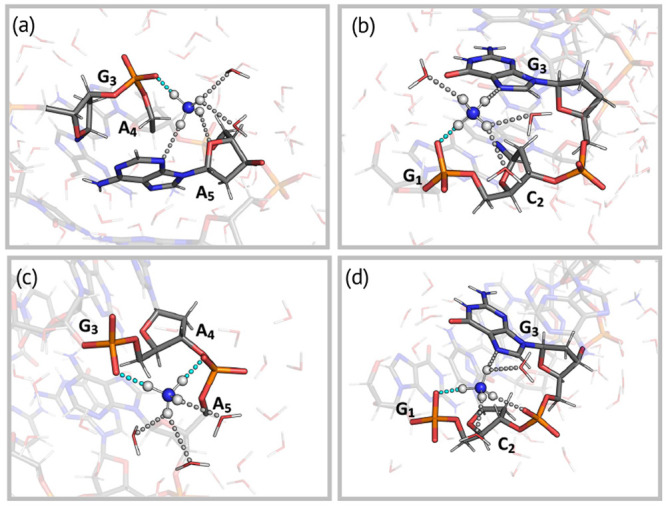
Snapshots of proton transfer configurations showing the interactions of the ammonium ion with the (a) G3-p-A4 (IIa-c), (b) C2-p-G3 (IId-e), (c) G3-p-A4-p-A5 (IIf-h), and (d) G1-p-C2-p-G3 (IIi-j) moieties. H-Bond interactions are shown as dashed lines. The H-bonds involved in the proton transfer are colored cyan.
MD Simulations of Complex I. Here, the heptamer is represented as dimethyl phosphate (DMP). First, we run 10 ns force field-based simulations at 300 K and 1 bar of ammonium and DMP (as ionic moieties) in water. Both are fully solvated, as shown by the plots of radial distribution functions (rdf’s) (Figure S1). Integration of the latter shows that the average number of waters surrounding the ammonium ion [hydration number (HN)] is 8, and the DMP solvation structure shows four to five water molecules in the first shell for each anionic oxygen atom. The total hydration number of DMP, estimated from the oxygen–phosphate rdf, counts 10 water molecules (Figure S1). The distance between the ammonium nitrogen and DMP phosphorus atom (d) varies widely from 4 Å (contact ion pairs) to 30 Å (size of the simulation box). The ion pairs are very transient in nature, lasting typically <1 ns (Figure S2).
Next, we let three droplets containing ∼800 water molecules (extracted from selected MD snapshots) evaporate by MD simulations at 300 K. We monitored the solvation state of a particular ion by the calculation of its HN as the instantaneous number of water molecules within its first solvation shell (see the Supporting Information for details on the definition of HN). Although most waters dissociate quickly from the droplet (Figure 1a and Figure S3), the ions remain fully solvated until ∼45 ns (eight coordinating water molecules). Further evaporation leads to only three coordinating water molecules (Figure 1b). The last water molecule dissociates after 102 ns at an increased temperature of 450 K. Distance d decreases as the droplet shrinks; transient ion pairs are formed several times during the dynamics. After ∼45 ns, the two ions form direct H-bonds (Figure 1c).
Figure 1.
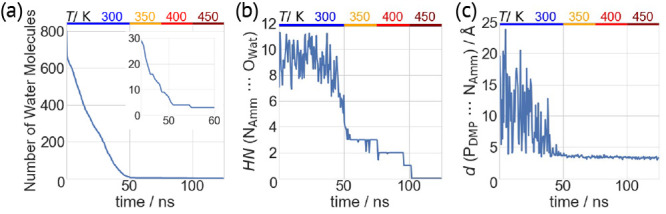
Gas phase MD simulations of complex I. Different quantities plotted as a function of simulated time for one simulation. (a) Number of water molecules present in the droplet. The inset is an enlarged view from 45 to 60 ns, when permanent ion pairs are formed. (b) Hydration number (HN) of the ammonium ion. (c) Distance d between the DMP phosphorus atom (PDMP) and the NH4+ nitrogen atom (NAmm).
QM/MM Free Energy Calculations of Complex I. After a 2.4 ps QM/MM MD re-equilibration of the system (see Figure S4), we carry out umbrella sampling (US)-based free energy calculations at 300 K with different water contents, from three (Ia) to four (Ib) and eight (Ic) water molecules (Figure 2). The collective variable (CV) used here is the difference between the N–H breaking bond distance and the O–H forming bond distance (Chart S1): negative and positive values of the CV are associated with ionic and neutral states, respectively. The free energy profile is well converged, as shown by its evolution with time (Figure S5).
In Ia, the proton is localized on DMP with poor hydration of the ammonia moiety [HN ∼ 2–3 (see Figure 2)]. When the HN is slightly increased (∼3.5), the proton is shared by the two moieties (Ib). Further increasing the HN (∼5 in Ic) leads to the stabilization of the ammonium ion (Figure 2). Thus, the protonation state is very sensitive to the local solvation environment: only if the ammonium is largely solvated does the cation keep the proton.
MD Simulations of Complex II. A 500 ns classical MD simulation, under the same conditions described above, is carried out on d(GpCpGpApApGpC) and six ammonium ions in an aqueous solution. The overall charge of the system is zero.
The results are similar to those of previous studies of the biomolecule alone in water (see the Supporting Information).22,23 In particular, the oligonucleotide retains its compact hairpin structure, which consists of a short B-DNA segment and a sharp turn within the d(G3A4A5) triloop with one noncanonical d(G·A) base pair.22,23 The radius of gyration (Rgyr) is 7.05 ± 0.06 Å (Figures S6 and S7). Three and two H-bonds are observed regularly for the two canonical base pairs (G1-C7 and C2-G6) and the noncanonical G3-A5 base pair, respectively.
The two ionic moieties are well separated. Only 1.4% of these are transient ion pairs (Figure S6), with an average hydration number of eight for both species (Figure S1).
Three water droplets with three ammonium ions (Figure S8, total charge of −3e, the main charge state observed in ESI-MS experiments),21 extracted by the MD simulations, underwent 225 ns classical MD simulations. These simulations provide the essential information about formation of the DNA–ammonium complex, which can then be studied as suitable candidates for proton transfer. As all simulations showed very similar features, only one is discussed here (details for the others in Figures S9–S13). During the first 150 ns (at 300 K), several water molecules strip out (Figure 3a), but the oligomer maintains its intramolecular H-bonds as in a water solution (Figures S11–S13). The ions are fully solvated within the first 100 ns, but in the next 50 ns, the ammonium HN decreases from 8 to 2. Simultaneously, the oligomer becomes more compact (Rgyr ∼ 6.9 Å compared to Rgyr ∼ 7.05 Å in solution). The two ions get closer as the water droplets shrink, as observed for I (Figure 3d). The ammonium ion forms two types of direct H-bonds with the phosphate moieties, associated with different hydration numbers (Figure 3e): with only one phosphate group [interaction mode (P) (Figure 4a,b and Figure S14a)] or with two phosphate groups from adjacent nucleotides [interaction mode (P2) (Figure 4c,d and Figure S14b)]. Such a behavior is consistent with the proposed charged residue model for the ESI evaporation mechanism.
Figure 3.
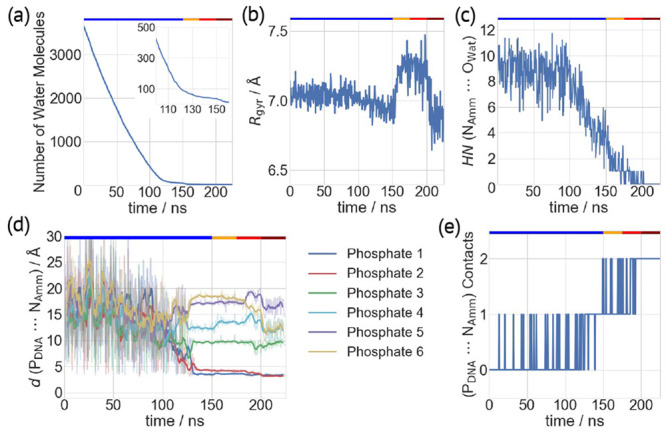
Gas phase MD simulations of complex II. Different quantities plotted as a function of simulated time. (a) Number of water molecules. The inset is an enlarged view from 100 to 160 ns. (b) Radius of gyration (Rgyr) of the DNA oligo. (c) HN values of NH4+ nitrogen atoms (NAmm) surrounded by water oxygen atoms (OWat). (d) Distances of the DNA phosphorus atoms (PDNA) and one NAmm atom. Data at the end of each 500 ps batch of MD simulations are shown as transparent lines, while their moving averages (window size of 10) are represented as bold lines. (e) Number of contacts of one NH4+ ion with the DNA phosphate groups. The top x-axes highlight simulation temperatures of 300 K (blue), 350 K (orange), 400 K (red), and 450 K (dark red).
After ∼150 ns, ∼30 water molecules are present, which are increasingly stabilized by the direct interactions with the polyanionic DNA oligo. To complete the evaporation simulation of the last water molecules, the temperature was increased to 450 K. The oligomer becomes even more compact (Rgyr ∼ 6.8 Å). The canonical and noncanonical base pairs may dissociate, forming other hydrogen bonds (see Figures S11–S13). Such a compact conformation is similar to that of the same system without the ammonium group.21
QM/MM MD Free Energy Calculations of Complex II. We consider here 10 systems, differing in the hydration level [from ∼80 to ∼30 water molecules (see Table 1)]a and in terms of whether the ammonium ions interact with one phosphate [interaction mode (P)] or two [interaction mode (P2)]. These structures are taken from the first part of the MD trajectories during which the evaporation process is simulated at a temperature of 300 K. We calculate the free energy associated with proton transfer in each mode.
Table 1. Complex II Featuring Interactions of Ammonium Ions with One Phosphate (interaction mode P) or Two (interaction mode P2) at Different Levels of Hydration, Undergoing QM/MM Simulationsa.
| NWat | HN (NAmm···OWat) | HN (PDNA···OWat) | interaction mode | interacting nucleotides | |
|---|---|---|---|---|---|
| IIa | 82 | 2.5 | 2.0 | P | G3-p-A4 |
| IIb | 55 | 2.5 | 1.5 | P | G3-p-A4 |
| IIc | 50 | 2.0 | 2.0 | P | G3-p-A4 |
| IId | 79 | 3.5 | 4.0 | P | G1-p-C2 |
| IIe | 64 | 4.0 | 0.5 | P | G1-p-C2 |
| IIf | 67 | 2.0 | 2.0/2.0 | P2 | G3-p-A4-p-A5 |
| IIg | 44 | 1.5 | 2.0/1.5 | P2 | G3-p-A4-p-A5 |
| IIh | 32 | 1.0 | 1.0/2.5 | P2 | G3-p-A4-p-A5 |
| IIi | 49 | 1.5 | 2.0/5.0 | P2 | G1-p-C2-p-G3 |
| IIj | 32 | 1.5 | 0.5/2.5 | P2 | G1-p-C2-p-G3 |
In the first case (Figure 4a), when HN ∼ 2.5, the proton is delocalized between the oligomer and the ammonium [IIa-b (Figure 5 and Figure S16)]. When HN ∼ 2, the proton is still delocalized between the two moieties but mostly sits on the oligomer [IIc (Figure 5)]. Thus, the decreasing level of solvation leads the proton toward the oligonucleotide, likely because of the lack of stabilization of the charged ammonium group from the surrounding water molecules.
Figure 5.
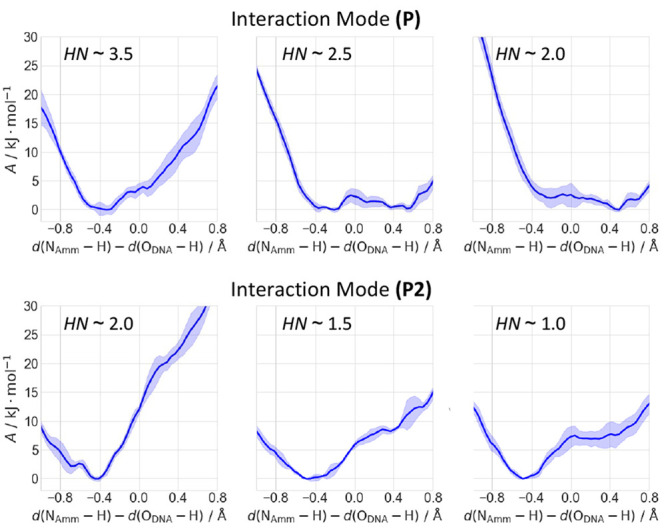
Free energy as a function of the difference in the bond breaking/forming NAmm–H and H–ODNA bond distances. Representative profiles of interaction mode P at different HNs (top), showing systems IId (left), IIa (middle), and IIc (right). Representative profiles of interaction mode P2 at different HNs (bottom), showing the protonation of the G3-p-A4 moiety in systems IIf (left), IIg (middle), and IIh (right). The complete set of free energy profiles is shown in Figure S16.
In the second case [IId-e (Figure 4b)], the ammonium cation is markedly more hydrated than in the first [HN ∼ 3.5–4.0 (see Table 1)]. As a result, the proton is now localized only on the ammonium group (highly stabilized by its solvation shell) and the oligomer is not protonated (Figure 5).b
In interaction mode P2, the ammonium group is less hydrated than in P. It interacts with the G3-p-A4-p-A5 moiety [IIf-h (Figure 4c)] or the G1-p-C2-p-G3 moiety [IIi-j (Figure 4d)].c In the first case, it can transfer the proton to either G3-p-A4 (phosphate “p3–4”) or A4-p-A5 (“p4–5”). When HN ∼ 2 (the largest value here), the proton is localized on the ammonium group. This contrasts with interaction mode P, in which the proton is delocalized. Thus, the interaction of the ammonium group with a second phosphate stabilizes the ionic state. Decreasing the HN slightly increases the probability of p3–4 being protonated (Figure 5 and Table 1; HN ∼ 1.5 for IIg, and HN ∼ 1 for IIh), while protonation on p4–5 remains unlikely (see the Supporting Information for further details). Thus, the decrease in the number of solvent interactions with the complex only slightly destabilizes the ionic state. In the second case, the proton is localized only at the ammonium group even when HN ∼ 1.5. The ionic state is, as described above, stabilized by water and the presence of an additional phosphate.
In conclusion, our simulations suggest that a low level of hydration leads to full protonation of the oligo in interaction mode P and causes an increase in the probability of being protonated in P2.
In N-ESI-MS experiments with DNA, the evaporation of the droplets leads eventually to protonated oligomers and ammonia.3,10,15 The molecular determinants of the process are not known. Here, we address this issue by multiscale simulations on the d(GpCpGpApApGpC) heptanucleotide, for which experimental N-ESI-MS data are available, as well as the model DMP, in the presence of ammonium counterions. The simulations of the model systems (Figure 2) clearly indicate the impact on hydration on the proton transfer free energy profile. The proton is transferred to DMP if the ammonium is not fully hydrated. Inclusion of nuclear quantum effects is expected to have a minor impact on the shape of the free energy profiles in comparison to hydration. MD simulations of the actual heptanucleotide show that the ammonium forms two different interactions with the biomolecule, involving either one (P in Figure 4) or two phosphates (P2). Both underwent QM/MM US-based free energy calculations. For P, in which only one phosphate interacts with the ammonium, we find that as soon as the level of ammonium hydration is sufficiently low the proton is transferred to reduce the total charge state of the oligonucleotide. For P2, in which two phosphates interact with the ammonium ion, the oligomer is still charged for poorly hydrated ammonium ions; however, the probability of being protonated does increase with a decrease in the level of hydration of the cation. This suggests that the DNA oligomer is eventually protonated when fully dehydrated, consistent with the experimental observation of the reduced charge state of the DNA oligo along with the loss of NH3.15,21 Finally, the approach could also be straightforwardly adapted to study the protonation of peptides and proteins in N-ESI-MS.
Computational Methods
Force Fields. The parmBSC124 and TIP3P25 force fields were used for the biomolecules (I and II) and water molecules, respectively. Atomic partial charges for DMP and ammonium ions were derived to be compatible with the employed AMBER force field by a RESP fit at the HF/6-31G* level of theory.26,27 Bonded and van der Waals parameters for the ammonium ions were taken from the AMBER parm99 library.28 The same force field was used for the MM part in the QM/MM calculations.
MD in an Aqueous Solution. Model I consists of DMP and one ammonium ion in a 43.5 Å × 41.9 Å × 43.2 Å water box, containing 5646 atoms, while II consists of the heptamer and six ammonium ions in a 66.7 Å × 75.9 Å × 79.1 Å water box, containing 39 714 atoms. The initial structures were taken from the model of Protein Data Bank entry 1PQT(22) and solvated with the GROMACS solvate module.29
The electrostatic interactions were calculated with the smooth particle mesh Ewald algorithm using a real space cutoff of 10 Å.30,31 The same cutoff was employed for the van der Waals interactions. The center of mass motion was removed every 100 steps. Bond distances involving covalently bound hydrogen atoms were constrained with the LINCS algorithm.32 Periodic boundary conditions and a time step of 1 fs were used throughout. The systems first underwent 5000 steps of steepest descent minimization. Then, they were heated to 300 K with 5 ns simulations at a constant volume using the velocity rescaling thermostat algorithm with a coupling constant τ of 0.1 ps.33 Next, the systems’ density was equilibrated for 5 ns by performing NPT simulations employing the same thermostat algorithm as in the previous step and the Berendsen barostat algorithm (coupling constant of 1 ps) to achieve a pressure of 1 bar.34 Finally, production simulations were carried out within the NPT ensemble at 300 K and 1 bar. For this purpose, the Nosé–Hoover thermostat35,36 and Parrinello–Rahman barostat37 were employed with coupling constants of 0.5 and 1.0 ps, respectively. We collected 10 and 500 ns of data for the (I) DMP and (II) DNA systems in the water solution, respectively. The following quantities were determined as a function of time: root-mean-square deviation, radius of gyration, and hydrogen bond interactions of the DNA oligo, the distance between NH4+ ions and phosphate groups for the ion pair characterization, and radial distribution functions for the NH4+ ions and phosphate groups with respect to water oxygen atoms (see the Supporting Information for details).
MD and QM/MM in the Gas Phase. The initial structures were taken from the last snapshots of the MD simulations. For I (II), we selected three droplets of approximately 800 (3680) water molecules within a radius of 15 Å (30 Å) around the center of mass of the biomolecules. They also turned out to contain one and three ammonium ions and to bear charges of 0 and −3 for I and II, respectively. Electrostatic interactions were treated by direct Coulomb summation, whereby no cutoff was applied. The same held true for the Lennard-Jones interactions. Both the center of mass translational and rotational velocities were removed every 100 steps. The target temperature was controlled by a velocity rescaling algorithm (τ = 0.1 ps).33 The systems underwent 50 and 150 ns of NVT simulations at 300 K, following the protocol of refs (20) and (38), reassigning the velocities at the beginning of each batch according to the Maxwell–Boltzmann distribution and removing the water molecules located ≥60 Å from the center of mass of the biomolecules at the end of each simulation. The last sticky water molecules were then evaporated by three consecutive 25 ns simulations at 350, 400, and 450 K. The same quantities were monitored as described above, along with the HN of the ammonium and of the phosphate moieties (see the Supporting Information for details).
The initial QM/MM configurations were taken from the gas phase MD simulations, in which ion pairs between NH4+ and DNA were observed (see the Supporting Information for the definition of ion pairs). The systems were inserted in a large box with dimensions of 200 Å × 200 Å × 200 Å. In I, the NH4+ and DMP ions were treated at the QM level while the water molecules were described at the MM level. In II, the ammonium ion and the DNA backbone atoms, which were involved in the studied proton transfer, were enclosed in the QM region [28–41 atoms (Figure S15)]. The covalent C4′–C5′ and glycosidic bonds were cut, and the dangling bonds saturated with hydrogen link atoms. The QM problem was solved within the density functional theory (see below). Born–Oppenheimer MD and umbrella sampling (US)39 were carried out using a time step of 0.5 fs. We used the WHAM analysis to calculate the free energy from the US calculations.40
For the simulations of I, a plane wave basis setup to a cutoff of 100 Ry was used,41 with Troullier–Martins pseudopotentials describing the valence shell–core electron interactions.42 The PBE exchange-correlation functional was employed.43 Dispersion corrections were not included, but these are expected to have a minor impact on the proton transfer energetics for these small systems. Periodic images were decoupled from the unit cell with the Martyna–Tuckerman solver.44 The system was heated at a rate of 0.12 K fs–1 to 300 K in 2.42 ps using the Berendsen thermostat (coupling strength of 5000 au)34 and then equilibrated for an additional 2.42 ps using the Nosé–Hoover thermostat (coupling frequency of 3500 cm–1).35,36 The CV for the US calculations was chosen as the difference distance of the breaking/forming NAmm–H and H–ODMP bonds (Chart S1). Initial configurations were generated by performing a 2.66 ps simulation, scanning the CV with a moving restraint. Then, 11 equidistant windows of 14.5 ps in the interval [−1.0; 1.0] Å were simulated. A harmonic restraint with a force constant k of 40 kJ mol–1 Å–2 was applied. The first 1.1 ps was discarded from the analysis.
For the simulations of II, the quantum problem was solved using the mixed Gaussian-plane wave density functional theory approach.45,46 We employed the PBE-D3(BJ)43,47,48 functional with the DZVP-MOLOPT basis set49 and GTH pseudopotentials.50 Four grids were used for the plane wave expansion. A density cutoff of 500 Ry was used for the finest grid, and a relative cutoff was set to 80 Ry to specify the coarser grids.46 The QM region was electrostatically coupled to the MM potential within the Gaussian expansion of the electrostatic potential approach.51,52 After a short minimization, we heated the system to 300 K within 2.5 ps using the velocity rescale algorithm (τ = 0.1 ps).33 Next, we performed equilibration QM/MM MD at 300 K for 2.5 ps. We finally employed umbrella sampling to predict the free energy for the proton transfer using the same CV as for I. Ten equidistant windows of 30.0 ps in the interval [−1.0; 0.8] Å were used (k = 50 kJ mol–1 Å–2). The first 5 ps was discarded from the analysis.
The classical MD simulations and the MM calculations in the QM/MM calculations were performed using the GROMACS program package.29 The QM calculations were performed either by CP2K46 (for II, using the API QM/MM interface of GROMACS) or by CPMD53 (for I, using the MiMiC QM/MM interface).54−56 The PLUMED plugin was used to introduce the biases in the umbrella sampling QM/MM simulations.57,58
Acknowledgments
This work was supported by the BioExcel CoE (www.bioexcel.eu), a project funded by European Union Contract H2020-INFRAEDI-02-2018-823830. M.P. and P.C. acknowledge funding from the European Union’s Horizon 2020 Framework Programme for Research and Innovation under the Specific Grant Agreement No. 945539 (Human Brain Project SGA3).
Supporting Information Available
The Supporting Information is available free of charge at https://pubs.acs.org/doi/10.1021/acs.jpclett.2c03100.
Details about the calculated properties, MD analysis of the solution structure of model II, additional analysis of the gas phase MD simulations of both models, details of QM/MM MD re-equilibration, and time evolution of all simulated free energy profiles (PDF)
Initial structures for QM/MM MD simulations (ZIP)
The authors declare no competing financial interest.
Footnotes
As expected, the larger the number of water molecules, the higher the hydration number values for the ammonium ion and the DNA tend to be.
This discussion assumes that the influence of the different nucleobases on the free energy profile is negligible with respect to the influence of the HN.
IIi and IIj are formed during the QM/MM MD equilibration phase (see the Supporting Information).
Supplementary Material
References
- Baker E. S.; Dupuis N. F.; Bowers M. T. DNA Hairpin, Pseudoknot, and Cruciform Stability in a Solvent-Free Environment. J. Phys. Chem. B 2009, 113, 1722–1727. 10.1021/jp807529m. [DOI] [PubMed] [Google Scholar]
- Clemmer D. E.; Jarrold M. F. Ion Mobility Measurements and Their Applications to Clusters and Biomolecules. J. Mass Spectrom. 1997, 32, 577–592. . [DOI] [Google Scholar]
- Largy E.; König A.; Ghosh A.; Ghosh D.; Benabou S.; Rosu F.; Gabelica V. Mass Spectrometry of Nucleic Acid Noncovalent Complexes. Chem. Rev. 2022, 122, 7720–7839. 10.1021/acs.chemrev.1c00386. [DOI] [PubMed] [Google Scholar]
- van Dyck J. F.; Burns J. R.; le Huray K. I. P.; Konijnenberg A.; Howorka S.; Sobott F. Sizing up DNA Nanostructure Assembly with Native Mass Spectrometry and Ion Mobility. Nat. Commun. 2022, 13, 3610. 10.1038/s41467-022-31029-5. [DOI] [PMC free article] [PubMed] [Google Scholar]
- Barth M.; Schmidt C. Native Mass Spectrometry—A Valuable Tool in Structural Biology. J. Mass Spectrom. 2020, 55, e4578 10.1002/jms.4578. [DOI] [PubMed] [Google Scholar]
- Chance M. R.; Farquhar E. R.; Yang S.; Lodowski D. T.; Kiselar J. Protein Footprinting: Auxiliary Engine to Power the Structural Biology Revolution. J. Mol. Biol. 2020, 432, 2973–2984. 10.1016/j.jmb.2020.02.011. [DOI] [PMC free article] [PubMed] [Google Scholar]
- Leney A. C.; Heck A. J. R. Native Mass Spectrometry: What Is in the Name?. J. Am. Soc. Mass Spectrom. 2017, 28, 5–13. 10.1007/s13361-016-1545-3. [DOI] [PMC free article] [PubMed] [Google Scholar]
- Tamara S.; den Boer M. A.; Heck A. J. R. High-Resolution Native Mass Spectrometry. Chem. Rev. 2022, 122, 7269–7326. 10.1021/acs.chemrev.1c00212. [DOI] [PMC free article] [PubMed] [Google Scholar]
- Gaskell S. J. Electrospray: Principles and Practice. J. Mass Spectrom. 1997, 32, 677–688. . [DOI] [Google Scholar]
- Grégoire G.Transferring Nucleic Acids to the Gas Phase. In Nucleic Acids in the Gas Phase; Springer: Heidelberg, Germany, 2014; pp 21–54. [Google Scholar]
- Fernandez de la Mora J. Electrospray Ionization of Large Multiply Charged Species Proceeds via Dole’s Charged Residue Mechanism. Anal. Chim. Acta 2000, 406, 93–104. 10.1016/S0003-2670(99)00601-7. [DOI] [Google Scholar]
- Konermann L.; Ahadi E.; Rodriguez A. D.; Vahidi S. Unraveling the Mechanism of Electrospray Ionization. Anal. Chem. 2013, 85, 2–9. 10.1021/ac302789c. [DOI] [PubMed] [Google Scholar]
- Hunter E. P. L.; Lias S. G. Evaluated Gas Phase Basicities and Proton Affinities of Molecules: An Update. J. Phys. Chem. Ref. Data 1998, 27, 413–656. 10.1063/1.556018. [DOI] [Google Scholar]
- Lum R. C.; Grabowski J. J. Trimethyl Phosphate: The Intrinsic Reactivity of Carbon versus Phosphorus Sites with Anionic Nucleophiles. J. Am. Chem. Soc. 1992, 114, 8619–8627. 10.1021/ja00048a041. [DOI] [Google Scholar]
- Stults J. T.; Marsters J. C.; Carr S. A. Improved Electrospray Ionization of Synthetic Oligodeoxynucleotides. Rapid Commun. Mass Spectrom. 1991, 5, 359–363. 10.1002/rcm.1290050806. [DOI] [Google Scholar]
- Arcella A.; Portella G.; Orozco M.. Structure of Nucleic Acids in the Gas Phase. In Nucleic Acids in the Gas Phase; Springer: Heidelberg, Germany, 2014; pp 55–75. [Google Scholar]
- Rueda M.; Kalko S. G.; Luque F. J.; Orozco M. The Structure and Dynamics of DNA in the Gas Phase. J. Am. Chem. Soc. 2003, 125, 8007–8014. 10.1021/ja0300564. [DOI] [PubMed] [Google Scholar]
- Arcella A.; Portella G.; Ruiz M. L.; Eritja R.; Vilaseca M.; Gabelica V.; Orozco M. Structure of Triplex DNA in the Gas Phase. J. Am. Chem. Soc. 2012, 134, 6596–6606. 10.1021/ja209786t. [DOI] [PubMed] [Google Scholar]
- Rueda M.; Luque F. J.; Orozco M. G-Quadruplexes Can Maintain Their Structure in the Gas Phase. J. Am. Chem. Soc. 2006, 128, 3608–3619. 10.1021/ja055936s. [DOI] [PubMed] [Google Scholar]
- Porrini M.; Rosu F.; Rabin C.; Darré L.; Gómez H.; Orozco M.; Gabelica V. Compaction of Duplex Nucleic Acids upon Native Electrospray Mass Spectrometry. ACS Cent. Sci. 2017, 3, 454–461. 10.1021/acscentsci.7b00084. [DOI] [PMC free article] [PubMed] [Google Scholar]
- Arcella A.; Dreyer J.; Ippoliti E.; Ivani I.; Portella G.; Gabelica V.; Carloni P.; Orozco M. Structure and Dynamics of Oligonucleotides in the Gas Phase. Angew. Chem., Int. Ed. 2015, 54, 467–471. 10.1002/anie.201406910. [DOI] [PubMed] [Google Scholar]
- Padrta P.; Štefl R.; Králík L.; Žídek L.; Sklenář V. Refinement of d(GCGAAGC) Hairpin Structure Using One- and Two-Bond Residual Dipolar Couplings. J. Biomol. NMR 2002, 24, 1–14. 10.1023/A:1020632900961. [DOI] [PubMed] [Google Scholar]
- Portella G.; Orozco M. Multiple Routes to Characterize the Folding of a Small DNA Hairpin. Angew. Chem., Int. Ed. 2010, 49, 7673–7676. 10.1002/anie.201003816. [DOI] [PubMed] [Google Scholar]
- Ivani I.; Dans P. D.; Noy A.; Pérez A.; Faustino I.; Hospital A.; Walther J.; Andrio P.; Goñi R.; Balaceanu A.; Portella G.; Battistini F.; Gelpí J. L.; González C.; Vendruscolo M.; Laughton C. A.; Harris S. A.; Case D. A.; Orozco M. Parmbsc1: A Refined Force Field for DNA Simulations. Nat. Methods 2016, 13, 55–58. 10.1038/nmeth.3658. [DOI] [PMC free article] [PubMed] [Google Scholar]
- Jorgensen W. L.; Chandrasekhar J.; Madura J. D.; Impey R. W.; Klein M. L. Comparison of Simple Potential Functions for Simulating Liquid Water. J. Chem. Phys. 1983, 79, 926–935. 10.1063/1.445869. [DOI] [Google Scholar]
- Bayly C. I.; Cieplak P.; Cornell W.; Kollman P. A. A Well-Behaved Electrostatic Potential Based Method Using Charge Restraints for Deriving Atomic Charges: The RESP Model. J. Phys. Chem. 1993, 97, 10269–10280. 10.1021/j100142a004. [DOI] [Google Scholar]
- Vanquelef E.; Simon S.; Marquant G.; Garcia E.; Klimerak G.; Delepine J. C.; Cieplak P.; Dupradeau F.-Y. R.E.D. Server: A Web Service for Deriving RESP and ESP Charges and Building Force Field Libraries for New Molecules and Molecular Fragments. Nucleic Acids Res. 2011, 39, W511–W517. 10.1093/nar/gkr288. [DOI] [PMC free article] [PubMed] [Google Scholar]
- Wang J.; Cieplak P.; Kollman P. A. How Well Does a Restrained Electrostatic Potential (RESP) Model Perform in Calculating Conformational Energies of Organic and Biological Molecules?. J. Comput. Chem. 2000, 21, 1049–1074. . [DOI] [Google Scholar]
- Abraham M. J.; Murtola T.; Schulz R.; Páll S.; Smith J. C.; Hess B.; Lindahl E. GROMACS: High Performance Molecular Simulations through Multi-Level Parallelism from Laptops to Supercomputers. SoftwareX 2015, 1, 19–25. 10.1016/j.softx.2015.06.001. [DOI] [Google Scholar]
- Darden T.; York D.; Pedersen L. Particle Mesh Ewald: An N ·log(N) Method for Ewald Sums in Large Systems. J. Chem. Phys. 1993, 98, 10089–10092. 10.1063/1.464397. [DOI] [Google Scholar]
- Essmann U.; Perera L.; Berkowitz M. L.; Darden T.; Lee H.; Pedersen L. G. A Smooth Particle Mesh Ewald Method. J. Chem. Phys. 1995, 103, 8577–8593. 10.1063/1.470117. [DOI] [Google Scholar]
- Hess B.; Bekker H.; Berendsen H. J. C.; Fraaije J. G. E. M. LINCS: A Linear Constraint Solver for Molecular Simulations. J. Comput. Chem. 1997, 18, 1463–1472. . [DOI] [Google Scholar]
- Bussi G.; Donadio D.; Parrinello M. Canonical Sampling through Velocity Rescaling. J. Chem. Phys. 2007, 126, 014101. 10.1063/1.2408420. [DOI] [PubMed] [Google Scholar]
- Berendsen H. J. C.; Postma J. P. M.; van Gunsteren W. F.; DiNola A.; Haak J. R. Molecular Dynamics with Coupling to an External Bath. J. Chem. Phys. 1984, 81, 3684–3690. 10.1063/1.448118. [DOI] [Google Scholar]
- Nosé S. A Molecular Dynamics Method for Simulations in the Canonical Ensemble. Mol. Phys. 1984, 52, 255–268. 10.1080/00268978400101201. [DOI] [Google Scholar]
- Hoover W. G. Canonical Dynamics: Equilibrium Phase-Space Distributions. Phys. Rev. A 1985, 31, 1695–1697. 10.1103/PhysRevA.31.1695. [DOI] [PubMed] [Google Scholar]
- Parrinello M.; Rahman A. Polymorphic Transitions in Single Crystals: A New Molecular Dynamics Method. J. Appl. Phys. 1981, 52, 7182–7190. 10.1063/1.328693. [DOI] [Google Scholar]
- Metwally H.; McAllister R. G.; Konermann L. Exploring the Mechanism of Salt-Induced Signal Suppression in Protein Electrospray Mass Spectrometry Using Experiments and Molecular Dynamics Simulations. Anal. Chem. 2015, 87, 2434–2442. 10.1021/ac5044016. [DOI] [PubMed] [Google Scholar]
- Torrie G. M.; Valleau J. P. Nonphysical Sampling Distributions in Monte Carlo Free-Energy Estimation: Umbrella Sampling. J. Comput. Phys. 1977, 23, 187–199. 10.1016/0021-9991(77)90121-8. [DOI] [Google Scholar]
- Kumar S.; Rosenberg J. M.; Bouzida D.; Swendsen R. H.; Kollman P. A. The Weighted Histogram Analysis Method for Free-Energy Calculations on Biomolecules. I. The Method. J. Comput. Chem. 1992, 13, 1011–1021. 10.1002/jcc.540130812. [DOI] [Google Scholar]
- Marx D.; Hutter J.. Ab Initio Molecular Dynamics: Basic Theory and Advanced Methods; Cambridge University Press: New York, 2009. [Google Scholar]
- Troullier N.; Martins J. L. Efficient Pseudopotentials for Plane-Wave Calculations. Phys. Rev. B 1991, 43, 1993–2006. 10.1103/PhysRevB.43.1993. [DOI] [PubMed] [Google Scholar]
- Perdew J. P.; Burke K.; Ernzerhof M. Generalized Gradient Approximation Made Simple. Phys. Rev. Lett. 1996, 77, 3865–3868. 10.1103/PhysRevLett.77.3865. [DOI] [PubMed] [Google Scholar]
- Martyna G. J.; Tuckerman M. E. A Reciprocal Space Based Method for Treating Long Range Interactions in Ab Initio and Force-Field-Based Calculations in Clusters. J. Chem. Phys. 1999, 110, 2810–2821. 10.1063/1.477923. [DOI] [Google Scholar]
- Lippert G.; Parrinello M.; Hutter J. A Hybrid Gaussian and Plane Wave Density Functional Scheme. Mol. Phys. 1997, 92, 477–488. 10.1080/00268979709482119. [DOI] [Google Scholar]
- Kühne T. D.; Iannuzzi M.; del Ben M.; Rybkin V. v.; Seewald P.; Stein F.; Laino T.; Khaliullin R. Z.; Schütt O.; Schiffmann F.; Golze D.; Wilhelm J.; Chulkov S.; Bani-Hashemian M. H.; Weber V.; Borštnik U.; Taillefumier M.; Jakobovits A. S.; Lazzaro A.; Pabst H.; Müller T.; Schade R.; Guidon M.; Andermatt S.; Holmberg N.; Schenter G. K.; Hehn A.; Bussy A.; Belleflamme F.; Tabacchi G.; Glöß A.; Lass M.; Bethune I.; Mundy C. J.; Plessl C.; Watkins M.; VandeVondele J.; Krack M.; Hutter J. CP2K: An Electronic Structure and Molecular Dynamics Software Package - Quickstep: Efficient and Accurate Electronic Structure Calculations. J. Chem. Phys. 2020, 152, 194103. 10.1063/5.0007045. [DOI] [PubMed] [Google Scholar]
- Grimme S.; Antony J.; Ehrlich S.; Krieg H. A Consistent and Accurate Ab Initio Parametrization of Density Functional Dispersion Correction (DFT-D) for the 94 Elements H-Pu. J. Chem. Phys. 2010, 132, 154104. 10.1063/1.3382344. [DOI] [PubMed] [Google Scholar]
- Grimme S.; Ehrlich S.; Goerigk L. Effect of the Damping Function in Dispersion Corrected Density Functional Theory. J. Comput. Chem. 2011, 32, 1456–1465. 10.1002/jcc.21759. [DOI] [PubMed] [Google Scholar]
- VandeVondele J.; Hutter J. Gaussian Basis Sets for Accurate Calculations on Molecular Systems in Gas and Condensed Phases. J. Chem. Phys. 2007, 127, 114105. 10.1063/1.2770708. [DOI] [PubMed] [Google Scholar]
- Goedecker S.; Teter M.; Hutter J. Separable Dual-Space Gaussian Pseudopotentials. Phys. Rev. B 1996, 54, 1703–1710. 10.1103/PhysRevB.54.1703. [DOI] [PubMed] [Google Scholar]
- Laino T.; Mohamed F.; Laio A.; Parrinello M. An Efficient Real Space Multigrid QM/MM Electrostatic Coupling. J. Chem. Theory Comput. 2005, 1, 1176–1184. 10.1021/ct050123f. [DOI] [PubMed] [Google Scholar]
- Laino T.; Mohamed F.; Laio A.; Parrinello M. An Efficient Linear-Scaling Electrostatic Coupling for Treating Periodic Boundary Conditions in QM/MM Simulations. J. Chem. Theory Comput. 2006, 2, 1370–1378. 10.1021/ct6001169. [DOI] [PubMed] [Google Scholar]
- CPMD, ver. 4.3; http://www.cpmd.org/, copyright IBM Corp. 1990–2019, copyright MPI für Festkörperforschung Stuttgart 1997–2001.
- Olsen J. M. H.; Bolnykh V.; Meloni S.; Ippoliti E.; Bircher M. P.; Carloni P.; Rothlisberger U. MiMiC: A Novel Framework for Multiscale Modeling in Computational Chemistry. J. Chem. Theory Comput. 2019, 15, 3810–3823. 10.1021/acs.jctc.9b00093. [DOI] [PubMed] [Google Scholar]
- Bolnykh V.; Olsen J. M. H.; Meloni S.; Bircher M. P.; Ippoliti E.; Carloni P.; Rothlisberger U. Extreme Scalability of DFT-Based QM/MM MD Simulations Using MiMiC. J. Chem. Theory Comput. 2019, 15, 5601–5613. 10.1021/acs.jctc.9b00424. [DOI] [PubMed] [Google Scholar]
- Bolnykh V.; Rossetti G.; Rothlisberger U.; Carloni P. Expanding the Boundaries of Ligand–Target Modeling by Exascale Calculations. Wiley Interdiscip. Rev.: Comput. Mol. Sci. 2021, 11, e1535 10.1002/wcms.1535. [DOI] [Google Scholar]
- Tribello G. A.; Bonomi M.; Branduardi D.; Camilloni C.; Bussi G. PLUMED 2: New Feathers for an Old Bird. Comput. Phys. Commun. 2014, 185, 604–613. 10.1016/j.cpc.2013.09.018. [DOI] [Google Scholar]
- Promoting Transparency and Reproducibility in Enhanced Molecular Simulations. Nat. Methods 2019, 16, 670–673. 10.1038/s41592-019-0506-8. [DOI] [PubMed] [Google Scholar]
Associated Data
This section collects any data citations, data availability statements, or supplementary materials included in this article.