Abstract
Clostridioides difficile (C. difficile) infection (CDI) is the primary cause of nosocomial antibiotic-associated diarrhea, with high recurrence rates following initial antibiotic treatment regimens. Restoration of the host gut microbiome through probiotic therapy is under investigation to reduce recurrence. Current in vitro methods to assess C. difficile deactivation by probiotic microorganisms are based on C. difficile growth inhibition, but the cumbersome and time-consuming nature of the assay limits the number of assessed permutations. Phenotypic alterations to the C. difficile cellular structure upon interaction with probiotics can potentially enable rapid assessment of the inhibition without the need for extended culture. Because supernatants from cultures of commensal microbiota reflect the complex metabolite milieu that deactivates C. difficile, we explore coculture of C. difficile with an optimal dose of supernatants from probiotic culture to speed growth inhibition assays and enable correlation with alterations to its prolate ellipsoidal structure. Based on sensitivity of electrical polarizability to C. difficile cell shape and subcellular structure, we show that the inhibitory effect of Lactobacillus spp. supernatants on C. difficile can be determined based on the positive dielectrophoresis level within just 1 h of culture using a highly toxigenic strain and a clinical isolate, whereas optical and growth inhibition measurements require far greater culture time. We envision application of this in vitro coculture model, in conjunction with dielectrophoresis, to rapidly screen for potential probiotic combinations for the treatment of recurrent CDI.
Keywords: Microbiota, Probiotics, Dielectrophoresis, Microfluidics, Diagnostics
Graphical Abstract
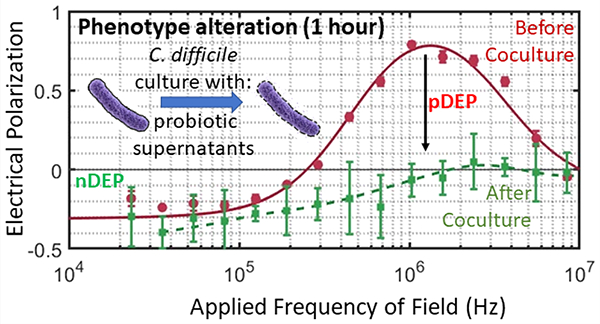
The human gut is colonized by a diverse community of microorganisms that work in concert with their host to resist colonization by opportunistic pathogens.1 Loss of microbial diversity in the gut due to antibiotic administration or aging has been linked to the impairment of immune function and the onset of various enteric infections.2–4 Clostridioides difficile (C. difficile) infection (CDI), which is the primary cause of nosocomial diarrhea, occurs due to overgrowth of C. difficile following interruption of the host gut microbiome. While the disease can be treated with standard antibiotic regimens, a significant subset of patients (~25%) exhibit recurrent CDI (rCDI), with 35–65% of those individuals experiencing multiple episodes of rCDI.5–7 CDI is responsible for about 500 000 cases and 29 000 fatalities per year in the United States, as well as billions of dollars in associated healthcare costs.8
Antibiotic administration for treatment of CDI, while effective in treating the initial infection, also causes collateral damage to the recovering host microbiome, leading to rCDI. Current CDI research is therefore focused on therapies that limit collateral damage,9 including probiotics that help restore the inhibitory interactions of commensal bacteria on C. difficile.10 The availability of in vitro methods to rapidly screen for interaction of probiotics with C. difficile11 can help focus the probiotic permutations considered for in vivo studies;12,13 but the growth inhibition assays currently used for this purpose are time-consuming.14,15 Commensal bacteria can influence C. difficile either through secretions16 or by competition for common nutrients.17 Hence, the supernatant from the culture of commensal bacteria can reflect the complex metabolic milieu that mediates their inhibitory interactions on C. difficile.18
In this work, we seek to rapidly identify the inhibition of C. difficile by probiotic microorganisms based on in vitro culture of C. difficile with an optimal dose of cell-free supernatants from the probiotic culture and explore correlation of the growth inhibition to cell structure alterations that occur well before growth inhibition. While prior work has explored correlation of bacterial shape alterations to antibiotic susceptibility,19 the effect of probiotics is more subtle, thereby requiring more sensitive quantification methods. Furthermore, because bacterial cells can undergo a wide variety of structural changes,20,21 image-based analysis is often not sufficient for quantifying the myriad modifications. In this context, because electrical polarizability is highly sensitive to alterations in the shape and subcellular structure of bacteria,22 the level of positive dielectrophoresis (pDEP) or translation of polarized cells to high field regions of a microfluidic device can be used for quantifying the structural alterations.23 In prior work, pDEP has been used to fix bacterial cells at well-defined positions along the focal plane for imaging to enable accurate estimation of cell length and elongation rate after antibiotic treatment.24 Electrical polarizability is especially significant for C. difficile due to the high aspect ratio of its prolate ellipsoidal structure (major to minor axis ~5) that causes a sharp crossover to strong pDEP behavior.25 We previously utilized this characteristic DEP behavior to rapidly detect antibiotic susceptibility26 and S-layer induced alterations to the cell wall capacitance27 of C. difficile, but this technique is applied here for the first time to screen probiotics for deactivation of C. difficile based on structural alterations after in vitro culture with probiotic supernatants. Specifically, using the cell-free supernatant obtained after a critical level of probiotic culture as the coculture model with C. difficile, we are able to speed its inhibitory effects, as assessed by growth inhibition and cell structure alterations to a toxigenic C. difficile strain (VPI10463) and a binary toxin (or BI) producing clinical isolate (TL24). In this manner, we show that the shape and subcellular phenotypic changes to C. difficile can be detected based on the pDEP level within just 1 h of coculture, whereas optical and growth inhibition measurements require at least 4 h, and transwell coculture requires >24 h. We envision that this electrophenotyping method can rapidly gauge alterations to C. difficile strains for enabling the screening of a wider permutation of probiotics.
MATERIALS AND METHODS
Bacterial Strains.
A highly toxigenic C. difficile (HTCD) strain: VPI10463 (ATCC, Manassas, VA) and a clinical isolate TL24 (University of Virginia)28 that is binary toxin secreting (BI) were used in all experiments. Saccharomyces boulardii (Swanson Health Products, Fargo, ND), Lactobacillus acidophilus (Swanson Health Products), Lactobacillus casei ss. shirtota (Yakult Honsha, Tokyo, Japan), Lactobacillus rhamnosus (Swanson Health Products), and Bifidobacterium longum ss. infantis (Align, Proctor and Gamble, Cincinnati, OH) were isolated from commercial probiotic products. Strains were cultured under anaerobic conditions using a Bactron anaerobic chamber (Sheldon Manufacturing, United States) for 48 h until they reached stationary phase. C. difficile strains and B. longum were grown using BHI medium, Lactobacillus strains using MRS broth, Saccharomyces using YPD broth (Becton Dickinson, United States).
C. difficile Coculture with Probiotic Supernatant.
As shown in the experimental timeline in Figure 1, probiotic bacterial strains were centrifuged at 5000 rpm for 10 min to pellet bacteria so that sterile filtered supernatant (0.2 μm syringe filter) from each strain could be used for coculture. The supernatant was mixed in equal parts with fresh BHI to start a new culture with either the HTCD or BI C. difficile strain. Growth was monitored every 20 min for 24 h by measuring absorbance at 589 nm using a Cerillo Optoreader (Cerillo Inc., Charlottesville, VA, United States).
Figure 1.
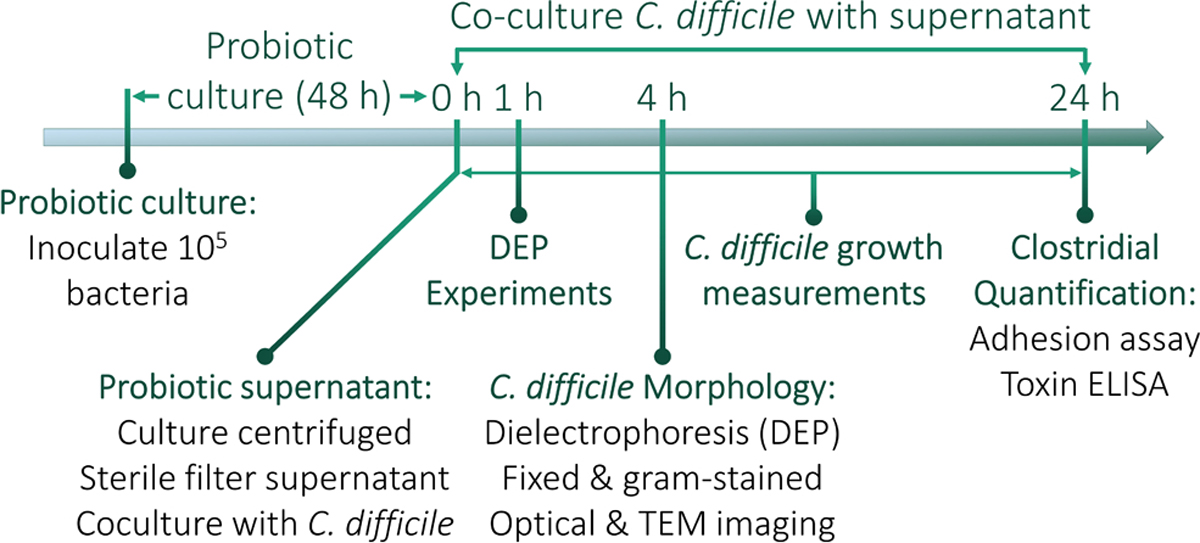
Experimental timeline for coculture and analysis. Probiotic strains are inoculated and grown to stationary phase, with the OD600 measured after 48 h to quantify their growth.
Toxin Assay.
A Techlab toxin A/B ELISA (Techlab, United States) was used to determine toxin secretion from cocultured bacteria after 24 h of supernatant culture. Absorbance was read at 450 nm and blanked against 620 nm.
Host Cell Adhesion.
Twenty-four hours after coculture, C. difficile strains were centrifuged (5000 rpm for 10 min) with the supernatant drawn and resuspended in PBS twice to wash away any residual toxin. Cultures were resuspended in prereduced PBS to adjust absorbance to 1.0 at 600 nm to normalize bacterial cell concentration. Caco-2 cells (ATCC) grown to confluence in a 6 well plate were washed 2× to remove any residual media from antibiotics and resuspended in 1 mL prereduced in high glucose Dulbecco’s Modified Eagle Medium (DMEM) (Gibco). A 10 μL aliquot of the C. difficile coculture sample was added to each well and cells with bacteria were incubated anaerobically at 37 °C for 3 h. Cell media was drawn off and cells were washed 3x in prereduced PBS to remove any nonadherent C. difficile. Cells were resuspended in 1 mL of PBS and scraped off the bottom of the plate, vortexed to mix. 10 μL of this suspension was serially diluted and streaked on BHI agar plates for 24 h to determine the CFU/mL.
Dielectrophoresis Analysis.
C. difficile cells from the supernatant of the coculture were taken after 1 and 4 h to be analyzed by DEP. Bacterial cells were centrifuged and resuspended in prereduced DI water (2×) to wash away any remaining salt from the bacterial media. The cells were resuspended in sufficient DI water to adjust absorbance to 1.0 at 600 nm for normalizing bacterial cell concentration. Media conductivity was then adjusted to 100 μS/cm, and DEP spectra were acquired using the 3DEP reader (DEPtech, Uckfield, UK) with a recording interval set to 30 s at 10 Vpp with data collected over 20 points between 50 kHz to 45 MHz. Based on this, the average relative DEP force at each frequency was obtained by analyzing at least 5 different measurements, and the results were repeated 3 times with each new batch of cells. The level of DEP at each frequency in this device is obtained by analyzing spatiotemporal variations in light intensity from particle scattering, using particular bands of regions adjoining the gold-plated conducting electrode stripes patterned inside the wall of each of the 20 wells. The light intensity was normalized to the background at zero field (time = 0) by accounting for the electric field distribution in the wells.29 These normalized weighted changes in light intensity were used to measure the relative DEP force at each frequency, as reported previously.30
Structure Alterations from DEP Spectra.
Alterations to the DEP spectra of C. difficile under various probiotic cocultures were fit to a standard multishell dielectric model,31–33 including an insulating envelope denoting cell wall and membrane, with an inner conducting cytoplasm region. The fits were used to compute the dielectric parameters (Section S2): εwall, σwall, εmembrane, σmembrane, εcyto, and σcyto. Geometrical information about cell axis and cell wall thickness were measured from TEM images. Membrane thickness, which is not resolved from the images, was computed based on literature34,35 (Tables S1 and S2).
Optical Microscopy.
After 4 h of supernatant coculture, cells were fixed over a Bunsen burner and stained using Gram stain. Cells were imaged at 400× using a Zeiss Axio A1 microscope over 5 different fields at the same brightness. ImageJ was used to analyze cell size and aspect ratio. Images were converted to 8-bit, set to a threshold, with shadows and overlapping cells erased. The particle analysis tool was then used to measure size, as well as draw ellipses around each cell to determine cell aspect ratio after excluding cells with less than 200 pixels in size.
TEM Imaging.
After 4 h of supernatant coculture, cells were pelleted and washed in PBS and fixed in 2% glutaraldehyde and 2% paraformaldehyde in PBS for 4 h at room temperature. Cells were then prepared by the University of Virginia Advanced Microscopy facility for imaging. Cells were pelleted and washed in DI water before resuspension in 2% osmium tetroxide for 30 min at room temperature and resuspended in DI water. The samples were dehydrated through a serial gradient ethanol solution (50, 70, 95, and 100%) for 10 min at each level. The samples were then resuspended in 1:1 EtOH/EPON (epoxy resin) overnight, followed by 1:2 EtOH/EPON for 2 h, 1:4 EtOH/EPON for 4 h, and 100% EPON overnight. After embedding the samples in fresh 100% EPON, the samples were incubated in a 65 °C oven. The EPON-hardened samples were sectioned to 75 nm, mounted onto 200 mesh copper grids, and contrast stained with 0.25% lead citrate and 2% uranyl acetate for TEM imaging (JEOL 1230) at 80 kV (SIA digital camera).
Statistical Analysis.
Prism 8.0 (Graphpad, Inc.) was used to determine statistical differences. A one-way ANOVA with Dunnett’s multiple comparisons post-test was used to determine differences between cell area.
RESULTS AND DISCUSSION
Growth Inhibition of Cocultured C. difficile.
To determine the metabolic milieu from the probiotic culture that is capable of significantly inhibiting C. difficile growth, we considered transwell coculture with the probiotic organisms as well as variations in the dose of the cell-free supernatant obtained after 48 h of probiotic culture. As seen in Figure S1A–D, transwell coculture of the probiotic with the respective C. difficile strain (HTCD or BI strain) did not cause significant inhibition in a 24 h period. Furthermore, as shown in Figure S1E, dose levels of ≥25% of the cell-free supernatant obtained after 48 h of probiotic culture were required in combination with 50% BHI (the rest made with PBS) for enabling significant C. difficile growth inhibition after 4 h of coculture. We suggest that the presence of C. difficile during transwell coculture likely suppressed the probiotic growth level to reduce its inhibitory effect on C. difficile, but prolonged probiotic culture (48 h) in the absence of C. difficile generated a metabolic milieu that is capable of significantly inhibiting C. difficile during the subsequent coculture step.
Hence, in all future work, C. difficile was cultured with 50% BHI media plus 50% dose levels of the cell-free supernatant obtained after 48 h of probiotic culture using 5 probiotic strains. These include three strains from the Lactobacillus spp., because L. acidophilus, L. casei, and L. rhamnosus have been found to inhibit C. difficile virulence factors possibly by decreasing lumenal pH36,37 and decreasing host cell adhesion.38 Additionally, B. longum was chosen because it has been previously shown to inhibit C. difficile growth and host cell adhesion in vitro18, with different strains of B. longum exhibiting pH-dependent inhibition that continues to suppress C. difficile growth when pH in supernatants was adjusted to 7. S. boulardii was chosen because it has been shown in clinical trials to decrease incidence of CDI after antibiotic treatment, as well as to decrease C. difficile adherence to gut epithelial cells in vitro, possibly through upregulation of antitoxin A IgA and prevention of binding of toxin A to the colonic epithelium.8,39 Alterations in C. difficile growth based on absorbance measurements are shown in Figure 2 for the HTCD (A–D) and BI strains (E and F). These results show significant levels of C. difficile inhibition within 4 h for cocultures using supernatants from probiotic strains of Lactobacillus spp. (i.e., L. acidophilus, L. casei, and L. rhamnosus) but not from supernatants of B. longum or S. boulardii. The respective control experiment for the HTCD or BI was performed using spent media from HTCD or BI cultures mixed with equal parts of fresh BHI before culture. However, based on the respective insets to Figure 2A–H, i.e. Figure 2(i)–(viii), it is noteworthy that this growth inhibition is only barely apparent after 2 h of growth time. Adhesion assays of vegetative C. difficile to colonic epithelium Caco-2 cells (see Figure S2) show that HTCD adhesion was generally decreased following culture in L. acidophilus, L. rhamnosus, and S. boulardii supernatant (Figure S2A), while BI strain adhesion was decreased following culture in B. longum supernatant (Figure S2B). Toxin assays (see Figure S3) following 24 h of C. difficile coculture in the probiotic supernatant show significantly decreased toxin production for HTCD and BI strains in comparison to the respective control (coculture in media from C. difficile).
Figure 2.
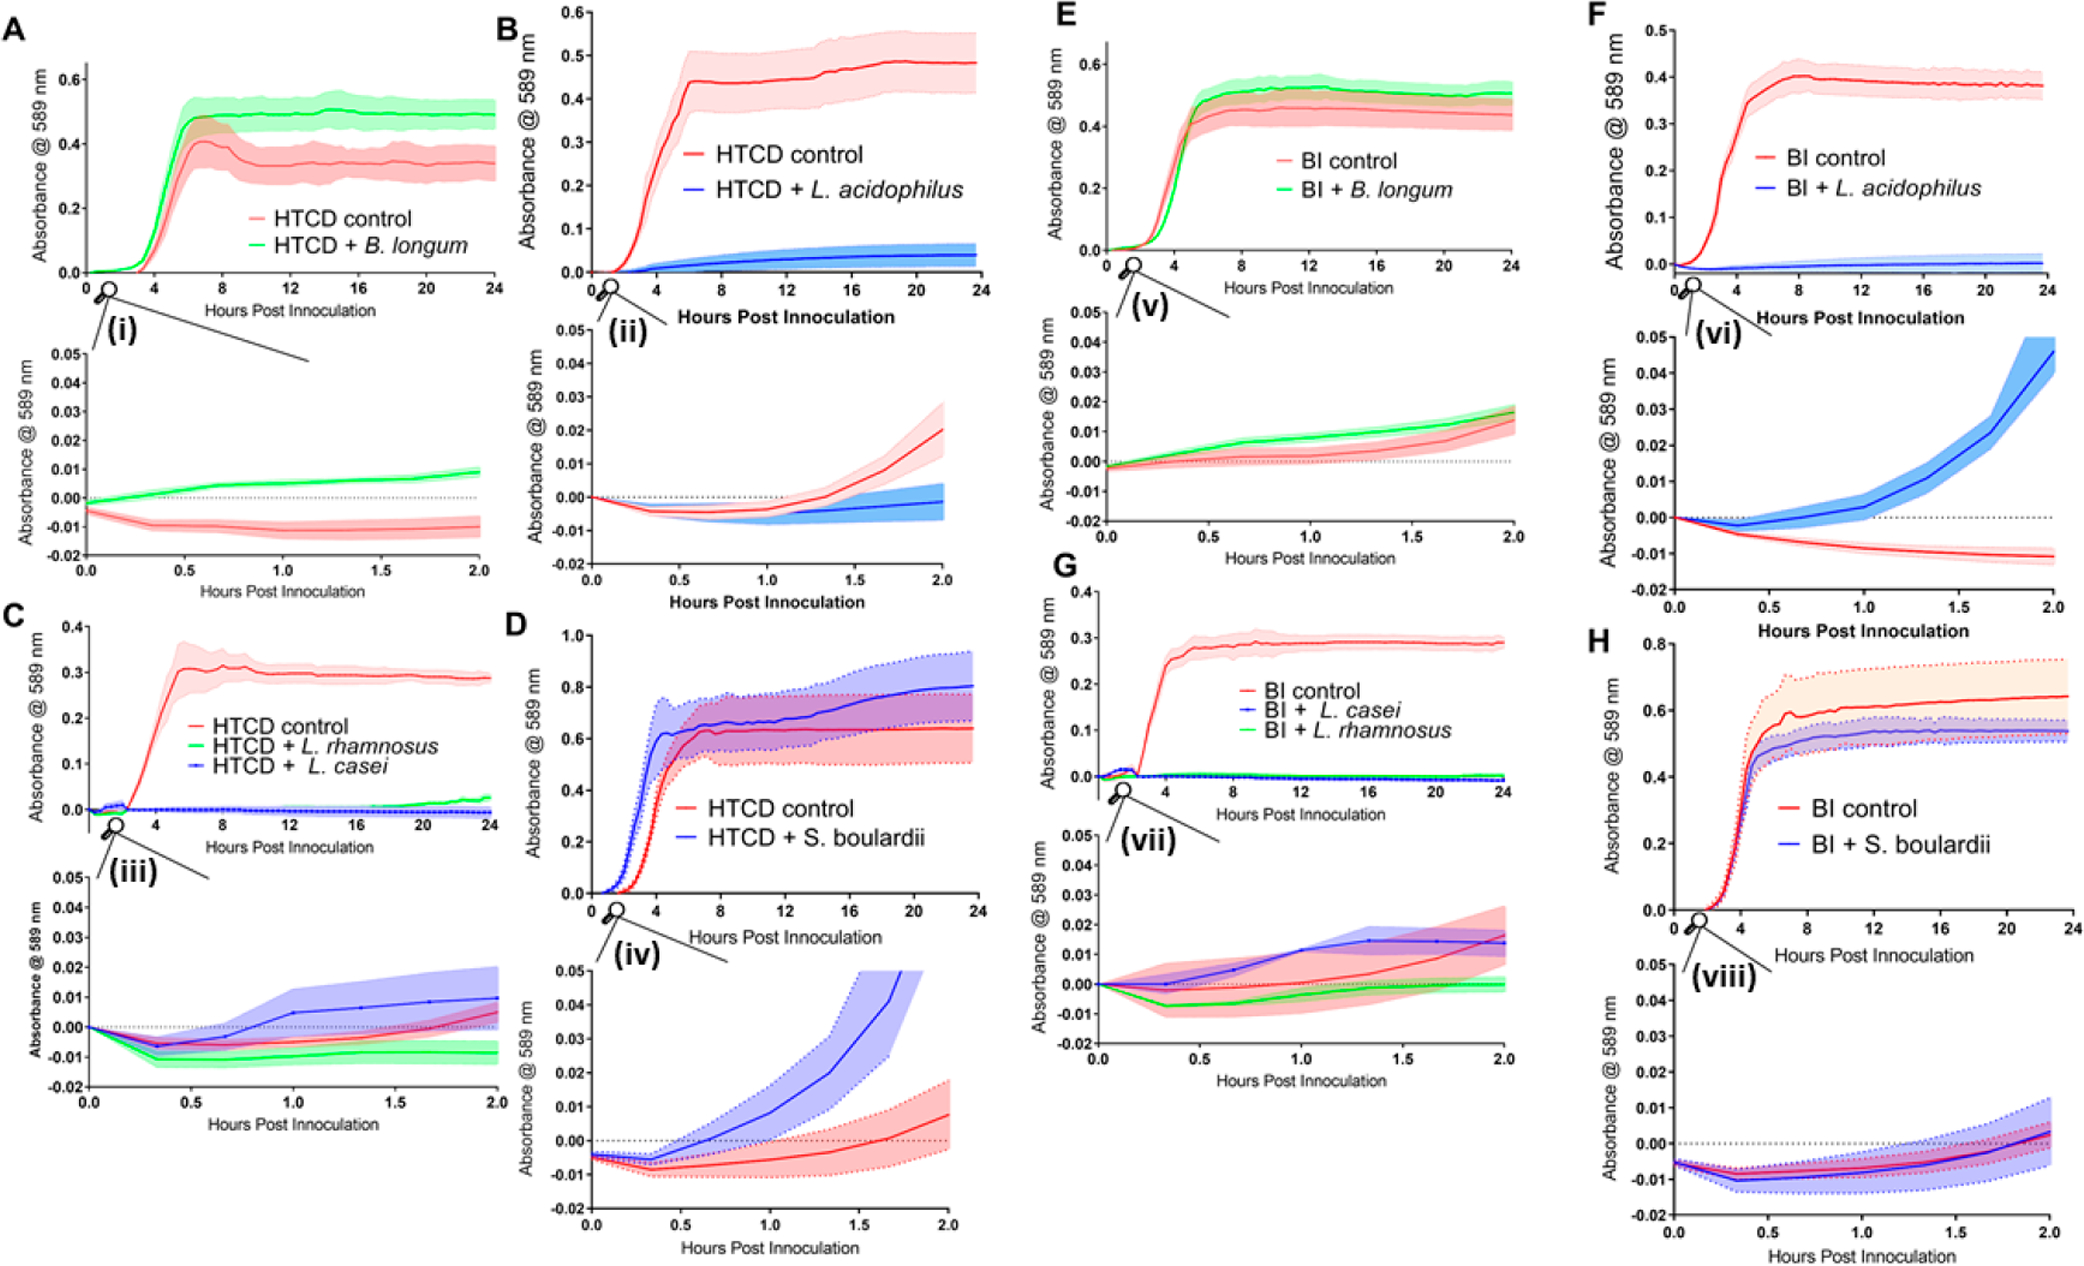
Growth of C. difficile HTCD (A–D) and BI strains (E–H) in supernatants of B. longum, L. acidophilus, L. rhamnosus, L. casei, and S. boulardii supernatants. Absorbance measurements were taken every 20 min for 24 h. The main plots show growth for 24 h, and the respective insets (i–viii) show growth from 0 to 2 h. Solid lines indicate absorbance at 589 nm, while the shaded space around the dotted lines represent errors (SEM values).
Morphological Alterations on Cocultured C. difficile.
Because the growth inhibition assay (Figure 2) is labor-intensive and requires about 4 h to show significant differences versus the control, we explore correlation of C. difficile morphology alterations with growth inhibition and its application to detect inhibition at earlier time points after coculture in probiotic supernatant. Morphological alterations to C. difficile are quantified based on (i) the pDEP level that indicates net electrical polarizability due to cell shape and subcellular changes after 1 h and 4 h of coculture; (ii) optical imaging to measure cell shape and area changes after 4 h of coculture; and (iii) TEM imaging of subcellular changes after 4 h of coculture. The C. difficile DEP frequency spectra after fitting to the ellipsoidal double-shell model (see Section S2) presents a quantitative aggregate of the changes from the overall cell structure (Figure 3A, as confirmed by optical imaging (ii)) and its subcellular regions (Figure 3B, as confirmed by TEM (iii)). The DEP force versus frequency spectra (Figure 3C–F) of HTCD and BI C. difficile strains show significant alterations after 4 h of coculture with supernatants from Lactobacillus strains (L. acidophilus, L. rhamnosus, L. casei), but minimal changes occur with B. longum and only minor alterations occur with S. boulardii supernatants. The changes are most clearly apparent in the transition from nDEP (negative DEP) at 100 kHz to pDEP (positive DEP) in the MHz frequency range. After coculture with supernatants from the indicated probiotic strains, C. difficile lacked strong pDEP at 5 MHz due to loss of electrical polarization for cells with disrupted subcellular structure. In fact, as shown in Figure 3G and H, these alterations to C. difficile can be detected within just 1 h of its coculture with supernatants from Lactobacillus strains. To characterize the morphological changes to C. difficile, Figure 4 shows representative 200× images of heat fixed, Gram-stained HTCD following 4 h of coculture in the respective probiotic supernatant. Cells cocultured with Lactobacillus-derived supernatant were decreased in the overall area, with reduction in eccentricity of the ellipsoidal structure that likely lowers the pDEP levels. Figure 5 summarizes the image analysis of HTCD and BI area in μm2 over 5 fields. HTCD control cells show significantly greater area than HTCD cells after coculture with Lactobacillus supernatant coculture, while HTCD cells cocultured with B. longum or S. boulardii show no significant differences. BI control cells show significantly greater area than BI cells cocultured with Lactobacillus supernatant, while those cocultured in supernatant of B. longum show a smaller but discernible difference. Figure 6 shows representative TEM images of HTCD at 50 000× magnification after 4 h of supernatant coculture. Based on Figure 6A–C, HTCD control cells are not significantly altered after coculture with supernatant of S. boulardii and B. longum, as apparent from the intact cell wall and membrane structure. On the other hand, after coculture with Lactobacillus spp. supernatants, the HTCD subcellular structure shows degradation of the envelope and eruption of the cytoplasm.
Figure 3.
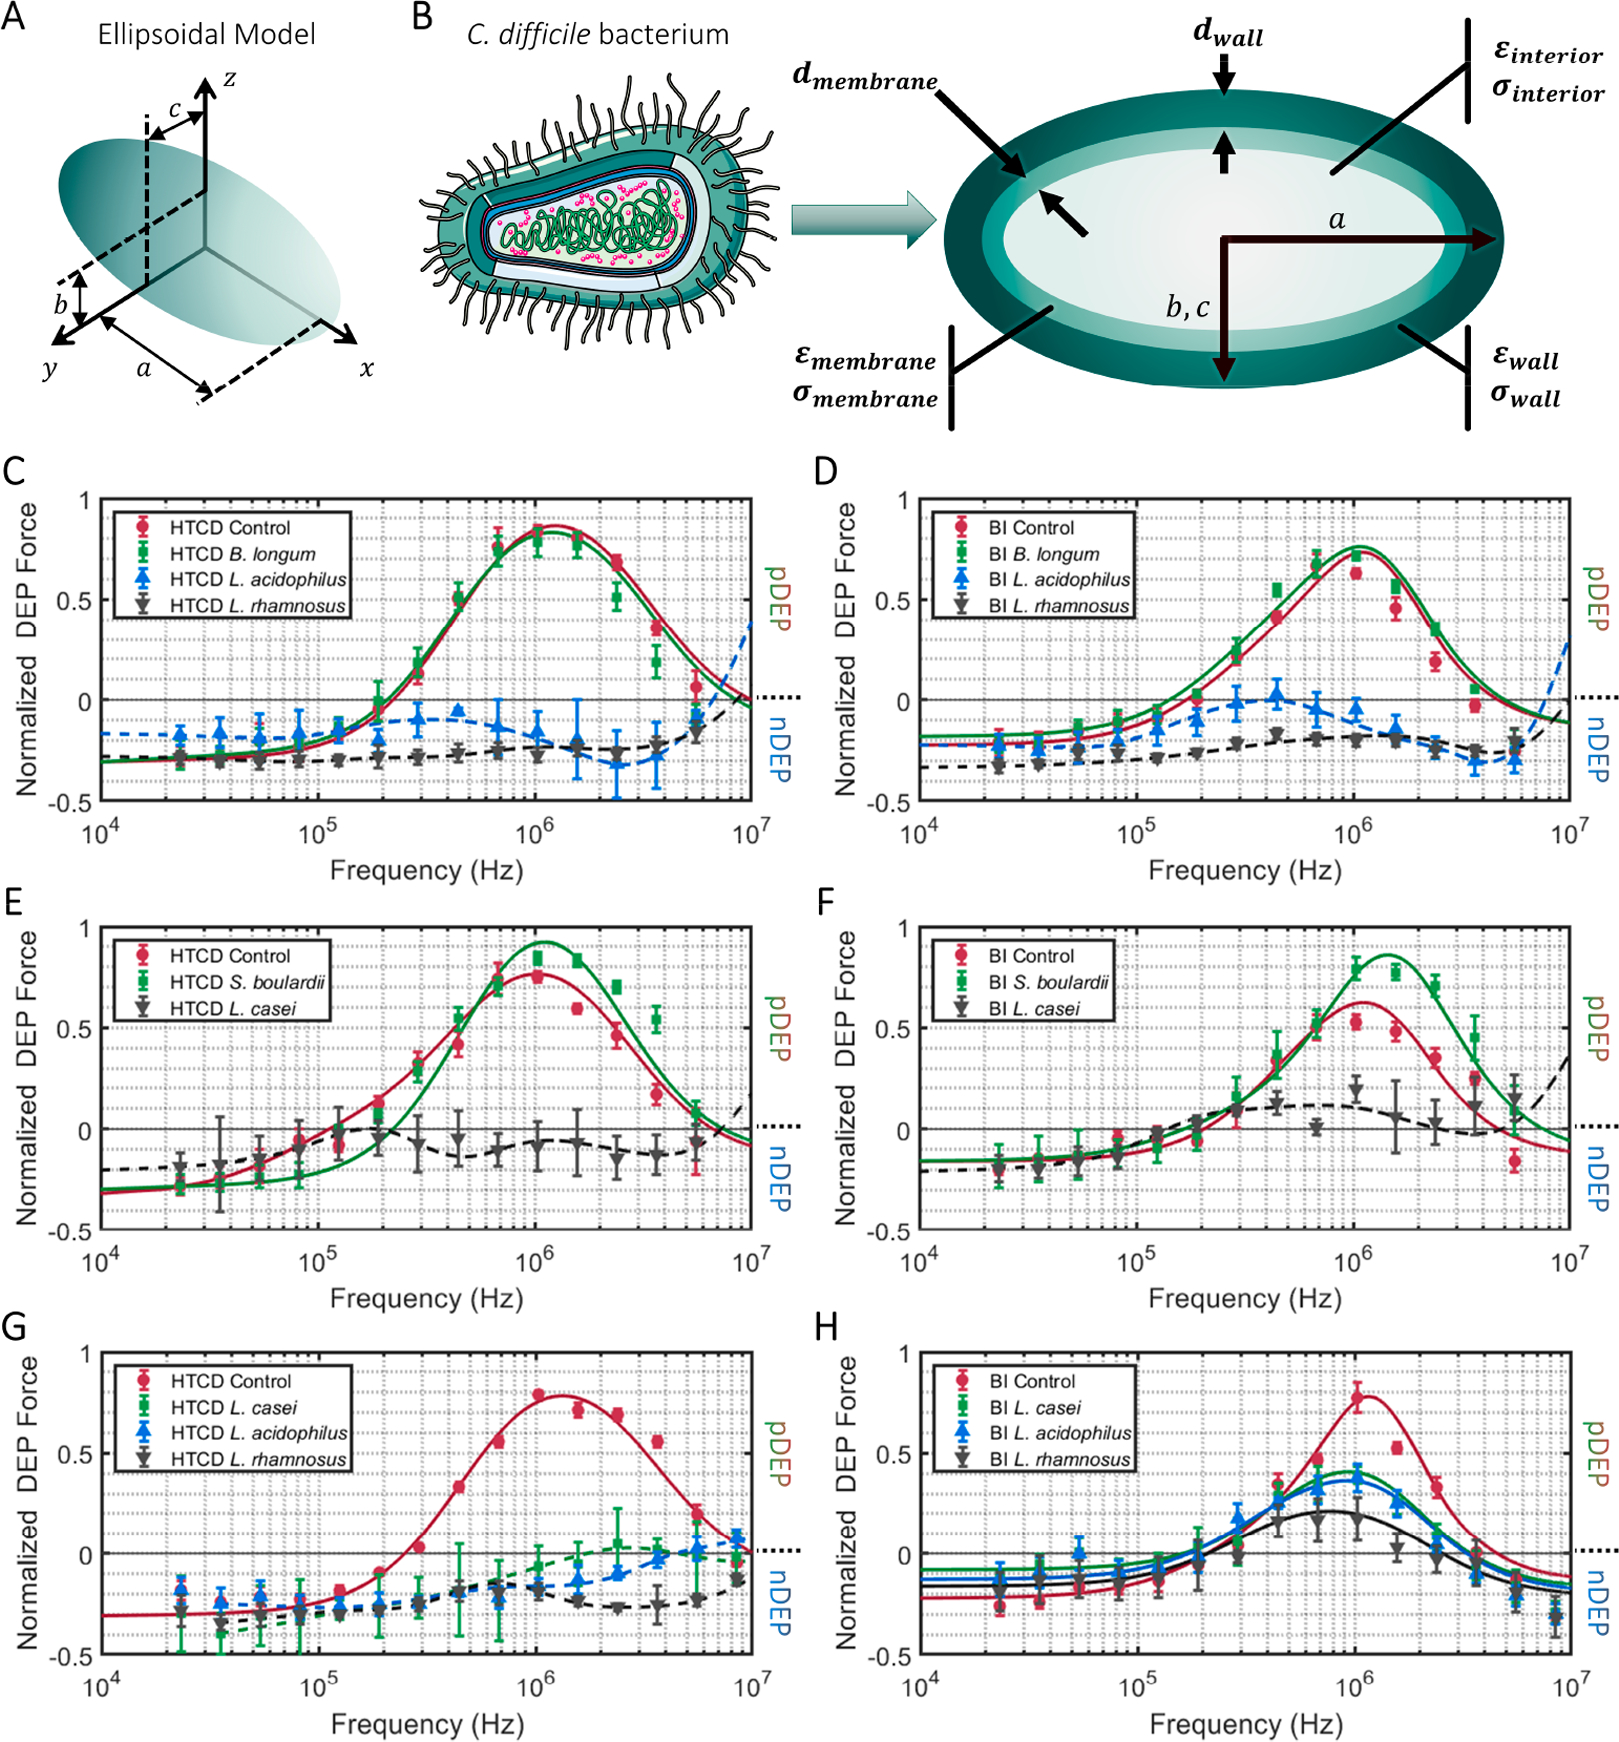
Ellipsoidal multishell dielectric model for C. difficile based on its size and shape (A); its subcellular regions (B) were used to fit the DEP spectra of C. difficile (Section S2) after coculture in the indicated probiotic supernatants: (C and E) HTCD strain after 4 h of coculture; (D and F) BI strain after 4 h of coculture; (G) HTCD strain after 1 h of coculture; (H) BI strain after 1 h of coculture. Progressive subcellular disruption eliminates the sharp transition from nDEP to pDEP behavior.
Figure 4.
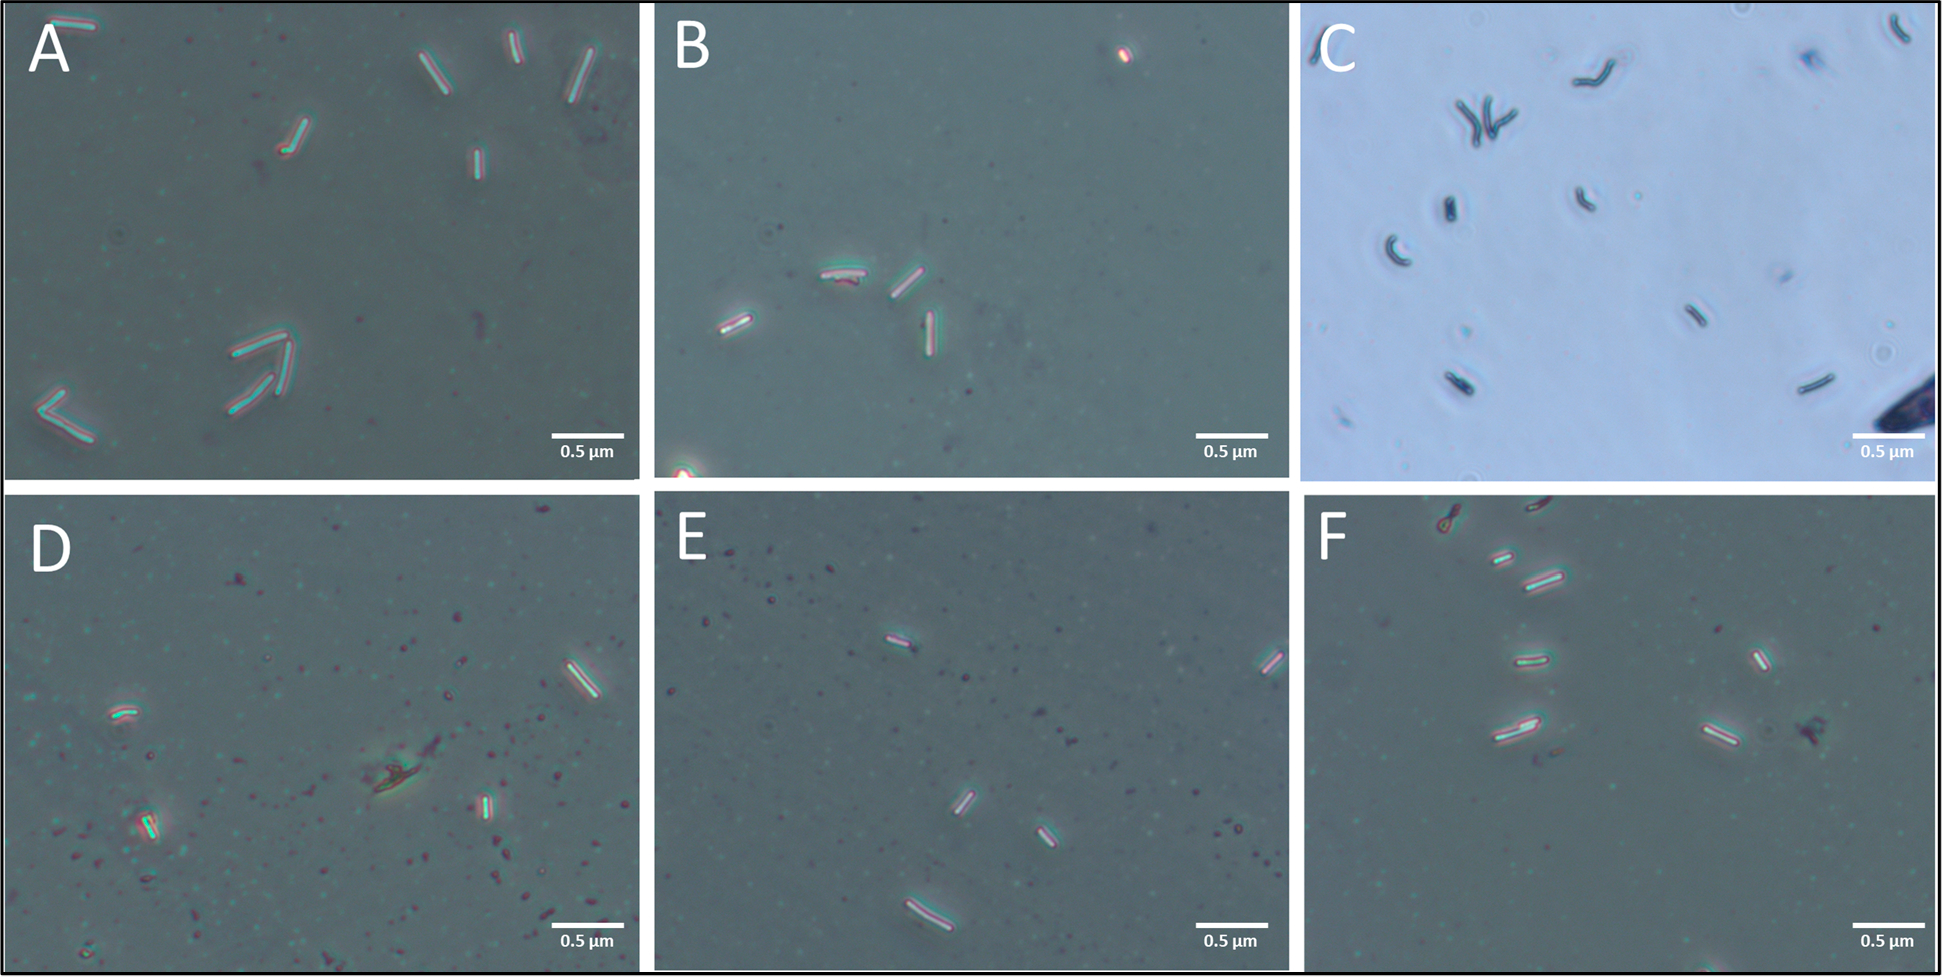
Representative images of gram stained HTCD taken at 400× magnification after coculture in supernatants of indicated probiotics: A: HTCD control, B: B. longum, C: S. boulardii, D: L. acidophilus, E: L. casei, F: L. rhamnosus.
Figure 5.
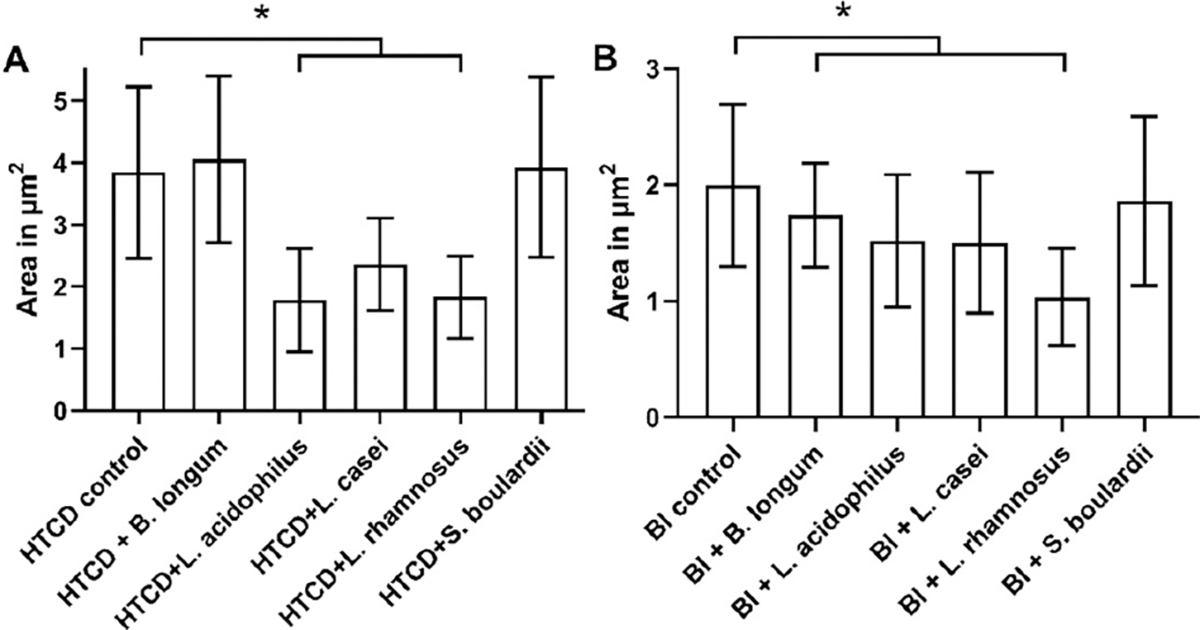
Image analysis of (A) HTCD and (B) BI C. difficile strains after coculture in the indicated probiotic supernatants (*p < 0.05).
Figure 6.
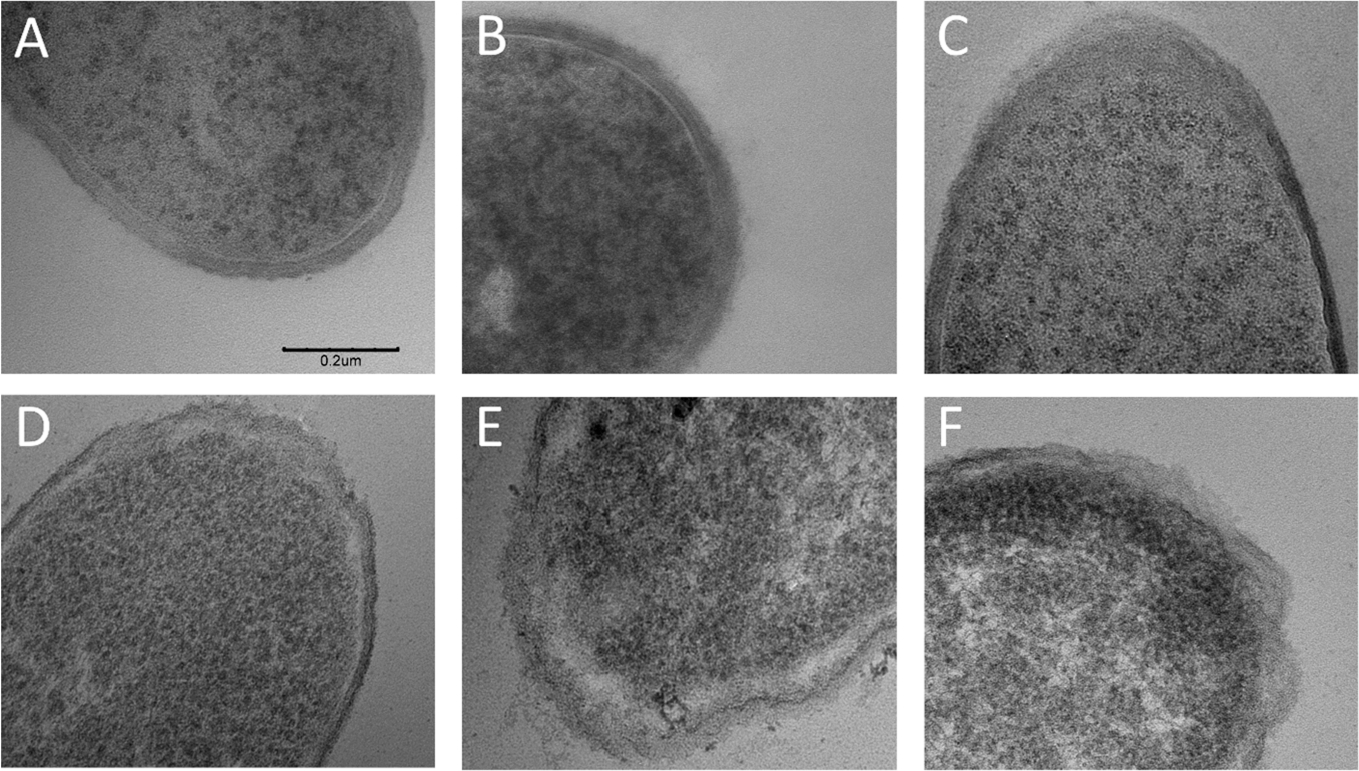
TEM images (50 000×) of alterations to the cell wall structure of the HTCD C. difficile strain after 4 h of coculture with supernatants from the indicated probiotic bacteria: A: HTCD control, B: S. boulardii, C: B. longum, D: L. rhamnosus, E: L. acidophilus, F: L. casei. Scale bar is the same across the images and is indicated in A (same for B–F).
pH of Probiotic Supernatant.
To characterize the metabolic milieu of the probiotic culture, the pH of supernatants before and after 48 h of culture is shown in Figure 7. While the supernatant from S. boulardii and B. longum cultures was decreased from pH 7 to about pH 5, the supernatant from Lactobacillus strains were significantly acidic, with decrease down to pH 4. Hence, the significantly lower pH of the supernatant from Lactobacillus strains could be related to their ability to inhibit C. difficile growth and cause morphological alterations monitored by optical and TEM imaging as well as based on polarization due to pDEP levels.
Figure 7.
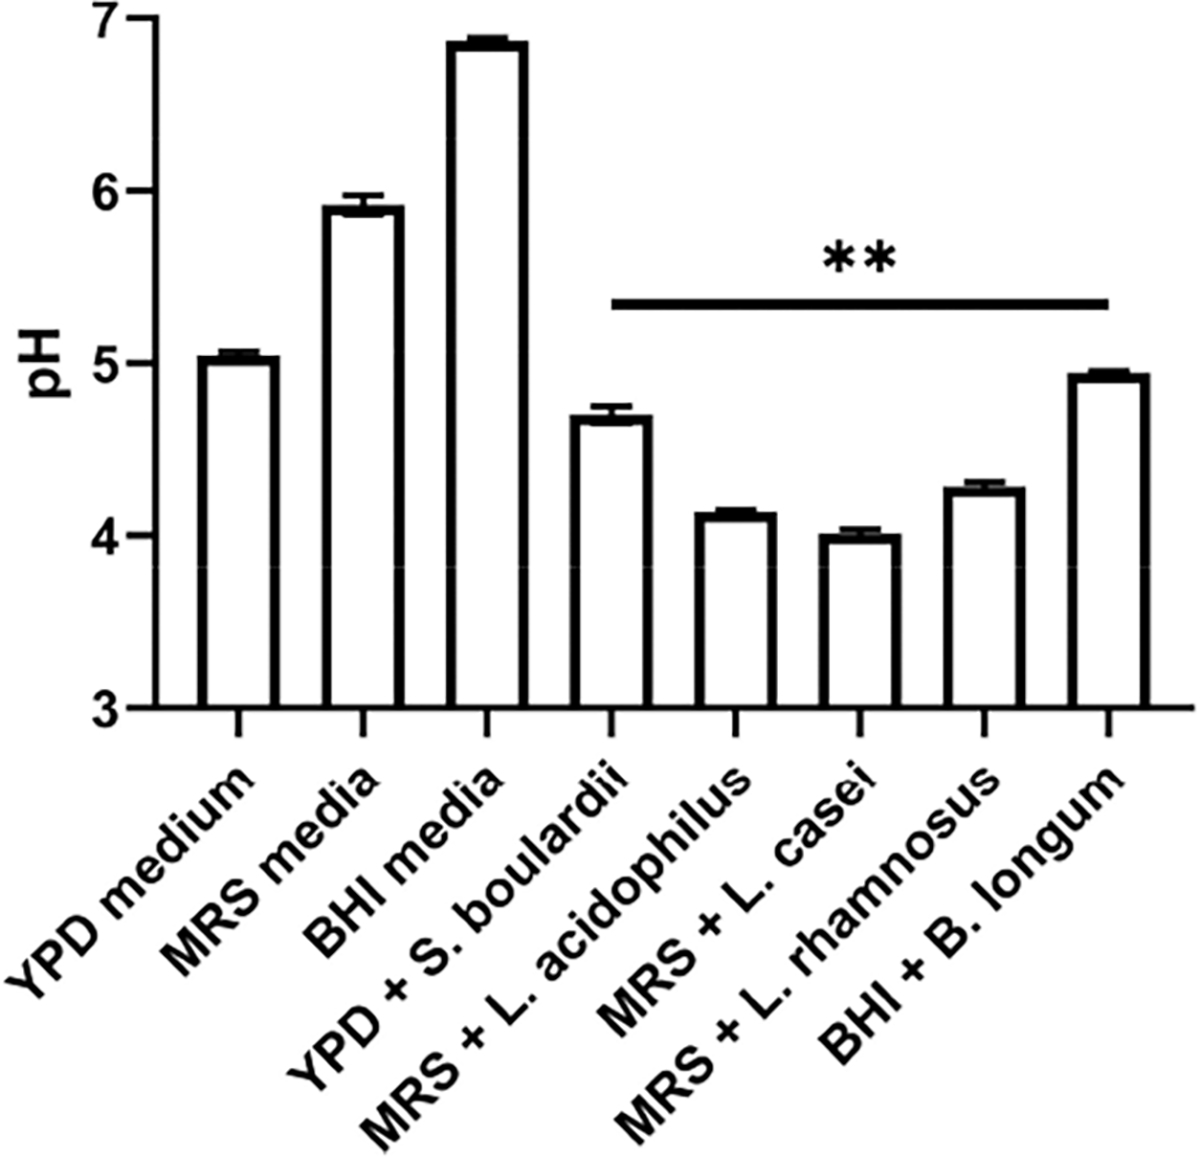
pH of media after 48 h of probiotic cultured separately in triplicate. YPD, MRS, and BHI are the culture media for the respective probiotic strains (**p < 0.01)
CONCLUSIONS AND OUTLOOK
Coculture of C. difficile with the cell-free supernatant obtained after 48 h of probiotic culture serves as a good in vitro model to simulate the metabolic milieu that causes C. difficile inhibition. This is based on the consistent differences in growth and cell structure alterations of HTCD and BI C. difficile strains within 4 h or less of coculture, as summarized in Table 1. C. difficile culture in supernatants from Lactobacillus spp. was able to eliminate growth of the HTCD and BI strains, while all strains tested prevented toxin secretion for both C. difficile strain types. There was a degree of ambiguity in the use of the host cell adhesion to assess inhibition of C. difficile strains after culture with probiotic supernatants. The biophysical characterization of C. difficile strains within 4 h of coculture in supernatants of Lactobacillus spp. showed significant alterations to C. difficile shape based on optical imaging and its subcellular structure by TEM. Using DEP, the chief spectral alteration is a loss of sharp transition from nDEP at low frequencies (<0.1 MHz) to pDEP behavior at high frequencies (>1 MHz), i.e. transition from electric field screening by the insulating cell envelope to electric field termination at the conductive cell cytoplasmic region, because C. difficile cells with a disrupted subcellular structure lack the necessary dielectric contrast for causing sharp nDEP to pDEP transition. The “strong pDEP” observed for the “control” C. difficile is altered to “loss of pDEP” after its coculture with strains that disrupt cell structure, whereas it remains as “strong pDEP” after its coculture with strains that do not disrupt the cell structure. In fact, pDEP reduction could detect the inhibitory effects of Lactobacillus spp. within just 1 h of coculture for the HTCD and BI C. difficile strains. Due to large morphological alterations to C. difficile shape and wall structure after coculture with Lactobacillus spp., the altered DEP spectra could be fit to the dielectric model only in situations wherein the structure was not significantly altered, as shown in Tables S1 and S2. The lack of alterations in the DEP spectra of both C. difficile strains after coculture with supernatants of B. longum and S. boulardii was consistent with the lack of structural alterations to C. difficile as determined by imaging and to the lack of growth inhibition. This could be attributed to the unsuitability of the supernatant coculture method for assessing the inhibition of C. difficile by these probiotic strains. Probiotic supernatants can inhibit C. difficile through several mechanisms, including secretion of bacteriocins, competitive inhibition of growth, inhibition of attachment to the gut epithelium, decreasing luminal pH, and enhancement of the mucus barrier of the intestinal epithelium.
Table 1.
Summary of Alterations to C. difficile Strains after Coculture in the Indicated Probiotic Supernatants
| C. difficile | probiotic | growth | adhesion | toxins A/B | pDEP level | optical | TEM |
|---|---|---|---|---|---|---|---|
| (HTCD) VPI10463 | B. longum | no alteration | improved | inhibited | strong pDEP | no alteration | no alteration |
| L. acidophilus | much lower | lowered | inhibited | loss of pDEP | >50% area reduction | obvious wall damage | |
| L. rhamnosus | lowered | lowered | inhibited | loss of pDEP | significant reduction | some wall damage | |
| L. casei | much lower | no change | inhibited | loss of pDEP | significant reduction | obvious wall damage | |
| S. boulardii | no alteration | lowered | inhibited | strong pDEP | no alteration | no alteration | |
| (BI) TL24 | B. longum | no alteration | lowered | inhibited | strong pDEP | no alteration | not imaged |
| L. acidophilus | much lower | improved | inhibited | loss of pDEP | significant reduction | ||
| L. rhamnosus | lowered | improved | inhibited | loss of pDEP | significant reduction | ||
| L. casei | much lower | improved | inhibited | loss of pDEP | significant reduction | ||
| S. boulardii | no alteration | no change | inhibited | strong pDEP | no alteration |
The current study is not aimed at elucidating which mechanisms play a role, but instead on developing an in vitro diagnostic platform for detecting the deactivation of C. difficile based on an optimized supernatant dose for coculture and an electrophysiology-based metric for rapidly identifying the subcellular changes without the need for extended culture. A limitation with this in vitro methodology of coculture with probiotic supernatants is that it can only be used to monitor alterations to the pathogen and not the host, which may also affect disease outcome. Hence, this in vitro strategy is best suited for screening of potential probiotics before in vivo testing. Further investigations are needed to couple this in vitro method with in vivo experiments to validate changes in C. difficile growth, toxin production, and host cell adhesion after probiotic administration following challenge with C. difficile in spore and vegetative forms to assess the benefit of probiotic strains in preventing recurrence of C. difficile infection after initial antibiotic administration.
Supplementary Material
ACKNOWLEDGMENTS
We acknowledge support from NIH Grant 1R21AI130902-01, University of Virginia’s Global Infectious Diseases Institute, and from AFOSR grant FA2386-18-1-4100.
Footnotes
The authors declare no competing financial interest.
ASSOCIATED CONTENT
Supporting Information
The Supporting Information is available free of charge at https://pubs.acs.org/doi/10.1021/acsinfecdis.9b00415.
Section S1, including optimization of probiotic coculture model (Figure S1); adhesion assays for C. difficile to colonic epithelium Caco-2 cells (Figure S2); toxin assays for C. difficile (Figure S3); details on probiotic culture (Figure S4) and Section S2 on fitting C. difficile DEP spectra to the ellipsoidal double-shell model (PDF)
Special Issue Paper
This paper was intended for the Chemical Microbiology special issue [ACS Infect. Dis. 2020, 6 (4)].
Complete contact information is available at: https://pubs.acs.org/10.1021/acsinfecdis.9b00415
REFERENCES
- (1).Ley RE, Peterson DA, and Gordon JI (2006) Ecological and Evolutionary Forces Shaping Microbial Diversity in the Human Intestine. Cell 124 (4), 837–848. [DOI] [PubMed] [Google Scholar]
- (2).Zapata HJ, and Quagliarello VJ (2015) The microbiota and microbiome in aging: potential implications in health and age-related diseases. J. Am. Geriatr. Soc. 63 (4), 776–781. [DOI] [PMC free article] [PubMed] [Google Scholar]
- (3).Biagi E, Nylund L, Candela M, Ostan R, Bucci L, Pini E, Nikkïla J, Monti D, Satokari R, Franceschi C, Brigidi P, and De Vos W (2010) Through Ageing, and Beyond: Gut Microbiota and Inflammatory Status in Seniors and Centenarians. PLoS One 5 (5), No. e10667. [DOI] [PMC free article] [PubMed] [Google Scholar]
- (4).Fischer N, and Relman DA (2018) Clostridium difficile, Aging, and the Gut: Can Microbiome Rejuvenation Keep Us Young and Healthy? J. Infect. Dis. 217 (2), 174–176. [DOI] [PMC free article] [PubMed] [Google Scholar]
- (5).Johnson S (2009) Recurrent Clostridium difficile infection: A review of risk factors, treatments, and outcomes. J. Infect. 58 (6), 403–410. [DOI] [PubMed] [Google Scholar]
- (6).Cohen SH, Gerding DN, Johnson S, Kelly CP, Loo VG, McDonald LC, Pepin J, and Wilcox MH (2010) Clinical practice guidelines for Clostridium difficile infection in adults: 2010 update by the society for healthcare epidemiology of America (SHEA) and the infectious diseases society of America (IDSA). Infection control and hospital epidemiology 31 (5), 431–55. [DOI] [PubMed] [Google Scholar]
- (7).Surawicz CM, and Alexander J (2011) Treatment of refractory and recurrent Clostridium difficile infection. Nat. Rev. Gastroenterol. Hepatol. 8, 330. [DOI] [PubMed] [Google Scholar]
- (8).Lessa FC, Mu Y, Bamberg WM, Beldavs ZG, Dumyati GK, Dunn JR, Farley MM, Holzbauer SM, Meek JI, Phipps EC, Wilson LE, Winston LG, Cohen JA, Limbago BM, Fridkin SK, Gerding DN, and McDonald LC (2015) Burden of Clostridium difficile Infection in the United States. N. Engl. J. Med. 372 (9), 825–834. [DOI] [PMC free article] [PubMed] [Google Scholar]
- (9).Sears P, Ichikawa Y, Ruiz N, and Gorbach S (2013) Advances in the treatment of Clostridium difficile with fidaxomicin: a narrow spectrum antibiotic. Ann. N. Y. Acad. Sci. 1291, 33–41. [DOI] [PubMed] [Google Scholar]
- (10).Lau CS, and Chamberlain RS (2016) Probiotics are effective at preventing Clostridium difficile-associated diarrhea: a systematic review and meta-analysis. Int. J. Gen. Med. 9, 27–37. [DOI] [PMC free article] [PubMed] [Google Scholar]
- (11).Woo TD, Oka K, Takahashi M, Hojo F, Osaki T, Hanawa T, Kurata S, Yonezawa H, and Kamiya S (2011) Inhibition of the cytotoxic effect of Clostridium difficilein vitro by Clostridium butyricum MIYAIRI 588 strain. J. Med. Microbiol. 60 (11), 1617–1625. [DOI] [PubMed] [Google Scholar]
- (12).Bolla PA, Carasi P, de los Angeles Bolla M, De Antoni GL, and de los Angeles Serradell M (2013) Protective effect of a mixture of kefir-isolated lactic acid bacteria and yeasts in a hamster model of Clostridium difficile infection. Anaerobe 21, 28–33. [DOI] [PubMed] [Google Scholar]
- (13).Kondepudi KK, Ambalam P, Karagin PH, Nilsson I, Wadström T, and Ljungh Å (2014) A novel multi-strain probiotic and synbiotic supplement for prevention of Clostridium difficile infection in a murine model. Microbiol. Immunol. 58 (10), 552–558. [DOI] [PubMed] [Google Scholar]
- (14).Schoster A, Kokotovic B, Permin A, Pedersen P, Dal Bello F, and Guardabassi L (2013) In vitro inhibition of Clostridium difficile and Clostridium perfringens by commercial probiotic strains. Anaerobe 20, 36–41. [DOI] [PubMed] [Google Scholar]
- (15).Asami K, and Yonezawa T (1995) Dielectric behavior of non-spherical cells in culture. Biochim. Biophys. Acta, Gen. Subj. 1245 (3), 317–24. [DOI] [PubMed] [Google Scholar]
- (16).Cotter PD, Ross RP, and Hill C (2013) Bacteriocins—a viable alternative to antibiotics? Nat. Rev. Microbiol. 11 (2), 95. [DOI] [PubMed] [Google Scholar]
- (17).Begley M, Hill C, and Gahan CG (2006) Bile salt hydrolase activity in probiotics. Appl. Environ. Microbiol. 72 (3), 1729–1738. [DOI] [PMC free article] [PubMed] [Google Scholar]
- (18).Trejo FM, Minnaard J, Perez PF, and De Antoni GL (2006) Inhibition of Clostridium difficile growth and adhesion to enterocytes by Bifidobacterium supernatants. Anaerobe 12 (4), 186–193. [DOI] [PubMed] [Google Scholar]
- (19).Choi J, Yoo J, Lee M, Kim E-G, Lee JS, Lee S, Joo S, Song SH, Kim E-C, and Lee JC (2014) A rapid antimicrobial susceptibility test based on single-cell morphological analysis. Sci. Transl. Med. 6 (267), 267ra174–267ra174. [DOI] [PubMed] [Google Scholar]
- (20).Popham DL, and Young KD (2003) Role of penicillin-binding proteins in bacterial cell morphogenesis. Curr. Opin. Microbiol. 6 (6), 594–599. [DOI] [PubMed] [Google Scholar]
- (21).Margolin W (2009) Sculpting the bacterial cell. Curr. Biol. 19 (17), R812–R822. [DOI] [PMC free article] [PubMed] [Google Scholar]
- (22).Fernandez RE, Rohani A, Farmehini V, and Swami NS (2017) Microbial analysis in dielectrophoretic microfluidic systems. Anal. Chim. Acta 966, 11–33. [DOI] [PMC free article] [PubMed] [Google Scholar]
- (23).Chung C-C, Cheng I-F, Yang W-H, and Chang H-C (2011) Antibiotic susceptibility test based on the dielectrophoretic behavior of elongated Escherichia coli with cephalexin treatment. Biomicrofluidics 5 (2), 021102. [DOI] [PMC free article] [PubMed] [Google Scholar]
- (24).Chung C-C, Cheng I-F, Chen H-M, Kan H-C, Yang W-H, and Chang H-C (2012) Screening of antibiotic susceptibility to β-Lactam-Induced Elongation of gram-negative bacteria based on dielectrophoresis. Anal. Chem. 84 (7), 3347–3354. [DOI] [PubMed] [Google Scholar]
- (25).Su Y-H, Warren CA, Guerrant RL, and Swami NS (2014) Dielectrophoretic monitoring and interstrain separation of intact Clostridium difficile based on their S (Surface)-layers. Anal. Chem. 86 (21), 10855–10863. [DOI] [PMC free article] [PubMed] [Google Scholar]
- (26).Rohani A, Moore JH, Su Y-H, Stagnaro V, Warren C, and Swami NS (2018) Single-cell electro-phenotyping for rapid assessment of Clostridium difficile heterogeneity under vancomycin treatment at sub-MIC (minimum inhibitory concentration) levels. Sens. Actuators, B 276, 472–480. [DOI] [PMC free article] [PubMed] [Google Scholar]
- (27).Su Y-H, Rohani A, Warren CA, and Swami NS (2016) Tracking Inhibitory alterations during interstrain clostridium difficile interactions by monitoring cell envelope capacitance. ACS Infect. Dis. 2 (8), 544–551. [DOI] [PMC free article] [PubMed] [Google Scholar]
- (28).Kolling GL, Wu M, Warren CA, Durmaz E, Klaenhammer TR, and Guerrant RL (2012) Lactic acid production by Streptococcus thermophilus alters Clostridium difficile infection and in vitro Toxin A production. Gut Microbes 3 (6), 523–529. [DOI] [PMC free article] [PubMed] [Google Scholar]
- (29).Rohani A, Varhue W, Su YH, and Swami NS (2014) Quantifying spatio-temporal dynamics of biomarker pre-concentration and depletion in microfluidic systems by intensity threshold analysis. Biomicrofluidics 8 (5), 052009. [DOI] [PMC free article] [PubMed] [Google Scholar]
- (30).Broche LM, Hoettges KF, Ogin SL, Kass GEN, and Hughes MP (2011) Rapid, automated measurement of dielectrophoretic forces using DEP-activated microwells. Electrophoresis, DOI: 10.1002/elps.201100063. [DOI] [PubMed] [Google Scholar]
- (31).Jones TB (1995) Electromechanics of Particles, Cambridge University Press, Cambridge, New York, p 265. [Google Scholar]
- (32).Morgan H, and Green NG (2003) AC Electrokinetics, Research Studies Press. [Google Scholar]
- (33).Rohani A, Varhue W, Su YH, and Swami NS (2014) Electrical tweezer for highly parallelized electro-rotation measurements over a wide frequency bandwidth. Electrophoresis 35, 1795–1802. [DOI] [PubMed] [Google Scholar]
- (34).Perfumo A, Elsaesser A, Littmann S, Foster RA, Kuypers MMM, Cockell CS, and Kminek G (2014) Epifluorescence, SEM, TEM and nanoSIMS image analysis of the cold phenotype of Clostridium psychrophilumat subzero temperatures. FEMS Microbiol. Ecol. 90 (3), 869–882. [DOI] [PubMed] [Google Scholar]
- (35).Milo R, and Phillips R Cell Biology by the Numbers; Garland Science: New York, 2016. [Google Scholar]
- (36).Hickson M (2011) Probiotics in the prevention of antibiotic-associated diarrhoea and Clostridium difficile infection. Ther. Adv. Gastroenterol. 4 (3), 185–197. [DOI] [PMC free article] [PubMed] [Google Scholar]
- (37).Auclair J, Frappier M, and Millette M (2015) Lactobacillus acidophilus CL1285, Lactobacillus casei LBC80R, and Lactobacillus rhamnosus CLR2 (Bio-K+): Characterization, Manufacture, Mechanisms of Action, and Quality Control of a Specific Probiotic Combination for Primary Prevention of Clostridium difficile Infection. Clin. Infect. Dis. 60, S135–S143. [DOI] [PubMed] [Google Scholar]
- (38).Banerjee P, Merkel GJ, and Bhunia AK (2009) Lactobacillus delbrueckii ssp. bulgaricus B-30892 can inhibit cytotoxic effects and adhesion of pathogenic Clostridium difficile to Caco-2 cells. Gut Pathog. 1 (1), 8–8. [DOI] [PMC free article] [PubMed] [Google Scholar]
- (39).Tasteyre A, Barc M-C, Karjalainen T, Bourlioux P, and Collignon A (2002) Inhibition of in vitro cell adherence of Clostridium difficile by Saccharomyces boulardii. Microb. Pathog. 32 (5), 219–225. [DOI] [PubMed] [Google Scholar]
Associated Data
This section collects any data citations, data availability statements, or supplementary materials included in this article.


