

ABSTRACT
Aims/Introduction
In the development of type 1 diabetes, metabolites are significantly altered and might be involved in β‐cell destruction and protection. We aimed to identify new metabolic markers of β‐cell destruction in type 1 diabetes patients.
Materials and Methods
A total of 33 participants were recruited for this cross‐sectional observational study: 23 with type 1 diabetes, seven with type 2 diabetes and three healthy controls. Those with type 1 diabetes were further subdivided into three groups: new‐onset, microsecretors and complete lack of endogenous insulin in type 1 diabetes.
Results
Metabolomic analysis identified a total of 737 peaks, and partial least square analysis was successful in discriminating between the three groups of type 1 diabetes. Among the factor loadings discriminating type 1 diabetes, 3‐phenylpropionic acid (r = 0.80, P = 4.7E−6) and hypotaurine (r = −0.484, P = 1.9E−2) strongly contributed to identifying new‐onset type 1 diabetes, and 5‐methylcytosine to identifying complete‐lack type 1 diabetes (r = 0.586, P = 6.5E−3). Reporter operating characteristics analysis, including all type 1 diabetes, type 2 diabetes and healthy controls, showed that high 3‐phenylpropionic acid (Pc <0.0001) and low hypotaurine (Pc <0.0001) were useful for identifying new‐onset type 1 diabetes, and high 5‐methylcytosine (Pc = 0.002) for the complete‐lack type 1 diabetes.
Conclusions
In the present study, metabolic signatures were shown to be useful in identifying type 1 diabetes at different clinical stages, and 3‐phenylpropionic acid and hypotaurine are novel biomarkers for identifying new‐onset type 1 diabetes, suggesting the involvement of the gut bacterial environment, anti‐oxidant mechanisms through the hypotaurine‐taurine pathway and methylated deoxyribonucleic acid fragmentation in the process of β‐cell destruction.
Keywords: Metabolome, Type 1 diabetes, β‐cell
Metabolomic analysis successfully discriminated type 1 diabetes at different clinical stages, and 3‐phenylpropionic acid and hypotaurine were found to be novel biomarkers for identifying new‐onset type 1 diabetes.
INTRODUCTION
Type 1 diabetes is an organ‐specific autoimmune disease caused by progressive β‐cell destruction due to lymphocyte infiltration into pancreatic islets 1 . Japanese individuals with type 1 diabetes have a higher frequency of complete loss of endogenous insulin secretion within 5 years after the onset of diabetes 2 than European individuals 3 , 4 . Thus, the vulnerability of β‐cells and the speed of their destruction might vary according to ethnicity 5 . Even in the insulin‐dependent state, if the residual β‐cell function is preserved and not completely depleted, even in small amounts, blood glucose excursions are stabilized, and the risk of severe hypoglycemia and hyperglycemia is significantly reduced 6 , 7 , 8 . Early detection of β‐cell destruction should lead to the preservation of residual β‐cell function through therapeutic intervention with insulin. Currently, however, the decline in β‐cell function can only be assessed as a consequence of destruction by serum C‐peptides. Alternatively, the detection of anti‐islet autoantibodies, such as glutamic acid decarboxylase antibody, might indicate ongoing autoimmune destruction of β‐cells. However, these autoantibodies have limited sensitivity and specificity, and are not always positive in cases of rapid β‐cell destruction, such as fulminant type 1 diabetes 9 and immune checkpoint therapy‐related type 1 diabetes 10 , making them insufficient to act as biomarkers for β‐cell destruction by themselves.
A recent whole‐genome association study of fulminant type 1 diabetes identified cysteine sulfinic acid decarboxylase (CSAD) as a novel disease susceptibility gene 11 . CSAD is the rate‐limiting enzyme for taurine synthesis, and taurine administration to non‐obese diabetic mice, a mouse model of type 1 diabetes, exerts a protective effect against the apoptosis of islet cells and insulitis 12 . Based on the aforementioned evidence, it is hypothesized that metabolites, such as amino acids including taurine, are involved in the process of β‐cell protection and destruction, and might be significantly altered in the development of type 1 diabetes. Thus, the present study aimed to identify novel metabolic biomarkers of progressive β‐cell destruction in type 1 diabetes through metabolomic analysis.
MATERIALS AND METHODS
Study participants
A total of 33 individuals, including 23 with type 1 diabetes, seven with type 2 diabetes and three healthy controls, were enrolled at Kindai University Hospital between April 2017 and August 2019 in the present observational study with cross‐sectional design (Table 1 and Table S1). All individuals with diabetes were diagnosed according to the diagnostic criteria of the Japan Diabetes Society 13 , 14 . The 23 individuals with type 1 diabetes were further subdivided into three groups: (i) complete lack of endogenous insulin in type 1 diabetes (n = 8): fasting serum C‐peptide less than the limit of detection (0.01 ng/mL); (ii) microsecretors of endogenous insulin in type 1 diabetes (n = 9): fasting serum C‐peptide >0.01 and <0.6 ng/mL at least 3 months after onset of diabetes; and (iii) new‐onset type 1 diabetes (n = 6): fasting serum C‐peptide >0.01 ng/mL after 2–4 weeks of insulin therapy initiated immediately after onset of diabetic ketoacidosis. For type 2 diabetes (n = 7), we selected individuals with a fasting serum C‐peptide level >1 ng/mL, no history of ketosis and overweight with a body mass index >25 kg/m2. Three healthy controls had no family history of diabetes or autoimmune disease, had no abnormal data on annual physical examination and were not taking any medications. Whole blood was collected from the participants into ethylenediaminetetraacetic acid‐containing blood collection tubes early in the morning on an empty stomach after an overnight fast. Blood cells, including platelets, were removed from the plasma through centrifugation for 15 min at 2000 g using a refrigerated centrifuge, and then immediately frozen in a −80°C freezer until further analysis. This study was approved by the Ethics Committee of the Kindai University Faculty of Medicine (#18–046), and conforms to the provisions of the Declaration of Helsinki (as revised in Fortaleza, Brazil, October 2013). Written informed consent was obtained from all participants.
Table 1.
Clinical characteristics of participants
| New‐onset type 1 diabetes | Microsecretor type 1 diabetes | Complete lack type 1 diabetes | Type 2 diabetes | |
|---|---|---|---|---|
| n = 6 | n = 9 | n = 8 | n = 7 | |
| Age (years) |
53.3 ± 4.7 [41–68] |
50.1 ± 8.2 [16–80] |
64 ± 5.3 [42–82] |
49.3 ± 20.1 [22–77] |
| Sex (F/M) | 4/2 | 6/3 | 6/2 | 4/3 |
| Duration of diabetes |
22.5 ± 4.5 days [15–28 days] |
5.1 ± 6.5 years [3 months to 15.7 years] |
13.5 ± 9.0 years [3 months to 15.7 years] |
15.3 ± 11.3 years [6 months to 34.6 years] |
| Acute‐onset/SPIDDM | 6/0 | 4/5 | 6/2 | 0/0 |
| Serum fasting C‐peptide (ng/mL) |
0.36 ± 0.29 [0.11–0.89] |
0.35 ± 0.15 [0.25–0.56] |
<0.01 |
2.50 ± 1.64 [1.19–5.88] |
| HbA1c (%) | 11.6 ± 1.9 | 11.4 ± 2.3 | 9.2 ± 1.3 | 9.5 ± 2.0 |
| Anti‐islet autoantibodies (positive/negative) | 6/0 | 8/1 | 6/2 | 0/7 |
| GAD antibody (positive/negative) | 6/0 | 7/2 | 5/3 | 0/7 |
| IA‐2 antibody (positive/negative) | 4/2 | 4/5 | 3/5 | NA |
| BMI (kg/m2) | 19.2 ± 1.1 | 20.9 ± 3.4 | 21.7 ± 3.1 | 29.6 ± 4.3 |
Quantitative data are expressed as the mean ± standard deviation. Categorical variables are expressed as the number (percentage) of participants. BMI, body mass index; F, female; GAD, glutamic acid decarboxylase; IA‐2, islet antigen 2; M, male; NA, not available; SPIDDM, slowly progressive insulin‐dependent diabetes mellitus.
Metabolomic analysis
Metabolome measurements were carried out by Human Metabolome Technologies, Inc. (HMT; Tokyo, Japan). Ionic and lipophilic low‐molecular‐weight compounds were analyzed using capillary electrophoresis Fourier transform mass spectrometry (CE‐FTMS; HMT's ω Scan package) 15 and liquid chromatography time‐of‐flight mass spectrometry (LC‐TOFMS), respectively. CE‐FTMS analysis was carried out using an Agilent 7100 CE capillary electrophoresis system equipped with a Q Exactive Plus (Thermo Fisher Scientific Inc., Waltham, MA, USA), Agilent 1260 isocratic HPLC pump, Agilent G1603A CE‐MS adapter kit and Agilent G1607A CEESI‐S sprayer kit (Agilent Technologies, Inc., Santa Clara, CA, USA). The systems were controlled using Agilent MassHunter workstation software LC/MS data acquisition for 6200 series TOF/6500 series Q‐TOF version B. 08.00 (Agilent Technologies) and Xcalibur (Thermo Fisher Scientific), and connected by a fused silica capillary (50 μm i.d. × 80 cm total length) with commercial electrophoresis buffer (H3301‐1001 and I3302‐1023 for cation and anion analyses, respectively; HMT) as the electrolyte. The spectrometer scanned from m/z 60 to 900 in the positive mode and from m/z 70 to 1,050 in the negative mode.
LC‐TOFMS was carried out using an Agilent 1,200 series RRLC system SL equipped with a 6,230 TOF mass spectrometer. The system was controlled using G2201AA ChemStation software version B.03.01 for CE. Compounds were separated using an ODS column (i.d. 2.0 × 50 mm, 2 μm), and eluted with a binary gradient of solvent A (water containing 0.1% formic acid) and solvent B (isopropanol: acetonitrile: water [65:30:5] containing 0.1% formic acid and 2 mmol/L ammonium formate). The gradient profile was as follows: 0–0.5 min, 1% B; 0.5–13.5 min, 1–100% B linear; 13.5–20 min, 100% B. The flow rate was 0.3 mL/min and the column temperature was 40°C. In electrospray positive and negative ion analyses, the nebulizer pressure was 40 psi, dry gas flow was 10 L/min, dry gas temperature was 350°C and capillary voltage was 4,000 V. The spectra were scanned from m/z 100 to 1,700.
The MasterHands automatic integration software (Keio University, Tokyo, Japan) was used to obtain peak information, including m/z, peak area and migration time 16 . Signal peaks corresponding to isotopomers, adducts and other product ions of known metabolites were excluded, and the remaining peaks were annotated according to the HMT metabolome database based on their m/z values and migration times. The areas of the annotated peaks were then normalized by sensitivity correction of analyzers, sample volumes, tissue weight and number of cells to obtain the relative levels of each metabolite.
Statistical analysis
For plasma metabolome data, partial least squares (PLS) regression analysis was carried out to visualize the data of metabolites and to assess the total metabolic difference between the three groups of type 1 diabetes using HMT's proprietary R program. Multiple comparisons of non‐parametric data were carried out using the Steel–Dwass method. The sample size required for statistical analysis was calculated by G* Power v3.1 or R program. For identified metabolites, receiver operating characteristic (ROC) analysis was used to assess the performance in identifying the clinical stages of type1 diabetes among all participants, including healthy controls and those with type 2 diabetes. Bonferroni correction was used for multiple analyses in ROC analysis. Statistical analyses were carried out using JMP statistical software (JMP Pro version 14.0.0; SAS Institute, Cary, NC, USA). Quantitative data are expressed as the mean ± standard deviation. Categorical variables are expressed as the number (percentage) of patients. Statistical significance was defined as P < 0.05. There were no missing data for clinical information and laboratory data.
Resource availability
No compounds, non‐commercial reagents or other critical resources were used in the present study.
RESULTS
Metabolomic analysis of type 1 diabetes
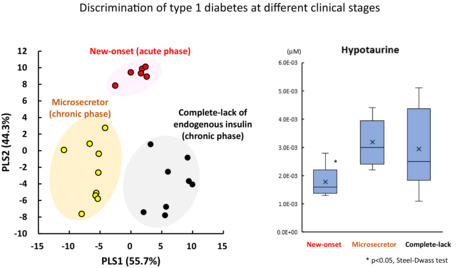
Metabolomic analysis identified a total of 737 peaks in 33 plasma samples using CE‐FTMS and LC‐TOFMS. CE‐FTMS detected hydrophilic and ionic metabolites (210 anions and 283 cations), including amino acids and nucleic acids, whereas LC‐TOFMS detected hydrophobic metabolites (106 anions and 138 cations), including lipids. PLS regression analysis was used to extract metabolites useful for discriminating type 1 diabetes into three groups according to clinical stage and residual β‐cell function (new‐onset, microsecretor and complete lack). As shown in Figure 1, a complete lack of endogenous insulin (closed circle) or new‐onset type 1 diabetes (open circle) was segregated at high values on the horizontal axis (PLS1) with a clear separation of microsecretors (gray circles) at low PLS1 values. To plot the three groups of type 1 diabetes, the PLS1 axis represented 55.7% of the data distribution. In contrast, PLS2, shown on the vertical axis in Figure 1, represented 44.3% of the data distribution of the three groups, and PLS2 axis clearly separated new‐onset type 1 diabetes (open circle) with high values from low values of microsecretors (gray circle) or complete lack of endogenous insulin (closed circle).
Figure 1.
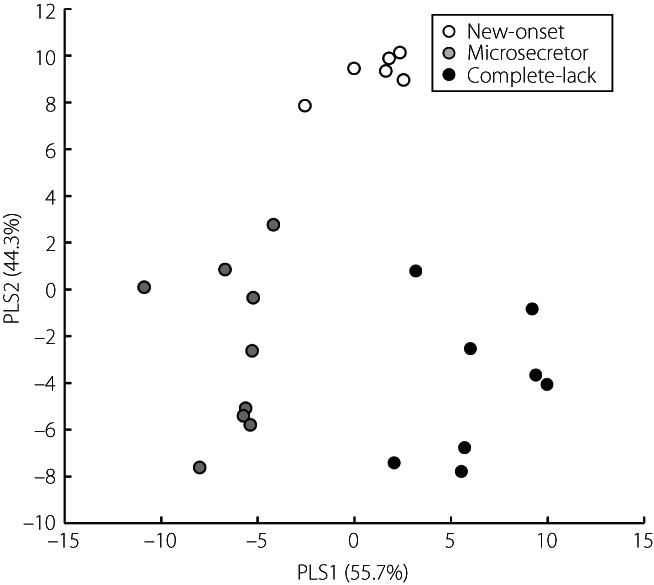
Partial least squares discriminant analysis of metabolomics data in type 1 diabetes. Open circle, new‐onset type 1 diabetes; gray circle: microsecretors of endogenous insulin in type 1 diabetes; closed circle, complete lack of endogenous insulin in type 1 diabetes. PLS, partial least squares.
The present study divided individuals with type 1 diabetes into three groups based on residual insulin secretion as a marker of β‐cell destruction, of which two groups in the chronic phase, microsecretor and complete lack of endogenous insulin groups, included some slowly progressive insulin‐dependent diabetes mellitus. When the results of PLS analysis were presented separately according to the mode of onset (Figure S1), there was no clear difference between slowly progressive insulin‐dependent diabetes mellitus and acute‐onset type 1 diabetes in these two groups. As three out of 23 patients with type 1 diabetes were negative for anti‐islet autoantibodies (Table 1), the results of PLS analysis were shown separately according to the positivity of autoantibodies (Figure S1). No clear correlation was observed between islet autoantibody positivity and coordinates in the PLS analysis.
Metabolites to distinguish new‐onset type 1 diabetes
To identify metabolites to detect β‐cell destruction, we examined the factor loadings on the PLS2 axis to discriminate new‐onset type 1 diabetes, which is expected to be the most active β‐cell destruction among the three groups of type 1 diabetes. The top five metabolites contributing to positive factor loadings on the PLS2 axis are shown in Table 2A, and those contributing to negative factor loadings are shown in Table 2B.
Table 2.
Top five positive factor loading for partial least squares‐2 and negative factor loading for PLS2
| # | ID | Compound name | PLS2 | Number of metabolites detected | ||||
|---|---|---|---|---|---|---|---|---|
| R | P | New‐onset | Microsecretor | Complete‐lack | Total | |||
| n = 6 | n = 9 | n = 8 | n = 23 | |||||
| Positive factor loading for partial least squares‐2 | ||||||||
| 1 | A_0064 | 3‐Phenylpropionic acid | 0.800 | 4.7E‐06 | 6 | 9 | 8 | 23 |
| 2 | C_0273 | Diphenylcarbazide | 0.728 | 8.1E‐05 | 4 | 1 | 1 | 6 |
| 3 | P_0018 | Piperine‐1 | 0.615 | 1.8E‐03 | 6 | 8 | 8 | 22 |
| 4 | P_0019 | Piperine‐2 | 0.590 | 3.0E‐03 | 6 | 8 | 8 | 22 |
| 5 | C_0283 | γ‐Glu‐Cys | 0.553 | 6.2E‐03 | 3 | 1 | 0 | 4 |
| Negative factor loading for partial least squares‐2 | ||||||||
| 1 | C_0170 | Phenylalanine | –0.538 | 8.1E‐03 | 6 | 9 | 8 | 23 |
| 2 | N_0044 | Ricinoleic acid‐4 | −0.492 | 1.7E‐02 | 3 | 5 | 8 | 16 |
| 3 | C_0041 | Hypotaurine | −0.484 | 1.9E‐02 | 6 | 9 | 8 | 23 |
| 4 | A_0045 | 2‐Hydroxy‐4‐methylvaleric acid | −0.484 | 1.9E‐02 | 6 | 9 | 8 | 23 |
| 5 | A_0163 | Mucic acid | −0.475 | 2.2E‐02 | 6 | 9 | 8 | 23 |
PLS, partial least squares; R, correlation coefficient.
Among these factor loadings, two metabolites related to phenylalanine metabolism in the intestinal lumen were identified. Phenylalanine (R = −0.538, P = 8.1 × 10⁻³; Table 2B) and 3‐phenylpropionic acid (R = 0.80, P = 4.7 × 10⁻⁶; Table 2A) were significantly correlated with PLS2 values, and were detected in all 23 samples in type 1 diabetes. Thus, PLS analysis showed that a high concentration of 3‐phenylpropionic acid and a low concentration of phenylalanine increased the PLS2 score, and contributed to the discrimination of new‐onset type 1 diabetes. When the plasma concentrations of metabolites were compared between groups (Figure 2), phenylalanine was significantly lower in new‐onset type 1 diabetes than in microsecretors (P < 0.05), and 3‐phenylpropionic acid levels were significantly higher in new‐onset type 1 diabetes than in microsecretors (P < 0.05) or complete lack of endogenous insulin (P < 0.01). Phenylpyruvic acid, an intermediate metabolite of phenylalanine and 3‐phenylpropionic acid, showed no differences between the groups. Plasma concentrations of phenylalanine and 3‐phenylpropionic acid in type 1 diabetes as a whole, which combined the three groups, were not significantly different from those in healthy controls or type 2 diabetes patients (Figure 2).
Figure 2.
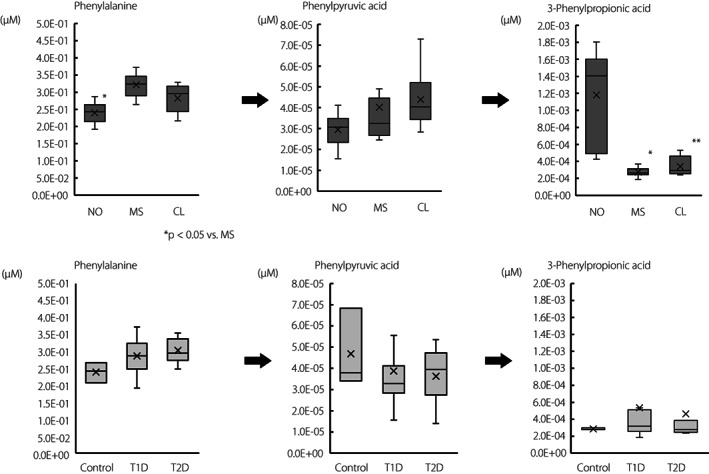
Phenylalanine metabolism in the intestinal lumen. *P < 0.05, **P < 0.01 versus NO, Steel–Dwass test. CL, complete lack of endogenous insulin in type 1 diabetes (n = 8); MS, microsecretors of endogenous insulin in type 1 diabetes (n = 9); NO, new‐onset type 1 diabetes (n = 6); T1D, type 1 diabetes; T2D, type 2 diabetes (n = 7).
Hypotaurine, which is synthesized from cysteine and is involved in the hypotaurine‐taurine pathway as an anti‐oxidant, was also extracted as a negative factor loading for the PLS2 axis (R = –0.484, P = 1.9 × 10⁻²; Table 2B). As shown in Figure 3, the plasma concentration of hypotaurine in new‐onset type 1 diabetes patients was significantly lower than that in microsecretors (P < 0.05). Type 1 diabetes as a whole of all three groups did not show a decrease in hypotaurine when compared with healthy controls or type 2 diabetes patients (Figure 3), indicating a difference specific to new‐onset diabetes alone. There were no significant differences in cysteine, the substrate of hypotaurine or taurine, the oxidized metabolite of hypotaurine, among the three groups with type 1 diabetes (Figure 3).
Figure 3.
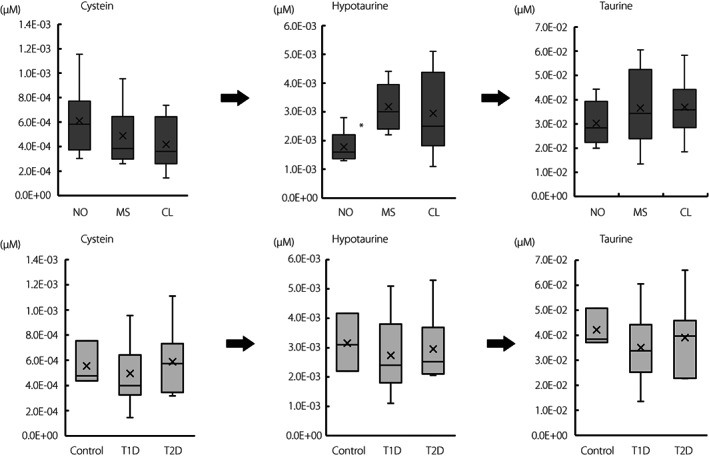
Hypotaurine–taurine pathway as an anti‐oxidative mechanism. *P < 0.05 versus MR, Steel–Dwass test. CL, complete lack of endogenous insulin in type 1 diabetes (n = 8); MS, microsecretors of endogenous insulin in type 1 diabetes (n = 9); NO, new‐onset type 1 diabetes (n = 6); T1D, type 1 diabetes; T2D, type 2 diabetes (n = 8).
Metabolites to distinguish complete lack of endogenous insulin in type 1 diabetes
In PLS analysis, the complete lack of endogenous insulin was segregated into high PLS1 with a low PLS2 axis (Figure 1, closed circle). Two metabolites related to deoxyribonucleic acid (DNA) methylation were listed in both positive (5‐methylcytosine; R = 0.55, P = 6.5 × 10⁻³; Table 3A) and negative factor loadings (3‐methylguanine; R = –0.48, P = 2.0 × 10⁻²; Table 3B) for the PLS1 axis. Thus, PLS analysis showed that a high concentration of 5‐methylcytosine or a low concentration of 3‐methylguanine increased the PLS1 score and contributed to the discrimination of a complete lack of endogenous insulin from other types of type 1 diabetes (Figure 1). As shown in Figure S2, the plasma concentration of 5‐methylcytosine was significantly higher in the complete lack of endogenous insulin than in microsecretors (P < 0.05), and was significantly higher in type 1 diabetes in a whole of three groups than in type 2 diabetes (P < 0.05). No significant difference was observed in 3‐methylguanine levels between the groups (Figure S2).
Table 3.
Top five positive factor loading for partial least squares‐1 and negative factor loading for PLS1
| # | ID | Compound name | PLS1 | Number of metabolites detected | ||||
|---|---|---|---|---|---|---|---|---|
| R | P | new‐onset | microsecretor | complete‐lack | total | |||
| n = 6 | n = 9 | n = 8 | n = 23 | |||||
| Positive factor loading for partial least squares‐1 | ||||||||
| 1 | N_0044 | Ricinoleic acid‐4 | 0.614 | 1.8E‐03 | 3 | 5 | 8 | 16 |
| 2 | A_0130 | XA0017(7‐Keto‐8‐aminopelargonic acid) | 0.591 | 3.0E‐03 | 6 | 9 | 8 | 23 |
| 3 | A_0073 | 2‐Oxobutyric acid | 0.586 | 3.3E‐03 | 6 | 8 | 8 | 22 |
| 4 | C_0073 | 5‐Methylcytosine | 0.550 | 6.5E‐03 | 4 | 4 | 8 | 16 |
| 5 | P_0023 | Palmitoylethanolamide | 0.540 | 7.9E‐03 | 6 | 9 | 8 | 23 |
| Negative factor loading for partial least squares‐1 | ||||||||
| 1 | C_0018 | β‐Alanine | −0.556 | 5.9E‐03 | 6 | 9 | 8 | 23 |
| 2 | C_0103 | Aspartic acid | −0.529 | 9.5E‐03 | 6 | 9 | 8 | 23 |
| 3 | C_0164 | S‐Methylmethionine | −0.481 | 2.0E‐02 | 6 | 9 | 7 | 22 |
| 4 | C_0168 | 3‐Methylguanine | −0.480 | 2.0E‐02 | 4 | 8 | 3 | 15 |
| 5 | C_0077 | Imidazole‐4‐acetic acid | −0.449 | 3.2E‐02 | 6 | 9 | 8 | 23 |
PLS, partial least squares; R, correlation coefficient.
Palmitoylethanolamide was another positive factor loading in PLS1 (R = 0.540, P = 7.9 × 10⁻³; Table 3A), and the plasma concentration was significantly higher in the complete lack of endogenous insulin than in other type 1 diabetes (P < 0.05; Figure S3).
Metabolites to distinguish microsecretors of endogenous insulin in type 1 diabetes
All microsecretors were plotted in the lower‐left coordinates, as shown in Figure 1, showing low values on both the PLS1 and PLS2 axes. The conditions of low positive factor loadings (Table 2A) and high negative factor loadings (Table 2B) resulted in low values on the PLS2 axis, as in the microsecretors group shown in Figure 1. On the PLS2 axis, metabolites related to phenylalanine metabolism were at the top of both the positive (3‐phenylpropionic acid) and negative (phenylalanine) factor loadings. As shown in Figure 2, phenylalanine levels were significantly higher (P < 0.05; Figure 2), whereas 3‐phenylpropionic acid levels were significantly lower in microsecretors than in those with new‐onset type 1 diabetes (P < 0.05; Figure 2).
The top five metabolites contributing to positive factor loadings on the PLS1 axis are shown in Table 3A, and those contributing to negative factor loadings are shown in Table 3B. XA0017, an unknown positive factor loading in PLS1, is estimated to be 7‐keto‐8‐aminopelargonic acid according to its molecular weight (187.24 g/mol), which is involved in biotin biosynthesis in Escherichia coli and other intestinal bacteria. The plasma concentration of XA0017 in microsecretors was significantly lower than that in the complete lack of endogenous insulin group (P < 0.05), but was comparable with that in controls, suggesting no contribution to discriminate microsecretors.
ROC analysis of metabolites to distinguish the clinical stage of type 1 diabetes
Next, ROC curve analysis was carried out to determine whether the 19 candidate metabolites identified by PLS analysis could discriminate type 1 diabetes in the three groups, including healthy controls and type 2 diabetes patients (Table S2). ROC analysis showed that 3‐phenylpropionic acid (area under the curve [AUC] 0.96, Pc = 5.6 × 10−43, cut‐off: 4.3 × 10⁻⁴ μmol/L) and hypotaurine (AUC 0.88, Pc = 9.8 × 10⁻⁵, cut‐off: 2.0 × 10⁻³ μmol/L) were significant markers for discriminating new‐onset type 1 diabetes from healthy controls, other type 1 diabetes and type 2 diabetes (Figure 4). In contrast, phenylalanine, the precursor of 3‐phenylpropionic acid, was higher in the microsecretors in the between‐group comparison (Figure 2). ROC analysis showed that phenylalanine was a significant indicator for diagnosing microsecretors (Table S2; AUC 0.81; Pc = 6.3 × 10⁻³, cut‐off 0.315 μmol/L). Based on these observations, the most significant indicator for detecting microsecretors was obtained when the ratio of phenylalanine (Phe) to 3‐phenylpropionic acid (3PPA) was used for ROC analysis (Phe/3PPA; AUC 0.86, Pc = 2.4 × 10⁻⁷, cut‐off 1,010.8; Figure S4b), with a high Phe/3PPA ratio (Figure S4a). In contrast, a low Phe/3PPA ratio was the most useful marker for detecting new‐onset type 1 diabetes (AUC 0.98, Pc = 2.4 × 10−94, cut‐off 521.4; Figure S4a,b).
Figure 4.
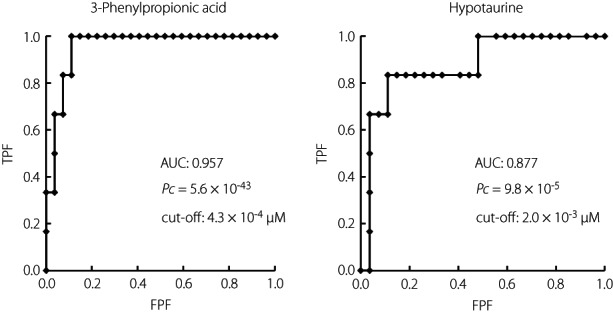
Receiver operating characteristic analysis of metabolites to discriminate new‐onset type 1 diabetes with healthy controls, microsecretors/complete lack of endogenous insulin and type 2 diabetes. The cut‐off values were calculated using the Youden index. Pc: P‐value was corrected using the number tested (n = 19). Signals for receiver operating characteristic analysis were set to 1 for new‐onset type 1 diabetes, and 0 for microsecretors/complete lack of endogenous insulin, controls and type 2 diabetes. AUC, area under the curve; FPF, false positive fraction; TPF, true‐ positive fraction.
For the diagnosis of complete lack of endogenous insulin, ricinoleic acid‐4 (AUC 0.95, Pc = 5.8 × 10⁻²⁷, cut‐off 1.1 × 10⁻⁵ μmol/L), palmitoylethanolamide (AUC 0.82, Pc = 6.2 × 10⁻⁴, cut‐off 6.8 × 10⁻⁴ μmol/L) and 5‐methylcytosine (AUC: 0.81, Pc = 2.3 × 10⁻³, cut‐off: 8.7 × 10⁻⁶ μmol/L) were shown to be significant markers (Figure S5, Table S2).
DISCUSSION
The objectives of the present study were to identify putative metabolic markers of β‐cell destruction, and to obtain information that will provide a new basis for understanding the pathogenesis and therapeutic interventions in type 1 diabetes. Therefore, we analyzed cases of type 1 diabetes by dividing them into three groups: (i) new‐onset type 1 diabetes in the acute phase, in which the most intensive β‐cell destruction occurs; (ii) microsecretors, in which persistent β‐cell destruction progresses to the chronic phase; and (iii) complete lack of endogenous insulin, in which almost all β‐cells are destroyed and insulin secretion is not detectable in the chronic phase.
The present study identified 3‐phenylpropionic acid and hypotaurine as useful biomarkers for the discrimination of new‐onset type 1 diabetes from other chronic stages of type 1 diabetes, such as microsecretors and a complete lack of endogenous insulin in type 1 diabetes (Figures 1, 2, 3). 3‐Phenylpropionic acid is an end‐product of bacterial degradation of unabsorbed phenylalanine in the intestinal lumen 17 . Insufficient intake of phenylalanine, an essential amino acid, also causes a decrease in blood levels, in which case an increase in the concentration of the end‐product, 3‐phenylpropionic acid, is unlikely to occur. Thus, elevated levels of 3‐phenylpropionic acid in new‐onset type 1 diabetes suggest that the intestinal environment is significantly altered during its developing type 1 diabetes. In particular, elevated 3‐phenylpropionic acid levels in the blood are most strongly correlated with the diversity of the gut microbiota 18 . Taken together, the results of the previous report and the present study suggest that the diversity of gut microbiota is altered significantly at the onset of type 1 diabetes, and that the diversity maintained immediately after the onset of the disease is lost over the chronic phase. The gut microbiota in pre‐diabetes and post‐onset type 1 diabetes is known to differ from that in healthy controls 19 , 20 , and might be involved in the development of autoimmune reactions to β‐cells 21 . As in the case of new‐onset type 1 diabetes, identification of biomarkers of progressive β‐cell destruction in microsecretors is of great clinical significance in the chronic phase of type 1 diabetes. Phenylalanine, the precursor of 3‐phenylpropionic acid, was the only significant metabolite in discriminating microsecretors from other groups through ROC analysis (Table S2). The Phe/3PPA ratio helped in the diagnosis of microsecretors at high values and new‐onset type 1 diabetes at low values (Figure S4a,b). These observations suggest that a gradual increase in the Phe/3PPA ratio, which is low immediately after disease onset, is a new indicator of progressive β‐cell destruction in the chronic phase of type 1 diabetes.
Phenylalanine, whose levels were high in the microsecretors in the present study, is an essential amino acid obtained through diet and the degradation of endogenous proteins. Hyperphenylalaninemia has been reported to be involved in mitochondrial dysfunction and inflammation in neurons and hepatocytes 22 , or DNA damage in blood cells 23 , potentially involving pancreatic β‐cell damage.
It has been reported that β‐cells have significantly lower expression of anti‐oxidant enzymes than other organs, such as the liver, and are highly vulnerable to oxidative stress 24 , and that β‐cell‐specific expression of the anti‐oxidant thioredoxin suppresses β‐cell destruction and type 1 diabetes development 25 . Given the background of β‐cell protection by taurine administration in non‐obese diabetic mice 12 , and the identification of the CSAD gene as a novel disease susceptibility gene for fulminant type 1 diabetes 11 , it is noteworthy that hypotaurine, a precursor of taurine, was significantly reduced in new‐onset type 1 diabetes in the present study. Cysteine is converted into hypotaurine by cysteine dioxygenase and CSAD, which is further oxidized to taurine, and the decrease in hypotaurine levels in new‐onset type 1 diabetes may be a result of reduced CSAD activity or increased consumption of hypotaurine. Hypotaurine serves as a suicidal anti‐oxidant that is readily oxidized into taurine under oxidative stress, such as acute pathological conditions 26 . Taurine administration reduces oxidative stress and is involved in β‐cell protection in pancreatic islets in streptozotocin‐induced diabetes 27 . ROC analysis showed that low levels of hypotaurine are key metabolic markers that clearly distinguish new‐onset type 1 diabetes from chronic type 1 diabetes, type 2 diabetes and healthy controls, showing that hypotaurine is consumed in a state of intensive β‐cell destruction. Taken together, it is hypothetically possible that taurine supplementation in the acute phase immediately after the onset of disease might exert a protective effect on β‐cells.
One of the positive factor loadings of the PLS1 axis, 5‐methylcytosine is a DNA modification that occurs when an S‐adenosyl methionine‐derived methyl group is translocated at the fifth carbon position of the cytosine residue. The chemical modification of cytosine, termed ‘methylation’, at the CpG island of the promoter region suppresses gene expression 28 . An increased concentration of 5‐methylcytosine in the plasma of type 1 diabetes patients, especially in those with complete lack of endogenous insulin, might indicate the progressive fragmentation of DNA caused by cell destruction and the involvement of epigenetic regulation in the development of type 1 diabetes. The expression of TET2, which regulates DNA methylation status, is responsible for β‐cell destruction in non‐obese diabetic mice 29 , whereas the lack of TET2 expression leads to β‐cell protection and evasion of inflammatory responses in individuals with long‐standing type 1 diabetes 29 , thereby suggesting a strong link between DNA methylation status and β‐cell destruction. Increased DNA methylation has been reported in the Foxp3 promoter region, which inhibits the binding of IRF7 and reduces regulatory T cells in individuals with type 1 diabetes 30 . According to an epigenome‐wide association study using CD4+ T cells, B cells and monocytes, substantial enrichment of differentially variable CpG positions has been identified, indicating a role for DNA methylation in the pathogenesis of type 1 diabetes 31 .
The limitations of the present study were as follows. First, this was a cross‐sectional study, and a longitudinal study with samples collected over time during the development of type 1 diabetes is required to validate our results. Second, the specific mechanisms by which metabolites are potential biomarkers involved in β‐cell destruction are unknown. Several confounding factors, such as sex, age and glycemic control, might have affected the results. Regarding sex as a confounding factor, we assume that it has no significant effect, as individual plots based on PLS analysis show no difference between men and women. With respect to the effect of differences in age and glycemic control on the quantifiability of metabolites among the three groups of type 1 diabetes, no significant correlation was found between age and glycated hemoglobin for either 3‐phenylpropionic acid (age: R = 0.25, P = 0.19, glycated hemoglobin: R = 0.14, P = 0.48) or hypotaurine (age: R = 0.08, P = 0.67, glycated hemoglobin: R = 0.23, P = 0.22). Finally, as the present study focused on acute‐onset type 1 diabetes, especially new‐onset type 1 diabetes, it is not clear whether it also applies to fulminant type 1 diabetes and type 1 diabetes caused by immune checkpoint inhibitors.
In Japan, most cases of acute‐onset or fulminant type 1 diabetes show depletion of endogenous insulin, but in some cases, endogenous insulin secretion is preserved for a long period. It is extremely difficult to predict which cases of slowly progressive insulin‐dependent diabetes mellitus will maintain insulin secretion over a long period, despite being positive for anti‐islet autoantibodies. Prospective investigations using the new metabolic signature of β‐cell destruction might aid in elucidating the pathogenesis in these cases, in which endogenous insulin secretion is preserved for a long period.
In conclusion, the metabolic signature assessed through metabolomic analysis successfully identified the different clinical stages of type 1 diabetes. The present study showed that elevated 3‐phenylpropionic acid and decreased hypotaurine levels might be novel metabolic markers for new‐onset type 1 diabetes. These results might serve as early biomarkers of β‐cell destruction that cannot be assessed using serum C‐peptide or anti‐islet autoantibodies, such as glutamic acid decarboxylase antibodies, and might lead to early therapeutic intervention to maintain residual β‐cell function, thereby preventing acute metabolic failure due to β‐cell destruction. These results provide fundamental information that might contribute to the elucidation of the pathophysiology of type 1 diabetes and the establishment of novel methods for β‐cell protection.
DISCLOSURE
The authors declare no conflict of interest
Approval of the research protocol: The research protocol was approved by the ethics committees of Kindai University (18–046, February 23rd, 2013).
Informed consent: All patients gave written informed consent.
Registry and the registration no. of the study/trial: N/A.
Animal studies: N/A.
Supporting information
Figure S1 | Partial least squares discriminant analysis results of metabolomics data are shown separately according to the mode of onset (upper panel) and the positivity of autoantibodies (lower panel) in type 1 diabetes.
Figure S2 | Metabolites related to deoxyribonucleic acid methylation.
Figure S3 | Palmitoylethanolamide.
Figure S4 | (A) Comparisons of phenylalanine to 3‐phenylpropionic acid (Phe/3PPA) ratios among groups with type 1 diabetes. (B) Receiver operating characteristic (ROC) curve analysis of metabolites to distinguish between microsecretors/individuals with new‐onset type 1 diabetes and individuals with complete lack of endogenous insulin, healthy controls, and individuals with type 2 diabetes.
Figure S5 | Receiver operating characteristic (ROC) analysis of metabolites to discriminate complete lack of endogenous insulin with healthy controls, new‐onset /microsecretors type 1 diabetes and type 2 diabetes.
Table S1 | Haplotype/allele frequencies of human leukocyte antigen in three groups of individuals with type 1 diabetes.
Table S2 | Receiver operating characteristic analysis of metabolites.
ACKNOWLEDGMENTS
We thank Ms Shie Hayase and Ms Mariko Shiota for their skillful technical assistance, Human Metabolome Technologies for their statistical support with the metabolomic analysis, and Editage (www.editage.com) for English language editing. This study was supported by Grants‐in‐Aid for Scientific Research(C) from the Ministry of Education, Culture, Sports, Science and Technology (MEXT) of Japan (17K09852 to SN, 21K08589 to HI), and a research grant from the Manpei Suzuki Diabetes Foundation (SN).
REFERENCES
- 1. Atkinson MA, Eisenbarth GS, Michels AW. Type 1 diabetes. Lancet 2014; 383: 69–82. [DOI] [PMC free article] [PubMed] [Google Scholar]
- 2. Uno S, Imagawa A, Kozawa J, et al. Complete loss of insulin secretion capacity in type 1A diabetes patients during long‐term follow up. J Diabetes Investig 2018; 9: 806–812. [DOI] [PMC free article] [PubMed] [Google Scholar]
- 3. Keenan HA, Sun JK, Levine J, et al. Residual insulin production and pancreatic ss‐cell turnover after 50 years of diabetes: Joslin Medalist Study. Diabetes 2010; 59: 2846–2853. [DOI] [PMC free article] [PubMed] [Google Scholar]
- 4. Oram RA, Jones AG, Besser RE, et al. The majority of patients with long‐duration type 1 diabetes are insulin microsecretors and have functioning beta cells. Diabetologia 2014; 57: 187–191. [DOI] [PMC free article] [PubMed] [Google Scholar]
- 5. Ikegami H, Babaya N, Noso S. beta‐Cell failure in diabetes: common susceptibility and mechanisms shared between type 1 and type 2 diabetes. J Diabetes Investig 2021; 12: 1526–1539. [DOI] [PMC free article] [PubMed] [Google Scholar]
- 6. Fukuda M, Tanaka A, Tahara Y, et al. Correlation between minimal secretory capacity of pancreatic beta‐cells and stability of diabetic control. Diabetes 1988; 37: 81–88. [DOI] [PubMed] [Google Scholar]
- 7. Babaya N, Noso S, Hiromine Y, et al. Relationship of continuous glucose monitoring‐related metrics with HbA1c and residual beta‐cell function in Japanese patients with type 1 diabetes. Sci Rep 2021; 11: 4006. [DOI] [PMC free article] [PubMed] [Google Scholar]
- 8. Shibasaki S, Imagawa A, Terasaki J, et al. Endogenous insulin secretion even at a very low level contributes to the stability of blood glucose control in fulminant type 1 diabetes. J Diabetes Investig 2010; 1: 283–285. [DOI] [PMC free article] [PubMed] [Google Scholar]
- 9. Hanafusa T, Imagawa A. Fulminant type 1 diabetes: a novel clinical entity requiring special attention by all medical practitioners. Nat Clin Pract Endocrinol Metab 2007; 3: 36–45 quiz 32p following 69. [DOI] [PubMed] [Google Scholar]
- 10. Ikegami H, Kawabata Y, Noso S. Immune checkpoint therapy and type 1 diabetes. Diabetol Int 2016; 7: 221–227. [DOI] [PMC free article] [PubMed] [Google Scholar]
- 11. Kawabata Y, Nishida N, Awata T, et al. Genome‐wide association study confirming a strong effect of HLA and identifying variants in CSAD/lnc‐ITGB7‐1 on chromosome 12q13.13 associated with susceptibility to fulminant type 1 diabetes. Diabetes 2019; 68: 665–675. [DOI] [PubMed] [Google Scholar]
- 12. Arany E, Strutt B, Romanus P, et al. Taurine supplement in early life altered islet morphology, decreased insulitis and delayed the onset of diabetes in non‐obese diabetic mice. Diabetologia 2004; 47: 1831–1837. [DOI] [PubMed] [Google Scholar]
- 13. Araki E, Goto A, Kondo T, et al. Japanese clinical practice guideline for diabetes 2019. Diabetol Int 2020; 11: 165–223. [DOI] [PMC free article] [PubMed] [Google Scholar]
- 14. Imagawa A, Hanafusa T, Awata T, et al. Report of the committee of the japan diabetes society on the research of fulminant and acute‐onset type 1 diabetes mellitus: new diagnostic criteria of fulminant type 1 diabetes mellitus (2012). J Diabetes Investig 2012; 3: 536–539. [DOI] [PMC free article] [PubMed] [Google Scholar]
- 15. Sasaki K, Sagawa H, Suzuki M, et al. Metabolomics platform with capillary electrophoresis coupled with high‐resolution mass spectrometry for plasma analysis. Anal Chem 2019; 91: 1295–1301. [DOI] [PubMed] [Google Scholar]
- 16. Sugimoto M, Wong DT, Hirayama A, et al. Capillary electrophoresis mass spectrometry‐based saliva metabolomics identified oral, breast and pancreatic cancer‐specific profiles. Metabolomics 2010; 6: 78–95. [DOI] [PMC free article] [PubMed] [Google Scholar]
- 17. Rinaldo P, O'Shea JJ, Welch RD, et al. The enzymatic basis for the dehydrogenation of 3‐phenylpropionic acid: in vitro reaction of 3‐phenylpropionyl‐CoA with various acyl‐CoA dehydrogenases. Pediatr Res 1990; 27: 501–507. [DOI] [PubMed] [Google Scholar]
- 18. Menni C, Zhu J, Le Roy CI, et al. Serum metabolites reflecting gut microbiome alpha diversity predict type 2 diabetes. Gut Microbes 2020; 11: 1632–1642. [DOI] [PMC free article] [PubMed] [Google Scholar]
- 19. de Goffau MC, Fuentes S, van den Bogert B, et al. Aberrant gut microbiota composition at the onset of type 1 diabetes in young children. Diabetologia 2014; 57: 1569–1577. [DOI] [PubMed] [Google Scholar]
- 20. Mejia‐Leon ME, Petrosino JF, Ajami NJ, et al. Fecal microbiota imbalance in Mexican children with type 1 diabetes. Sci Rep 2014; 4: 3814. [DOI] [PMC free article] [PubMed] [Google Scholar]
- 21. Knip M, Siljander H. The role of the intestinal microbiota in type 1 diabetes mellitus. Nat Rev Endocrinol 2016; 12: 154–167. [DOI] [PubMed] [Google Scholar]
- 22. Wyse ATS, Dos Santos TM, Seminotti B, et al. Insights from animal models on the pathophysiology of hyperphenylalaninemia: role of mitochondrial dysfunction, oxidative stress and inflammation. Mol Neurobiol 2021; 58: 2897–2909. [DOI] [PubMed] [Google Scholar]
- 23. Sitta A, Manfredini V, Biasi L, et al. Evidence that DNA damage is associated to phenylalanine blood levels in leukocytes from phenylketonuric patients. Mutat Res 2009; 679: 13–16. [DOI] [PubMed] [Google Scholar]
- 24. Tiedge M, Lortz S, Drinkgern J, et al. Relation between antioxidant enzyme gene expression and antioxidative defense status of insulin‐producing cells. Diabetes 1997; 46: 1733–1742. [DOI] [PubMed] [Google Scholar]
- 25. Hotta M, Tashiro F, Ikegami H, et al. Pancreatic beta cell‐specific expression of thioredoxin, an antioxidative and antiapoptotic protein, prevents autoimmune and streptozotocin‐induced diabetes. J Exp Med 1998; 188: 1445–1451. [DOI] [PMC free article] [PubMed] [Google Scholar]
- 26. Mizota T, Hishiki T, Shinoda M, et al. The hypotaurine‐taurine pathway as an antioxidative mechanism in patients with acute liver failure. J Clin Biochem Nutr 2022; 70: 54–63. [DOI] [PMC free article] [PubMed] [Google Scholar]
- 27. Murakami S, Funahashi K, Tamagawa N, et al. Taurine ameliorates streptozotocin‐induced diabetes by modulating hepatic glucose metabolism and oxidative stress in mice. Metabolites 2022; 12: 524. [DOI] [PMC free article] [PubMed] [Google Scholar]
- 28. Liyanage VR, Jarmasz JS, Murugeshan N, et al. DNA modifications: function and applications in normal and disease States. Biology (Basel) 2014; 3: 670–723. [DOI] [PMC free article] [PubMed] [Google Scholar]
- 29. Rui J, Deng S, Perdigoto AL, et al. Tet2 controls the responses of beta cells to inflammation in autoimmune diabetes. Nat Commun 2021; 12: 5074. [DOI] [PMC free article] [PubMed] [Google Scholar]
- 30. Wang Z, Zheng Y, Hou C, et al. DNA methylation impairs TLR9 induced Foxp3 expression by attenuating IRF‐7 binding activity in fulminant type 1 diabetes. J Autoimmun 2013; 41: 50–59. [DOI] [PubMed] [Google Scholar]
- 31. Paul DS, Teschendorff AE, Dang MA, et al. Increased DNA methylation variability in type 1 diabetes across three immune effector cell types. Nat Commun 2016; 7: 13555. [DOI] [PMC free article] [PubMed] [Google Scholar]
Associated Data
This section collects any data citations, data availability statements, or supplementary materials included in this article.
Supplementary Materials
Figure S1 | Partial least squares discriminant analysis results of metabolomics data are shown separately according to the mode of onset (upper panel) and the positivity of autoantibodies (lower panel) in type 1 diabetes.
Figure S2 | Metabolites related to deoxyribonucleic acid methylation.
Figure S3 | Palmitoylethanolamide.
Figure S4 | (A) Comparisons of phenylalanine to 3‐phenylpropionic acid (Phe/3PPA) ratios among groups with type 1 diabetes. (B) Receiver operating characteristic (ROC) curve analysis of metabolites to distinguish between microsecretors/individuals with new‐onset type 1 diabetes and individuals with complete lack of endogenous insulin, healthy controls, and individuals with type 2 diabetes.
Figure S5 | Receiver operating characteristic (ROC) analysis of metabolites to discriminate complete lack of endogenous insulin with healthy controls, new‐onset /microsecretors type 1 diabetes and type 2 diabetes.
Table S1 | Haplotype/allele frequencies of human leukocyte antigen in three groups of individuals with type 1 diabetes.
Table S2 | Receiver operating characteristic analysis of metabolites.