

Abstract
Background:
International and population-specific evidence identifies elevated psychological distress prevalence among those experiencing interpersonal discrimination. We aim to quantify the potential whole-of-population contribution of interpersonal discrimination to psychological distress prevalence and Indigenous-non-Indigenous ‘gaps’.
Methods:
Applying logistic regression to cross-sectional data from 9,951 Mayi Kuwayu Study adult participants, we calculate unadjusted Odds Ratios (ORs, to approximate Incident Rate Ratios) and 95%CI for high/very high psychological distress in relation to any versus no everyday discrimination and everyday racial (attributed to Indigeneity) discrimination across age-gender strata. Population Attributable Fractions (PAFs), under the hypothetical assumption that ORs represent causal relationships, were calculated using these ORs and population-level exposure prevalence, and used to quantify everyday racial discrimination’s contribution to ‘gaps’.
Findings:
Across strata, ORs for psychological distress were 2·36(95%CI:1·62,3·44; 45·7% versus 26·3%) to 3·12(2·44–3·99; 47·8% versus 22·7%) for everyday discrimination and 1·50(1·09,2·06; 45·0% versus 35·3%) to 2·42(1·89–3·11; 43·1% versus 23·8%) for everyday racial discrimination. Overall, 49·3% of the total psychological distress burden among Aboriginal and Torres Strait Islander adults could be attributable to everyday discrimination (39·4–58·8% across strata). Everyday racial discrimination could explain 47·4% of the ‘gap’ overall (40·0–60·3% across strata).
Interpretations:
Findings demonstrate interpersonal discrimination may contribute substantially to psychological distress among Aboriginal and Torres Strait Islander adults, and to inequities. Estimated PAFs include contributions from social and health disadvantage, reflecting contributions from structural racism. Although not providing strictly conclusive evidence of causality, this evidence is sufficient to indicate harm. Findings add weight to imperatives to combat discrimination—and structural racism at its core. Urgent individual and policy action is required of non-Indigenous peoples and colonial structures, directed by Aboriginal and Torres Strait Islander peoples.
Funding:
National Health and Medical Research Council of Australia, Ian Potter Foundation, Australian Research Council, U.S. National Institutes of Health, and Sierra Foundation.
Keywords: Racism, colonialism, systemic racism, psychological distress, mental health, health inequities, Australia
BACKGROUND
In Australia, Aboriginal and Torres Strait Islander peoples have lived on and from the land for generations, fostering strong cultures, languages and kinship relations, and thriving agriculture and industries. Racism arrived with colonisation in 1788; from the outset, settler-colonists racialized and dehumanised Aboriginal and Torres Strait Islander peoples and deemed the population an intellectually inferior and primitive race,1,2 in order to justify dispossession of land and to legitimise attempted genocide. The contemporary differences observed between Aboriginal and Torres Strait Islander peoples and non-Indigenous people in Australia across a breadth of social and health indicators are not due to biology or ‘race’.3 These inequities are due, at least in large part, to the historic and ongoing effects of settler-colonialism and racism.
Structural racism is the connected and reinforcing system of racialised rules, laws, policies, and regulations that are engrained in institutions including healthcare, education, housing, justice, banking, and the media.4,5 Structural racism impacts a wide range of factors, including access to education and employment opportunities, financial security, adequate housing, and neighbourhood infrastructure and safety, creating inequities across socioeconomic domains.6 Structural racism may impact, directly and indirectly (including through socioeconomic pathways), health behaviours (such as the use of tobacco and alcohol, dietary intake, and physical activity) and exposure to physical, chemical, and psychosocial stressors that can affect risks for poor physical health, functional limitation, mental health, and social and emotional wellbeing.3,5 Structural racism also encompasses cultural and ideological dimensions,6 for example, reproducing representations of the population as ‘inferior’ or ‘vulnerable’, that are then used to justify policies that exacerbate and/or entrench inequities. Historic—and ongoing—policies to remove Aboriginal and Torres Strait Islander children from their families (Stolen Generations) are one such example.
A further manifestation of structural racism is interpersonal discrimination, an expression of racism played out between individuals in everyday life. Interpersonal discrimination can be on the basis of any characteristic (e.g. race, gender, ability); we define interpersonal racial discrimination here as Aboriginal and Torres Strait Islander peoples’ experiences of interpersonal discrimination that are perceived to be due to their Indigeneity. Interpersonal racial discrimination itself is an important stressor and contributor to poor health and inequities. Further, it reinforces racist ideologies, and actualises structural racism.6
Aboriginal and Torres Strait Islander peoples have long said that interpersonal discrimination has negative consequences for health. This is supported by findings from international systematic reviews and meta-analyses.7–9 The existing evidence specific to Aboriginal and Torres Strait Islander peoples is consistent with these findings, identifying associations between interpersonal discrimination and poor health.10,11
Population Attributable Fractions (PAFs) can be used to quantify the potential population-level health impact of an exposure,12 and its contribution to inequities between exposed and unexposed populations. To our knowledge, no study for any Indigenous population internationally has calculated the PAF for any outcome attributable to interpersonal discrimination. Research with other populations has estimated that 5%−46% of the total burden of outcomes including depression, anxiety, post-traumatic stress disorder, and other psychological disorders are attributable to experiences of interpersonal racial discrimination (see Supplementary File 1).13–15 Limited application of the PAF to this context may partly be because the PAF assumes the observed exposure-outcome association is causal,12 and most discrimination-health evidence derives from observational data. However, diverse types and sources of data are important,16 and observational data have an important role to play, including due to the challenging and unethical nature of generating randomised evidence on discrimination-health relationships. Moreover, action against interpersonal discrimination—and structural racism at its core—should be enabled when evidence is sufficient to indicate harm, and to indicate likely benefits from intervention.
In this paper, we aim to quantify across age and gender groups: (1) the relationship of interpersonal discrimination to psychological distress; (2) the potential contribution of interpersonal discrimination to psychological distress at the population level; and, (3) the extent to which the Indigenous-non-Indigenous psychological distress prevalence ‘gap’ could be attributable to interpersonal racial discrimination. This analysis is conducted under the hypothetical assumption that observed Odds Ratios (ORs) reflect causal relationships, after accounting for potential effect modification and confounding by age and gender. We focus on psychological distress because poor mental health is the leading disease group contributing to the burden of disease in the population.17
METHODS
Study population
Mayi Kuwayu: The National Study of Aboriginal and Torres Strait Islander Wellbeing is a longitudinal study of adults ≥16 years. All adults identifying as Aboriginal and/or Torres Strait Islander were eligible to participate. Baseline data collection occurred 2018–2021. The current cross-sectional analysis uses Mayi Kuwayu Study Release 4.0, including survey responses received by May 2021 (n=10,143). Further Study details are provided elsewhere.18,19
The Study sample is designed to capture the diversity of Aboriginal and Torres Strait Islander communities, and results of internal comparisons have been demonstrated to be generalisable beyond the Study sample (unpublished data; Lovett et al.). Sample weights for Mayi Kuwayu Study participants aged ≥18 years have been developed based on national population benchmarks (age, sex, state, remoteness, educational attainment, employment and housing tenure status), enabling generation of weighted prevalence estimates reflective of the national Aboriginal and Torres Strait Islander adult population (unpublished data; Baffour et al.).
Data
The current study analyses self-reported responses to the Mayi Kuwayu Study baseline questionnaire, and remoteness data based on geocoded postal address.
Everyday discrimination (interpersonal discrimination on the basis of any characteristic) was measured using a validated, eight-item measure modified from the Everyday Discrimination Scale through an iterative consultative process.20 Participants were classified as experiencing everyday racial discrimination if they experienced discrimination and attributed these experiences to their Indigeneity. Psychological distress was measured using a validated, modified Kessler-5 scale;21 throughout, we focus on the high/very high psychological distress category.
See Supplementary File 2 for details.
Approach to accounting for potential effect modification and confounding
The interdependent and reinforcing nature of the relationships between structural racism, interpersonal discrimination, and health and social factors, make it difficult to isolate the effects of interpersonal discrimination (see Box 1).
Box 1. Illustration of the interdependent and reinforcing nature of the relationships between structural racism, interpersonal discrimination, and health and social factors.
As an illustrative case, we describe the potential role of socioeconomic status in the everyday discrimination-psychological distress relationship. Structural racism creates the conditions that drive disadvantage across all domains of social wellbeing. As a result, Aboriginal and Torres Strait Islander peoples disproportionately experience financial strain compared to non-Indigenous peoples. Financial strain is acknowledged as a contributor to psychological distress; psychological distress could also cause financial strain, for example if a person is unable to work. Financial strain may also be related to experiences of discrimination, and therefore could confound discrimination-psychological distress relationships. However, there is no clear empirical evidence of a linear relationship between socioeconomic position and discrimination experiences for Aboriginal and Torres Strait Islander peoples. While we also lack robust evidence on the temporality of these relationships, conceptual understanding is consistent with discrimination preceding low socioeconomic position; that is, experiences of discrimination—such as unfair treatment at work or school, or by police—can directly impact one’s financial security, which in turn can impact psychological distress. This supports a mediating role of financial status in the discrimination-psychological distress relationship. Further, any accumulation across the population of financial strain caused by discrimination reinforces racist ideologies thus reinforcing structural racism.
The current analysis was conducted within a health equity frame, and as such we followed the approach proposed by Jackson22 for classifying potential confounders as ‘allowable’ for adjustment (if variation in the outcome according to the covariate is considered ‘just’ or ‘fair’) or ‘non-allowable’ (if variation is considered ‘unjust’ or ‘unfair’).
In a world without racism, there would be no systematic differences between Aboriginal and Torres Strait Islander peoples and non-Indigenous people in access to health-promoting social factors (such as education, employment, financial status); accordingly, any health risk factor or health outcome predominantly driven by social factors would likely be similar in prevalence.
Under the Jackson framework, variation in psychological distress according to social or health factors therefore reflects ‘unjust’ or ‘unfair’ variation, and hence adjustment for these factors is not appropriate. See Figure 1 and Supplementary File 2 for the variables considered and rationale. It is important to note that the estimated PAF for the impact of interpersonal discrimination on psychological distress will include contributions from structural racism operating through these pathways.
Figure 1.
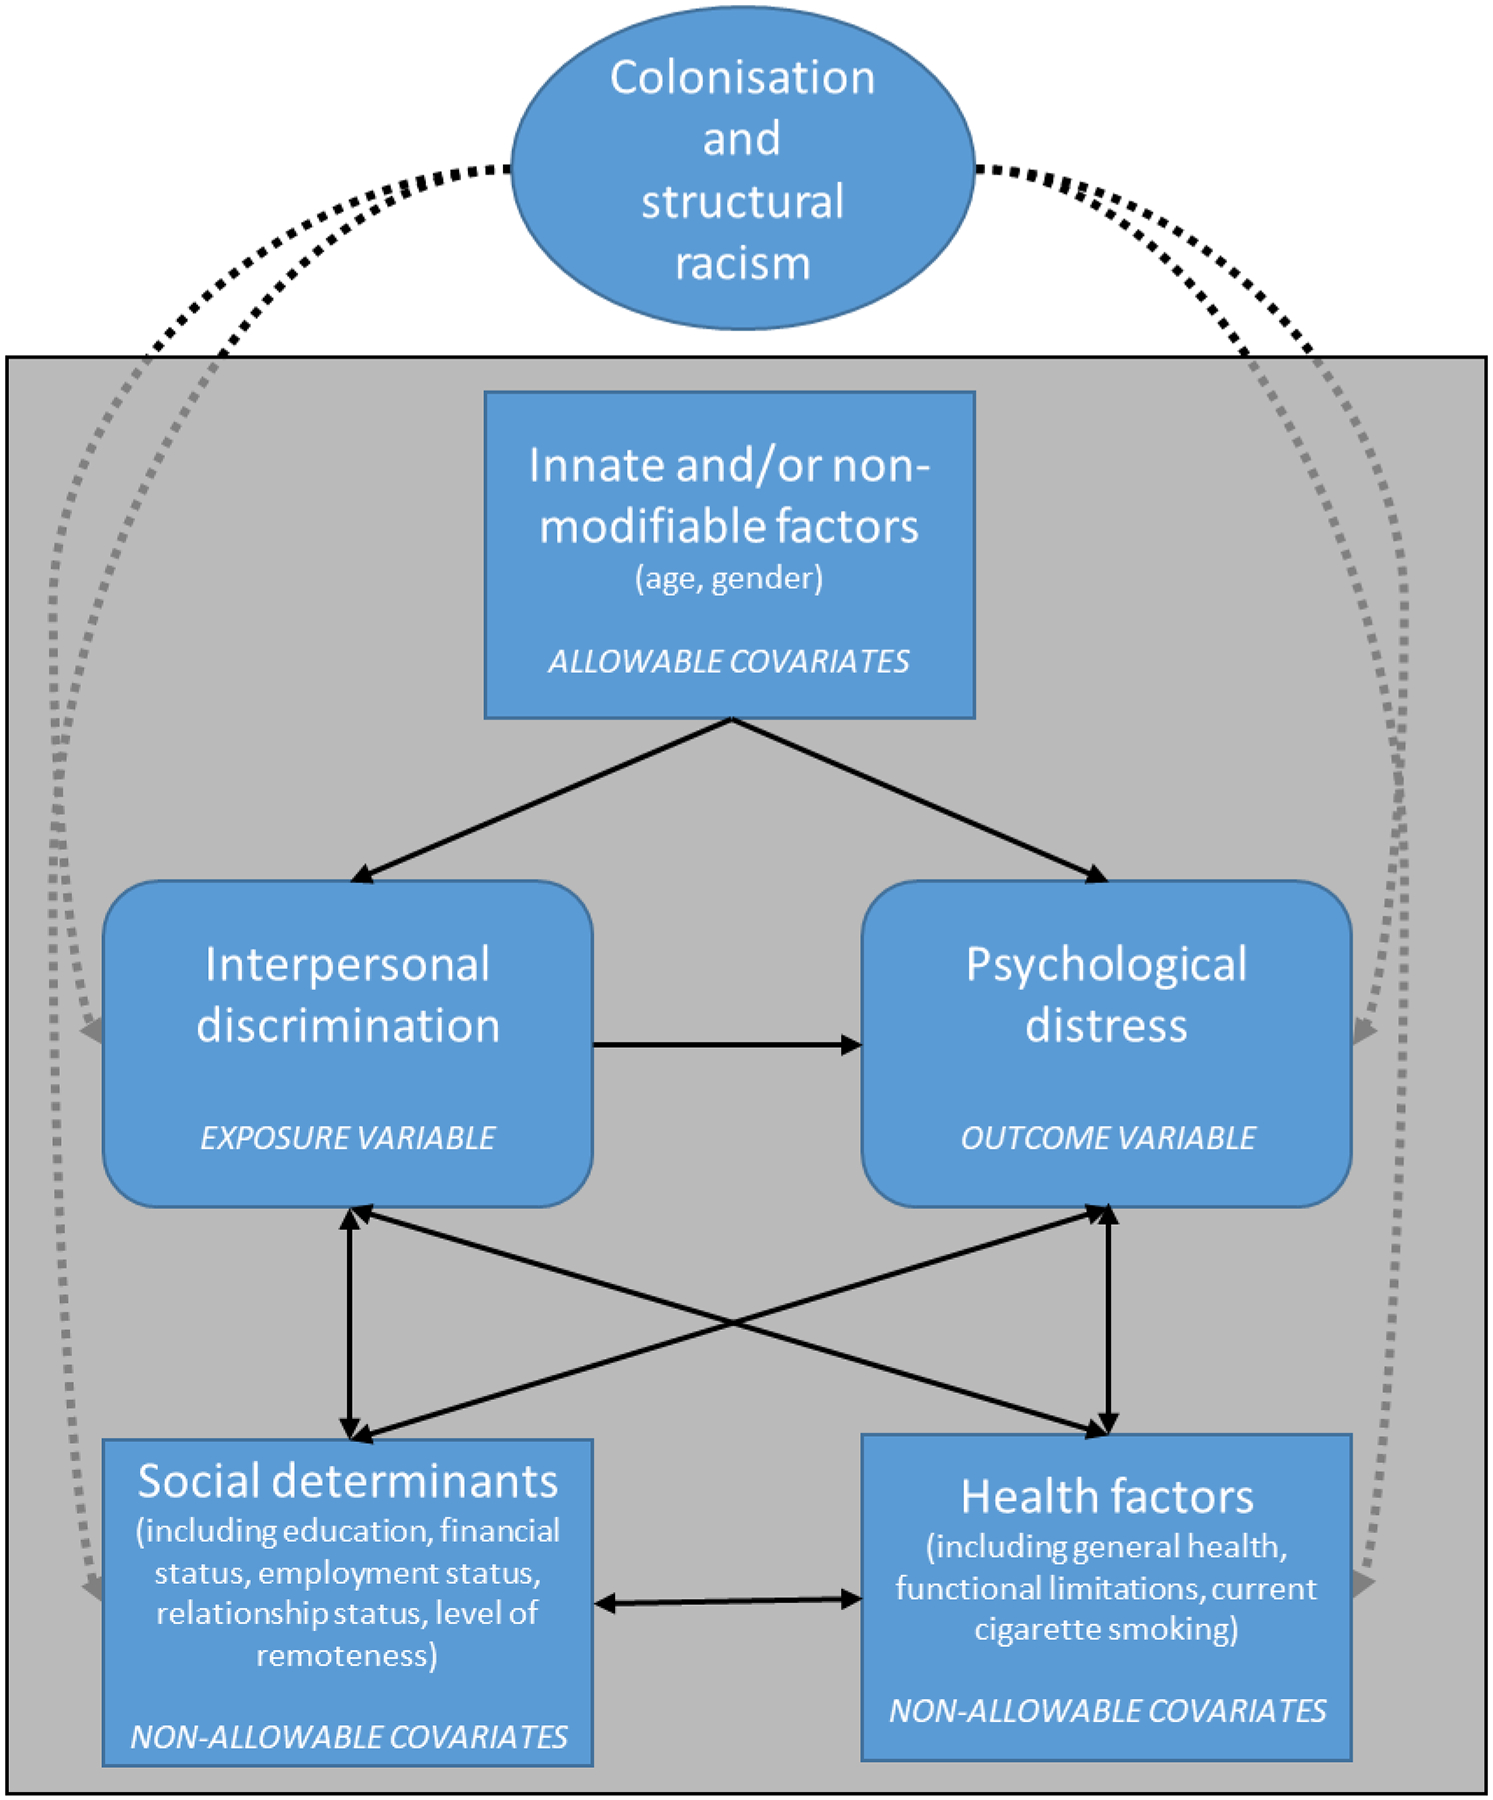
Framework for considering the relation between interpersonal discrimination and psychological distress for Aboriginal and Torres Strait Islander peoples
Age group (18–39, 40–59, or ≥60 years) and gender (male, female, or identify as another gender) were the only potential confounders and effect modifiers identified as ‘allowable’ for analysis, on the basis that they were considered innate and/or not modifiable.
Sample
The current analysis was restricted to participants aged ≥18 years (n=9,963/10,143 participants in the original sample) to align with the ages included in available nationally representative estimates of exposure and outcome prevalence. There were too few participants identifying as a gender other than man or woman (n=12/9,963) to include in stratified tables or adjusted analyses, so these participants are excluded.
Multiple imputation was used to minimise potential bias due to missing data; 79.2% had complete data across analysis variables (n=7,878/9,951). See Supplementary File 3 for details, including assessment of the plausibility of the Missing at Random assumption (MAR). Results of multiple imputation analysis are presented.
Statistical methods
The sample distribution is presented across demographic, social, and health factors, overall and in relation to the exposures and outcome.
Odds Ratios (ORs) and 95% Confidence Intervals (CIs) for high/very high psychological distress in relation to everyday discrimination and everyday racial discrimination were calculated using logistic regression, to approximate Incidence Rate Ratios (IRRs).23,24
Overall and age-gender-specific ORs are presented.
Given that the general Levin formula for calculating the PAF is not valid in the context of effect modification or confounding, we used the age-gender-specific ORs in the weighted-sum version of Levin’s formula: Relative Riski is approximated by the OR for stratumi, pei is the exposure prevalence in the total population in stratumi, and the weighting factor Wi is the proportion of all cases of the outcome that are in stratumi.25
Stratum-specific exposure prevalence in the total Aboriginal and Torres Strait Islander population was quantified by applying survey weights to the Mayi Kuwayu Study imputed dataset, restricted to the 9,030 participants with complete data on the benchmark variables used to generate secondary weights.
Nationally representative prevalence estimates for the respective in-scope Aboriginal and Torres Strait Islander population or non-Indigenous population were derived from the 2018/19 National Aboriginal and Torres Strait Islander Health Survey or the 2017/18 National Health Survey (see Supplementary File 4 for details). We quantified the Indigenous-non-Indigenous ‘gap’ in psychological distress prevalence for each stratum. Applying the stratum-specific PAF, we calculated the extent to which everyday racial discrimination explained the ‘gap’. For this ‘gap’ analysis we focused on discrimination experiences attributed to Indigeneity to identify experiences of discrimination that by definition cannot be experienced by non-Indigenous people.
Given potential correlation between participants living in the same geographic area, we repeated OR analyses with clustering by Indigenous Region. To assess the impact of potential residual confounding by age, we repeated PAF calculation using Miettinen’s formula27 with OR adjusted for gender and finer age increments.
To protect confidentiality, all cells <5 are suppressed, except for the missing category, which poses no risk to identification.
Analysis was conducted in Stata 16 and Excel.
Ethics
The Mayi Kuwayu Study is an Aboriginal-led and governed study, underpinned by principles of Indigenous Data Sovereignty. Mayi Kuwayu Study participation is voluntary and with informed consent. The Study is conducted with ethics approvals from national, state and territory Human Research Ethics Committees (HRECs) and from relevant Aboriginal and Torres Strait Islander organizations. The current analysis was conducted under The Australian National University HREC protocol 2016/767. The Data Analysis Plan was approved by the Mayi Kuwayu Study Data Governance Committee (Project D200506) prior to commencing analysis, and the Committee reviewed the manuscript prior to submission to ensure that all variables and analytic approaches used were pre-specified in the approved Plan.
Aboriginal and/or Torres Strait Islander peoples were involved through all stages of this research, including as authors. The research question, approach, interpretations, and engagement plan were refined through discussions with Thiitu Tharrmay Aboriginal and Torres Strait Islander Research Reference Group.
Role of the funding source
The funding sources had no role in the study.
RESULTS
Twenty-nine percent of the sample was aged 18–39, 38·5% 40–59, and 28·8% ≥60 years; 59·4% of participants were women, and 39·8% lived in major cities (Table 1). Overall, 59·3% (n=5,430/9,156) of the sample experienced any everyday discrimination, 43·0% (n=3,715/8,634) everyday racial discrimination, and 39·2% (n=3,588/9,148) high/very high psychological distress. Psychological distress prevalence varied significantly by all demographic, social, and health variables examined except remoteness.
Table 1.
Sample distribution, and distribution of everyday discrimination, everyday racial discrimination, and high/very high psychological distress, overall and by demographic, social, and health factors in the original sample (N=up to 9951)
| Total sample | Any everyday discrimination | Any everyday racial discrimination | High/very high psychological distress | |
|---|---|---|---|---|
| % (n) | % (n) | % (n) | ||
| N=9951 | N=5430/9156 | N=3712/8634 | N=3588/9148 | |
| Age group *†‡ | ||||
| 18–39 years | 29·3 (2920) | 34·5 (1874) | 35·8 (1328) | 33·5 (1202) |
| 40–59 years | 38·5 (3828) | 42·4 (2301) | 43·6 (1618) | 41·3 (1482) |
| 60 years and over | 28·8 (2862) | 20·1 (1091) | 17·4 (647) | 22·5 (806) |
| Missing | 3·4 (341) | 3·0 (164) | 3·2 (119) | 2·7 (98) |
| Gender †‡ | ||||
| Men | 38·1 (3794) | 37·6 (2041) | 36·8 (1365) | 34·9 (1251) |
| Women | 59·4 (5908) | 60·2 (3271) | 60·8 (2256) | 63·2 (2268) |
| Missing | 2·5 (249) | 2·2 (118) | 2·5 (91) | 1·9 (69) |
| Level of remoteness *† | ||||
| Major Cities of Australia | 39·8 (3961) | 41·3 (2241) | 41·8 (1551) | 41·0 (1470) |
| Inner Regional Australia | 27·7 (2753) | 25·8 (1400) | 24·9 (926) | 28·1 (1010) |
| Outer Regional, Remote, and Very Remote Australia | 29·0 (2883) | 29·1 (1580) | 29·3 (1087) | 27·1 (971) |
| Missing | 3·6 (354) | 3·8 (209) | 4·0 (148) | 3·8 (137) |
| Highest educational qualification †‡ | ||||
| Year 10 or less (School or intermediate certificate) | 44·3 (4405) | 42·6 (2311) | 41·2 (1531) | 46·8 (1679) |
| Year 12 or beyond, including certificate or diploma | 53·7 (5342) | 56·2 (3049) | 57·5 (2134) | 51·9 (1862) |
| Missing | 2·1 (204) | 1·3 (70) | 1·3 (47) | 1·3 (47) |
| Family financial situation *†‡ | ||||
| We have some or a lot of savings | 41·9 (4173) | 34·4 (1866) | 34·3 (1272) | 27·6 (992) |
| We have just enough money | 31·8 (3165) | 35·2 (1909) | 34·4 (1276) | 35·8 (1283) |
| We run out of money or spend more than we get | 15·8 (1575) | 20·8 (1129) | 22·3 (826) | 25·9 (929) |
| Unsure | 6·1 (611) | 6·4 (347) | 6·0 (223) | 6·9 (249) |
| Missing | 4·3 (427) | 3·3 (179) | 3·1 (115) | 3·8 (135) |
| Employment status *†‡ | ||||
| Paid employment, or studying | 52·6 (5230) | 55·5 (3015) | 56·9 (2113) | 47·2 (1694) |
| Not employed | 10·8 (1074) | 13·0 (704) | 13·7 (507) | 14·4 (517) |
| Retired | 12·8 (1271) | 7·2 (390) | 6·1 (226) | 8·0 (288) |
| Caregiver | 4·7 (471) | 5·0 (271) | 4·7 (173) | 5·5 (199) |
| Disability or sick | 10·3 (1022) | 11·0 (599) | 10·1 (375) | 16·3 (585) |
| Missing | 8·9 (883) | 8·3 (451) | 8·6 (318) | 8·5 (305) |
| Relationship status *†‡ | ||||
| Partnered | 54·2 (5390) | 50·9 (2763) | 49·4 (1833) | 46·7 (1677) |
| Single | 36·7 (3654) | 40·6 (2206) | 42·2 (1568) | 43·9 (1574) |
| Other | 5·6 (553) | 5·7 (310) | 5·8 (215) | 6·9 (249) |
| Missing | 3·6 (354) | 2·8 (151) | 2·6 (96) | 2·5 (88) |
| Cigarette smoking *†‡ | ||||
| Have never smoked | 38·6 (3839) | 35·9 (1950) | 35·1 (1302) | 34·0 (1221) |
| Smoked in the past | 32·3 (3214) | 30·9 (1677) | 30·1 (1119) | 30·6 (1097) |
| Currently smoke | 26·3 (2619) | 31·7 (1724) | 33·3 (1237) | 33·3 (1195) |
| Missing | 2·8 (279) | 1·5 (79) | 1·5 (54) | 2·1 (75) |
| Limitation to physical functioning *‡ | ||||
| No limitation | 46·4 (4615) | 45·3 (2462) | 47·8 (1774) | 37·1 (1330) |
| Some limitation | 20·6 (2047) | 20·6 (1121) | 19·9 (737) | 23·9 (856) |
| High limitation | 17·7 (1765) | 19·3 (1047) | 17·1 (633) | 26·2 (939) |
| Missing | 15·3 (1524) | 14·7 (800) | 15·3 (568) | 12·9 (463) |
| General health *†‡ | ||||
| Good to excellent | 66·3 (6593) | 63·4 (3441) | 64·0 (2374) | 50·8 (1823) |
| Fair or poor | 31·1 (3098) | 34·8 (1890) | 34·2 (1268) | 48·0 (1724) |
| Missing | 2·6 (260) | 1·8 (99) | 1·9 (70) | 1·1 (41) |
Each column excludes participants missing data on the relevant exposure or outcome variable. This table is restricted to adults aged 18 years and over and those identifying as a man or a woman.
associated with everyday discrimination (p-value for chi-square <0.05).
associated with everyday discrimination attributed to Indigeneity (p-value for chi-square <0.05).
associated with psychological distress (p-value for chi-square <0.05).
The overall OR for psychological distress among those experiencing any versus no everyday discrimination was 2·77 (95%CI:2·52,3·04; 48·3% versus 25·2%) (Table 2). The OR was 2·36 (1·62,3·43; 45·7% versus 26.3%) for men aged 18–39 years, 3·12 (2·44,3·99; 47·8% versus 22·7%) for men aged 40–59 years, and 2·91 (2·29,3·69; 41·2% versus 19·4%) for men aged ≥60 years; corresponding ORs for women were 2·40 (1·98,2·91; 51·8% versus 30·9%), 2·60 (2·14,3·15; 50·0% versus 27·8%), and 2·64 (2·09,3·33; 46·4% versus 24·8%). The overall OR for psychological distress among those experiencing any versus no everyday racial discrimination was 2·06 (1·88,2·25; 49·0% versus 31·8%). ORs were 1·50 (1·09,2·06; 45·0% versus 35·3%), 2·21 (1·78,2·75; 49·4% versus 30·6%), and 2·42 (1·89,3·11; 43·1% versus 23·8%) for men and 1·87 (1·58,2·23; 53·0% versus 37·6%), 1·69 (1·42,2·01; 48·8% versus 36·0%), and 2·27 (1·77,2·92; 47·9% versus 28·8%) for women aged 18–39 years, 40–59 years, and ≥60 years, respectively.
Table 2.
Prevalence and OR (95%CI) of high/very high psychological distress for those experiencing any, compared to no, everyday discrimination and for those experiencing any, compared to no, everyday racial discrimination in the multiple imputation sample (N=9,939–9,948)
| N=9,939–9,948 | Outcome: high/very high psychological distress | |||||||
|---|---|---|---|---|---|---|---|---|
| Outcome prevalence (95%CI) | OR for those with any versus no everyday discrimination | (95%CI) | Outcome prevalence (95%CI) | OR for those with any versus no everyday racial discrimination | (95%CI) | |||
| Among exposed | Among unexposed | Among exposed | Among unexposed | |||||
| Overall (unadjusted) | 48.3 (47.0,49.6) | 25.2 (23.8,26.6) | 2.77 | (2.52,3.04) | 49.0 (47.3,50.6) | 31.8 (30.6,33.1) | 2.06 | (1.88,2.25) |
| By age group (years) and gender | ||||||||
| Men | ||||||||
| 18–39 | 45.7 (41.2,50.1) | 26.3 (19.9,32.6) | 2.36 | (1.62,3.43) | 45.0 (39.7,50.4) | 35.3 (30.1,40.5) | 1.50 | (1.09,2.06) |
| 40–59 | 47.8 (44.8,50.9) | 22.7 (19.0,26.5) | 3.12 | (2.44,3.99) | 49.4 (45.8,53.0) | 30.6 (27.3,33.9) | 2.21 | (1.78,2.75) |
| ≥60 | 41.2 (37.3,45.0) | 19.4 (16.6,22.2) | 2.91 | (2.29,3.69) | 43.1 (38.0,48.2) | 23.8 (21.2,26.5) | 2.42 | (1.89,3.11) |
| Women | ||||||||
| 18–39 | 51.8 (49.2,54.5) | 30.9 (27.5,34.4) | 2.40 | (1.98,2.91) | 53.0 (49.9,56.1) | 37.6 (34.7,40.4) | 1.87 | (1.58,2.23) |
| 40–59 | 50.0 (47.3,52.6) | 27.8 (24.6,31.0) | 2.60 | (2.14,3.15) | 48.8 (45.6,51.9) | 36.0 (33.3,38.8) | 1.69 | (1.42,2.01) |
| ≥60 | 46.4 (42.4,50.5) | 24.8 (21.6,27.9) | 2.64 | (2.09,3.33) | 47.9 (42.7,53.1) | 28.8 (26.0,31.7) | 2.27 | (1.77,2.92) |
The total N varies across imputation models due to the exclusion of participants identifying as a gender other than male or female (n=13–16 across imputed datasets) and aged 16–17 years (n=183–191 across imputed datasets). The n in stratified analyses varies across imputation models due to differences in imputed values for the stratification variables: 747–766 for men and 2,251–2,271 for women aged 18–39 years; 1,611–1,635 men and 2,331–2,356 women aged 40–59 years; and 1,508–1,523 men and 1,432–1,460 women aged 60 years and over.
Results of complete case analysis were not materially different from those based on the multiply imputed dataset; accounting for geographic clustering did not materially change findings (Supplementary File 5).
If observed discrimination-distress ORs reflect causal relationships, half (49·3%) of all psychological distress experienced by Aboriginal and Torres Strait Islander adults could be attributed to everyday discrimination (Table 3) and 27.1% to everyday racial discrimination (Table 4). The PAF for everyday discrimination was 49·6% for men aged 18–39 years, 58·8% for men aged 40–59 years, and 43·9% for men aged ≥60 years; corresponding figures for women were 48·8%, 50·9%, and 39·4% (Table 3). The PAF for everyday racial discrimination was highest for men aged 40–59 years (36·5%), and between 20·7% and 28·3% for all other groups (Table 4).
Table 3.
Estimated burden of high/very high psychological distress attributable to everyday discrimination in the total Aboriginal and Torres Strait Islander population
| Population, 2018–19* | OR of psychological distress for those with any versus no everyday discrimination† | Prevalence (95%CI) of everyday discrimination, 2018–21 | Proportion of total psychological distress in stratum† | PAF | Aboriginal and Torres Strait Islander adults with psychological distress, 2018–19* | Aboriginal and Torres Strait Islander adults with psychological distress attributable to everyday discrimination | ||||||
|---|---|---|---|---|---|---|---|---|---|---|---|---|
| % | (n, ‘000s) | OR | (95%CI) | % | (95%CI) | Wi | % | % | (n, ‘000s) | % | (n, ‘000s) | |
| By age group (years) and gender | ||||||||||||
| Men | 48·1 | 233·7 | -- | -- | 64.3 | (61.7,66.8) | -- | -- | 25·9 | 60·6 | 13.5 | 31.6 |
| 18–39 | 27·1 | 131·8 | 2.36 | (1.62,3.437) | 72.5 | (67.6,77.5) | 0.08 | 49.6 | 25·5 | 33·6 | 12.7 | 16.7 |
| 40–59 | 14·8 | 72·0 | 3.12 | (2.44,3.99) | 67.2 | (63.8,70.5) | 0.17 | 58.8 | 28·8 | 20·7 | 16.9 | 12.2 |
| ≥60 | 6·1 | 29·6 | 2.91 | (2.29,3.69) | 41.0 | (37.8,44.2) | 0.11 | 43.9 | 20·9 | 6·2 | 9.2 | 2. 7 |
| Women | 52·0 | 253·1 | -- | -- | 64.8 | (62.8,66.8) | -- | 35·0 | 88·6 | 17.0 | 43.1 | |
| 18–39 | 27·9 | 135·9 | 2.40 | (1.98,2.91) | 68.0 | (65.3,70.8) | 0.26 | 48.8 | 34·3 | 46·6 | 16.7 | 22.7 |
| 40–59 | 16·9 | 82·2 | 2.60 | (2.14,3.15) | 64.9 | (62.0,67.7) | 0.25 | 50.9 | 39·4 | 32·4 | 20.1 | 16.5 |
| ≥60 | 7·1 | 34·7 | 2.64 | (2.09, 3.33) | 39.7 | (36.3,43.1) | 0.13 | 39.4 | 28·5 | 9·9 | 11.3 | 3.9 |
| Overall | 100·0 | 486·3 | -- | -- | 64.6 | (62.9,66.2) | -- | 49.3 | 30·7 | 149·4 | 15.1 | 73.7 |
from the 2018/19 National Aboriginal and Torres Strait Islander Health Survey; see Supplementary File 4 for details.
from the Mayi Kuwayu Study imputed sample.
Table 4.
Estimated burden of high/very high psychological distress attributable to everyday racial discrimination in the total Aboriginal and Torres Strait Islander population
| Population, 2018–19 | OR of psychological distress for those with any versus no everyday racial discrimination* | Prevalence (95%CI) of everyday racial discrimination, 2018–21 | Proportion of total psychological distress in stratum* | PAF | Aboriginal and Torres Strait Islander adults with psychological distress, 2018–19 | Aboriginal and Torres Strait Islander adults with psychological distress attributable to everyday racial discrimination | ||||||
|---|---|---|---|---|---|---|---|---|---|---|---|---|
| % | (n, ‘000s) | OR | (95%CI) | % | (95%CI) | Wi | % | % | (n, ‘000s) | % | (n, ‘000s) | |
| By age group (years) and gender | ||||||||||||
| Men | 48·1 | 233·7 | -- | -- | 44.9 | (42.2,47.7) | -- | -- | 25·9 | 60·6 | 6.9 | 16.1 |
| 18–39 | 27·1 | 131·8 | 1.50 | (1.09,2.06) | 52.1 | (46.7,57.4) | 0.08 | 20.7 | 25·5 | 33·6 | 5.3 | 6.9 |
| 40–59 | 14·8 | 72·0 | 2.21 | (1.78,2.75) | 47.6 | (44.1,51.1) | 0.17 | 36.5 | 28·8 | 20·7 | 10.5 | 7.6 |
| ≥60 | 6·1 | 29·6 | 2.42 | (1.89,3.11) | 24.6 | (21.8,27.3) | 0.11 | 25.9 | 20·9 | 6·2 | 5.4 | 1.6 |
| Women | 52·0 | 253·1 | -- | -- | 43.7 | (41.6,45.8) | -- | 35·0 | 88·6 | 9.2 | 23.3 | |
| 18–39 | 27·9 | 135·9 | 1.87 | (1.58,2.23) | 45.4 | (42.5,48.4) | 0.26 | 28.3 | 34·3 | 46·6 | 9.7 | 13.2 |
| 40–59 | 16·9 | 82·2 | 1.69 | (1.42,2.01) | 45.4 | (42.5,48.4) | 0.25 | 23.9 | 39·4 | 32·4 | 9.4 | 7.7 |
| ≥60 | 7·1 | 34·7 | 2.27 | (1.77, 2.92) | 25.1 | (22.2,28.1) | 0.13 | 24.2 | 28·5 | 9·9 | 6.9 | 2.4 |
| Overall | 100·0 | 486·3 | -- | -- | 44.3 | (42.6,46.0) | -- | 27.1 | 30·7 | 149·4 | 8.3 | 40.5 |
from the 2018/19 National Aboriginal and Torres Strait Islander Health Survey; see Supplementary File 4 for details.
from the Mayi Kuwayu Study imputed sample.
Overall PAFs based on Miettinen’s formula were slightly lower, at 45.9% for everyday discrimination and 27.1% for everyday racial discrimination (Supplementary File 6).
The prevalence of high/very high psychological distress is 30·7% among Aboriginal and Torres Strait Islander adults and 13·1% among non-Indigenous adults, an absolute gap of 17·6 percentage points (Table 4; Supplementary File 7). Up to 47·4% of this ‘gap’ (8.3 percentage points) may be attributable to Aboriginal and Torres Strait Islander peoples’ experiences of everyday racial discrimination, leaving an unexplained ‘gap’ of 9·3 percentage points. The total ‘gap’, and absolute ‘gap’ unexplained by everyday racial discrimination, was larger for women versus men overall (10·9% versus 7·7%), and highest for women aged 40–59 years (14·1%) compared to other age groups.
DISCUSSION
We found that up to half (49·3%) of the total burden of psychological distress among Aboriginal and Torres Strait Islander adults may be attributable to everyday discrimination. This means that everyday discrimination may be a cause of psychological distress for almost one-in-six (15·1%) adults in the Aboriginal and Torres Strait Islander population (n=73,700 adults). As an upper bound, we estimate that everyday racial discrimination (interpersonal discrimination attributed to Indigeneity) could explain a quarter (27·1%) of the total burden of psychological distress in the Aboriginal and Torres Strait Islander adult population, and almost half (47·4%) of the Indigenous-non-Indigenous ‘gap’. This burden is avoidable; interpersonal discrimination is amenable to intervention, as is the broader system of structural racism that drives it.
Our aim was to quantify PAFs, under the assumption that observed ORs approximate a hypothetical causal relationship, i.e. if all structuring conditions were met such that ORs provide an unbiased estimate of the IRR.23,24 We employ minimally adjusted models because our goal is to provide a baseline understanding of the potential burden of interpersonal discrimination, as estimated by a PAF, considered within the broader context of structural racism. With the exception of age and gender, the identified potential confounders of the discrimination-psychological distress relationship are also potential consequences of structural racism and adjustment is therefore not appropriate.22
The explicit purpose of this paper is to consider the potential magnitude (i.e. the ‘upper bound’) of the impact of interpersonal discrimination on psychological distress. While research has generally considered interpersonal discrimination and structural discrimination separately, we explicitly undertake this analysis of interpersonal discrimination within a broader structural frame. As such, we did not adjust for social and health factors in our analysis and we explicitly acknowledge that the estimated PAF for interpersonal discrimination will therefore include contributions from social and health disadvantage, reflecting contributions from structural racism. This could lead to overestimation of the effects of interpersonal discrimination; however, adjusting for these factors would underestimate the effects. We also expect that structural racism would make additional contributions to psychological distress prevalence and inequities, independent of those likely manifested through interpersonal discrimination.
This current work on interpersonal discrimination demonstrates just one of the many elements of the contribution of racism to poor health and inequities. The focus on interpersonal discrimination was in part due to the lack of agreed approach for measuring structural racism—potentially itself a manifestation of racism, reflecting the lack of prioritisation of racism research and systematic exclusion of people with lived experience from education and scholarship.4 It is not intended to advocate for or justify only addressing individually-mediated forms of racism. Structural racism will need to be addressed before interpersonal discrimination can be successfully eliminated, given that structural racism continually adapts within and across institutions to drive interpersonal discrimination and maintain and reinforce inequities.4
The PAF is a valuable metric in disparities research as it combines information on exposure prevalence and magnitude of impact. An estimated two-thirds of the total Aboriginal and Torres Strait Islander adult population has experienced everyday discrimination and just under half everyday racial discrimination. This, combined with strong and consistent elevations in psychological distress, leads to high observed PAFs, with 24·7% to 42·9% of psychological distress attributed to everyday discrimination across age-gender groups. For everyday racial discrimination, the potential contribution to psychological distress was 20·7%−36·5% across age-gender groups; this translates to 8·3% of the total population (n=40,500) experiencing psychological distress that could be attributable to everyday racial discrimination.
Differences in the PAFs across age-gender groups reflect differences in exposure prevalence and/or OR magnitude. We decided a priori to estimate age-gender-stratified OR in order to calculate the PAF according to the weighted-sum formula; as such, we have not statistically tested for differences across groups in the OR. Any differences in the relationships were not substantive, and absolute exposed-unexposed prevalence differences were broadly similar across strata. Any heterogeneity in OR may reflect differences in the experiences of types of discrimination experienced across groups, and their differential impacts. A larger OR among older adults may reflect that older adults are only reporting more severe experiences of everyday discrimination, potentially due to a normalising bias.11 Research to further understand intersectional experiences can provide ‘higher resolution’ understanding of social inequities, and provide insight into the potential gain through intervention for specific groups, rather than assuming a heterogeneous impact.26
Strengths and limitations
To our knowledge, this analysis is the first time a PAF has been calculated to demonstrate the potential magnitude of the contribution of interpersonal discrimination to a mental health (or any other) outcome for any Indigenous population internationally, or to inequities between populations. It demonstrates the potential magnitude of health gain that may be possible through reducing interpersonal discrimination. The use of contemporary data is valuable given that patterns of exposure, and the experience of discrimination, can vary over time and according to the socio-political context.
An intersectional approach was applied to capture potential differences between groups in the experience of the exposure, the outcome, and their relationship. The use of broad age categories for stratification, while necessary, results in loss of information compared to the use of finer categories or a continuous measure. While results were not materially different, PAFs calculated according to the Miettinen formula with OR adjusted for gender and finer age categories were slightly lower than those using the weighted-sum version of Levin’s formula (Supplementary File 6), consistent with residual confounding by age through use of broad age categories. The benefit of the weighted-sum formula is that it aligns with an intersectional approach, providing information for each age-gender strata, rather than only an aggregated estimate.
A PAF is always an estimation, often for the purpose of providing advice to guide policymakers, and our intention was to quantify the magnitude of the burden of psychological distress potentially attributable to interpersonal discrimination. The OR findings generated here do not, and are not intended to, reflect a conclusively established causal relationship between interpersonal discrimination and psychological distress. Our aim was to quantify PAFs, if observed ORs approximate a hypothetical causal relationship, and results should be interpreted accordingly. We employ ORs rather than PRs given that OR better approximate the IRR in this context (including because the outcome is common), and that the IRR is the real effect measure of interest in calculating the PAF.23,24
Our analysis accounted for potential confounders and effect modifiers following Jackson’s framework22; we did not adjust for potentially confounding social and health factors, and as such, the estimated PAFs include contributions from structural racism through these pathways.
It should be noted that each input to PAF calculation is underpinned by assumptions (see Supplementary File 4) and has associated error; all findings should be interpreted within this context. We did not quantify the extent of uncertainty around the PAF, but rather present PAF estimates here as broad, hypothetical estimates. Two other key assumptions underpinning our PAF calculation are that eliminating discrimination would not affect the distribution of other risk factors, and that interpersonal discrimination could realistically be eliminated through intervention.
Use of multiply imputed data was based on the Missing at Random assumption. This assumption was made more plausible through incorporation of auxiliary variables in the imputation model which predict both the value of the outcome and whether the outcome is missing, and was supported by diagnostic checks (see Supplementary File 3).
It is difficult through survey data to comprehensively and accurately capture experiences of interpersonal discrimination.27 The available measure of everyday discrimination did not capture all forms of interpersonal discrimination. Not included are acute major discriminatory events (e.g. being unfairly fired from a job), chronic discrimination in major life domains (e.g. work, school, neighbourhood), lifetime traumatic discriminatory experiences (e.g. being beaten by the police), or intergenerational traumas.28 Further, self-reported data only capture experiences of discrimination of which participants are aware. People experiencing poor mental health may be more likely to be vigilant and notice instances of discrimination, or to under-report experiences due to desensitisation. Prior experiences of discrimination and the threat of future discrimination can also lead individuals to be vigilant. On balance, we have likely underestimated the true prevalence of everyday discrimination, which would contribute to underestimation of the PAF. Further, our analysis of the contribution of interpersonal discrimination to the Indigenous-non-Indigenous ‘gap’ in psychological distress was restricted to experiences of discrimination that participants reported were due to their Indigeneity. This is likely to underestimate the true prevalence of everyday racial discrimination; this misclassification bias likely attenuates the relationship with psychological distress and its contribution to the ‘gap’.
CONCLUSION
It is imperative to redress discrimination and structural racism, and this is buttressed by quantification of the potential extent of the health harms of discrimination and racism. The totality of evidence internationally, supported by robust theory, is converging on a causal relationship between discrimination and health;16,29 we consider that the lack of quantitative epidemiological evidence of a causal relationship should not preclude estimation of discrimination’s potential impacts or policy attention to this issue. We found that the ‘upper bound’ for the PAF for psychological distress attributable to everyday discrimination was substantial across demographic groups, ranging from 39·4% to 58·8%. Intervening on interpersonal discrimination—which will also require action against structural racism—has the potential to bring health benefit for men and women across age groups and to contribute meaningfully to closing Indigenous-non-Indigenous ‘gaps’. Given that interpersonal discrimination is only one of the manifold consequences of structural racism, and that this study captures only some aspects of interpersonal discrimination, it is clear that the broader system of racism makes a substantive contribution to poor health among Aboriginal and Torres Strait Islander peoples, and to inequities. Urgent individual and policy action is required of non-Indigenous peoples and colonial structures, directed by Aboriginal and Torres Strait Islander peoples.30
Supplementary Material
Figure 2. Indigenous-non-Indigenous ‘gap’ in psychological distress prevalence among adults, and extent to which the ‘gap’ is explained by everyday racial discrimination.
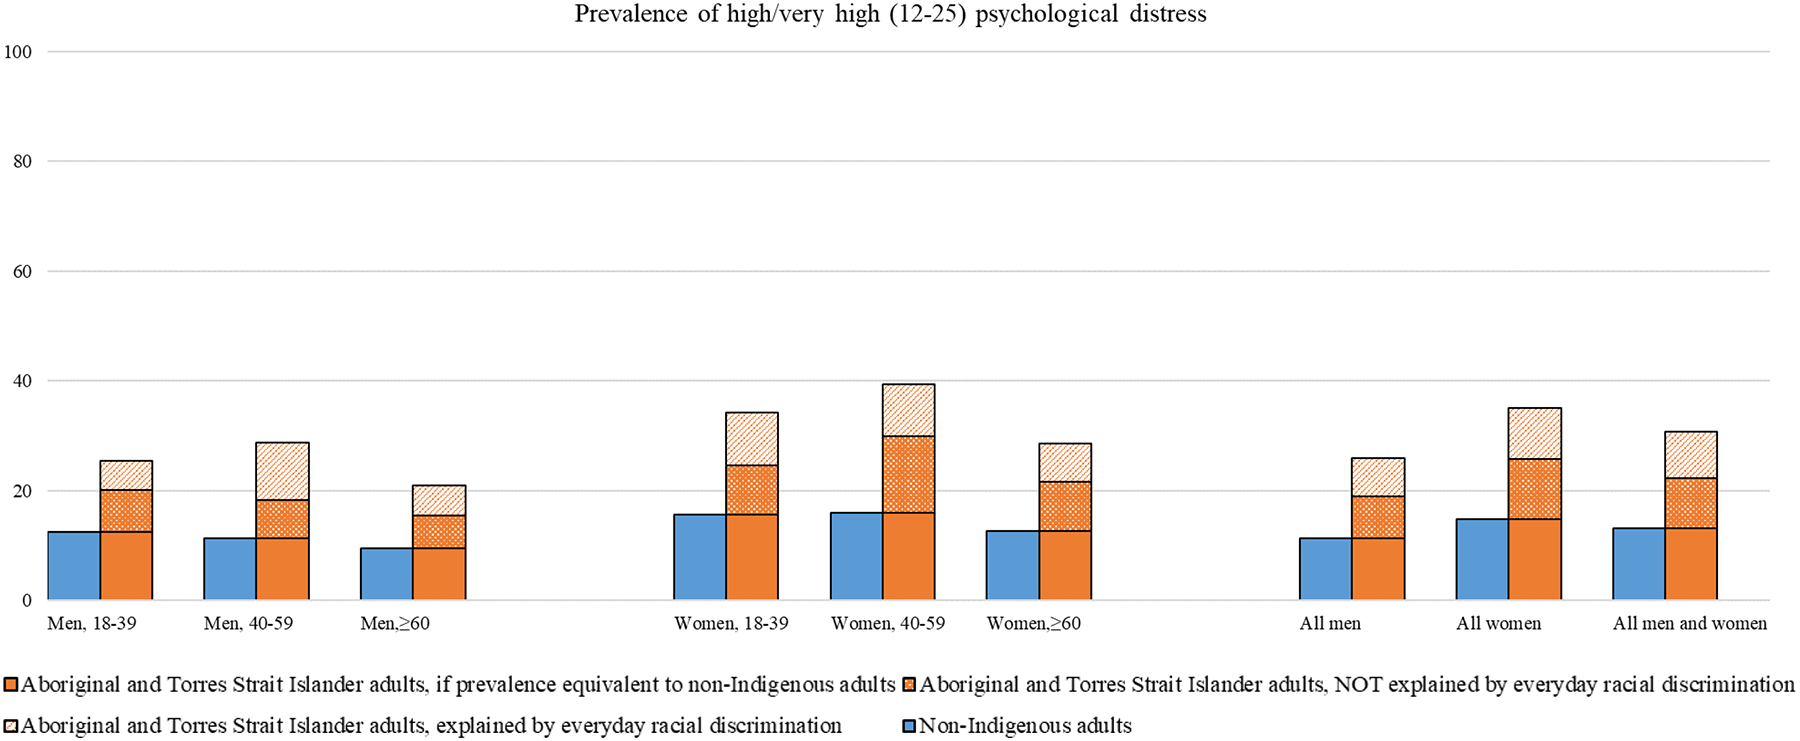
See Supplementary File 6 for data underlying this figure.
RESEARCH IN CONTEXT.
Evidence before this study
We searched the Australian National University Super Search (an all-in-one academic search engine that includes over 900 sources) database for publications that use the Population Attributable Fraction (PAF) to quantify the contribution of discrimination to poor health/wellbeing outcomes experienced by Indigenous populations worldwide. This search did not identify any published studies, so we broadened our search to includes studies with any population. This search yielded a total of 3 studies; the estimated contribution of interpersonal racial discrimination to negative mental health (depression, anxiety, post-traumatic stress disorder, psychological disorders) and physical health outcomes (metabolic syndrome) ranged from 4·7% to 45·9% across outcomes, genders, and population groups studied. Full search terms and search strategy, and a synthesis of results are available in Supplementary File 1.
Added value of this study
This study provides the first estimation for any Indigenous population of the contribution of interpersonal discrimination to the population’s total burden of psychological distress, and to Indigenous-non-Indigenous inequities. As an upper bound, we find that almost half (49·3%) of the total burden of psychological distress among Aboriginal and Torres Strait Islander adults could be attributable to interpersonal discrimination. We estimate that interpersonal racial discrimination (discrimination attributed to Indigeneity) may explain up to 47·4% of the Indigenous-non-Indigenous ‘gap’ in psychological distress prevalence. These estimated PAFs will include contributions from social and health disadvantage, reflecting contributions from structural racism. Generation of this evidence is an important step towards recognition of the potential extent of harms from discrimination and racism. It is intended to spur action and investment commensurate to the potential level of harm caused.
Implications of all the available evidence
The differences observed between Aboriginal and Torres Strait Islander peoples and non-Indigenous people in Australia across health and social indicators reflect historic and ongoing effects of settler-colonialism and racism. There is likely a substantial contribution of interpersonal discrimination, and the broader system of racism, to poor mental health for Aboriginal and Torres Strait Islander adults, and to inequities compared to the non-Indigenous population. It is imperative to redress discrimination and structural racism, and this is supported by the totality of evidence on their potential health harms, acknowledging the lack of strict evidence of causality.
ACKNOWLEDGEMENTS
The authors acknowledge Aboriginal and Torres Strait Islander peoples and their continuing connection to culture, land, and seas. We would like to acknowledge and thank all contributors to the development of the Mayi Kuwayu Study, the data collectors, and all survey participants. We acknowledge the assistance and guidance of the Mayi Kuwayu Study Data Governance Committee, the Study Chief Investigators and Partners, and all members of the Mayi Kuwayu Study team. We thank the members of the Thiitu Tharrmay Research Reference Group for sharing their ideas and assisting with the manuscript.
The authors acknowledge the deep and ongoing repercussions of settler-colonisation and associated trauma, and this understanding underpins our research. We understand that the data presented in this paper, along with the underlying ideas, concepts, and theories discussed may cause sadness or distress, and/or may trigger traumatic memories for people. If you need to talk to someone, local and national support is available within Australia. Please see www.sewbmh.org.au/location/list for a list of Aboriginal and Torres Strait Islander social and emotional wellbeing services, and please see www.naccho.org.au/member-services/naccho-member-services/ for a list of Aboriginal Community Controlled Health Organisations.
KT, EB, RL, RJ are supported by the National Health and Medical Research Council of Australia, and MB by the Ian Potter Foundation.
Footnotes
Publisher's Disclaimer: This is a PDF file of an unedited manuscript that has been accepted for publication. As a service to our customers we are providing this early version of the manuscript. The manuscript will undergo copyediting, typesetting, and review of the resulting proof before it is published in its final form. Please note that during the production process errors may be discovered which could affect the content, and all legal disclaimers that apply to the journal pertain.
COMPETING INTERESTS
The authors declare we have no competing interests.
DATA SHARING STATEMENT
The dataset analysed during the current study is available on application to the Mayi Kuwayu Study Data Governance Committee. This governance body oversees and approves applications for data use, in order to maintain Indigenous Data Sovereignty and the confidentiality of participants, and ensure appropriate use of the Mayi Kuwayu Study data. The data application process is detailed here: mkstudy.com.au/overview/.
REFERENCES
- 1.Borch M. Rethinking the origins of terra nullius. Australian Historical Studies 2001; 32(117): 222–39. [Google Scholar]
- 2.Spiller G. The Mentality of the Australian Aborigines. The Sociological Review 1913; a6(4): 348–53. [Google Scholar]
- 3.Watego C, Singh D & Macoun A Partnership for Justice in Health: Scoping Paper on Race, Racism and the Australian Health System. 2021; Discussion Paper.
- 4.Gee GC, Hicken MT. Structural Racism: The Rules and Relations of Inequity. Ethn Dis 2021; 31(Suppl 1): 293–300. [DOI] [PMC free article] [PubMed] [Google Scholar]
- 5.Lett E, Asabor E, Beltrán S, Michelle Cannon A, Arah OA. Conceptualizing, Contextualizing, and Operationalizing Race in Quantitative Health Sciences Research. The Annals of Family Medicine 2022: 2792. [DOI] [PMC free article] [PubMed] [Google Scholar]
- 6.Nazroo JY, Bhui KS, Rhodes J. Where next for understanding race/ethnic inequalities in severe mental illness? Structural, interpersonal and institutional racism. Sociology of Health & Illness. 2020. Feb;42(2):262–76. [DOI] [PMC free article] [PubMed] [Google Scholar]
- 7.Carter RT, Johnson VE, Kirkinis K, Roberson K, Muchow C, Galgay C. A Meta-Analytic Review of Racial Discrimination: Relationships to Health and Culture. Race and Social Problems 2019; 11(1): 15–32. [Google Scholar]
- 8.Paradies Y, Ben J, Denson N, et al. Racism as a determinant of health: a systematic review and meta-analysis. PLoS One 2015; 10(9): e0138511. [DOI] [PMC free article] [PubMed] [Google Scholar]
- 9.Pascoe EA, Smart Richman L. Perceived discrimination and health: a meta-analytic review. Psychological bulletin 2009; 135(4): 531. [DOI] [PMC free article] [PubMed] [Google Scholar]
- 10.Kairuz CA, Casanelia LM, Bennett-Brook K, Coombes J, Yadav UN. Impact of racism and discrimination on physical and mental health among Aboriginal and Torres Strait islander peoples living in Australia: a systematic scoping review. BMC Public Health 2021; 21(1): 1302. [DOI] [PMC free article] [PubMed] [Google Scholar]
- 11.Thurber KA, Colonna E, Jones R, et al. Prevalence of Everyday Discrimination and Relation with Wellbeing among Aboriginal and Torres Strait Islander Adults in Australia. International Journal of Environmental Research and Public Health 2021; 18(12): 6577. [DOI] [PMC free article] [PubMed] [Google Scholar]
- 12.Rockhill B, Newman B, Weinberg C. Use and misuse of population attributable fractions. Am J Public Health 1998; 88(1): 15–9. [DOI] [PMC free article] [PubMed] [Google Scholar]
- 13.Elias A, Paradies Y. Estimating the mental health costs of racial discrimination. BMC public health 2016; 16(1): 1205-. [DOI] [PMC free article] [PubMed] [Google Scholar]
- 14.Ikram UZ, Snijder MB, Agyemang C, et al. Perceived Ethnic Discrimination and the Metabolic Syndrome in Ethnic Minority Groups: The Healthy Life in an Urban Setting Study. Psychosomatic medicine 2017; 79(1): 101–11. [DOI] [PubMed] [Google Scholar]
- 15.Ikram UZ, Snijder MB, Fassaert TJ, Schene AH, Kunst AE, Stronks K. The contribution of perceived ethnic discrimination to the prevalence of depression. Eur J Public Health 2015; 25(2): 243–8. [DOI] [PubMed] [Google Scholar]
- 16.Krieger N, Davey Smith G. The tale wagged by the DAG: broadening the scope of causal inference and explanation for epidemiology. Int J Epidemiol 2016; 45(6): 1787–808. [DOI] [PubMed] [Google Scholar]
- 17.Australian Institute of Health and Welfare. Australian Burden of Disease Study: Impact and causes of illness and death in Aboriginal and Torres Strait Islander people 2011. Canberra: AIHW, 2016. [DOI] [PubMed] [Google Scholar]
- 18.Lovett R, Brinckley M-M, Phillips B, et al. Marrathalpu mayingku ngiya kiyi. Minyawaa ngiyani yata punmalaka; wangaaypu kirrampili kara. In the beginning it was our people’s law. What makes us well; to never be sick. Cohort profile of Mayi Kuwayu: The National Study of Aboriginal and Torres Strait Islander Wellbeing. Australian Aboriginal Studies 2020; 2. [Google Scholar]
- 19.Jones R, Thurber KA, Chapman J, et al. Study protocol: our cultures count, the Mayi Kuwayu study, a national longitudinal study of Aboriginal and Torres Strait islander wellbeing. BMJ Open. 2018. Jun 1;8(6):e023861. [DOI] [PMC free article] [PubMed] [Google Scholar]
- 20.Thurber KA, Walker J, Batterham PJ, et al. Developing and validating measures of self-reported everyday and healthcare discrimination for Aboriginal and Torres Strait Islander adults. International Journal for Equity in Health 2021; 20(1): 14. [DOI] [PMC free article] [PubMed] [Google Scholar]
- 21.Brinckley M-M, Calabria B, Walker J, Thurber KA, Lovett R. Reliability, validity, and clinical utility of a culturally modified Kessler scale (MK-K5) in the Aboriginal and Torres Strait Islander population. BMC public health 2021; 21(1): 1–15. [DOI] [PMC free article] [PubMed] [Google Scholar]
- 22.Jackson JW. Meaningful Causal Decompositions in Health Equity Research: Definition, Identification, and Estimation Through a Weighting Framework. Epidemiology 2021; 32(2): 282–90. [DOI] [PMC free article] [PubMed] [Google Scholar]
- 23.Pearce N Effect measures in prevalence studies. Environmental Health Perspectives 2004; 112(10): 1047–50. [DOI] [PMC free article] [PubMed] [Google Scholar]
- 24.Reichenheim ME, Coutinho ESF. Measures and models for causal inference in cross-sectional studies: arguments for the appropriateness of the prevalence odds ratio and related logistic regression. BMC Med Res Methodol 2010; 10(66). [DOI] [PMC free article] [PubMed] [Google Scholar]
- 25.Khosravi A, Nielsen RO, Mansournia MA. Methods matter: population attributable fraction (PAF) in sport and exercise medicine. British Journal of Sports Medicine 2020; 54(17): 1049–54. [DOI] [PubMed] [Google Scholar]
- 26.Bauer GR. Incorporating intersectionality theory into population health research methodology: Challenges and the potential to advance health equity. Social Science & Medicine 2014; 110: 10–7. [DOI] [PubMed] [Google Scholar]
- 27.Williams DR. Improving the measurement of self-reported racial discrimination: Challenges and opportunities. The cost of racism for people of color: Contextualizing experiences of discrimination. Washington, DC, US: American Psychological Association; 2016: 55–83. [Google Scholar]
- 28.Williams DR, Mohammed SA. Discrimination and racial disparities in health: evidence and needed research. J Behav Med 2009; 32(1): 20–47. [DOI] [PMC free article] [PubMed] [Google Scholar]
- 29.Vandenbroucke JP, Broadbent A, Pearce N. Causality and causal inference in epidemiology: the need for a pluralistic approach. Int J Epidemiol 2016; 45(6): 1776–86. [DOI] [PMC free article] [PubMed] [Google Scholar]
- 30.Smylie J, Harris R, Paine SJ, Velásquez IA, Lovett R. Beyond shame, sorrow, and apologies—action to address indigenous health inequities. bmj. 2022. Jul 8;378. [DOI] [PubMed] [Google Scholar]
Associated Data
This section collects any data citations, data availability statements, or supplementary materials included in this article.
Supplementary Materials
Data Availability Statement
The dataset analysed during the current study is available on application to the Mayi Kuwayu Study Data Governance Committee. This governance body oversees and approves applications for data use, in order to maintain Indigenous Data Sovereignty and the confidentiality of participants, and ensure appropriate use of the Mayi Kuwayu Study data. The data application process is detailed here: mkstudy.com.au/overview/.