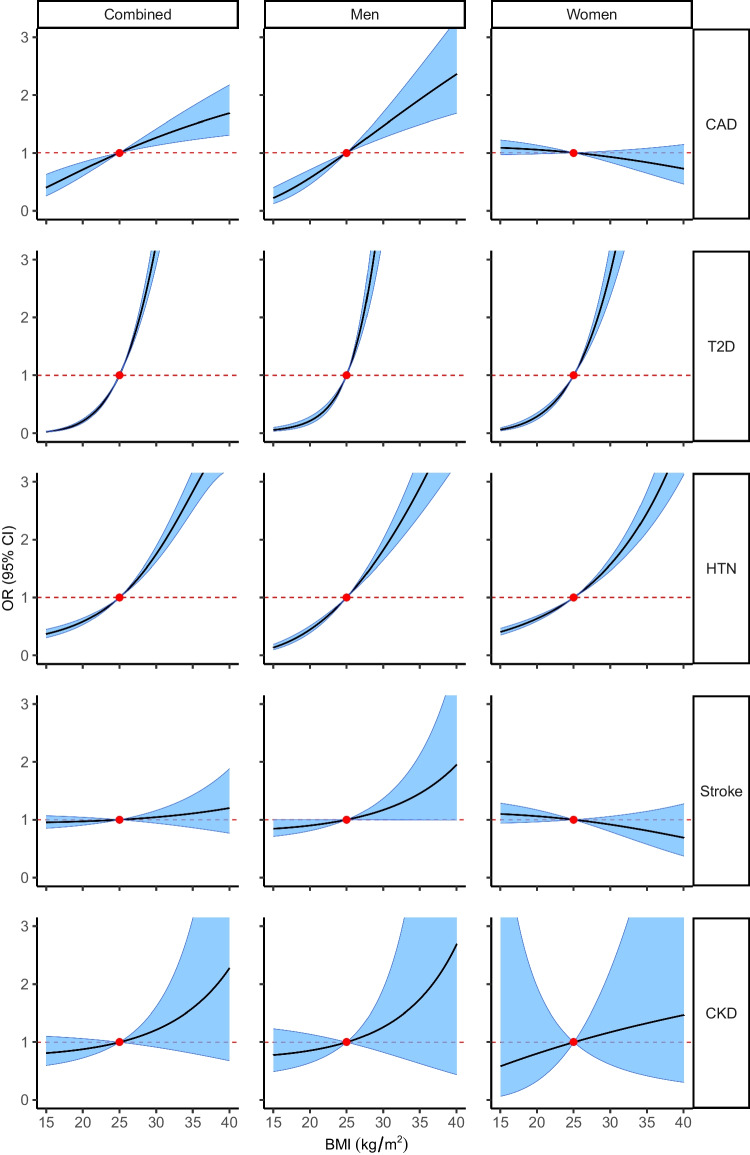
Fig. 2.
Plots showing the estimated shapes of the causal relationships between BMI and CMDs in combined and sex-specific analyses. Shape estimates are derived from the function of fractional polynomials based on the doubly ranked method that best fits the data. The solid black line represents the function curve, the blue band represents the 95% CI, the red dot represents the reference BMI of 25 kg/m2, and the dashed red line represents the null effect size. The plots have been cropped to depict estimated causal associations up to an OR of 3.0 for ease of comparison. HTN, hypertension; T2D, type 2 diabetes

