

Abstract
Objectives:
Dynamic processes unfolding over later adulthood are of prime interest to gerontological researchers. Time-varying effect modeling (TVEM) accommodates dynamic change trajectories, but its use in gerontological research is limited. We introduce and demonstrate TVEM with an empirical example based on the National Health and Aging Trends Study (NHATS).
Methods:
We examined (a) age-varying prevalence of past month elevated symptoms of depression and anxiety and (b) age-varying associations between older adults’ elevated symptoms of depression and anxiety and needing help with basic activities of daily living and educational attainment.
Results:
Individuals needing help with ADLs had higher odds of reporting elevated symptoms of depression and anxiety, however the association was strongest for those in their 60s versus 80s. Across all ages, adults with lower education levels had higher odds of reporting elevated symptoms of depression and anxiety, an association that also varied by age.
Conclusion:
We demonstrated TVEM’s value for studying dynamic associations that vary across chronological age. With the recent availability of free, user-friendly software for implementing TVEM, gerontological researchers have a new tool for exploring complex change processes that characterize older adults’ development.
Keywords: age-varying effects, time-varying effect model, depression and anxiety
Introduction
Gerontological researchers are often interested in studying complex change processes that unfold during later adulthood. Many of these physical and cognitive processes vary by age. For example, although physical function declines as individuals age, the decline is often non-linear, accelerating among the oldest old (Morack et al., 2013; Payette et al., 2011). As individuals’ physical capacities diminish, reliance on others to assist with accomplishing routine self-care activities such as bathing and dressing may increase (Adams et al., 2013). Needing help with basic activities of daily living (BADLs) is associated with depression and anxiety (Dong et al., 2020; Fodeh et al., 2015; Simning & Seplaki, 2020), however the relationship between these variables may vary by age. Limitations in BADLs when an individual is in her 60s may have a greater negative effect on mental health than they would for someone in his 90s, when needing assistance may be perceived as normative.
Traditional longitudinal methods for studying change in older adults’ functioning, such as parametric growth models, have been particularly useful when the underlying shape of change can be modeled with relatively simple trajectory shapes (e.g., linear, quadratic, or cubic) (Shiyko et al., 2012). However, these models are less flexible for estimating more complex change trajectories or when there are many (7 or more) occasions of measurement (Tan et al., 2012; Xie et al., 2017; Yang, Cranford, Li, et al., 2017). Although traditional longitudinal models accommodate both time-invariant (e.g., biological sex) and time-varying (e.g., needing help with BADLs) predictors, the relationship between predictors and the outcome is assumed to be constant by default (Lanza, Vasilenko, et al., 2014; Yang, Cranford, Li, et al., 2017). That assumption is violated when the association between a predictor and outcome varies over time (Yang, Cranford, Li, et al., 2017). Traditional approaches for testing whether these associations are, in fact, time-varying, such as including interaction terms between each predictor and one or more parameterizations of time (e.g., linear, quadratic, cubic) can produce models that are unwieldy with results that are difficult to interpret (Shiyko et al., 2012).
Time-varying effect modeling (TVEM) accommodates both complex change trajectories and intensive longitudinal data (Lanza & Linden-Carmichael, 2021; Lanza et al., 2016; Tan et al., 2012; Xie et al., 2017). TVEM allows researchers to evaluate associations between predictors and outcomes over continuous time in ways that are more nuanced than is often possible with traditional longitudinal models (Lanza & Vasilenko, 2015). In contrast with traditional methods such as longitudinal growth modeling, TVEM does not assume a parametric functional form (e.g., linear, quadratic, cubic) across time, allowing for greater flexibility to explore whether more complex functional forms are needed to model change in the outcome (Lanza et al., 2016; Shiyko et al., 2012; Sprague et al., 2017; Yang, Cranford, Li, et al., 2017). With TVEM, researchers can evaluate whether and how the estimated coefficient functions vary across time and examine the trajectory of change with greater precision (Shiyko et al., 2012). That information may offer more accurate guidance to designers of treatment and prevention programs, suggesting when services may yield the greatest benefit or when adaptations may be most effective (Collins et al., 2004; Lanza & Linden-Carmichael, 2021; Lanza, Vasilenko, et al., 2014). Although TVEM permits modeling time in several ways, our introduction focuses on the time metric we believe is most relevant to gerontological researchers: developmental time as measured by age. We refer interested readers to literature that describes in greater depth alternative parameterizations of time (e.g., Lanza & Linden-Carmichael, 2021; Lanza & Vasilenko, 2015; Lanza et al., 2016).
With the recent availability of free, user-friendly software for both SAS (Dziak et al., 2017; Li et al., 2017) and R (Dziak et al., 2021), TVEM has gained popularity in a variety of research contexts (Flannery et al., 2018; Lanza, Vasilenko, et al., 2014; Linden-Carmichael et al., 2017; Linden-Carmichael et al., 2019; Shiyko et al., 2012; Tan et al., 2012; Vannucci & McCauley Ohannessian, 2018; Vasilenko, 2017; Wright et al., 2014; Yang, Cranford, Li, et al., 2017). However, TVEM’s application to gerontological research questions has been limited despite its potential to shed light on complex change processes that interest researchers in this field (Sprague et al., 2017). The purpose of this study is to provide an introduction to TVEM and illustrate its application with an empirical example using data from the National Health and Aging Trends Study (NHATS). Our aim is to enable applied researchers to assess TVEM’s usefulness for their work by focusing on the practical aspects of using TVEM to examine age-varying associations between predictors and an outcome.
Overview of TVEM
Rooted in the statistical literature on the varying-coefficient model (Hastie & Tibshirani, 1993), TVEM uses spline regression to model complex, nonlinear change across continuous time without imposing constraints on the shapes of the intercept and slope functions (Lanza & Linden-Carmichael, 2021; Shiyko et al., 2012). Traditional regression models have constant intercepts and slopes that represent a weighted average over all time points. In TVEM they are functions that take on different values over specific values of time. A spline is a curve formed by joining a sequence of lower term polynomials at inflection points or knots (Wright et al., 2014). TVEM estimates two types of splines: truncated power basis or P-splines and basis or B-splines. P-spline estimation is recommended for exploratory analysis because the TVEM macro selects the optimal complexity of the coefficient functions automatically, guided by the maximum number of researcher-specified knots or inflection points (typically 5-10) (Lanza & Linden-Carmichael, 2021). With B-spline estimation, researchers determine the optimal number of knots for each coefficient function (i.e., the intercept function and slope function for each covariate) being estimated. Selecting the optimal number of knots is accomplished by comparing the Akaike information criterion (AIC) and Bayesian information criterion (BIC) values from the model with the most complex coefficient functions (i.e., maximum number of knots) to a series of less complex models and then selecting the model with the lower AIC and/or BIC values (Wright et al., 2014). For example, a researcher could vary the number of knots (e.g., from 5 to 1) in the intercept to select the optimal functional form for the intercept function and then repeat this process for each covariate in the model. Given that this manual process could become labor intensive for models with many covariates, Lanza and Linden-Carmichael (2021) proposed a “streamlined model selection procedure” for models with three or more coefficient functions (see pg. 22 for detailed recommendations, which we illustrate in the empirical example). The number and placement of knots should be understood as a way of approximating the shapes of the coefficient functions rather than a method for discerning discrete life events that mark a “turning point” in a trajectory (Cohen, 2008). Given the relative ease of implementing a P-spline estimation approach, researchers might wonder why a B-spline approach would be preferable. Currently, the TVEM macro in SAS does not support using P-spline estimation when incorporating survey weights or including random effects to account for non-independence of repeated assessments (P-spline estimation handles within-subject correlation with robust standard errors) (Li et al., 2017). Under those circumstances, a B-spline approach is the only option. Also, because P-spline estimation produces smoother curves, researchers may opt to use B-spline estimation to “fine tune” trajectories hypothesized to have more complicated shapes (Lanza & Linden-Carmichael, 2021).
Like traditional regression methods, TVEM allows both time-invariant and time-varying predictors. However, TVEM does not assume the relationship between a predictor and an outcome is constant (Lanza, Cooper, et al., 2014). The relationship between the predictor and outcome can vary over continuous time, regardless of whether the explanatory variable is time-invariant or time-varying (Lanza et al., 2016). Traditional regression methods estimate single coefficients for the intercept and slope that represent the average associations across time (Dermody & Shiffman, 2020). With TVEM, the intercept and slope coefficient functions provide estimates for each specific value of time used in the analysis. Because of the large number of parameters being estimated, TVEM results are usually presented graphically (Tan et al., 2012). Highly versatile, TVEM accommodates the modelling of continuous, binary, and count (including zero-inflated Poisson) outcomes (Li et al., 2017).
Empirical Example: Age-Varying Changes in Elevated Symptoms of Depression and Anxiety
Clinically significant depression and anxiety symptoms occur frequently in older adults, and are more commonly reported by individuals who (a) are between the ages of 65 and 75, (b) are female, (c) have lower levels of educational attainment, and (d) experience more limitations in BADLs (Almeida et al., 2012; Beattie et al., 2010; Beekman et al., 2000; Bhattacharya et al., 2014; Byers et al., 2010; Cairney et al., 2008). The consequences of comorbid depression and anxiety are serious. Previous studies suggest “comorbid depression and anxiety may have a more chronic and disabling course than either anxiety or depression alone” (Almeida et al., 2012), including greater risk for institutionalization associated with impairments in BADLs (Cairney et al., 2008). Understanding the time-varying associations between elevated symptoms of depression and anxiety and risk or protective factors among older adults is needed to identify subgroups of vulnerable individuals and to optimize the timing of prevention and intervention services (Collins et al., 2004; Todd & Teitler, 2019). Our study addresses this need with an empirical example examining these research questions:
What is the estimated prevalence of past month elevated symptoms of depression and anxiety among U.S. adults across the ages of 70-96?
How does the relationship between older adults’ need for help with BADLs and occurrence of elevated symptoms of depression and anxiety change over ages ranging from 70 through 96?
How does the relationship between older adults’ educational attainment and elevated symptoms of depression and anxiety vary by age?
The outcome for all three research questions was a binary indicator of an elevated level of symptoms of depression and anxiety in the past month.
Method
Data and Sample
We conducted a secondary analysis of nine waves of data collected from 2011-2020 by the National Health and Aging Trends Study (NHATS). The NHATS study design has been described previously (DeMatteis et al., 2016; Montaquila & Freedman, 2012). Briefly, NHATS is an ongoing annual survey begun in 2011, collecting in-depth information on disability trends and life changes in a nationally representative sample of U.S. Medicare beneficiaries ages 65 and older using a multi-stage, stratified design. A replenishment sample was introduced in 2015 (Wave 5), using the same multi-stage stratified design used in Wave 1. However, we followed guidance offered by NHATS investigators and limited our longitudinal analysis to the original 2011 cohort (Freedman et al., 2020). Due to sparse data among both younger and older participants and to ensure adequate coverage, we restricted our analysis to measurement occasions where individuals (a) were between ages 70-96 years (Freedman et al., 2020), (b) lived in the community (rather than residential care), and (c) where the individual (rather than a proxy) completed the survey (N=30,725 of 42,305 unweighted measurement occasions).
This study, a secondary analysis of publicly-available data, was exempted from IRB review by the Human Investigations Committee of the Yale School of Medicine.
Measures
During the 2011 baseline interview, participants reported their gender, race/ethnicity, educational attainment, and marital status. We recoded gender as female=1, male=0. Race/ethnicity was recoded as non-Hispanic black, non-Hispanic white, Hispanic/Latinx, or other (including non-Hispanic American Indian, Asian, Native Hawaiian and Pacific Islander, multi-racial and unknown), based on frequency distributions. Educational attainment was recoded as high school or below versus greater than high school, based on previous research showing an association between lower levels of educational attainment and symptoms of anxiety and depression (Almeida et al., 2012; Bhattacharya et al., 2014). Marital status was recoded as married or living with partner versus not, based on previous research showing an association between being unpartnered and comorbid anxiety and depression (Byers et al., 2010). Age (in years) and self-reported need for help with any of the four BADLs (eating, bathing, toileting or dressing) were further assessed during each subsequent interview. We created a time-varying dichotomous indicator of needing help with any BADLs to use in our analysis. At each interview, participants reported if a doctor told them they had suffered a stroke or heart attack, had heart disease, high blood pressure, arthritis, osteoporosis, diabetes, dementia or Alzheimer’s disease, or cancer. We counted the number of chronic conditions participants reported and created a time-varying dichotomous indicator of having two or more chronic conditions (MCCs) (Boersma et al., 2020).
Symptoms of depression and anxiety were measured at each interview using the four-item version of the Patient Health Questionnaire (PHQ-4) (Kroenke et al., 2009). The PHQ-4 screens for depression and anxiety and has been validated in both clinical and non-clinical samples (Kroenke et al., 2009; Löwe et al., 2010). Participants indicated how often (0=not at all; 1=several days; 2=more than half the days; 3=nearly every day) they had experienced symptoms of anhedonia and depressed mood (“had little interest or pleasure in doing things”; “felt down, depressed, or hopeless”) and anxiety (“felt nervous, anxious, or on edge”; “been unable to stop or control worrying”) in the last month. We summed responses to the four items to obtain a symptom severity score that ranged from 0 to 12. The distribution of the PHQ-4 total scores was positively skewed and zero-inflated. Therefore, we created a time-varying dichotomous indicator using the recommended cutoff score of 3 to differentiate individuals with elevated symptoms of depression and anxiety from those with normal symptoms (Kroenke et al., 2009). In all cases, a binary indicator of an elevated level of symptoms of depression and anxiety served as the outcome.
Analysis
Descriptive statistics (means/standard deviations for continuous variables; frequencies/percentages for categorical variables) incorporated survey design variables and analytic survey weights to account for differential nonresponse and NHATS’ complex sampling design. Weighted logistic TVEM was used to model the log-odds of elevated symptoms of depression and anxiety across ages 70-96 using B-spline estimation and 5 knots as the maximum number for each regression coefficient function (Dziak et al., 2017). Choosing the maximum number of knots is researcher-determined and is best informed by previous research on the expected complexity of the trajectory. We opted for 5 knots (a) based on previous longitudinal research examining co-occurring depression and anxiety symptoms (Wright et al., 2014), (b) to avoid overfitting (Dziak et al., 2014), and (c) because “in practice 5 knots is more than sufficient for most models” (Lanza & Linden-Carmichael, 2021). If results suggested the association between a predictor and the outcome did not vary with age, we would specify the association as age-invariant. Our initial intercept-only model answered our first research question by estimating the proportion of participants reporting elevated symptoms of depression and anxiety at each age:
where ln is the natural log, p is the probability, DepAnxit indicates if individual i reported elevated symptoms of depression and anxiety (1=yes, 0=no) at age t, and is the coefficient function for the log-odds of reporting elevated symptoms of depression and anxiety across continuous age. Exponentiating the coefficient function yields the odds of reporting elevated symptoms of depression and anxiety at a particular age (t):
Estimated prevalence of elevated symptoms of depression and anxiety at a given age can be calculated by transforming the intercept function:
As described in the introduction, age-varying associations may occur between variables with values that change over time as well as those that are constant. To illustrate this capability, our model with covariates estimated the age-varying associations between elevated symptoms of depression and anxiety and (1) needing help with BADLs (a time-varying covariate) and (2) educational attainment (a time-invariant covariate), controlling for gender, race/ethnicity (represented by dummy variables for non-Hispanic black, Hispanic/Latinx, and other, with non-Hispanic white serving as the reference category), marital status, and having MCCs to answer our second and third research questions:
The intercept function, , estimates the log-odds of reporting elevated symptoms of depression and anxiety across ages 70-96 when the other predictors in the model equal zero (a male, white, unmarried individual with fewer than two chronic conditions, an education level greater than high school, reporting no need for help with BADLs). The coefficient function for each predictor in the model represents the log-odds of reporting elevated symptoms of depression and anxiety associated with a one-unit change in the predictor at a specific age, controlling for the other predictors. For example, is the slope function measuring the change in log-odds of reporting elevated symptoms of depression and anxiety at each age for a woman compared with a man. Exponentiating the function at a given age yields the odds ratio associated with a one-unit change in the explanatory variable at that age.
We hypothesized that the prevalence of elevated symptoms of depression and anxiety would vary by age, being more common among older adults (Liu et al., 2020; Xiang, 2020). We hypothesized the magnitude of the age-varying association between needing help with BADLs and elevated symptoms of depression and anxiety would be greater among the “younger” older adults (e.g., in their 60s), because needing such assistance would be perceived as less normative that it would be for “older” older (e.g., ≥ 80 years) adults (Adams et al., 2013). Finally, we hypothesized that the age-varying association between educational attainment and elevated symptoms of depression and anxiety would be relatively consistent across age, based on results from previous research (Todd & Teitler, 2019).
We used SAS software, Version 9.4 (SAS Institute, Carey, NC) for all analyses. TVEMs were estimated using the weighted TVEM Version 2.6 macro (Dziak et al., 2017), which, in concert with the use of B-splines, permitted incorporation of the NHATS survey design parameters, allowing us to obtain results that were nationally representative of the 2011 population of Medicare beneficiaries. Robust standard errors (i.e., Taylor linearization) accounted for correlation within clusters and subjects (Dziak et al., 2017). In all cases statistical significance was defined as a two-sided p-value < 0.05.
Results
The baseline characteristics of the analytic sample are summarized in Table 1. Participants’ mean age was 78 years. Over half of participants were female (58%) and married (53%). Most participants were white (83%) and reported two or more chronic conditions (78%). Eleven percent of participants reported needing any help with BADLs and 51% had a high school degree or fewer years of education.
Table 1.
Baseline characteristics of the study sample (weighted percentages for categorical variables; mean and standard error for continuous variables)
| Characteristic | Respondents (N=5,605 unweighted; 23,545,628 weighted)a |
|---|---|
| Age | 77.9 (0.1) |
| Female | 57.7 |
| Race-Ethnicity | |
| White, Non-Hispanic | 82.9 |
| Black, Non-Hispanic | 7.7 |
| Hispanic | 6.5 |
| Otherb | 2.9 |
| Married | 52.9 |
| High school degree or less | 51.3 |
| Any BADL helpc | 11.3 |
| Multiple chronic conditionsd | 77.5 |
Baseline participants are drawn from the 2011 sample.
Includes Non-Hispanic American Indian, Asian, Native Hawaiian and Pacific Islander, multi-racial, unknown
BADL – basic activities of daily living
Two or more chronic conditions
To select the optimal functional form for the intercept and slope functions, we followed the “streamlined model selection procedure” proposed by Lanza and Linden-Carmichael (2021). We began by estimating the most complex coefficient functions (i.e., as previously mentioned, the number of knots was set to 5 for the model intercept and all coefficient functions) and then systematically evaluated how well the simpler models (i.e., those with fewer knots) fit the data (Lanza & Linden-Carmichael, 2021). We selected the model with the minimum pseudolikelihood AIC and/or BIC values and then repeated the process until we had determined the optimal number of knots for each coefficient function in the model (Lanza & Linden-Carmichael, 2021). The model selection process is summarized in Table 2 (online supplement), with the underlined rows indicating the model representing the optimal number of knots for each intercept and slope function. For example, in Models 1-5, we varied the number of knots for the slope function for needing any help with BADLs from 5 to 1. Because it has the smallest AIC and BIC values (35205.71 and 35846.82, respectively) relative to the models where BADL had from 2-5 knots, Model 5 suggested that needing any BADL help required only a single knot to capture the age-varying association with elevated symptoms of depression and anxiety. We repeated this process for each covariate in the model, ending with the intercept function. We note that the pseudolikelihood AIC and BIC values sometimes provide conflicting guidance in terms of an optimal solution. That is, the AIC value may increase while the BIC decreases, as seen in Models 5-9. This behavior is expected, as the BIC calculation imposes a penalty for model complexity and, therefore, will tend to favor simpler models (Kuha, 2004). In those situations, researchers may rely on a combination of substantive and theoretical knowledge and examine the estimated coefficient functions to select the optimal model (Lanza & Linden-Carmichael, 2021). Using this approach, we selected Model 37 as our final model.
As mentioned in our overview of TVEM, results are usually presented graphically rather than numerically because of the large number of parameters being estimated (Tan et al., 2012). Figure 1 shows the estimated proportion of older adults reporting elevated symptoms of depression and anxiety in the past month as a function of age obtained from an intercept-only (i.e., unadjusted) model. We transformed the predicted log-odds of elevated symptoms of depression and anxiety at each age into a proportion to obtain age-specific prevalence estimates to answer our first research question. We expected the prevalence of elevated symptoms of depression and anxiety reported in the past month to increase between the ages of 70-96, however we observed the change in prevalence was not linear. The proportion of participants reporting elevated symptoms of depression and anxiety in the past month increased gradually from 23-29% across the ages 70-92, ending with a slight decline after age 92.
Figure 1.
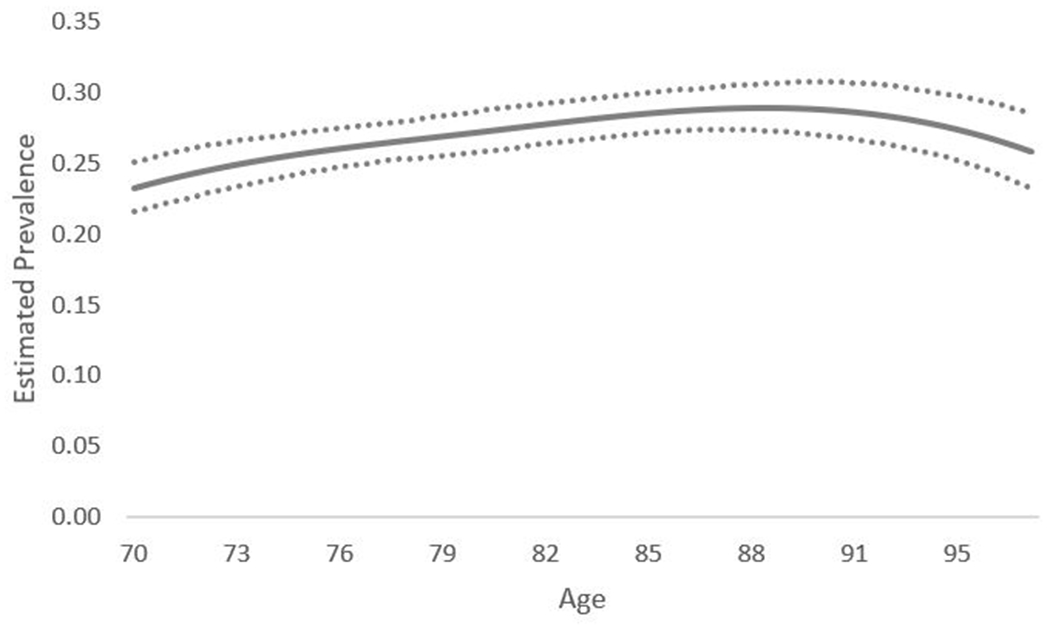
Estimated prevalence of community-dwelling Medicare beneficiaries reporting past month elevated symptoms of depression and anxiety as a function of age. Dotted lines represent point-wise 95% confidence intervals.
The age-varying association between elevated symptoms of depression and anxiety in the past month and needing help with BADLs was also non-linear and is depicted in Figure 2. Across all ages, Medicare beneficiaries who needed any help with BADLs had higher odds of reporting elevated symptoms of depression and anxiety in the past month compared with individuals who did not need help with BADLs (i.e., the estimated odds ratios were all above the reference value of 1.0). As we hypothesized, the magnitude of the association was strongest for “younger” older adults compared with “older” older adults. For example, between ages 70-74, individuals who reported needing any help with BADLs had 3-4 times greater odds of reporting elevated symptoms of depression and anxiety in the past month compared with those who did not need help with BADLs. However, the odds ratio declined to approximately 1.79 (95% CI 1.32, 2.44) by age 96. Note that the wider confidence intervals at the extremes of the age distribution are not unusual because spline-based regression methods “borrow information from nearby times to estimate a point on the curve” (Lanza & Linden-Carmichael, 2021). Without information for ages younger than 70 or older than 96, the confidence intervals tend to be wider at those points.
Figure 2.
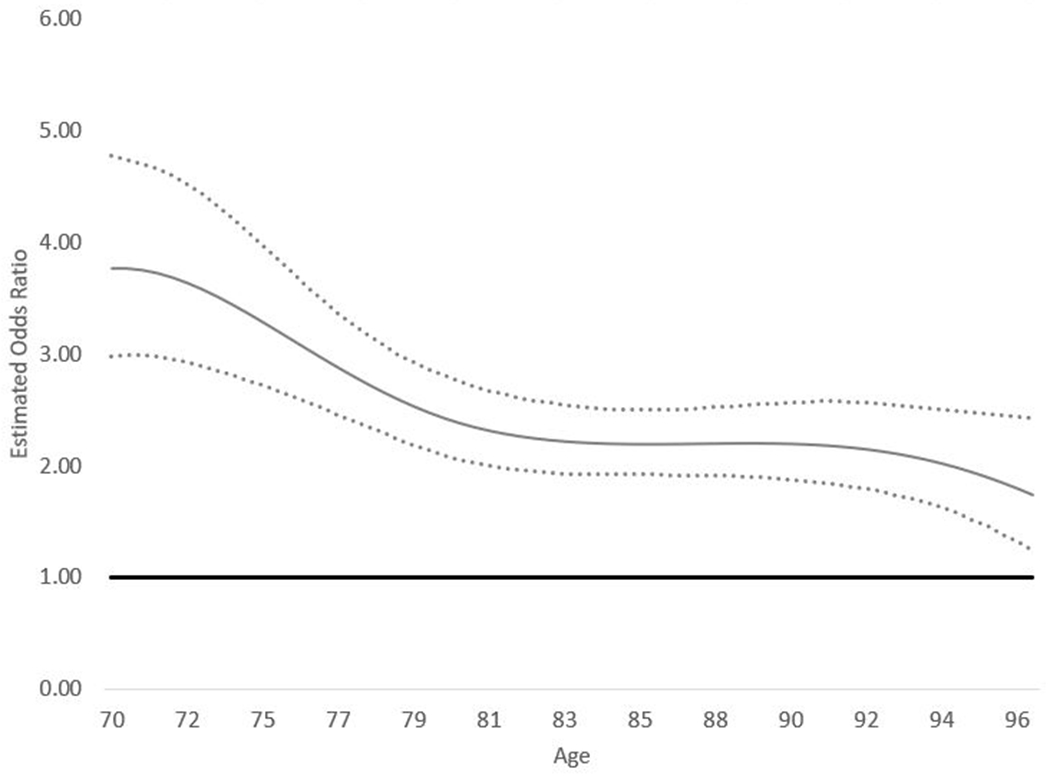
TVEM showing the age-varying association between needing any help with basic activities of daily living (BADLs) and past month elevated symptoms of depression and anxiety. Dotted lines represent point-wise 95% confidence intervals.
The age-varying association between elevated symptoms of depression and anxiety in the past month and educational attainment was also non-linear and is depicted in Figure 3. Across all ages, Medicare beneficiaries with a high school diploma or fewer years of education had higher odds of reporting elevated symptoms of depression and anxiety in the past month compared with individuals with post-secondary education. Fluctuations in the curve at different ages suggested the magnitude of the association varied as a function of age, with the estimated odds ratios peaking around ages 74 (AOR=1.73, 95% CI 1.45, 2.06) and 92 (AOR=1.58, 95% CI 1.28, 1.95).
Figure 3.
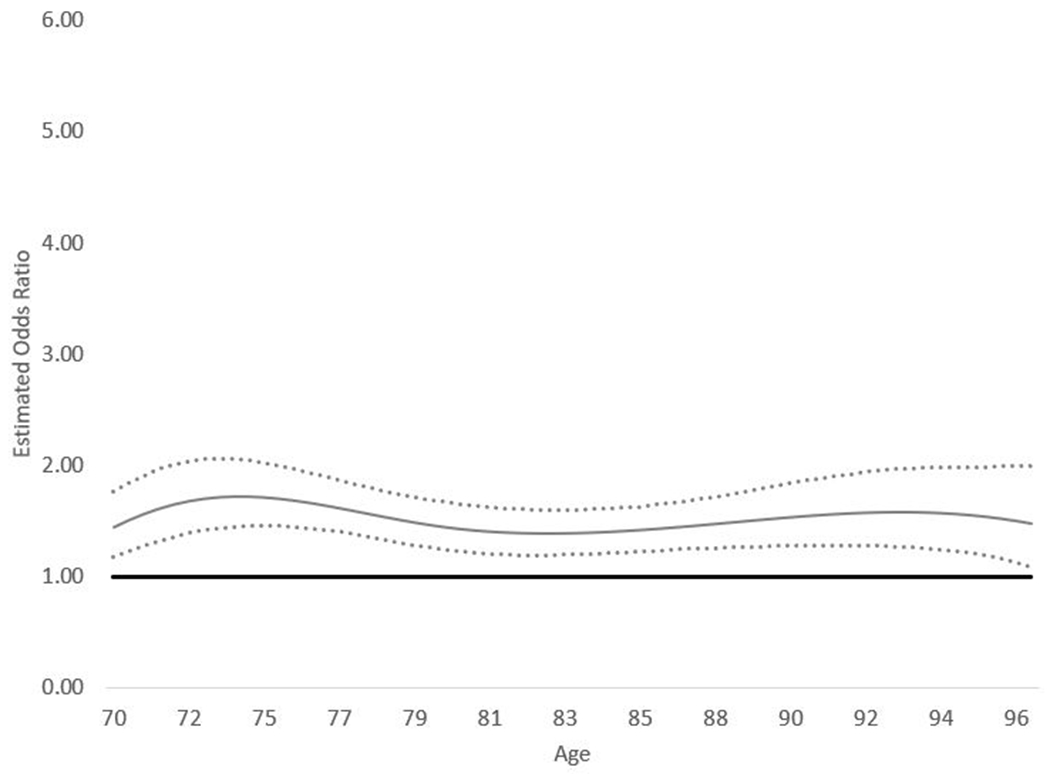
TVEM showing the age-varying association between educational attainment (high school or less vs. post-high school education) and past month elevated symptoms of depression and anxiety. Dotted lines represent point-wise 95% confidence intervals.
Discussion
We presented an overview of TVEM and illustrated its application with an empirical example that explored age-varying associations between older adults’ elevated symptoms of depression and anxiety and individual characteristics of interest to gerontological researchers. We demonstrated TVEM’s capacity for estimating dynamic age-varying processes as flexible functions of continuous time, capturing complex change trajectories that would have been more difficult to estimate and interpret using traditional longitudinal methods. Our empirical findings revealed a non-linear prevalence trajectory, where the proportion of U.S. Medicare beneficiaries reporting elevated symptoms of depression and anxiety in the past month increased gradually from 23-29% between ages 70-92 and possibly declined slightly after age 92. Although it is difficult to draw comparisons to other population-based prevalence estimates due to differences in measurement methods and symptom severity, estimates obtained from the 2011 wave of NHATS data showed that prevalence of mild levels of comorbid depression and anxiety symptoms varied from 26% among adults ages 70-74 to 21% among adults ages 75-79 to 14% among adults ages 80-85 to 10% among adults ages 85 or older (Dong et al., 2020). Our estimates diverged from those reported during the 2011 baseline interview in that we did not observe a similar decline in prevalence across different age categories. It is important to note that our age-varying prevalence estimates were obtained from individuals who participated during any of the nine waves of data collection included in our analysis and do not necessarily reflect developmental or age-related changes within individuals (Sprague et al., 2017).
After adding covariates to the model, we observed non-linear age-varying relationships between elevated symptoms of depression and anxiety and our two focal exposures. Consistent with our hypothesis, the magnitude of the association between elevated symptoms of depression and anxiety and needing help with BADLs was strongest for “younger” older adults compared with “older” older adults. Previous population-based research identified age-related differences in the need for help with BADLs. Approximately 3% of U.S. adults ages 65-74 versus 11% of adults ages 75 and older reported needing help with BADLs (Adams et al., 2013). We hypothesized that “younger” older adults who needed help with BADLs would be more likely to perceive their dependence on others as less normative and this appraisal would then have a negative effect on their mental health. However, our analysis was correlational using observational data and we cannot draw causal inferences from the observed associations (Lanza et al., 2016). It is also plausible that poor mental health could impair older adults’ ability to carry out BADLs (Mlinac & Feng, 2016; Na & Streim, 2017). The non-linear age-varying relationship between educational attainment and elevated symptoms of depression and anxiety in the past month aligned with research suggesting an inverse relationship between educational attainment and overall mental health (Todd & Teitler, 2019). Although our findings generally supported that association, we observed that the strength of the association varied by age.
Strengths and Limitations
The ability to estimate more complex change trajectories when compared with traditional longitudinal methods is both a strength and a challenge of using TVEM. On one hand, results may uncover previously undetected variability that may be used to inform intervention programs by identifying periods of increased or decreased risk for particular outcomes (Bhuiyan et al., 2020; Evans-Polce et al., 2015; Flannery et al., 2018; Lanza et al., 2017; Lanza, Vasilenko, et al., 2014; Mak et al., 2020). On the other hand, it can sometimes be challenging to explain novel findings with respect to previous research. However, we appreciate this challenge in terms of its potential to stimulate further development of theory and research about dynamic processes that may not have been captured adequately using traditional longitudinal approaches. We recognize TVEM as a useful descriptive approach for exploratory, hypothesis-generating analysis rather than a method for testing a priori hypotheses. It is also worth noting that, in contrast with a longitudinal multilevel modeling approach, TVEM is less flexible when it comes to assessing between- and within-person variation. Although TVEM Version 3.1.1 supports inclusion of random intercepts and slopes in the model (Li et al., 2017), “[t]he spline coefficients themselves are not treated as random effects but are assumed to be the same for every participant. Coefficients are not allowed to vary nonlinearly with time while also being different for every subject; this would be too complex to fit, resulting in problems with identification and computation of the estimates” (Lanza & Linden-Carmichael, 2021). Moreover, Weighted TVEM Version 2.6, which we used in our analysis to account for NHATS’s complex survey design, does not support inclusion of random effects (Dziak et al., 2017).
The NHATS data set was well-suited to conducting a TVEM analysis because it is a large, age-heterogeneous sample with nine waves of data that permitted us to estimate age-varying associations spanning ages 70-96 using an accelerated longitudinal design (Prinzie & Onghena, 2005). Although TVEM has been used to examine time-varying relationships using smaller samples (Wright et al., 2014), model convergence and estimate precision both tend to improve as sample size and coverage increase (Sprague et al., 2017; Yang, Cranford, Jester, et al., 2017; Yang, Cranford, Li, et al., 2017).
As an extension of the generalized linear model, TVEM is also bound by similar assumptions and limitations. As Lanza and colleagues noted, “although time trends in coefficients are nonparametric…within a time point, linearity of associations are assumed; to the extent that this [assumption] is violated, more complex underlying within-time associations will not be recovered” (Lanza et al., 2016). Other issues that can introduce bias or influence parameter estimates derived from traditional regression models, such as multicollinearity, non-random attrition or missing data, and omitted variables, are likewise applicable to TVEM (Lanza et al., 2016).
We limited our presentation of TVEM to examining main effect, age-varying associations between categorical predictors and a dichotomous outcome because we thought that scenario would be most relevant to gerontological researchers. A consequence of that choice is that our analysis did not illustrate TVEM’s capacity to accommodate (a) alternative approaches to parameterizing time (e.g., Lanza et al., 2016), (b) outcome variables with non-binary distributions (e.g., Dziak et al., 2014; Wright et al., 2014; Yang, Cranford, Jester, et al., 2017), or (c) moderated time-varying associations (e.g., Evans-Polce et al., 2015). We recommend investigating the growing corpus of research that illustrates these diverse features of TVEM in order to identify scenarios that align with readers’ research questions and study aims. For example, researchers interested in understanding “processes leading up to or following an important event that is common across individuals in a study,” such as spousal loss or retirement, could use an “event-anchored” approach (Lanza et al., 2016) to measure time rather than using age as illustrated in our examples (see Lanza & Linden-Carmichael, 2021; Lanza et al., 2016 for empirical examples).
Our purpose was to motivate gerontological researchers to consider the suitability of this flexible analytic tool for examining dynamic processes that unfold over continuous time and to assess its potential for developing new insights into the health and well-being of older adults. We view TVEM as a complementary analytic method to traditional longitudinal models that is most appropriate when theory or practice suggest complex, nonlinear change processes over time for the phenomenon of interest.
Supplementary Material
Acknowledgements
We thank the anonymous reviewers for their helpful comments and suggestions on earlier versions of this manuscript.
The National Health and Aging Trends Study was produced and distributed by www.nhats.org with funding from the National Institute on Aging (grant number U01AG32947).
Funding
This work was supported by the Claude D. Pepper Older Americans Independence Center at Yale University (P30AG21342). The funding sources were not involved in the design and conduct of the study; the collection, management, analysis, and interpretation of the data; or the preparation, review, and approval of the manuscript.
Footnotes
Conflicts of interest: No conflicts of interest to disclose.
References
- Adams PF, Kirzinger WK, & Martinez ME (2013). Summary health statistics for the U.S. population: National Health Interview Survey, 2012. Vital and Health Statistics. Series 10, Data from the National Health Survey, 259, 1–95. [PubMed] [Google Scholar]
- Almeida OP, Draper B, Pirkis J, Snowdon J, Lautenschlager NT, Byrne G, Sim M, Stocks N, Kerse N, Flicker L, & Pfaff JJ (2012). Anxiety, depression, and comorbid anxiety and depression: risk factors and outcome over two years. Int Psychogeriatr, 24(10), 1622–1632. 10.1017/s104161021200107x [DOI] [PubMed] [Google Scholar]
- Beattie E, Pachana NA, & Franklin SJ (2010). Double jeopardy: Comorbid anxiety and depression in late life. Res Gerontol Nurs, 3(3), 209–220. 10.3928/19404921-20100528-99 [DOI] [PubMed] [Google Scholar]
- Beekman AT, de Beurs E, van Balkom AJ, Deeg DJ, van Dyck R, & van Tilburg W (2000). Anxiety and depression in later life: Co-occurrence and communality of risk factors. Am J Psychiatry, 157(1), 89–95. 10.1176/ajp.157.1.89 [DOI] [PubMed] [Google Scholar]
- Bhattacharya R, Shen C, & Sambamoorthi U (2014). Excess risk of chronic physical conditions associated with depression and anxiety. BMC Psychiatry, 14, 10. 10.1186/1471-244x-14-10 [DOI] [PMC free article] [PubMed] [Google Scholar]
- Bhuiyan N, Linden-Carmichael AN, Lanza ST, Schmitz KH, & Mama SK (2020). Age-varying associations between physical activity and psychological outcomes among rural cancer survivors. J Behav Med. 10.1007/s10865-020-00187-6 [DOI] [PMC free article] [PubMed] [Google Scholar]
- Boersma P, Black LI, & Ward BW (2020). Prevalence of Multiple Chronic Conditions Among US Adults, 2018. Prev Chronic Dis, 17, E106. 10.5888/pcd17.200130 [DOI] [PMC free article] [PubMed] [Google Scholar]
- Byers AL, Yaffe K, Covinsky KE, Friedman MB, & Bruce ML (2010). High occurrence of mood and anxiety disorders among older adults: The National Comorbidity Survey Replication. Arch Gen Psychiatry, 67(5), 489–496. 10.1001/archgenpsychiatry.2010.35 [DOI] [PMC free article] [PubMed] [Google Scholar]
- Cairney J, Corna LM, Veldhuizen S, Herrmann N, & Streiner DL (2008). Comorbid depression and anxiety in later life: patterns of association, subjective well-being, and impairment. Am J Geriatr Psychiatry, 16(3), 201–208. 10.1097/JGP.0b013e3181602a4a [DOI] [PubMed] [Google Scholar]
- Cohen P (Ed.). (2008). Applied data analytic techniques for turning points research. New York: Routledge/Taylor & Francis Group. [Google Scholar]
- Collins LM, Murphy SA, & Bierman KL (2004). A conceptual framework for adaptive preventive interventions. Prev Sci, 5(3), 185–196. 10.1023/b:prev.0000037641.26017.00 [DOI] [PMC free article] [PubMed] [Google Scholar]
- DeMatteis J, Freedman VA, & Kasper JD (2016). National Health and Aging Trends Study Round 5 Sample Design and Selection, Technical Paper #16.
- Dermody SS, & Shiffman S (2020). The time-varying effect of alcohol use on cigarette smoking relapse risk. Addict Behav, 102, 106192. 10.1016/j.addbeh.2019.106192 [DOI] [PubMed] [Google Scholar]
- Dong L, Freedman VA, & Mendes de Leon CF (2020). The Association of Comorbid Depression and Anxiety Symptoms With Disability Onset in Older Adults. Psychosom Med, 82(2), 158–164. 10.1097/psy.0000000000000763 [DOI] [PMC free article] [PubMed] [Google Scholar]
- Dziak JD, Coffman D, Li R, Litson K, & Chakraborti Y (2021). tvem. In (Version 1.3.1) Comprehensive R Archive Network. https://CRAN.R-project.org/package=tvem. Accessed June 12, 2022. [Google Scholar]
- Dziak JD, Li R, & Wagner AT (2017). Weighted TVEM SAS macro user’s guide (Version 2.6). In (Version 2.6) The Methodology Center, Penn State University. methodology.psu.edu. Accessed August 1, 2019. [Google Scholar]
- Dziak JJ, Li R, Zimmerman MA, & Buu A (2014). Time-varying effect models for ordinal responses with applications in substance abuse research. Statistics in Medicine, 33(29), 5126–5137. 10.1002/sim.6303 [DOI] [PMC free article] [PubMed] [Google Scholar]
- Evans-Polce RJ, Vasilenko SA, & Lanza ST (2015). Changes in gender and racial/ethnic disparities in rates of cigarette use, regular heavy episodic drinking, and marijuana use: ages 14 to 32. Addict Behav, 41, 218–222. 10.1016/j.addbeh.2014.10.029 [DOI] [PMC free article] [PubMed] [Google Scholar]
- Flannery KM, Vannucci A, & Ohannessian CM (2018). Using Time-Varying Effect Modeling to Examine Age-Varying Gender Differences in Coping Throughout Adolescence and Emerging Adulthood. Journal of Adolescent Health, 62(3, Supplement), S27–S34. 10.1016/j.jadohealth.2017.09.027 [DOI] [PubMed] [Google Scholar]
- Fodeh SJ, Trentalange M, Allore HG, Gill TM, Brandt CA, & Murphy TE (2015). Baseline cluster membership demonstrates positive associations with first occurrence of multiple gerontologic outcomes over 10 years. Exp Aging Res, 41(2), 177–192. 10.1080/0361073x.2015.1001655 [DOI] [PMC free article] [PubMed] [Google Scholar]
- Freedman VA, Hu M, DeMatteis J, & Kasper JD (2020). Accounting for sample design in NHATS and NSOC analyses: Frequently asked questions (NHATS Technical Paper #23). www.nhats.org. Accessed September 12, 2021.
- Hastie T, & Tibshirani R (1993). Varying-coefficient models. Journal of the Royal Statistical Society. Series B (Methodological), 757–796. [Google Scholar]
- Kroenke K, Spitzer RL, Williams JBW, & Löwe B (2009). An Ultra-Brief Screening Scale for Anxiety and Depression: The PHQ–4. Psychosomatics, 50(6), 613–621. 10.1016/S0033-3182(09)70864-3 [DOI] [PubMed] [Google Scholar]
- Kuha J (2004). AIC and BIC: Comparisons of Assumptions and Performance. Sociological Methods & Research, 33(2), 188–229. 10.1177/0049124103262065 [DOI] [Google Scholar]
- Lanza ST, Cooper BR, & Bray BC (2014). Population heterogeneity in the salience of multiple risk factors for adolescent delinquency. J Adolesc Health, 54(3), 319–325. 10.1016/j.jadohealth.2013.09.007 [DOI] [PMC free article] [PubMed] [Google Scholar]
- Lanza ST, & Linden-Carmichael AN (2021). Time-Varying Effect Modeling for the Behavioral, Social, and Health Sciences. Switzerland AG: Springer International Publishing. [Google Scholar]
- Lanza ST, Russell MA, & Braymiller JL (2017). Emergence of electronic cigarette use in US adolescents and the link to traditional cigarette use. Addict Behav, 67, 38–43. 10.1016/j.addbeh.2016.12.003 [DOI] [PMC free article] [PubMed] [Google Scholar]
- Lanza ST, & Vasilenko SA (2015). New methods shed light on age of onset as a risk factor for nicotine dependence. Addict Behav, 50, 161–164. 10.1016/j.addbeh.2015.06.024 [DOI] [PMC free article] [PubMed] [Google Scholar]
- Lanza ST, Vasilenko SA, Liu X, Li R, & Piper ME (2014). Advancing the understanding of craving during smoking cessation attempts: a demonstration of the time-varying effect model. Nicotine Tob Res, 16 Suppl 2, S127–134. 10.1093/ntr/ntt128 [DOI] [PMC free article] [PubMed] [Google Scholar]
- Lanza ST, Vasilenko SA, & Russell MA (2016). Time-varying effect modeling to address new questions in behavioral research: Examples in marijuana use. Psychol Addict Behav, 30(8), 939–954. 10.1037/adb0000208 [DOI] [PMC free article] [PubMed] [Google Scholar]
- Li R, Dziak JD, Huang L, Wagner AT, & Yang J (2017). TVEM (time-varying effect modeling) SAS macro users’ guide (Version 3.1.1). http://methodology.psu.edu. Accessed August 1, 2019.
- Linden-Carmichael AN, Lanza ST, Dziak JJ, & Bray BC (2017). Contemporary alcohol use patterns among a national sample of U.S. adult drinkers. J Addict Dis, 1–5. 10.1080/10550887.2017.1338816 [DOI] [PMC free article] [PubMed] [Google Scholar]
- Linden-Carmichael AN, Russell MA, & Lanza ST (2019). Flexibly modeling alcohol use disorder risk: How many drinks should we count? Psychology of addictive behaviors, 33(1), 50–57. 10.1037/adb0000431 [DOI] [PMC free article] [PubMed] [Google Scholar]
- Liu M, Taylor JL, Perrin NA, & Szanton SL (2020). Distinct clusters of older adults with common neuropsychological symptoms: Findings from the National Health and Aging Trends Study. Geriatr Nurs, 41(3), 222–228. 10.1016/j.gerinurse.2019.09.004 [DOI] [PubMed] [Google Scholar]
- Löwe B, Wahl I, Rose M, Spitzer C, Glaesmer H, Wingenfeld K, Schneider A, & Brähler E (2010). A 4-item measure of depression and anxiety: validation and standardization of the Patient Health Questionnaire-4 (PHQ-4) in the general population. J Affect Disord, 122(1-2), 86–95. 10.1016/j.jad.2009.06.019 [DOI] [PubMed] [Google Scholar]
- Mak HW, Russell MA, Lanza ST, Feinberg ME, & Fosco GM (2020). Age-varying associations of parental knowledge and antisocial peer behavior with adolescent substance use. Dev Psychol, 56(2), 298–311. 10.1037/dev0000866 [DOI] [PMC free article] [PubMed] [Google Scholar]
- Mlinac ME, & Feng MC (2016). Assessment of Activities of Daily Living, Self-Care, and Independence. Archives of Clinical Neuropsychology, 31(6), 506–516. 10.1093/arclin/acw049 [DOI] [PubMed] [Google Scholar]
- Montaquila J, & Freedman VA (2012). National Health and Aging Trends Study Round 1 Sample Design and Selection, Technical Paper #1.
- Morack J, Infurna FJ, Ram N, & Gerstorf D (2013). Trajectories and personality correlates of change in perceptions of physical and mental health across adulthood and old age. International Journal of Behavioral Development, 37(6), 475–484. 10.1177/0165025413492605 [DOI] [Google Scholar]
- Na L, & Streim JE (2017). Psychosocial Well-Being Associated With Activity of Daily Living Stages Among Community-Dwelling Older Adults. Gerontology & geriatric medicine, 3, 2333721417700011–2333721417700011. 10.1177/2333721417700011 [DOI] [PMC free article] [PubMed] [Google Scholar]
- Payette H, Gueye NR, Gaudreau P, Morais JA, Shatenstein B, & Gray-Donald K (2011). Trajectories of physical function decline and psychological functioning: the Quebec longitudinal study on nutrition and successful aging (NuAge). J Gerontol B Psychol Sci Soc Sci, 66 Suppl 1, i82–90. 10.1093/geronb/gbq085 [DOI] [PubMed] [Google Scholar]
- Prinzie P, & Onghena P (2005). Cohort Sequential Design. In Encyclopedia of Statistics in Behavioral Science. 10.1002/0470013192.bsa110. Accessed July 7, 2021. [DOI]
- Shiyko MP, Lanza ST, Tan X, Li R, & Shiffman S (2012). Using the time-varying effect model (TVEM) to examine dynamic associations between negative affect and self confidence on smoking urges: differences between successful quitters and relapsers. Prev Sci, 13(3), 288–299. 10.1007/s11121-011-0264-z [DOI] [PMC free article] [PubMed] [Google Scholar]
- Simning A, & Seplaki CL (2020). Association of the cumulative burden of late-life anxiety and depressive symptoms with functional impairment. Int J Geriatr Psychiatry, 35(1), 80–90. 10.1002/gps.5221 [DOI] [PMC free article] [PubMed] [Google Scholar]
- Sprague BN, Phillips CB, & Ross LA (2017). Age-Varying Relationships Between Physical Function and Cognition in Older Adulthood. The Journals of Gerontology: Series B, 74(5), 772–784. 10.1093/geronb/gbx126 [DOI] [PMC free article] [PubMed] [Google Scholar]
- Tan X, Shiyko MP, Li R, Li Y, & Dierker L (2012). A time-varying effect model for intensive longitudinal data. Psychol Methods, 17(1), 61–77. 10.1037/a0025814 [DOI] [PMC free article] [PubMed] [Google Scholar]
- Todd M, & Teitler J (2019). Darker days? Recent trends in depression disparities among US adults. American Journal of Orthopsychiatry, 89(6), 727–735. 10.1037/ort0000370 [DOI] [PMC free article] [PubMed] [Google Scholar]
- Vannucci A, & McCauley Ohannessian C (2018). Self-Competence and Depressive Symptom Trajectories during Adolescence [journal article]. Journal of Abnormal Child Psychology, 46(5), 1089–1109. 10.1007/s10802-017-0340-3 [DOI] [PubMed] [Google Scholar]
- Vasilenko SA (2017). Age-varying associations between nonmarital sexual behavior and depressive symptoms across adolescence and young adulthood. Dev Psychol, 53(2), 366–378. 10.1037/dev0000229 [DOI] [PMC free article] [PubMed] [Google Scholar]
- Wright AG, Hallquist MN, Swartz HA, Frank E, & Cyranowski JM (2014). Treating co-occurring depression and anxiety: modeling the dynamics of psychopathology and psychotherapy using the time-varying effect model. J Consult Clin Psychol, 82(5), 839–853. 10.1037/a0034430 [DOI] [PMC free article] [PubMed] [Google Scholar]
- Xiang X (2020). Seven-Year Trajectories of Depressive Symptoms and Their Predictors Among Older Americans. J Aging Health, 32(7-8), 795–806. 10.1177/0898264319852835 [DOI] [PubMed] [Google Scholar]
- Xie H, Drake RE, Kim SJ, & McHugo GJ (2017). Analyzing Long-Duration and High-Frequency Data Using the Time-Varying Effect Model. Administration and policy in mental health and mental health services research, 44(2), 225–232. 10.1007/s10488-016-0716-7 [DOI] [PubMed] [Google Scholar]
- Yang S, Cranford JA, Jester JM, Li R, Zucker RA, & Buu A (2017). A time-varying effect model for examining group differences in trajectories of zero-inflated count outcomes with applications in substance abuse research. Statistics in Medicine, 36(5), 827–837. 10.1002/sim.7177 [DOI] [PMC free article] [PubMed] [Google Scholar]
- Yang S, Cranford JA, Li R, Zucker RA, & Buu A (2017). A time-varying effect model for studying gender differences in health behavior. Stat Methods Med Res, 26(6), 2812–2820. 10.1177/0962280215610608 [DOI] [PMC free article] [PubMed] [Google Scholar]
Associated Data
This section collects any data citations, data availability statements, or supplementary materials included in this article.