

Summary
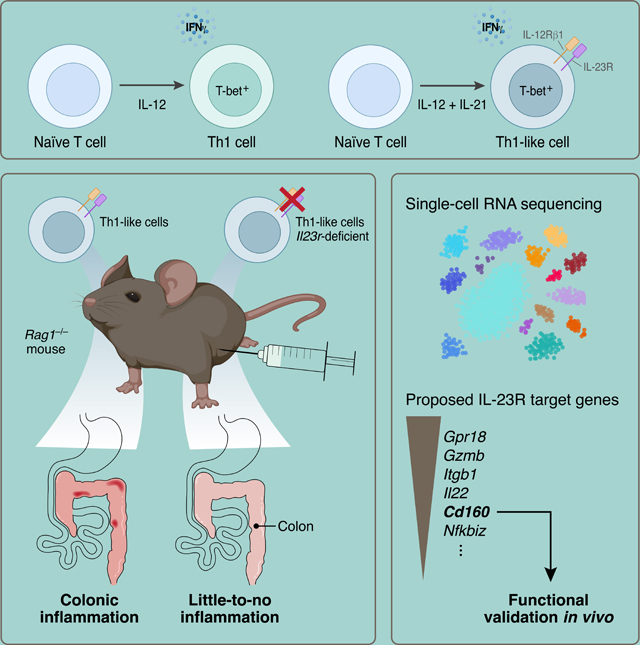
Interleukin 23 receptor plays a critical role in inducing inflammation and autoimmunity. Here, we report that Th1-like cells differentiated in vitro with IL-12 + IL-21 showed similar IL-23R expression as pathogenic Th17 cells using eGFP reporter mice. Fate-mapping established that these cells did not transition through a Th17 cell state prior to becoming Th1-like cells and we observed their emergence in vivo in the T cell adoptive transfer colitis model. Using IL-23R-deficient Th1-like cells, we demonstrated that IL-23R was required for the development of a highly colitogenic phenotype. Single-cell RNA-sequencing analysis of intestinal T cells identified IL-23R-dependent genes in Th1-like cells that differed from those expressed in Th17 cells. The perturbation of one of these regulators (CD160) in Th1-like cells inhibited the induction of colitis. We thus uncouple IL-23R as a purely Th17 cell-specific factor and implicate IL-23R signaling as a pathogenic driver in Th1-like cells inducing tissue inflammation.
eTOC/”In Brief” paragraph:
IL23R is a major susceptibility gene in human autoimmune diseases, but how it confers pathogenicity to T helper cells has not been fully elucidated. Pawlak, DeTomaso et al. demonstrate that Th1-like cells require IL-23R-signaling to induce colitis. These findings indicate that IL-23R functions in non-Th17 cells to drive pathogenesis during intestinal autoimmunity.
Graphical Abstract
Introduction
The cytokine IL-23 and its receptor IL-23R play a fundamental role in inducing tissue inflammation and autoimmunity (Teng et al., 2015). It has been shown that pre-clinical models of multiple sclerosis, arthritis and inflammatory bowel disease (IBD) are dependent on IL-23 signaling to induce disease (Ahern et al., 2010; Cua et al., 2003; Murphy et al., 2003). The relevance to human disease is emphasized by genome-wide association studies (GWAS) that established IL23R as a risk gene in multiple human autoimmune diseases including IBD (Duerr et al., 2006). Several anti-IL-23 inhibitors have been approved for the treatment of psoriasis and are now being tested in other autoimmune conditions where Th17 cells have not been implicated in disease induction (Patel and Kuchroo, 2015).
IL-23R signaling is crucial for evoking a pathogenic phenotype in Th17 cells by stabilizing their function and inducing multiple factors that make Th17 cells highly pro-inflammatory (Lee et al., 2012; McGeachy et al., 2009; Schnell et al., 2021). Several observations have been difficult to reconcile with the assumption that IL-23R solely operates in pathogenic Th17 cells and not in other pro-inflammatory T cell subsets. In particular, it has been observed that Th1 cells elicit colitis in pre-clinical models, particularly in the adoptive transfer colitis model (Harbour et al., 2015), but Th1 cells are not known to express IL-23R. These data conflict with the observation that IL-23R signaling is required for the induction of colitis and that human IBD has been linked to IL23R polymorphisms. Whether Th1 cells themselves, driven by IL-23R, could trigger colitis without going through a Th17 cell-state has not been addressed. Clinically, secukinumab, a monoclonal antibody targeting IL-17A has been found effective in psoriasis and ankylosing spondylitis yet ineffective in IBD (Hueber et al., 2012). In contrast, ustekinumab, a monoclonal antibody targeting both IL-12 and IL-23, and therefore targeting differentiation of both Th1 cells and Th17 cells, is effective in IBD (Sandborn et al., 2012; Sands et al., 2019b). Indeed, the seminal studies by Powrie and colleagues have established that both Th1 and Th17 cells develop in the pre-clinical disease model of IBD following adoptive transfer of naïve CD45RBhi T cells (Ahern et al., 2010; Powrie et al., 1994). These observations provided impetus to investigate whether IL-23 may also confer pathogenicity to another T helper cell subset, in addition to quintessential Th17 cells, and thereby contribute to IBD. Here, we report the requirement of IL-23R-signaling, which has been genetically linked to human IBD, for conferring colitogenic phenotype in Th1-like cells and identify targets induced by IL-23R-signaling, including CD160.
Results
In vitro differentiation of naïve T cells with IL-12 and IL-21 induces IL-23R+ Th-1 like cells
Although it has been shown in vivo that IFN-γ+ T cells can express IL-23R, these IFN-γ-producing cells were identified as having transdifferentiated from Th17 cells using a fate-mapping approach (Hirota et al., 2011). However, whether there are Th1-like cells that express IL-23R and respond to its activation has not been addressed. Screening different cytokine conditions (Figure S1), we discovered that culturing naïve CD4+ T cells with IL12 + IL-21 induced strong expression of IL-23R together with IFN-γ, the signature cytokine of Th1 cells (Figures 1A and S1). The expression of IL-23R in these Th1-like cells was similar to pathogenic Th17 cells that were differentiated with the cytokine combination IL-1β + IL-6 + IL-23 based on mRNA and reporter gene expression (Figure 1A) (Ghoreschi et al., 2010). Differentiation of naïve T cells with IL-12 or IL-21 alone induced minimal expression of IL-23R (Figure S1). Differentiation with IL-23 + IL-12 did also induce Il23r expression, however, the induction of IL-23R and IFN-γ expression were more pronounced with IL-12 + IL-21 (Figure S1). Besides the expression of Il23r, we also confirmed the induction of a Th1 cell transcriptional program (Ifng, Tbx21; Figure 1B) suggesting that these cells were indeed Th1-like cells. To further evaluate relative expression of the master transcription factor T-bet in Th1-like cells, we used T-bet-Cre fate-mapping mice (Haddad et al., 2013; Madisen et al., 2010). We observed that IL-12 and IL-12 + IL-21 differentiated cells had highly similar expression of T-bet (Figure 1C).
Figure 1. IL-12 + IL-21 induce IL-23R expression in Th1-like cells in vitro.

(A) Naïve T cells were cultured in vitro for 5 days: (1) IL-12 + IL-21 (2) IL-12 + IL-21 + IL-23 (3) TGF-β + IL-6 (4) IL-1β + IL-6 + IL-23. (B) Expression of Il23r and Th1 and Th17 cell signature genes in competent (Il23reGFP/wt) and deficient cells (Il23reGFP/eGFP) by qPCR. (C) Differentiation of naïve T cells from T-bet-Cre fate mapping mice: (1) TGF-β (2) IL-1β + IL-6 + IL-23 (3) TGF-β + IL-6 (4) IL-12 + IL-21 + IL-23 (5) IL-12 + IL-21 (6) IL-12. (D) Schematic of FACS of IL-23R+ (eGFP+) and IL-23R- (eGFP-) cells differentiated with IL12 + IL-21+ IL-23 for scRNAseq. (E) t-SNE plots showing the expression of Th1 and Th17 cell signature genes. (F) Expression of selected genes in eGFP+ (green) and eGFP- (grey) cells in competent (Il23reGFP/wt) cells. (G) Differentially expressed genes between eGFP+ and eGFP- cells depending on genotype. (H) Volcano plot showing genes differentially expressed in an IL-23R-dependent manner. Panel (A) is representative of several independent experiments. Individual data points shown in (A) represent technical replicates, n=3. In Panel (A) and (B) mean + s.e.m. are shown. See also Figure S1.
scRNAseq identifies IL-23R-dependent genes in Th1-like cells
It is known that IL-23R signaling induces a pathogenic transcriptional program in Th17 cells. Therefore, we studied whether the same was true for Th1-like cells. Using an established eGFP reporter allele for Il23r expression (Il23reGFP/wt), we first differentiated naïve T cells with IL-12 + IL-21 + IL-23 for 96 hours. Notably, we added IL-23 in order to enhance signaling through IL-23R. We then isolated IL-23R+ (eGFP+) and IL-23R- (eGFP−) cells and conducted scRNAseq of the two populations using the Smart-seq2 protocol (Awasthi et al., 2009; Picelli et al., 2013). Second, we differentiated naïve T cells from IL-23R-deficient mice (Il23reGFP/eGFP) with the same set of cytokines and sorted eGFP+ and eGFP- cells for gene expression analysis (Figure 1D).
At the single-cell level, IFN-γ-expressing Th1-like cells co-expressed Il23r but did not express Th17 cell signature genes (Il17a, Il17f, Ccr6). Instead, the cells expressed Th1 cell signature genes (Ifng, Tbx21, Cxcr3) (Figures 1E and S2). A lower frequency of cells expressed Rorc, encoding the transcription factor RORγt associated with Th17 cell differentiation, but the expression of Rorc was minimal when compared to the Th1 cell master transcription factor Tbx21 (Figures 1E and S2).
Comparing the IL-23R+ vs. the IL-23R- subsets from the IL-23R-competent cells (Il23reGFP/wt) identified genes potentially co-expressed with IL-23R (Figures 1F and G). A set of 528 differentially expressed (DE) genes was positively or negatively associated with the presence of IL-23R in Th1-like cells. Indeed, the set of genes that was co-expressed with IL-23R included critical effector molecules and transcription factors including Il18r1 and Stat5a (Figure 1F and Table S1).
The number of differentially expressed genes between the eGFP+ and eGFP- populations in IL-23R-deficient cells (Il23reGFP/eGFP) was substantially lower than in IL-23R-competent cells (129 vs 528 at FDR < 0.1 with only 33 genes overlapping; Figure 1G). These eGFP+ IL-23R-deficient cells reflected differentiation in response to IL-12 + IL-21 in the absence of IL-23R signaling. This suggests that the majority of genes differentially expressed between the IL-23R+ and IL-23R- populations in IL-23R-competent cells are likely directly affected by IL-23R signaling.
We then combined our analysis of both IL-23R-competent and IL-23R-deficient cells to better distinguish genes directly regulated by IL-23R signaling in Th1-like cells (Figure 1H) (see methods for full details). We identified 219 genes where the presence of IL-23R in IL-23R-competent cells was associated with increased expression in eGFP+ compared to eGFP- cells. Of those, Dusp2, Gpr18, Trim27, Itgb1, Gzmb, Pde4b, Plek, Thap11, Panx1, Peli1, Rac1 and Lamp1 (CD107a) appeared of particular interest as candidate genes dependent on IL-23R signaling (Figure 1H and Table S1).
Th1 cells and Th1-like cells expressing IL-23R show similar genome-wide expression profiles that distinguish them from Th17 cell subsets
We wondered whether IL-12 and IL-12 + IL-21 differentiated cells are similar, so we compared their gene expression at whole-genome scale using RNAseq. To this end, we differentiated naïve T cells with 4 different conditions: IL-1β + IL-6 + IL-23 (pathogenic Th17 cells), TGF-β + IL-6 (non-pathogenic Th17 cells), IL-12 (Th1 cells) and IL-12 + IL-21 (Th1-like cells expressing IL-23R) and performed RNAseq (Figure 2A and B). Besides the difference of IL-23R expression, IL-12 and IL12 + IL-21 differentiated cells shared a highly similar expression profile and clustered together as observed by PCA (principal component analysis) (Figure 2A). Additionally, comparing the number of differentially expressed genes detected between conditions (FDR < 0.1, |log2FC| > 0.5) revealed that IL-12 + IL-21 differentiated cells were most similar to the IL-12 differentiated cells, and both IL-12 and IL-12 + IL-21 differentiated cells were similarly distinct from Th17 cells (Figure 2A, small panel and Table S2). We also analyzed the expression of defined signature genes and observed that cells differentiated with IL-12 or IL-12 + IL-21 had a similar gene expression except for the expression of Il23r and few other associated genes (Figure 2B). In contrast, both pathogenic and non-pathogenic Th17 cells exhibited a very distinct gene expression pattern from the Th1 and Th1-like differentiation conditions. Of note, eGFP+ and eGFP- cells from all conditions were sorted for RNAseq with the exception of the IL-12 differentiated cells where no eGFP+ population was detected.
Figure 2. T cells differentiated with IL-12 and IL-12 + IL-21 show similar gene expression profiles compared to Th17 cell subsets.
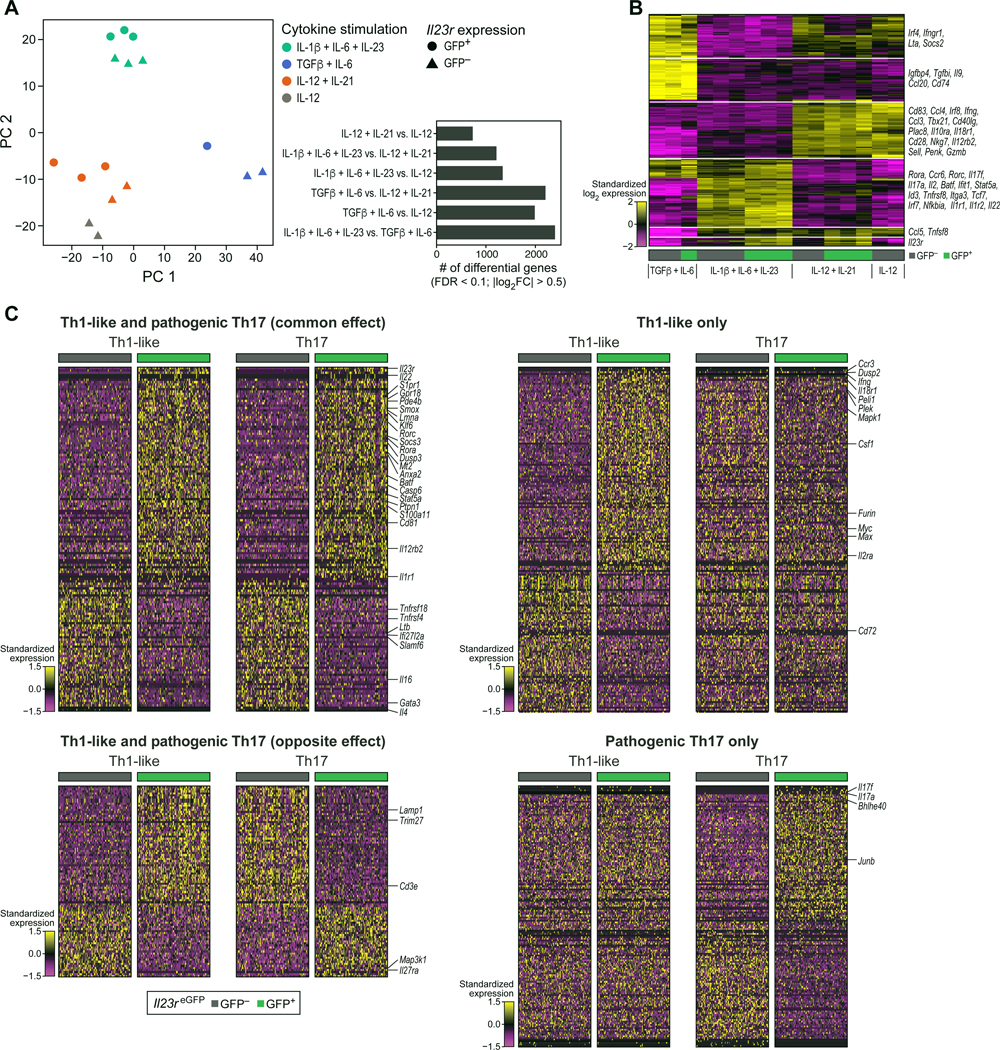
Naïve T cells from Il23reGFP reporter mice were cultured for RNAseq: (1) IL-1β + IL-6 + IL-23 (pathogenic Th17 cells); (2) TGF-β + IL-6 (non-pathogenic Th17 cells); (3) IL-12 + IL-21; (4) IL-12 (Th1 cells). Cells were sorted for eGFP+ and eGFP- populations. (A) The first two principal components of the expression profiles are shown. The smaller panel shows the number of differentially expressed genes detected between pairs of differentiation conditions. (B) Heatmap visualization of the 200 genes with the highest between-group variation. (C) scRNAseq of IL-23R+ Th1-like and IL-23R+ Th17 cells shows both common and unique transcriptional signatures. IL-23R+ (eGFP+) and IL-23R- (eGFP-) pathogenic Th17 cells (IL-1β + IL-6 + IL-23) were sorted and the transcriptional signatures were compared to Th1-like cells (IL-12 + IL-21 + IL-23) reported in Figure 1D–1H. Icons in panel (A) and columns in panel (B) represent individual animals.
In summary, we demonstrate that IL-12 + IL-21 and IL-12 differentiated naïve T cells share a highly similar whole-genome expression profile with the key difference of IL-23R expression in IL-12 + IL-21 differentiated cells.
IL-23R+ Th1-like and IL-23R+ Th17 cells display both common and subset-specific features that distinguish them
To investigate in greater detail whether IL-23R+ Th1-like and IL-23R+ Th17 cells share common features, we differentiated pathogenic Th17 cells with IL-1β + IL-6 + IL-23 and sorted IL-23R+ (eGFP+) and IL-23R- (eGFP-) cells for single-cell analysis comparing their transcriptional profiles with those of Th1-like cells. We found a set of 147 genes whose expression differences between IL-23R+ and IL-23R- cells were similar in the Th1-like and Th17 populations (Figure 2C and Table S1). Among the genes highly expressed in both Th1-like and Th17 IL-23R+ cells, we found Il22, which has been identified previously as a core component of the pathogenicity signature of Th17 cells (Gaublomme et al., 2015; Lee et al., 2012). Some genes (179) were differentially expressed between IL-23R+ and IL-23R- cells only in the Th1-like population, such as Il18r1 and Ifng (Figure 2C and Table S1). 93 genes showed the exact opposite profile in Th1-like and Th17 cells, one of which was Il27ra which was highly expressed in IL-23R- Th1-like cells (Figure 2C and Table S1). Finally, Il17a and Il17f were prominently expressed in IL-23R+ cells in Th17 cells only, and were among 158 genes that were differentially expressed between IL-23R+ cells and IL-23R- cells only in Th17 cells (Figure 2C and Table S1). These results suggest that IL23R may induce a common Th1-like/Th17 cell pathogenicity expression profile but also induces distinct sets of genes in Th1-like and Th17 cells that likely contribute to their pathogenicity to exert lineage-specific phenotype and function.
IL-12 + IL-21 differentiated Th1-like cells do not transition through an intermediate Th17 cell stage
To address the question whether IL-12 + IL-21 differentiated cells at any point had differentiated into Th17 cells and then transitioned into Th1-like cells, we used Th17 cell fate-mapping animals in which IL-17ACre drives the expression of TdTomato from the Rosa26 locus (Hirota et al., 2011; Madisen et al., 2010). We differentiated naïve T cells under 3 conditions: TGF-β + IL-6 (non-pathogenic Th17 cells), IL-12 (Th1 cells) and IL12 + IL-21 (Th1-like cells expressing IL-23R). We found that both IL-12 and IL-12 + IL-21 differentiated cells remained TdTomato/fate-negative demonstrating that IL-12 + IL-21 differentiated cells, despite their strong expression of IL-23R, do not transition through a Th17 cell intermediate stage during their trajectory (Figure S3).
A fate-mapping approach identifies Th1-like IL-23R-expressing cells in vivo during colitis
To study the question whether IL-23R-expressing Th1-like cells could also develop naturally in vivo during colitis in an unbiased model without prior in vitro polarization, we turned to the CD45RBhi naïve T cell adoptive transfer model (Powrie et al., 1994). In this model, naïve T cells are known to differentiate into pathogenic CD4+ T cells with both Th17 cell and Th1 cell phenotypes and these cells induce colitis (Ahern et al., 2010; Powrie et al., 1994). To be able to distinguish Th1, Th17 and ex-Th17 cells, we devised a genetic approach that took advantage of three alleles: Il17aCre, Il23reGFP and Rosa26TdTomato enabling us to track all the aforementioned T helper cell subsets without the constraints of in vitro bias of T cell differentiation. Indeed, we identified TdTomato/Th17-fate-negative, IL-23R+ T cells arising in the colonic mucosa during colitis (Figure 3A and B). The absence of acute IL-17A production and presence of IFN-γ in these IL-23R+ T cells was confirmed by intracellular cytokine staining suggesting that these cells were neither Th17 nor ex-Th17 cells (Figures 3C–3F). We found that IL-23R was expressed on IFN-γ producing cells in the colon that did not ever express IL-17 as measured by lack of TdTomato expression (Figures 3E and 3F). Our results establish that IL-23R+, IFN-γ producing T cells arise in vivo during colitis that naturally express IL23R+ and do not transdifferentiate from Th17 cells.
Figure 3. Fate mapping identifies the development of IL-23R+ Th1-like cells in the naïve T cell adoptive transfer colitis model.

Sorted CD4+CD25-CD45RBhi naïve T cells from fate mapping mice (Il23 eGFP/wt; Il17aCre/+; Rosa26TdTomato) were injected peritoneally into Rag1−/− recipients to induce colitis. (A) Flow cytometry analysis of colonic mucosa-infiltrating T cells. (B) Quantification of the frequency of IL-23ReGFP+Rosa26TdTomato- cells in spleen, mesenteric lymph nodes (mLN), small intestine (SI) and colon. (C-D) Expression of IL-17A and IFN-γ in IL-23ReGFP+ cells extracted from the indicated tissues. (D) represents the same data for the colonic mucosa as shown in (C). (E-F) Expression of IL-17A and IFN-γ in IL-23ReGFP+Rosa26TdTomato- cells extracted from the indicated tissues. (F) represents the same data for the colonic mucosa as shown in (E). Mean ± s.e.m. are shown. Unpaired two-tailed t-test. Data points shown in panels (B-F) represent individual animals. p < 0.05*, p < 0.01**, p < 0.001***. See also Figure S3.
IL-23R deficiency protects from Th1-like cell adoptive transfer colitis
To test the contribution of IL-23R to the pathogenicity of Th1-like cells in vivo, we in vitro differentiated IL-23R-competent (Il23reGFP/wt) and IL-23R-deficient (Il23reGFP/eGFP) T cells with IL-12 + IL-21 + IL-23 (see methods for details) and then adoptively transferred them to Rag1−/− recipients (Figure 4A). Th1-like cells that lacked IL-23R did not efficiently induce severe colitis, as determined by the histopathological exam of the colon (Figure 4B). Our results therefore establish an important function of IL-23R in the pathogenicity of Th1-like cells and their ability to induce colitis.
Figure 4. scRNAseq of tissue-infiltrating Th1-like cells in a pre-clinical model of adoptive transfer colitis.

(A) Schematic of adoptive transfer colitis by in vitro differentiated Th1-like cells followed by histopathology and scRNAseq. Viable CD45+CD4+ T lymphocytes from Rag1−/− recipients of either competent cells (Il23rwt/eGFP) or deficient cells (Il23reGFP/eGFP), respectively, were isolated from the intestinal mucosa through FACS. (B) Representative histopathological H&E stainings and clinical score are shown. Data points represent individual animals. Unpaired t-test. Mean ± s.e.m. are shown. p < 0.05* (C) UMAP of 30,260 single cells sequenced from spleen, colonic and small intestinal (SI) lamina propria (LPL) and colonic epithelium (IEL = intraepithelial lymphocytes). (D) Heatmap of differentially expressed genes among the tissues analyzed with selected genes highlighted as dot plots. (E) Identification of competent (teal) and deficient cells (magenta), respectively. (F) Selected genes are shown that are expressed in an IL-23R dependent manner (red: up-regulated in IL-23R-competent cells, blue: up-regulated in deficient cells). See also Figure S4.
To test whether the transferred Th1-like cells produced IFN-γ or transdifferentiated into IL-17A-producing Th17 cells, we isolated colonic intraepithelial lymphocytes (IEL) as well as lamina propria lymphocytes (LPL) and analyzed the cells for the production of IFN-γ, IL-17A and GM-CSF. Animals that received IL-23R-competent (Il23reGFP/wt) Th1-like cells had an increased frequency of CD4+ IEL and LPL, up to 60–70% of the entire CD45+ population, pointing to the ongoing inflammatory process (Figures S4A, S4D and S4F). We found that the CD4+ T cells had largely maintained their production of IFN-γ and lacked IL-17A production (Figures S4B, S4E and S4G). Furthermore, a sizable frequency of IFN-γ-producing cells in the colon also produced GM-CSF (Figure S4C). GM-CSF plays an important role in the pathogenicity of effector T cells in CNS inflammation and possibly in intestinal inflammation as well (Komuczki et al., 2019; Rasouli et al., 2020). It is known that both in the EAE model and the colitis model used here, Th17 cells show extensive plasticity and become IL-17A+/IFN-γ+ double positive (Harbour et al., 2015; Hirota et al., 2011). Our results suggest that at least in our settings, Th1-like cells retained a Th1-like cell phenotype. Taken together, these data suggest that colitogenic Th1-like cells require IL-23R expression in order to induce disease in vivo. Therefore, pathogenicity mediated by IL-23R signaling is not limited to Th17 cells in vivo.
To further understand potential mechanisms, we tracked the location of adoptively transferred T cells within the recipient animals. To this end, we isolated T cells from the spleen, mesenteric lymph nodes and intestinal mucosa. We observed that in recipients of deficient cells, the cells predominantly accumulated in the spleen which is consistent with prior studies describing that IL-23R contributes to pathogenicity in Th17 cells through trafficking and/or survival in the target tissue (Figure S4H) (McGeachy et al., 2009). Ex vivo, we found that IL-23R deficiency led to a significant decrease in GM-CSF+/IFN-γ+ CD4+ T cells both in mesenteric lymph nodes as well as in the colonic mucosa (Figure S4I).
scRNAseq reveals transcriptional signatures of colitogenic intestinal lymphocytes and their dependence on IL-23R signaling
To understand the transcriptional programs that may be driven by IL-23R in transferred Th1-like cells, we isolated CD45+CD4+ infiltrating T cells from the intestinal mucosa (both IEL and LPL) from animals that received either competent or IL-23R-deficient cells and performed scRNAseq of 32,763 cells (Figure 4A). Of note, even though very few cells infiltrate the intestine in recipients of deficient cells (Il23reGFP/eGFP), scRNAseq allowed us to profile and compare them to the competent Th1-like cells (Il23reGFP/wt) that were capable to infiltrate the colon in large numbers.
The cells primarily clustered depending on which tissue they were isolated from, with splenic CD4+ T cells segregating from cells of intestinal origin (Figure 4C). These results confirmed previous findings that T cells exhibit tissue-specific signatures (DiSpirito et al., 2018; Schnell et al., 2021). We found the expression of 1,224 genes was strongly associated with the tissue of origin (FDR < 0.1, |logFC| > 0.5), whereas other genes showed a broader expression in cells of all tissue origins (Figure 4D and Table S3). For instance, CD69 has been proposed as a marker of tissue residency in T cells including in TRM (tissue resident memory) cells and the precise tissue specific expression of Rgs1 suggests that it could be involved in trafficking and tissue residency as well, in particular in the intestinal mucosa (Gibbons et al., 2011; Masopust and Soerens, 2019). The chemokine Cxcl10 was particularly highly expressed in T cells within the LPL but not IEL (Figure 4D), suggesting a specific autocrine/paracrine regulation, in particular since the contribution of Cxcl10 to the trafficking and retention of pro-inflammatory Th1 cells expressing the corresponding receptor Cxcr3 has been previously identified (Bonecchi et al., 1998; Singh et al., 2003). Overall, multiple chemokine-related transcripts were expressed in a compartment-specific fashion and therefore likely contribute to the trafficking of Th1-like cells to the intestine (Figure 4D).
In the spleen, it appeared that the competent Th1-like cells (Il23reGFP/wt) and the deficient cells (Il23reGFP/eGFP) isolated from recipient mice had similar phenotypes (Figure 4E). In contrast, in the intestinal tissues the competent and deficient cells appeared to be more distinct, suggesting that depending on genotype the Th1-like cells may attain transcriptionally different expression profiles when infiltrating the intestine (Figure 4E). We then performed differential gene expression analysis between competent and deficient cells across the four tissues (spleen, LPL small intestine (SI), LPL colon and IEL colon) and identified between 84 and 190 genes per tissue (FDR < .1 and |logFC| > 0.5) (Table S3). We identified genes such as Gpr18, Cd160 and Zfp36l2 being differentially expressed in all or most tissues in vivo (Figure 4F). The chemokine CCL5, a ligand of CCR5, exhibited a clear IL-23R-dependent expression within the intestine only (Figure 4F). Taken together, our observations support the notion that IL-23R signaling affects the tissue-specific transcriptional expression of genes relevant to intestinal inflammation.
IL-23R drives the expansion of highly inflammatory and colitogenic Th1-like cells in the lamina propria as uncovered by scRNAseq
Lymphocytes residing within the lamina propria exert a critical contribution to elicit intestinal inflammation (Khor et al., 2011). Therefore, we focused on the cells from the colon and small intestine and partitioned the cells into clusters, identifying a total of 12 distinct clusters with characteristic transcriptional profiles within the LPL (Figure 5A and B). We confirmed by investigation of marker genes that the cells were CD45+CD3+CD4+ T cells and lacked markers of CD8 T cells or NK cells (Figure S5A). We then sought to identify clusters consisting of cells with a highly pro-inflammatory and colitogenic gene signature. Importantly, we noted differential contribution of competent or deficient cells to some clusters, especially clusters 2, 8, 9 and 10 were dominated by competent cells (Il23r eGFP/wt) whereas clusters 5 and 7 were dominated by deficient cells (Il23reGPF/eGFP) (Figure 5C). Based on their transcriptional profiles, we found that clusters 2 and 9 consisted of cells that exhibited a highly colitogenic gene signature and may have the ability to drive intestinal inflammation (Figure 5D).
Figure 5. IL-23R drives the expansion of highly inflammatory and colitogenic T cells in the lamina propria as identified by scRNAseq.

(A) UMAP of T cells isolated from the lamina propria of small intestine and colon. Competent (teal) and deficient cells (magenta) are highlighted. (B) Cluster analysis identified 12 clusters with distinct transcriptional signatures. (C) The size of each cluster is shown as a percentage of the total number of cells. For each cluster, its relative abundance among competent vs. deficient cells is visualized. (D) The top 20 differentially expressed genes of two clusters with highly inflammatory and colitogenic signatures are shown (clusters 2 and 9) which were dominated by wildtype cells. Cluster 7 consisted in the majority of knockout cells and exhibited a signature reminiscent of Tr1-like cells. (E) Expression of 597 genes found within IBD GWAS risk loci was investigated in clusters 2, 7 and 9 comparing IL-23R competent and deficient cells. Positive values indicate higher expression in competent cells (Il23reGFP/wt). Asterisks indicate statistically significant differences (FDR<0.1). See also Figures S5 and S6.
We found that the genes expressed in cluster 9 (one vs. all comparison, FDR < 0.1, |logFC| > 0.5 and Table S4) encoded a wide range of molecules essential for inflammation and colitis. For example, among the most highly expressed genes was Cd103/Itgae which has been shown to enable pathogenic T cells to migrate to their target tissue and is characteristic of pro-inflammatory colonic T cells in ulcerative colitis (Annacker et al., 2005; Lamb et al., 2017). Another highly expressed gene, Ccr9, encodes a gut homing receptor and has been shown to play a crucial role in colitis (Johansson-Lindbom and Agace, 2007). Previously, it was shown that the transmembrane glycoprotein CD38 and CD48, a SLAM (signaling lymphocyte activation molecule) family member are important for intestinal inflammation (Abadia-Molina et al., 2006; Schneider et al., 2015). An ORF (open reading frame) within the gene AW112010 (encoding a long-noncoding RNA), which was among the top 20 differentially regulated genes within cluster 9, has been recently shown to be essential in mucosal immunity including colitis (Jackson et al., 2018).
The expression of this ORF is fairly broad across clusters. However, the expression of AW112010 showed an increase in expression within inflammatory cluster 9 (Figure 5D). In addition, cluster 9 also contained genes not previously associated with the development of colitis such as Cd160, the most upregulated gene in cluster 9. Cd226 (Dnam-1) was also part of the signature of highly expressed genes in cluster 9. Previously, CD226 was shown to be crucial for the activation of cytotoxic lymphocytes and Th1 cells (Dardalhon et al., 2005; Gilfillan et al., 2008; Zhang and Vignali, 2016). In summary, the transcriptional analysis of cluster 9 exhibited an entire array of genes critical for intestinal inflammation and identified potential genes important for intestinal inflammation such as Cd160.
Many genes highly expressed in cluster 2 are implicated in IFN-γ signaling (Figure 5D and Table S4). In fact, IFN-γ signaling has been identified as being critical for intestinal inflammation in various pre-clinical models of colitis (Ito et al., 2006; Singh et al., 2003). For example, top differentially genes in this cluster were Ifitm1 (interferon-inducible transmembrane protein), Ifitm2 and Ifitm3. A study in human IBD patients identified IFITM1 as a potential prognostic marker in ulcerative colitis (Roman et al., 2013). We identified many integrins as being part of the list of genes highly expressed within cluster 2, with Itgb1 as the second highest differentially expressed gene. Two additional integrins highly upregulated in cluster 2 were Itga4 (position 101) and Itgb7 (position 32). A recent study demonstrated that targeting the leukocyte integrin α4β7 with vedolizumab was more effective in moderately to severely active ulcerative colitis than adalimumab (a humanized monoclonal antibody neutralizing TNF) (Sands et al., 2019a).
The other two clusters that were enriched in competent cells (Il23reGFP/wt) were clusters 8 and 10. Cluster 8 represented a cluster of highly proliferating cells (Mailand and Diffley, 2005; Yu, 2007) (Figure S5B) which suggested these cells were contributing to the inflammatory process in the tissue.
Cluster 10 on the other hand showed high expression of Ccr7 which is commonly correlated with an ability of T cell trafficking and homing to lymph nodes and Peyer’s patches (Forster et al., 2008). In addition, cluster 10 cells expressed higher expression of the anti-apoptotic gene Bcl2 which is known to be driven by STAT5 signaling and may be of value as a therapeutic target in IBD (Weder et al., 2018).
In summary, using single-cell RNA-sequencing, we identified distinct clusters of T cells within the intestinal mucosa that exhibited a highly inflammatory profile, in particular clusters 2 and 9. Furthermore, the observation that these clusters were dominated by competent cells suggests that IL-23R signaling critically contributed to the observed expression of inflammatory genes. Importantly, we succeeded in identifying genes such as Cd160 that may play an important role in intestinal inflammation and IBD.
IL-23R is implicated in the reciprocal regulation of Tr1-like cells and limits their expansion
Cluster 7 caught our particular attention as it was strongly enriched with IL-23R-deficient cells which would suggest that this cluster contained predominantly non-pathogenic T cells (Figure 5C). The 117 genes that characterized this cluster (one vs. all comparison, FDR < 0.1, logFC > 0.5) included Eomes, Cd27, Gzmk, Lag3 and Il10 (Figures 5D, S6A and S6B). This finding was of particular significance as these genes have been recently identified to define a human IFN-γ+IL-10+ Tr1-like cell type that may be reduced in IBD patients (Gruarin et al., 2019). In fact, Eomesodermin (EOMES) has been shown to be a key transcription factor of a Tr1-like lineage (Zhang et al., 2020; Zhang et al., 2017). Our finding that this cluster 7 was predominantly composed of IL-23R-deficient cells suggests that IL-23R may function as an important gatekeeper and negative regulator for the development of Tr1-like cells in the colonic mucosa. Previously, it was shown that IL-23R is indeed expressed on these IFN-γ+IL-10+ Tr1-like cells suggesting that IL-23 signaling could potentially regulate development and function of this population (Alfen et al., 2018). Our study provides functional evidence that IL-23R may act as a negative regulator of Tr1-like cells. In addition, PD1 (Pdcd1) was shown to be expressed on human Tr1-like cells which is highly consistent with our data (Alfen et al., 2018) (Figure 5D). In fact, it was shown that PD1 is implicated in the conversion of human T-BET+ Th1 cells to FOXP3+ Tregs (Amarnath et al., 2011). Other co-inhibitory molecules such as Lag3 were also more highly expressed in cluster 7 (Figures 5D and S6B). We used a published transcriptional signature that characterizes human Tr1-like cells and were able to show that it identified cluster 7 (upregulated compared to other clusters, Wilcoxon rank-sum test p < 10−200) providing strong evidence that the cells of cluster 7 were the equivalent of these human cells in our study (Figure S6C) (Gruarin et al., 2019).
In summary, our results suggest that IL-23R signaling balances the differentiation of colitogenic Th1-like vs. Tr1 cells and therefore effector vs. regulatory arms of the immune response.
Comparative analysis of human IBD GWAS with our scRNAseq study nominates genes for the function of colitogenic Th1-like cells in an IL-23R dependent manner
It has become clear from GWAS that IL-23R plays an important role in IBD (Duerr et al., 2006). To investigate if IL-23R signaling is particularly relevant to the expression of other genes found within human IBD GWAS loci in T cells, we conducted a survey of the roughly 240 IBD risk loci that have been previously identified (de Lange et al., 2017; Huang et al., 2017; Jostins et al., 2012; Liu et al., 2015) and tallied their associated genes (about 700 genes in total) (de Lange et al., 2017). Within loci that contain multiple genes, we focused on genes that were found to be implicated, for example, by fine-mapping or by expressed quantitative trait loci (eQTL) analysis which reduced the list of genes that we further investigated to 597. Since we established that clusters 2 and 9 were dominated by competent cells with a highly inflammatory transcriptional signature, we focused the analysis on these two clusters in addition to cluster 7 which was dominated by deficient cells. We used within-cluster comparison of competent vs. deficient cells and identified genes found within IBD GWAS loci that were expressed in an IL-23R-dependent manner (Figure 5E and Table S4). This finding suggests that IL-23R signaling in Th1-like cells may be relevant to induction of genes implicated through GWAS in the development of IBD.
Among these genes were Gpr18, Traf3ip2, Ncf4 and Ets1. Gpr18 was particularly highly expressed in clusters 2 and 9 in an IL-23R-dependent manner. Recently, it was shown that certain mutations are increased in ulcerative colitis including in the gene Traf3ip2 (encoding ACT1) which is part of the NFKBIZ pathway (Kakiuchi et al., 2020). Ncf4 plays an important role in cellular reactive oxygen species (ROS) pathways as part of the NOX2 (NADPH oxidase 2) complex. ETS1 is a transcription factor and essential co-factor of T-bet in Th1 cell-mediated inflammatory responses (Grenningloh et al., 2005).
Notably, some genes were not limited to clusters 2 and 9 in their IL-23R-dependent expression such as Zfp36l2 (Figure 5E) (Wells et al., 2017).
Our findings illuminate genes implicated in trafficking, cellular adhesion , metabolism and immune cell interaction identified in GWAS IBD risk loci that may prove critical in their contribution to intestinal inflammation driven by IL-23R in colitogenic Th1-like cells. This suggests that IL-23R and these genes may converge mechanistically in a disease-relevant manner.
Ranking identifies genes as drivers of intestinal inflammation in an IL-23R dependent manner
To rank the genes that may have an impact on the development of colitis, we combined our in vitro and in vivo scRNAseq data sets with data from human IBD GWAS.
We postulated the following criteria: (1) As we were particularly interested in genes potentially conferring pathogenicity, we focused on genes that were most highly expressed in clusters 2 and 9 in comparison to all other clusters and that were differentially expressed between competent and deficient cells within either cluster 2 or 9; (2) Genes of particular importance to intestinal inflammation may exhibit a highly tissue specific expression and therefore we evaluated their expression comparing splenic and intestinal samples; (3) We asked which genes showed an IL-23R-dependent expression in Th1-like cells differentiated in vitro; (4) We incorporated whether a given gene was previously identified in human IBD GWAS (Figure 6A and Table S5) (see methods for details).
Figure 6. Ranking and validation identify drivers of T cell-mediated intestinal inflammation in an IL-23R-dependent manner.

(A) Ranking of potential drivers of intestinal inflammation based on several critical considerations (see text and methods for details). (B) Deficiency for CD160 in Th1-like cells adoptively transferred into male Rag1-/- recipients protects from colitis. Representative H&E histopathological stainings are shown. (C) Intestinal inflammation and colitis score (0 (healthy) – 4 (most severe colitis)) pooled from three independent experiments are shown for small intestine and proximal colon (n=13 animals for both genotypes). (D) Colon length in Rag1−/− recipients of either wildtype or Cd160−/− cells. Pooled data are shown from two independent experiments (n=8). (E) Gzmb protein expression was measured by flow cytometry in both Cd160+/+ and Cd160−/− Th1-like cells prior to adoptive transfer (n=4). Mean ± s.e.m. are shown in panels (C-E). Unpaired t-test. Data points represent individual animals (C-E). See also Figure S7.
Gpr18 scored very highly in all criteria including being located within a GWAS risk locus (Jostins et al., 2012). Previously, it was shown that GPR18 plays a crucial role for CD8aa+ intraepithelial T lymphocytes within the intestinal mucosa (Wang et al., 2014). Our studies suggest it may be a critical mediator of pathogenicity by IL-23R in colitogenic Th1-like cells.
The transcription factor NF-κB is critical for T cell function and in particular mutations within the NFKBIZ pathway were recently found to be relevant in ulcerative colitis (Kakiuchi et al., 2020). Nfkbiz itself scored highly in our ranking data as a target in colitogenic T cells (Figure 6A).
CD160 plays an important role in colitogenic Th1-like cells
Finally, we sought to determine the contribution of candidate genes identified in our studies to T cell-driven intestinal inflammation. To this end, we acquired mice deficient for Cd160, the top differentially expressed signature gene of inflammatory cluster 9 and which ranked prominently in our ranking (Figure 6A) (Tan et al., 2018). CD160 is an Ig superfamily member and its function in inducing colitogenic T cells and IBD has not been investigated (Anumanthan et al., 1998). It has been shown to be important for IFN-γ production in NK cells and being expressed on intraepithelial CD8+ T cells (Tan et al., 2018; Tu et al., 2015). We differentiated naïve T cells from Cd160−/− mice to Th1-like cells in vitro as described above and tested their ability to elicit adoptive transfer colitis. We did not observe a difference between wildtype and Cd160−/− Th1-like cells in the production of IFN-γ or GM-CSF prior to adoptive transfer in vitro (Figures S7A and S7B). The recipient animals that received CD160-deficient Th1-like cells showed a strong protection from colonic inflammation as assessed by histopathological examination (Figure 6B). The decrease of inflammation showed a clear trend in the small intestine and was statistically significant in the colon (Figures 6B and 6C). The histopathological analysis was consistent with the shortening of the colon in recipients of wildtype cells (Figure 6D). Previously, it was shown that CD160 is important for Gzmb expression in intestinal CD8+ T cells which helps to clear Listeria monocytogenes infection (Tan et al., 2018). Furthermore, we found Cd160−/− cells differentiated in vitro with IL-12 + IL+21 + IL23 to produce less Gzmb compared to wildtype cells which could contribute mechanistically to their diminished colitogenicity in vivo (Figure 6E).
To further understand how CD160 may contribute to the pathogenicity of Th1-like cells in vivo, we isolated T cells from the colonic mucosa of recipients of wildtype and Cd160−/−cells and performed population RNAseq (Figure 7). We observed a substantial change in the transcriptional profile in Cd160−/− cells with 216 genes differentially expressed (Figure 7A). GSEA (gene set enrichment analysis) indicated that various biological processes were affected which clearly pointed to an altered phenotype in Cd160−/− cells that may contribute to reduced pathogenicity (Figure 7B). We observed a fraction of CD4+CD62L+ T cells that appeared to be increased in the intestinal mucosa of recipients of Cd160−/− cells (Figure 7C). Consistently, we found a significant increase in the expression of CD62L (Sell) at both RNA and protein level (Figures 7C and 7D) suggesting that loss of CD160 may to some extent contribute to maintaining a naïve-like phenotype preventing the differentiation into an effector phenotype.
Figure 7. Population RNAseq of intestinal lymphocytes from recipients of Cd160−/− or wildtype cells.

(A) Comparison of Cd160−/− T cells with matched controls resulted in the detection of 216 differentially expressed genes. (B) Results from gene set enrichment analysis (GSEA) performed on the comparison from panel (A). Notable and significant (adjusted p-value < .05) results shown from tests on pathways from MSigDB, WikiPathways, and Gene Ontology (GO) Consortium. (C) Protein expression of CD62L (left: frequency, right: MFI) on colonic CD4+ T cells. (D) Gene expression of CD62L (encoded by Sell) in colonic CD4+ T cells. (E) Heatmap depicting 216 differentially expressed genes in Cd160−/− vs. wildtype colonic CD4+ T cells. Genes of particular interest are indicated. Columns represent individual animals. (F) Signature scores computed using the genes distinguishing LPL cluster 9 from other clusters (as in Figure 5) and evaluated on population RNAseq samples separate the Cd160−/− samples from control samples (p = 0.092, adjusted for additional comparisons involving the LPL-2 and LPL-7 cluster signatures). (G) A signature created from the Cd160−/− vs. wildtype comparison was used to score lamina propria lymphocytes from the single-cell results (Figure 5). LPL-9 cluster exhibited a lower score than in the remainder of cell clusters (p < .001, t test). In panels (C-D) mean ± s.e.m are shown and data points represent individual animals. t-test was used. Statistical analysis for panels (F-G), see methods. See also Figure S7.
Furthermore, we identified genes that were upregulated in Cd160−/− cells that may contribute directly to their decreased pathogenicity (Figure 7E). For example, immunometabolism plays a critical role in the pathogenicity of T cells (Geltink et al., 2018; Wagner et al., 2021). We found that one of the most highly upregulated genes in Cd160−/− T cells encoded IRG1/aconitate decarboxylase (Acod1) which catalyzes the production of itaconate from aconitate. Previously, it was found that itaconate is an anti-inflammatory metabolite (Mills et al., 2018).
Moreover, we found that the chemokine encoding gene Ccl1 was highly upregulated in Cd160−/− T cells. Indeed, it has been demonstrated before that CCL1 via CCR8 signaling can protect against experimental colitis through action on ILCs and our data identifies Cd160−/− T cells as a potential source of CCL1 (Kang et al., 2020).
In addition, the gene Il10ra was also upregulated in Cd160−/− Th1-like cells, potentially making these cells more responsive to IL-10 regulation, which is a key cytokine that has been shown to regulate colitis and intestinal inflammation.
We next considered how the pro-inflammatory signatures identified in lamina propria (Figure 5D) would relate to the transcriptional profile of Cd160−/− cells. This analysis showed that lack of CD160 resulted in decreased expression of LPL-9 markers, however these results did not reach statistical significance, presumably due to the small number of samples (p < .092, Figure 7F, Figure S7C). To address this issue further, we created a transcriptional signature from our population RNAseq data (i.e., genes differentially expressed in Cd160−/− vs. wildtype) and projected this signature onto our single-cell analysis. To this end, for every cluster identified in Figure 5, we report the difference between the average normalized log expression of genes that are up-regulated in Cd160−/− and those that are up-regulated in the WT condition (Figure 7G, Figure S7D). With this alternate analysis (due to higher number of data points), we found that cells in the proinflammatory LPL-9 cluster expressed the Cd160−/− signatures at lower levels (comparing to all other clusters) in a manner consistent with our first analysis (p < .001, t test). These results demonstrate that the genes expressed in the proinflammatory LPL-9 cluster are in some way dependent on CD160 expression, consistent with our finding of CD160 as a marker that is specific to cluster 9 (Figure 5D).
Taken together, our results demonstrate an important function of CD160 in the colitogenicity of Th1-like cells in an IL-23R dependent manner and we identify through RNAseq analysis that loss of CD160 limits the generation of colitogenic effector T cells.
Discussion
IL-23R function has been considered a critical driver of pathogenicity in Th17 cells and important for the regulation of FoxP3+ Tregs but not for other T helper cell subsets. We provide compelling evidence that IL-23R plays an important role in inducing colitogenic phenotype in a subset of Th1-like cells.
We report that Th1-like cells can be differentiated in vitro with IL-12 + IL-21 to induce IL-23R expression. This illustrates how the combinatorial action of cytokines crucially determines the functional outcome since IL-21 has been shown to participate with TGF-β to induce pro-inflammatory Th17 cells, not Th1 or Th1-like cells (Korn et al., 2007; Nurieva et al., 2007). Which transcription factor mediates the induction of IL-23R in Th1like cells differentiated with IL-12 + IL-21 remains to be determined. However, one such transcription factor could be c-MAF that has been shown to bind to the IL-23R promoter in Th17 cells and to work in conjunction with IL-21 also in some non-Th17 cells, in particular in the setting of autoimmune diabetes which is known to be Th1 cell-driven (Hsu et al., 2018; Iwamoto et al., 2014; Sato et al., 2011).
We continue to show that IL-23R is required in Th1-like cells in vivo to acquire full pathogenicity to elicit adoptive transfer colitis. By performing scRNAseq, we identify candidate genes for T cell-mediated IL-23R-dependent pathology. Furthermore, our study contributes to the important effort of assigning genes found within GWAS IBD risk loci to a particular cell type such as colitogenic Th1-like cells.
Previously, it has been shown that Th17 cells exhibit the ability to acquire features of Th1 cells by upregulating Tbx21 and expressing IFN-γ both in mouse and human (Acosta-Rodriguez et al., 2007; Becattini et al., 2015; Hirota et al., 2011). IL-23R was shown to play an important role in this lineage plasticity (Hirota et al., 2011) and it was assumed that IL-23R bearing T helper cells that express IFN-γ are solely transdifferentiated Th17 cells. Previously, it was shown in the adoptive transfer model of colitis that Th17 cells convert to Th1 cells and that this appears to be essential to Th17 cell-mediated disease in this model (Harbour et al., 2015). Importantly, we show the expression of IL-23R on Th1-like cells in a Th17 cell lineage-independent manner both in vitro and the naïve CD45RBhi T cell adoptive transfer using fate mapping approaches. Of note, fate-mapping approaches have been instrumental in expanding our understanding of developmental trajectories and plasticity of T helper cells during inflammation and resolution, in particular of Th17 cells (Gagliani et al., 2015; Hirota et al., 2011). However, certain challenges have been identified and need to be considered when interpreting experimental results. In particular, the efficiency of Cre recombinase-mediated labeling of cytokine-expressing immune cells does vary and leaves the possibility open that some cytokine positive cells remain unlabeled (Croxford and Buch, 2011). Therefore, measuring cytokine production through an additional methodology such as intracellular cytokine staining (ICC) can increase confidence in the fidelity of the fate mapping approach which we did. Our results show that the TdTomato-labeling approach (driven by IL-17ACre) accurately captured current Th17 cells including in the small intestine and in the colon as the extent of TdTomato+IL-23R+ cells (which we assume were current pathogenic Th17 cells) and the percentage of IL-17A producing cells identified by ICC were quite similar showing that IL17A expressing cells were accurately labeled by the fate reporter. In addition, gating on IL-17A+IFN-γ- cells differentiated from naïve T cells in vitro through culture with TGF-β + IL-6 established that the majority of these cells were efficiently labeled through IL-17ACre providing further support for our approach and interpretation.
After Th1-like cell adoptive transfer, only cluster 3 in the LPL contained cells showing a transcriptional signature of Th17 cells. However, we did not identify IL-17A+ cells by intracellular cytokine staining when retrieved from the intestinal mucosa in Rag1−/− recipients. Most LPL cells showed a strong transcriptional signature of Th1-like cells (Il12rb1, Il12rb2, Stat1, Stat4, Tbx21 and Ifng) with the lack of RORγt or IL-17A expression.
An important question is the exact relationship of Th1 cells differentiated with IL-12 and IL-23R+ Th1-like cells differentiated with IL-12 + IL-21. These cells are clearly different in that they express IL-23R but otherwise globally express genes that are present in Th1 cells induced with IL-12. What drives the emergence of these cells in vivo is likely dependent on the presence of IL-21 as we were able to show that IL-23R+ Th1-like cells highly express IL-21R.
Importantly, we describe here a dichotomous function of IL-23R in promoting inflammatory cells on one hand and on the other hand limiting the expansion of Tr1 cells with a regulatory function. A concept is evolving in which IL-23R does not only serve as a critical driver of inflammatory T cells but as a central integrator of immune responses within the local immunological milieu. In fact, in addition to the emergence of Tr1-like cells in IL-23R-deficient cells in our study, it has been shown previously that IL-23R is also expressed on colonic FoxP3+ Tregs, making these cells receptive to sudden inflammatory changes that limit their suppressive effector functions in the presence of the pro-inflammatory cytokine IL-23 (Izcue et al., 2008; Schiering et al., 2014).
We succeeded in validating one of the candidates driving T cell pathogenicity, CD160. In a previous study profiling the cellular composition and transcriptional signatures of ileal biopsies from Crohn’s patients, CD160 emerged, although the functional significance remained unclear (Uniken Venema et al., 2019). In addition to our data suggesting a role of CD160 in colitogenic CD4+ T cells, CD160 is important for intraepithelial type I ILCs which are amplified in Crohn’s disease and their pathogenicity in the anti-CD40 colitis model and for the ability of CD8+ T cells to control L. monocytogenes infection. (Fuchs et al., 2013; Tan et al., 2018).
Another important candidate that scored highly in all categories in the ranking (Figure 6A) was Gpr18. Indeed, Gpr18 was identified as a central part of a transcriptional signature in myeloid cells driving a Th1 cell intestinal inflammation triggered by the colonization of germ-free mice with Klebsiella isolated from a Crohn’s patient (Atarashi et al., 2017).
In summary, we uncouple IL-23R as a purely Th17 cell-specific pathogenicity factor and implicate it in evoking a pathogenic phenotype in Th1-like cells. Furthermore, we identify potential drivers of IL-23R-mediated T cell pathogenicity and validate one of these candidates, CD160. Our findings provide a reason to revisit the pathogenic function of IL-23R in autoimmune diseases in which Th1, Th1-like or other T cell subsets are believed to be the main drivers of the disease.
Limitations of the study
An important question is how IL-23R has cell-intrinsic effects directly on IL-23R dependent T cells but also how inflammation instigated by these IL-23R-dependent T cells may affect T cells in a cell-extrinsic manner that do not normally express IL-23R. This question was addressed previously by Powrie and colleagues through co-transfer experiments adoptively transferring both wildtype and IL-23R-deficient CD45RBhi naïve T cells into the same host (Ahern et al., 2010). It was found that after co-transfer, even IL-23R-deficient T cells could accumulate in the colon suggesting that the inflammatory state elicited by the wildtype IL-23R-expressing cells could cell-extrinsically override IL-23R dependency. The exact mechanism how these secondary cell-extrinsic effects are mediated has not been elucidated. Therefore, a co-transfer of competent cells with IL-23R-deficient Th1-like cells in our model could directly address the question if an inflammation instigated by IL-23R+ Th1-like cells could also allow IL-23R-deficient Th1-like cells to accumulate in the intestine and become pathogenic independent of IL-23R expression. This experiment could help to further identify direct IL-23R-dependent and independent effects on pathogenicity of effector T cells critical to inducing tissue inflammation in vivo.
STAR Methods
RESOURCE AVAILABILITY
Lead contact
Further information and requests for resources and reagents should be directed to and will be fulfilled by the lead contact, Vijay Kuchroo (vkuchroo@rics.bwh.harvard.edu).
Materials availability
This study did not generate new unique reagents. All mouse lines are available either from the Jackson Laboratory or other sources which are listed in the key resources table. Their acquisition may require an MTA (Material transfer agreement).
Key resources table
| REAGENT or RESOURCE | SOURCE | IDENTIFIER |
|---|---|---|
| Antibodies | ||
| anti-CD4 | Biolegend | clone RM4-5 |
| anti-CD25 | Biolegend | clone PC61 |
| anti-CD44 | Biolegend | clone IM7 |
| anti-CD62L | Biolegend | clone Mel14 |
| anti-IL-17A | Biolegend | clone TC11-18H10.1 |
| anti-IFN-γ | Biolegend | clone XMG1.2 |
| anti-GM-CSF | BD | clone MP1-22E9 |
| anti-CD45 | Biolegend | clone 30-F11 |
| anti-gzmb | Biolegend | clone GB11 |
| anti-CD3 | BioXCell | clone 145-2C11 |
| anti-CD28 | BioXCell | clone PV-1 |
| anti-IL-4 | BioXcell | clone 11B11 |
| Bacterial and virus strains | ||
| Biological samples | ||
| Chemicals, peptides, and recombinant proteins | ||
| Recombinant Mouse IL-6 Protein | R&D Systems | Cat# 406-ML |
| Transforming Growth Factor-β1 Human | Miltenyi | Cat# 130-095-067 |
| Transforming Growth Factor-β1 Mouse | Biolegend | Cat# 763102 |
| Recombinant Mouse IL-1 beta | R&D Systems | Cat# 401-ML |
| Recombinant Mouse IL-23 Protein | R&D Systems | Cat# 1887-ML |
| Recombinant Mouse IL-12 Protein | R&D Systems | Cat# 419-ML |
| Recombinant Mouse IL-21 protein | Biolegend | Cat# 574504 |
| Recombinant Mouse IL-7 protein | Biolegend | Cat# 577804 |
| Recombinant IL-27 protein | R&D Systems | Cat# 2799-ml |
| Recombinant IL-2 protein | Miltenyi | Cat# 130-094-055 |
| Critical commercial assays | ||
| Il23r (Taqman) | ThermoFisher Scientific | Assay ID: Mm00519943_m1 |
| Ifng (Taqman) | ThermoFisher Scientific | Assay ID: Mm01168134_m1 |
| Il17a (Taqman) | ThermoFisher Scientific | Assay ID: Mm00439618_m1 |
| Tbx21 (Taqman) | ThermoFisher Scientific | Assay ID: Mm00450960_m1 |
| Stat3 (Taqman) | ThermoFisher Scientific | Assay ID: Mm01219775_m1 |
| Rorc (Taqman) | ThermoFisher Scientific | Assay ID: Mm01261022_m1 |
| Mouse CD4 beads | Miltenyi | Cat# 130-117-043 |
| DTT (dithiothreitol) | Thermo Fischer Scientific | Cat# R0861 |
| Lamina propria isolation kit | Miltenyi | Cat# 130-097-410 |
| C-tubes | Miltenyi | Cat# 130-096-334 |
| Superscript II | Invitrogen/ThermoFisher Scientific | Cat# 18064014 |
| TaqMan™ Fast Advanced Master Mix | Thermo Fisher Scientific | Cat# 4444557 |
| Nextera XT DNA Library Preparation Kit | Illumina | Cat# FC-131-1024 |
| NextSeq 500 High Output v2 Kit (75 cycles) | Illumina | Cat# FC-404-2005 |
| Chromium Single Cell 3’ Reagent Kit (v2 Chemistry) | 10x Genomics | Cat# 120237 |
| NextSeq 500/550 High Output Kit v2.5 (75 Cycles) | Illumina | Cat# 20024906 |
| Percoll | Cytiva | Cat# 17-0891-01 |
| ACK lysis buffer | Lonza | Cat# 10-548E |
| Fixation/Permeabilization Solution Kit | BD Biosciences | Cat# 554714 |
| TCL buffer | QIAGEN | Cat# 1031576 |
| Deposited data | ||
| Population and single-cell RNA sequencing data | This paper | GEO: GSE164520 |
| Code for analysis of population and single-cell RNA sequencing data | This paper | Github: https://github.com/YosefLab/Immunity2022 Zenodo: DOI: 10.5281/zenodo.6549184 |
| Experimental models: Cell lines | ||
| Experimental models: Organisms/strains | ||
| Il23reGFP/wt reporter mice (Awasthi et al., 2009) | in-house | N/A |
| B6.129S7-Rag1tm1Mom/J | JAX | Stock No.: 002216 |
| Cd160−/− mice (Tan et al., 2018) | Arlene Sharpe (HMS) | N/A |
| TbetCre mice | JAX | Stock No.: 024507 |
| B6;129S6-Gt(ROSA)26Sortm9(CAG-tdTomato)Hze/J | JAX | Stock No.: 007905 |
| Il17atm1.1(icre)Stck/J (Il17aCre mice) | JAX | Stock No.: 016879 |
| Oligonucleotides | ||
| Recombinant DNA | ||
| Software and algorithms | ||
| Code for analysis of population and single-cell RNA sequencing data | This paper | Github: https://github.com/YosefLab/Immunity2022 Zenodo: DOI: 10.5281/zenodo.6549184 |
| FlowJo 10 | TreeStar | https://www.flowjo.com/solutions/flowjo |
| GraphPad Prism 7.0, 8.0 and 9.0 | GraphPad Software | https://www.graphpad.com/scientificsoftware/prism/ |
| R v3.5.1 | R core | https://www.r-project.org/ |
| Python v3.6.8 | Python Software Foundation | https://www.python.org/ |
| CellRanger v2.0.2 | 10x Genomics | https://www.10xgenomics.com/ |
| MAST 1.6.1 | Finak et al., 2015 | https://www.bioconductor.org/packages/release/bioc/html/MAST.html |
| edgeR 3.22.3 | (Robinson et al., 2010, McCarthy et al., 2012) | https://bioconductor.org/packages/release/bioc/html/edgeR.html |
| RSEM 1.2.31 | (Li and Dewey, 2011) | https://deweylab.github.io/RSEM/ |
| Trimmomatic 0.32 | Bolger et al., 2014 | https://github.com/usadellab/Trimmomatic |
| Bowtie2 2.2.9 | (Langmead and Salzberg, 2012) | http://bowtie-bio.sourceforge.net/bowtie2/index.shtml |
| scVI | Lopez et al., 2018 | https://github.com/scverse/scvi-tools |
| Scanpy 1.4 | Wolf et al., 2018 | https://github.com/scverse/scanpy |
Data and code availability
Single-cell RNA-seq and population RNA-seq data have been deposited at GEO and are publicly available as of the date of publication. The accession number is listed in the key resources table.
All original code has been deposited at GitHub and Zenodo and is publicly available as of the date of publication. The URL and DOI are listed in the key resources table.
Any additional information required to reanalyze the data reported in this paper is available from the lead contact upon request.
EXPERIMENTAL MODEL DETAILS
Mice
Il23reGFP/wt reporter mice were described previously (Awasthi et al., 2009). Of note, homozygous animals (Il23reGFP/eGFP) represent IL-23R-deficient animals. Animals from the following strain were purchased from the Jackson Laboratory: B6.129S7-Rag1tm1Mom/J (known as Rag1−/−; Stock No.: 002216). For adoptive transfer colitis experiments male Rag1−/− animals between the ages of 7–10 weeks were used as recipients. In general, cells adoptively transferred to Rag1−/− animals, isolated from the various deficient and fate-mapping strains, were sex-matched. Naïve T cells isolated from these strains for in vitro differentiation and adoptive transfer were isolated from animals older than 6 weeks. Figure 2 panels (A) and (B) show data using naïve T cells from female fate-mapping animals that were 13–14 weeks of age.
CD160−/− mice were a kind gift of Dr. Arlene Sharpe and previously described (Tan et al., 2018). T-betCre mice were obtained from The Jackson Laboratory (Stock No: 024507). IL-17ACre mice were described previously (Hirota et al., 2011). For T-betCre and IL-17ACre fate mapping, the Cre transgene reports through a ROSA26-STOP cassette-TdTomato allele. (B6;129S6-Gt(ROSA)26Sortm9(CAG-tdTomato)Hze/J mice are available from the Jackson Laboratory; Stock No.: 007905). All animals were bred and maintained under specific-pathogen-free (SPF) conditions. Genotyping was performed with DNA isolated from tail biopsies. All experiments were approved by the Institutional Animal Care and Use Committee (IACUC) at Harvard Medical School and Brigham and Women’s Hospital and carried out in accordance with their guidelines.
METHOD DETAILS
In vitro T cell differentiation
A single-cell suspension was prepared from spleen and lymph nodes and red blood cells were removed by lysis with ACK buffer (Lonza). CD4+ T cells were enriched using microbeads (Miltenyi Biotec, Cat. #.: 130–117-043). Naïve CD4+ T cells (CD4+CD44lowCD62LhighCD25− ) were isolated by fluorescence-activated cell sorting (FACS) using a custom-built BD FACSAria instrument. Sorted naïve CD4+ T cells were activated with plate-bound anti-CD3 and anti-CD28 antibodies (1μg/ml; BioXCell; Clone 145–2C11 and clone PV-1, respectively) in 96-well flat-bottom plates (50–100×103 cells/per well). Cells were cultured for 5 days (cytokine screen) with the following cytokine concentrations: IL-1β (20ng/ml); IL-6 (25ng/ml); IL-23 (20ng/ml); IL-12 (20ng/ml); IL-21 (20ng/ml); TGF-β (2ng/ml); IL-18 (20ng/ml). A complete list of cytokines used in this study can be found in the key resources table.
Flow cytometry and antibodies
Single-cell suspensions were stained with diluted antibodies in ice-cold PBS + 2% FBS. Dead cells were identified with either 7-AAD (BD Biosciences) or viability dye eFluor 506 (eBioscience). For intracellular cytokine staining (ICC), cells were stimulated for 4 hrs at 37°C with phorbol 12-myristate 13-acetate (PMA, Sigma), ionomycin (Sigma) and monensin (GolgiStop; 1:1000; BD Biosciences). Then, cells were stained for surface markers and viability. Cells were fixed and permeabilized according to the manufacturer’s instructions (BD Cytofix/Cytoperm kit). All flow cytometric data were acquired with either a BD LSRII or Fortessa instrument and analyzed with FlowJo (BD).
All antibodies used in this study are listed in the key resources table.
Adoptive transfer colitis
Naïve T cells were isolated from donor mice by FACS and differentiated for 6 days prior to adoptive transfer with the following paradigm. Naïve CD4+ T cells (in 6 well dishes, 1×10⁶ cells/ml) were cultured for 48hrs on anti-CD3/anti-CD28 coated plates with the cytokines IL-12 (10ng/ml) + IL-21 (20ng/ml). After 48hrs, the cells were passaged onto non-coated plates and IL-2 (20ng/ml) was added to the culture. Cells were passaged if needed 1:2. On day 4, IL-23 (20ng/ml) was added to the culture. During the entire culture, the medium was supplemented with anti-IL-4 antibody (BioXcell; clone 11B11). On day 5, a small sample was taken and used for ICC to determine IFN-γ+ cells and cells to be adoptively transferred were re-stimulated by passage onto anti-CD3/anti-CD28-coated plates for at least 24hrs. After 6 days, cells were harvested, washed in ice-cold PBS and viability was assessed with Typan Blue staining. Cells to be injected were normalized based on IFN-γ expression determined by ICC and 400000 viable IFN-γ+ cells were injected intraperitoneally per animal. As recipients, sex-matched Rag1−/− animals were used. The weight was measured pre-adoptive transfer and routinely over the course of the experiment.
For histopathology, the colon and small intestine were fixed in 10% formalin and processed by the Harvard Medical School rodent histopathology core for H&E staining. The severity of disease was assessed in a blinded manner by an experienced histopathologist. The following scoring system was used: 0 (healthy) – 4 (most severe disease).
For naïve T cell adoptive transfer colitis, disease was induced by intraperitoneal injection of 4×10⁵ sorted CD4+CD25-CD45RBhigh naïve T cells from respective donor mice into Rag1−/− recipient mice as previously described (Ahern et al., 2010; Powrie et al., 1994). Disease progression was assessed by measurement of the body weight.
Isolation of intestinal lymphocytes
Intestinal lymphocytes were isolated from Rag1−/− recipients using a lamina propria dissociation kit according to the manufacturer’s instructions (Miltenyi Biotec, Cat. No.: 130–097-410). Briefly, intestines were isolated and flushed with ice-cold buffer. The small intestine and colon were separated, opened longitudinally with scissors, turned inside-out and then cut into small pieces (<1cm). Then, the intraepithelial lymphocytes (IEL) were shaken off with buffer containing 1mM DTT with gentle rotation at 37°C. After the incubation period, the IEL were swiftly filtered (100μm), washed with complete medium and kept on ice. This step was repeated once followed by a washing step to remove DTT. Then, the procedure was continued to isolate the lamina propria lymphocytes (LPL). For digestion of the intestinal mucosa, the samples were gently incubated with a proprietary enzymatic solution in C-tubes (Miltenyi Biotec, Cat. No.: 130–096-334) at 37°C for at least 30 minutes using a rotator. After the enzymatic incubation, the samples were homogenized using a gentleMACS (Miltenyi Biotec) and the program m_intestine_01. For overnight culture, to assess the cytokine profile of intestinal T cells, the cells were further isolated using a Percoll (GE Life Sciences/Cytiva) gradient centrifugation to remove cell debris and fat tissue.
Analysis of ex vivo cytokine production by intestinal lymphocytes
In select cases IEL and LPL were cultured overnight (ON) as indicated in complete medium with IL-7 (20ng/ml, Biolegend) + IL-23 (20ng/ml, R&D). The next day, the cells were stimulated with PMA/ionomycin + GolgiStop for 4hrs as described above. ICC was performed and the cells were stained for IL-17A, IFN-γ and GM-CSF.
Population RNA-sequencing
Samples were collected into ~200ul of lysis buffer (TCL+BME) and stored in 1.5mL Eppendorf tubes. For library construction, samples were thawed briefly at RT and ~20ul of each was transferred to a 96-well plate. The construction of the full-length RNA-seq libraries followed a modified SMART-Seq2 protocol (Picelli et al., 2013). After first strand cDNA synthesis and amplification, the cDNA was purified with a 0.7x single sided SPRI. The cDNA quantification of samples was done via a Qubit hsDNA assay (Thermo Fisher) and fragment size distribution was assessed with a BioAnalyzer HS dsDNA assay (Agilent). Each sample was normalized to 0.20ng/ul and then tagmented and indexed using the Nextera XT DNA library prep kit (Illumina). The individually barcoded libraries were then pooled and a final quality control was done on the BioAnalyzer (Agilent). The pool was normalized to 4nM, denatured using 0.2 N NaOh and 0.2 M Tris-HCL and diluted in HCL to prepare for sequencing. 1300ul of the final diluted pooled library was loaded for sequencing on a NextSeq 500/550. Paired end sequencing was performed using an Illumina 75 cycle Nextseq 500 high output V2 kit in accordance with Illumina protocol (Reads 38 cycles x2, Index 8 cycles x2).
RNA-seq Data Analysis
Sequencing reads were initially filtered with Trimmomatic 0.32 (Bolger et al., 2014) to remove low quality ends and adapter sequences. Bowtie2 v2.2.9 (Langmead and Salzberg, 2012) was used to align reads to a reference transcriptome derived from the GRCm38 Mus musculus genome (NCBI Refseq). RSEM 1.2.31(Li and Dewey, 2011) was used to compile the transcriptome and estimate transcript abundance following read alignment. Prior to alignment, the GRCm38 reference was augmented to include the modified eGFP+IL23R functional knockout transcript. Differential expression was computed using edgeR (Robinson et al., 2010).
Single-cell RNA-sequencing (scRNAseq)
For full-length scRNAseq, single, viable in vitro differentiated CD4+ T cells were sorted into 96-well plates containing 5 μl TCL Buffer (QIAGEN) with 1% 2-mercaptoethanol, centrifuged and frozen at −80 °C. SMART-Seq2 protocol was carried out mainly as previously described (Singer et al., 2016). For droplet-based 3′ end massively parallel single-cell RNA-sequencing, sorted (FACS) CD45+CD4+ intestinal T cells were encapsulated into droplets, and libraries were prepared using Chromium Single Cell 3′ Reagent Kits v2 according to the manufacturer’s protocol (10x Genomics). Generated libraries were sequenced on a HiSeq X (Illumina).
RNA isolation and quantitative PCR
Total RNA was isolated with the RNeasy kit according to the manufacturer’s instructions (Qiagen). In brief, cells were homogenized with at least 100μl RLT buffer supplemented with 2-mercaptoethanol by gentle pipetting and then an equal amount of 70% ethanol was added, the samples were mixed by inversion and RNA was captured through a centrifugation step with silica-based columns. Purified RNA was reverse-transcribed using Superscript II enzyme and random hexamer primers (Invitrogen). Taqman probes for genes of interest were purchased from Applied Biosystems/Invitrogen. A ViiA7 Real-time PCR system (Applied Biosystems) was used for amplification and data acquisition. All Taqman probes used in this study are listed in the key resources table.
Analysis of in-vitro SmartSeq2 single-cell transcriptional profiles
Alignment and transcript abundance estimation was performed as described above for the population RNA-seq samples. Prior to downstream analysis, cell libraries were excluded if they contained less than 800,000 reads or more than 3 million reads. Additionally, libraries with less than a 40% alignment rate were withheld. Finally, genes detected in less than 5 cell libraries were discarded prior to differential expression.
Initial inspection of the RNA-seq libraries showed that the dominant source of variation between cells could be attributed to differences in cell cycle progression. To reduce the effect of cell cycle on differential expression testing, two cell-cycle ‘scores’ per cell were computed and input as covariates into the differential expression model. To compute these scores, we first subset the expression matrix, retaining only 97 genes identified as G1/S or G2/M enriched genes in a previous study (Kowalczyk et al., 2015). Then, PCA was run on the log(TPM+1) expression values and the first two component scores per cell were extracted.
To identify differentially expressed genes, the MAST (Finak et al., 2015) R package was used. When fitting the hurdle model, in addition to the covariates of interest both cell cycle components (described above) as well as the number of detected genes per cell were used to reduce false positives due to cycling state or mRNA capture rates. P-values were corrected with the Benjamini Hochberg FDR procedure and genes were accepted at an FDR < 0.1 threshold. To identify genes whose expression differed between the GFP+ and GFP- subsets in a genotype-dependent manner (and therefore may be perturbed as a consequence of IL-23 receptor signaling), data from all four subsets (Il23RWT/eGFP and Il23ReGFP/eGFP, GFP+/− both) were combined and modeled with categorical covariates for GFP, Genotype, and a GFP:Genotype interaction term (in addition to the cell cycle and detection rate terms). Genes whose expression differed between the FACS sorted GFP subsets were first identified by comparing this full model to a reduced model without the GFP and GFP:Genotype terms, retaining those with FDR < 0.1. Then, in this subset, we tested the GFP:Genotype interaction term specifically and retained genes with FDR < 0.1.
For visualization, the dataset was reduced using principal components analysis (PCA) followed by tSNE (van der Maaten, 2014). Prior to running PCA, the log(x+1) transformed TPM expression values were normalized by regressing out three cell-level covariates: the number of detected genes, and both cell-cycle components. The top 30 components from PCA were then used as input to the tSNE procedure (with perplexity = 30) to further reduce the data to 2 dimensions.
When comparing the GFP-associated expression between T cells stimulated under Th1 or Th17-producing conditions, an effect was considered “common” using the criteria FDR < 0.05 in at least one comparison and (unadjusted) p-value < 0.05 in the other with a log fold-change in the same direction. Opposite effects satisfied the same significance criteria but with a log fold-change of opposing signs, and Th1/Th17-specific effects satisfied FDR < 0.05 in one group but p-value > 0.05 in the other.
Analysis of in-vivo 10x-sequenced single-cell libraries
Alignment and Preprocessing
To quantify gene expression, samples were individually aligned to the mm10 mus musculus genome using CellRanger v2.0.2. In total, 14 samples were collected, however two samples of intraepithelial lymphocytes in the small intestine from batch 1 were discarded as the IL23R knockout sample did not pass quality checks (insufficient barcodes belonging to cells). The remaining 12 samples were used in downstream analysis.
Merging and Filtering
An initial analysis was performed on the concatenation of all samples to identify and remove dying or contaminating cell types. All 12 samples were modeled with scVI (Lopez et al., 2018), selecting genes expressed in at least 100 cells, using 10 latent components, and encoding each sample ID as a batch variable so as to remove tissue and genotype specific effects.
The resulting latent space was then clustered into 11 clusters using the Louvain algorithm as implemented in SCANPY (Wolf et al., 2018) with the following settings: n_neighbors = 10 and resolution = 0.5. Of these four clusters were marked for removal in all subsequent analysis (across all samples), in total consisting of 7.6% of all 32,763 cells.
One cluster, c8, was characterized by low recovered UMI counts, a low proportion of ribosomal coding RNA, a high proportion of mitochondrial RNA, and very few other distinguishing genes. These were removed as being likely low-quality measurements from damaged cells.
Another cluster, c9, was identified as a possible contaminant cell type due to marked lack of CD4 and CD52 expression. Similarly, cluster c10 lacked T cell markers and had high expression of hemoglobin-related genes.
Finally, cluster c6, despite exhibiting Th17-related genes (Ccr6, Il-23r, Rorc, and IL-22), was removed as the lack of CD3 expression, lack of TCR expression, and distinct lack of any IL-23r-eGFP detection (despite significant Il-23r detection), indicated that these were likely LTi ILC3 cells from the recipient mouse and therefore not part of the genotype-perturbed donor cells of interest in this experiment. After this stage of filtering, a total of 30,259 cells remained for downstream analysis.
Between Tissue Analyses
The combined UMAP plots of Figure 4 were generated by first modeling all cells with scVI (Lopez et al., 2018), and then running the UMAP (Becht et al., 2018) algorithm using SCANPY (Wolf et al., 2018) with n_neighbors=30. When running scVI, the two experimental batches were encoded as the batch variable and zero-inflation in the model was disabled. Additionally, genes were pre-filtered to retain A) genes expressed in at least 100 cells and B) genes with high fano factor: genes divided into 30 bins based on mean, fano factor computed for each gene - using the UMI-depth normalized counts - and genes retained with a fano factor greater than 2 MAD (median absolute deviations above median) per bin.
For the heatmap in Figure 4D, edgeR (Robinson et al., 2010) was run to compute average expression per tissue and to determine the genes with the highest tissue specificity, the top 500 of which were plotted. The model was fit in the form “Batch + Tissue” and the Tissue coefficient was tested with the likelihood ratio test. When computing within-tissue differential expression based on Genotype, edgeR was used to compute differential expression (between control and eGFP/eGFP cells) using the likelihood ratio test.
Within-Tissue Analysis: Lamina Propria Lymphocytes
Samples from the lamina propria (6 total - batch 1: control and knockout in colon and batch: 2 control and knockout in colon and small intestine) were grouped together and modeled with scVI (Lopez et al., 2018) (8 components, zero-inflation enabled, genes retained that were expressed in 10 cells or more and the Fano filter as described in the previous section). As broad genotype-specific differences in expression (e.g., heat shock proteins), prevented cells from clustering together, we regressed out individual sample differences as if they were batch (i.e., encoded sample ID as the batch variable) and instead assessed the resulting clusters in terms of proportional representation (control vs. knockout) and within-cluster differential expression (control vs knockout). UMAP and Louvain clustering were run on the resulting 8 components as implemented in SCANPY (Wolf et al., 2018) with the following parameters: n_neighbors=30 and (for Louvain) resolution=0.9.
Changes in cluster composition were adjusted by the number of cells recovered using the following relation:
To identify marker genes per cluster, edgeR (Robinson et al., 2010) was used to compute log fold-change and significance when comparing cells in the cluster vs all other cells (1 vs. all differential expression). Similarly, edgeR was used to determine differential expression within cluster (control vs. knockout cells).
The Tr1 signature from Gruarin et al., 2019 (Gruarin et al., 2019) is composed of the 51 genes differentiated Tr1 cells from other CD4 cells in Figure 1A of that study. Per-cell signature scores were calculated using VISION (DeTomaso et al., 2019) and the expression matrix scaled to the median number of UMIs per cell.
Target Prioritization (Ranking)
For each gene, we computed an overall score with four components. Genes were then ranked by a weighted sum of these components. The components are defined as:
- In-vivo, Cluster Specific - the maximum of:
- The log fold-change of genes significant (FDR < 0.1) in the cluster 2 vs. all comparison
- The log fold-change * 0.5 of genes significant (FDR < 0.1) in the cluster 9 vs. all comparison
- The log fold-change of genes significant (FDR < 0.1) in the within-cluster (cluster 2) control vs. knockout comparison
- The log fold-change * 0.5 of genes significant (FDR < 0.1) in the within-cluster (cluster 9) control vs. knockout comparison
- In-vivo, Tissue Specific - the maximum of:
- The log fold-change for genes significant (FDR < 0.1) in the LPL vs. Spleen comparison
-
The log fold-change for genes significant (FDR < 0.1) in the within-LPL control vs. knockout comparisonFor both the above in-vivo categories, negative log fold-changes were truncated at 0 (to select specifically for genes upregulated in the cluster of interest or in control cells) and the overall score per gene was limited to 2.
- In-vitro, Summary - the maximum of:
- The log fold-change for genes with significant (FDR < .1) genotype-independent differences in the in-vitro GFP+ vs. GFP- comparison
-
The log fold-change of the genotype-dependent effect (GFP+ x Genotype Ctrl) in the invitro linear modelFor the above, in-vitro category, the overall score per gene was limited to 3.
- GWAS:
- We assigned a GWAS score of 1 for genes within GWAS loci for Ulcerative Colitis or Crohn’s Disease (as identified by Jostins et. al., 2012; Liu et. al., 2015; DeLange et. al., 2017 (de Lange et al., 2017; Jostins et al., 2012; Liu et al., 2015) and compiled by de Lange et al., 2017 (de Lange et al., 2017)). Alternate genes were discarded for loci in which a specific gene has been confidently implicated by fine-mapping, eQTL, or target sequencing studies (as compiled by de Lange et al. 2017 (de Lange et al., 2017)).
The final ranking was determined by combining all four categories using the following weightings:
Overall Score = (In-vivo, Cluster Specific) x 2 + (In-vivo, Tissue Specific) x 1 + (In-vitro, Summary) x 1 + (GWAS) x 2
QUANTIFICATION AND STATISTICAL ANALYSIS
Details regarding the sample sizes and statistical analyses can be found in the figures and figure legends, respectively. Statistical analysis was performed using GraphPad Prism 7.0, 8.0. and 9.0. A p-value < 0.05 was considered significant. To determine statistical significance a two-tailed unpaired t test was performed unless otherwise indicated.
Supplementary Material
Supplementary tables related to the smart-seq2 in-vitro T cell cytokine stimulation experiments. Includes cell-level meta-data (Stimulus/Genotype/GFP) along with the results of differential expression comparisons (GFP+ vs GFP- comparisons along with the results of the combined, two-factor model).
Supplementary table containing the RNAseq differential expression results for comparisons between T cells in-vitro differentiated with different cytokine combinations. Contains the list of differential genes (FDR < 0.1) for each pairwise comparison along with effect size.
Supplementary tables related to the 10x single-cell sequencing on T cells derived from the in vivo mouse experiments. Contains cell-level meta-data for all 32,764 sequenced cells along with the results of Tissue vs. Tissue differential expression comparisons (both between-tissue comparisons and within-tissue, genotype comparisons).
Supplementary tables related to the 10x single-cell sequencing on T cells derived from the in vivo mouse experiments originating from the small intestine or colonic lamina propria. Contains the results of 1 vs all differential expression tests for each of the 12 clusters defined in the study. Additionally, contains the results of within-cluster, between-genotype differential expression comparisons.
Supplementary table detailing the ranking procedure used to prioritize genes for follow-up study. It gathers, for each gene, the final score used for ranking in addition to the component statistics used in computing this score. Details on the formula used are provided in the supplementary methods.
Supplementary table containing the RNAseq differential expression results comparing CD160 deficient and wildtype T cells. Samples for this comparison were adoptively transferred into immunodeficient mice and later isolated from the colonic mucosa prior to RNAseq. Table contains the list of differential genes (FDR < 0.1) along with effect size.
Highlights.
IL-23R confers pathogenicity to Th1-like cells during intestinal inflammation
scRNAseq identifies IL-23R-dependent inflammatory signatures in Th1-like cells
CD160, induced by IL-23, plays an important role in colitis driven by Th1-like cells
Fate mapping identifies IL-23R+ Th1-like cells in CD45RBhi adoptive transfer colitis
Acknowledgments
We would like to thank the Kuchroo and Anderson laboratories for feedback, in particular Davide Mangani. Furthermore, we would like to thank Mary Collins for feedback on both manuscript and data. We thank Arlene Sharpe (HMS) for generous sharing of CD160 KO animals. We would like to thank the Harvard rodent histopathology core for help with histology and analyses. We would like to acknowledge the flow cytometry core facility at the Ann Romney Center for Neurologic Diseases (ARCND) for cell sorting, in particular Deneen Kozoriz and Rajesh K. Krishnan. The original design of the graphical abstract was created with BioRender.com and further modified.
Funding:
This study was supported by grants 5P01AI073748-10, 1R01AI144166-01A1, 5P01AI056299-17, 5P01AI039671-23 (V.K.K.) and the Chan Zuckerberg Biohub (N.Y.). C.W. is supported by a National Multiple Sclerosis Society grant (TA-1605-08590).
Footnotes
Declaration of interests
N.Y. is an advisor and/or has equity in Cellarity, Celsius Therapeutics and Rheos Medicines. R.J.X. is cofounder and equity holder in Celsius Therapeutics and Jnana Therapeutics. D.D. is an employee of and equity holder in ArsenalBio. A.R. was a SAB member of Thermo Fisher Scientific, Neogene Therapeutics, Asimov, and Syros Pharmaceuticals. A.R. is a cofounder of and equity holder in Celsius Therapeutics and an equity holder in Immunitas. A.R. is an employee of Genentech (member of the Roche Group) since August 2020 and has equity in Roche. None of these companies provided support for this work. A.R. was an HHMI Investigator while this study was conducted. A.C.A. is a member of the scientific advisory boards for Compass Therapeutics, Tizona Therapeutics, Zumutor Biologics, and ImmuneOncia, which have interests in cancer immunotherapy. A.C.A. is a paid consultant for iTeos Therapeutics. A.C.A. is a paid consultant for Larkspur Biosciences. V.K.K. has an ownership interest in and is a member of the scientific advisory board for Tizona Therapeutics. V.K.K. is a co-founder of and has an ownership interest in Celsius Therapeutics. V.K.K is a co-founder of Bicara therapeutics. A.C.A.’s and V.K.K.’s interests were reviewed and managed by Brigham and Women’s Hospital and Partners Healthcare in accordance with their conflict of interest policies. V.K.K., R.J.X., M.P., D.D. and N.Y. are inventors on patent application PCT/US2022/013331 related to this manuscript.
Publisher's Disclaimer: This is a PDF file of an unedited manuscript that has been accepted for publication. As a service to our customers we are providing this early version of the manuscript. The manuscript will undergo copyediting, typesetting, and review of the resulting proof before it is published in its final form. Please note that during the production process errors may be discovered which could affect the content, and all legal disclaimers that apply to the journal pertain.
References
- Abadia-Molina AC, Ji H, Faubion WA, Julien A, Latchman Y, Yagita H, Sharpe A, Bhan AK, and Terhorst C. (2006). CD48 controls T-cell and antigen-presenting cell functions in experimental colitis. Gastroenterology 130, 424–434. [DOI] [PubMed] [Google Scholar]
- Acosta-Rodriguez EV, Napolitani G, Lanzavecchia A, and Sallusto F. (2007). Interleukins 1beta and 6 but not transforming growth factor-beta are essential for the differentiation of interleukin 17-producing human T helper cells. Nature immunology 8, 942–949. [DOI] [PubMed] [Google Scholar]
- Ahern PP, Schiering C, Buonocore S, McGeachy MJ, Cua DJ, Maloy KJ, and Powrie F. (2010). Interleukin-23 drives intestinal inflammation through direct activity on T cells. Immunity 33, 279–288. [DOI] [PMC free article] [PubMed] [Google Scholar]
- Alfen JS, Larghi P, Facciotti F, Gagliani N, Bosotti R, Paroni M, Maglie S, Gruarin P, Vasco CM, Ranzani V, et al. (2018). Intestinal IFN-gamma-producing type 1 regulatory T cells coexpress CCR5 and programmed cell death protein 1 and downregulate IL-10 in the inflamed guts of patients with inflammatory bowel disease. J Allergy Clin Immunol 142, 1537–1547 e1538. [DOI] [PubMed] [Google Scholar]
- Amarnath S, Mangus CW, Wang JC, Wei F, He A, Kapoor V, Foley JE, Massey PR, Felizardo TC, Riley JL, et al. (2011). The PDL1-PD1 axis converts human TH1 cells into regulatory T cells. Sci Transl Med 3, 111ra120. [DOI] [PMC free article] [PubMed] [Google Scholar]
- Annacker O, Coombes JL, Malmstrom V, Uhlig HH, Bourne T, Johansson-Lindbom B, Agace WW, Parker CM, and Powrie F. (2005). Essential role for CD103 in the T cell-mediated regulation of experimental colitis. J Exp Med 202, 1051–1061. [DOI] [PMC free article] [PubMed] [Google Scholar]
- Anumanthan A, Bensussan A, Boumsell L, Christ AD, Blumberg RS, Voss SD, Patel AT, Robertson MJ, Nadler LM, and Freeman GJ (1998). Cloning of BY55, a novel Ig superfamily member expressed on NK cells, CTL, and intestinal intraepithelial lymphocytes. J Immunol 161, 2780–2790. [PubMed] [Google Scholar]
- Atarashi K, Suda W, Luo C, Kawaguchi T, Motoo I, Narushima S, Kiguchi Y, Yasuma K, Watanabe E, Tanoue T, et al. (2017). Ectopic colonization of oral bacteria in the intestine drives TH1 cell induction and inflammation. Science 358, 359–365. [DOI] [PMC free article] [PubMed] [Google Scholar]
- Awasthi A, Riol-Blanco L, Jager A, Korn T, Pot C, Galileos G, Bettelli E, Kuchroo VK, and Oukka M. (2009). Cutting edge: IL-23 receptor gfp reporter mice reveal distinct populations of IL-17-producing cells. J Immunol 182, 5904–5908. [DOI] [PMC free article] [PubMed] [Google Scholar]
- Becattini S, Latorre D, Mele F, Foglierini M, De Gregorio C, Cassotta A, Fernandez B, Kelderman S, Schumacher TN, Corti D, et al. (2015). T cell immunity. Functional heterogeneity of human memory CD4(+) T cell clones primed by pathogens or vaccines. Science 347, 400–406. [DOI] [PubMed] [Google Scholar]
- Becht E, McInnes L, Healy J, Dutertre CA, Kwok IWH, Ng LG, Ginhoux F, and Newell EW (2018). Dimensionality reduction for visualizing single-cell data using UMAP. Nat Biotechnol. [DOI] [PubMed] [Google Scholar]
- Bolger AM, Lohse M, and Usadel B. (2014). Trimmomatic: a flexible trimmer for Illumina sequence data. Bioinformatics 30, 2114–2120. [DOI] [PMC free article] [PubMed] [Google Scholar]
- Bonecchi R, Bianchi G, Bordignon PP, D’Ambrosio D, Lang R, Borsatti A, Sozzani S, Allavena P, Gray PA, Mantovani A, and Sinigaglia F. (1998). Differential expression of chemokine receptors and chemotactic responsiveness of type 1 T helper cells (Th1s) and Th2s. J Exp Med 187, 129–134. [DOI] [PMC free article] [PubMed] [Google Scholar]
- Croxford AL, and Buch T. (2011). Cytokine reporter mice in immunological research: perspectives and lessons learned. Immunology 132, 1–8. [DOI] [PMC free article] [PubMed] [Google Scholar]
- Cua DJ, Sherlock J, Chen Y, Murphy CA, Joyce B, Seymour B, Lucian L, To W, Kwan S, Churakova T, et al. (2003). Interleukin-23 rather than interleukin-12 is the critical cytokine for autoimmune inflammation of the brain. Nature 421, 744–748. [DOI] [PubMed] [Google Scholar]
- Dardalhon V, Schubart AS, Reddy J, Meyers JH, Monney L, Sabatos CA, Ahuja R, Nguyen K, Freeman GJ, Greenfield EA, et al. (2005). CD226 is specifically expressed on the surface of Th1 cells and regulates their expansion and effector functions. J Immunol 175, 1558–1565. [DOI] [PubMed] [Google Scholar]
- de Lange KM, Moutsianas L, Lee JC, Lamb CA, Luo Y, Kennedy NA, Jostins L, Rice DL, Gutierrez-Achury J, Ji SG, et al. (2017). Genome-wide association study implicates immune activation of multiple integrin genes in inflammatory bowel disease. Nat Genet 49, 256–261. [DOI] [PMC free article] [PubMed] [Google Scholar]
- DeTomaso D, Jones MG, Subramaniam M, Ashuach T, Ye CJ, and Yosef N. (2019). Functional interpretation of single cell similarity maps. Nat Commun 10, 4376. [DOI] [PMC free article] [PubMed] [Google Scholar]
- DiSpirito JR, Zemmour D, Ramanan D, Cho J, Zilionis R, Klein AM, Benoist C, and Mathis D. (2018). Molecular diversification of regulatory T cells in nonlymphoid tissues. Sci Immunol 3, eaat5861 [DOI] [PMC free article] [PubMed] [Google Scholar]
- Duerr RH, Taylor KD, Brant SR, Rioux JD, Silverberg MS, Daly MJ, Steinhart AH, Abraham C, Regueiro M, Griffiths A, et al. (2006). A genome-wide association study identifies IL23R as an inflammatory bowel disease gene. Science 314, 1461–1463. [DOI] [PMC free article] [PubMed] [Google Scholar]
- Finak G, McDavid A, Yajima M, Deng J, Gersuk V, Shalek AK, Slichter CK, Miller HW, McElrath MJ, Prlic M, et al. (2015). MAST: a flexible statistical framework for assessing transcriptional changes and characterizing heterogeneity in single-cell RNA sequencing data. Genome Biol 16, 278. [DOI] [PMC free article] [PubMed] [Google Scholar]
- Forster R, Davalos-Misslitz AC, and Rot A. (2008). CCR7 and its ligands: balancing immunity and tolerance. Nat Rev Immunol 8, 362–371. [DOI] [PubMed] [Google Scholar]
- Fuchs A, Vermi W, Lee JS, Lonardi S, Gilfillan S, Newberry RD, Cella M, and Colonna M. (2013). Intraepithelial type 1 innate lymphoid cells are a unique subset of IL-12- and IL-15-responsive IFN-gamma-producing cells. Immunity 38, 769–781. [DOI] [PMC free article] [PubMed] [Google Scholar]
- Gagliani N, Amezcua Vesely MC, Iseppon A, Brockmann L, Xu H, Palm NW, de Zoete MR, Licona-Limon P, Paiva RS, Ching T, et al. (2015). Th17 cells transdifferentiate into regulatory T cells during resolution of inflammation. Nature 523, 221–225. [DOI] [PMC free article] [PubMed] [Google Scholar]
- Gaublomme JT, Yosef N, Lee Y, Gertner RS, Yang LV, Wu C, Pandolfi PP, Mak T, Satija R, Shalek AK, et al. (2015). Single-Cell Genomics Unveils Critical Regulators of Th17 Cell Pathogenicity. Cell 163, 1400–1412. [DOI] [PMC free article] [PubMed] [Google Scholar]
- Geltink RIK, Kyle RL, and Pearce EL (2018). Unraveling the Complex Interplay Between T Cell Metabolism and Function. Annu Rev Immunol 36, 461–488. [DOI] [PMC free article] [PubMed] [Google Scholar]
- Ghoreschi K, Laurence A, Yang XP, Tato CM, McGeachy MJ, Konkel JE, Ramos HL, Wei L, Davidson TS, Bouladoux N, et al. (2010). Generation of pathogenic T(H)17 cells in the absence of TGF-beta signalling. Nature 467, 967–971. [DOI] [PMC free article] [PubMed] [Google Scholar]
- Gibbons DL, Abeler-Dorner L, Raine T, Hwang IY, Jandke A, Wencker M, Deban L, Rudd CE, Irving PM, Kehrl JH, and Hayday AC (2011). Cutting Edge: Regulator of G protein signaling-1 selectively regulates gut T cell trafficking and colitic potential. J Immunol 187, 2067–2071. [DOI] [PMC free article] [PubMed] [Google Scholar]
- Gilfillan S, Chan CJ, Cella M, Haynes NM, Rapaport AS, Boles KS, Andrews DM, Smyth MJ, and Colonna M. (2008). DNAM-1 promotes activation of cytotoxic lymphocytes by nonprofessional antigen-presenting cells and tumors. J Exp Med 205, 2965–2973. [DOI] [PMC free article] [PubMed] [Google Scholar]
- Grenningloh R, Kang BY, and Ho IC (2005). Ets-1, a functional cofactor of T-bet, is essential for Th1 inflammatory responses. J Exp Med 201, 615–626. [DOI] [PMC free article] [PubMed] [Google Scholar]
- Gruarin P, Maglie S, De Simone M, Haringer B, Vasco C, Ranzani V, Bosotti R, Noddings JS, Larghi P, Facciotti F, et al. (2019). Eomesodermin controls a unique differentiation program in human IL-10 and IFN-gamma coproducing regulatory T cells. Eur J Immunol 49, 96–111. [DOI] [PubMed] [Google Scholar]
- Haddad R, Lanjuin A, Madisen L, Zeng H, Murthy VN, and Uchida N. (2013). Olfactory cortical neurons read out a relative time code in the olfactory bulb. Nat Neurosci 16, 949–957. [DOI] [PMC free article] [PubMed] [Google Scholar]
- Harbour SN, Maynard CL, Zindl CL, Schoeb TR, and Weaver CT (2015). Th17 cells give rise to Th1 cells that are required for the pathogenesis of colitis. Proc Natl Acad Sci U S A 112, 7061–7066. [DOI] [PMC free article] [PubMed] [Google Scholar]
- Hirota K, Duarte JH, Veldhoen M, Hornsby E, Li Y, Cua DJ, Ahlfors H, Wilhelm C, Tolaini M, Menzel U, et al. (2011). Fate mapping of IL-17-producing T cells in inflammatory responses. Nat Immunol 12, 255–263. [DOI] [PMC free article] [PubMed] [Google Scholar]
- Hsu CY, Yeh LT, Fu SH, Chien MW, Liu YW, Miaw SC, Chang DM, and Sytwu HK (2018). SUMO-defective c-Maf preferentially transactivates Il21 to exacerbate autoimmune diabetes. J Clin Invest 128, 3779–3793. [DOI] [PMC free article] [PubMed] [Google Scholar]
- Huang H, Fang M, Jostins L, Umicevic Mirkov M, Boucher G, Anderson CA, Andersen V, Cleynen I, Cortes A, Crins F, et al. (2017). Fine-mapping inflammatory bowel disease loci to single-variant resolution. Nature 547, 173–178. [DOI] [PMC free article] [PubMed] [Google Scholar]
- Hueber W, Sands BE, Lewitzky S, Vandemeulebroecke M, Reinisch W, Higgins PD, Wehkamp J, Feagan BG, Yao MD, Karczewski M, et al. (2012). Secukinumab, a human anti-IL-17A monoclonal antibody, for moderate to severe Crohn’s disease: unexpected results of a randomised, double-blind placebo-controlled trial. Gut 61, 1693–1700. [DOI] [PMC free article] [PubMed] [Google Scholar]
- Ito R, Shin-Ya M, Kishida T, Urano A, Takada R, Sakagami J, Imanishi J, Kita M, Ueda Y, Iwakura Y, et al. (2006). Interferon-gamma is causatively involved in experimental inflammatory bowel disease in mice. Clin Exp Immunol 146, 330–338. [DOI] [PMC free article] [PubMed] [Google Scholar]
- Iwamoto T, Suto A, Tanaka S, Takatori H, Suzuki K, Iwamoto I, and Nakajima H. (2014). Interleukin-21-producing c-Maf-expressing CD4+ T cells induce effector CD8+ T cells and enhance autoimmune inflammation in scurfy mice. Arthritis Rheumatol 66, 2079–2090. [DOI] [PubMed] [Google Scholar]
- Izcue A, Hue S, Buonocore S, Arancibia-Carcamo CV, Ahern PP, Iwakura Y, Maloy KJ, and Powrie F. (2008). Interleukin-23 restrains regulatory T cell activity to drive T cell-dependent colitis. Immunity 28, 559–570. [DOI] [PMC free article] [PubMed] [Google Scholar]
- Jackson R, Kroehling L, Khitun A, Bailis W, Jarret A, York AG, Khan OM, Brewer JR, Skadow MH, Duizer C, et al. (2018). The translation of non-canonical open reading frames controls mucosal immunity. Nature 564, 434–438. [DOI] [PMC free article] [PubMed] [Google Scholar]
- Johansson-Lindbom B, and Agace WW (2007). Generation of gut-homing T cells and their localization to the small intestinal mucosa. Immunol Rev 215, 226–242. [DOI] [PubMed] [Google Scholar]
- Jostins L, Ripke S, Weersma RK, Duerr RH, McGovern DP, Hui KY, Lee JC, Schumm LP, Sharma Y, Anderson CA, et al. (2012). Host-microbe interactions have shaped the genetic architecture of inflammatory bowel disease. Nature 491, 119–124. [DOI] [PMC free article] [PubMed] [Google Scholar]
- Kakiuchi N, Yoshida K, Uchino M, Kihara T, Akaki K, Inoue Y, Kawada K, Nagayama S, Yokoyama A, Yamamoto S, et al. (2020). Frequent mutations that converge on the NFKBIZ pathway in ulcerative colitis. Nature 577, 260–265. [DOI] [PubMed] [Google Scholar]
- Kang L, Schmalzl A, Leupold T, Gonzalez-Acera M, Atreya R, Neurath MF, Becker C, and Wirtz S. (2020). CCR8 Signaling via CCL1 Regulates Responses of Intestinal IFN-gamma Producing Innate Lymphoid CelIs and Protects From Experimental Colitis. Front Immunol 11, 609400. [DOI] [PMC free article] [PubMed] [Google Scholar]
- Khor B, Gardet A, and Xavier RJ (2011). Genetics and pathogenesis of inflammatory bowel disease. Nature 474, 307–317. [DOI] [PMC free article] [PubMed] [Google Scholar]
- Komuczki J, Tuzlak S, Friebel E, Hartwig T, Spath S, Rosenstiel P, Waisman A, Opitz L, Oukka M, Schreiner B, et al. (2019). Fate-Mapping of GM-CSF Expression Identifies a Discrete Subset of Inflammation-Driving T Helper Cells Regulated by Cytokines IL-23 and IL-1beta. Immunity 50, 1289–1304 e1286. [DOI] [PubMed] [Google Scholar]
- Korn T, Bettelli E, Gao W, Awasthi A, Jager A, Strom TB, Oukka M, and Kuchroo VK (2007). IL-21 initiates an alternative pathway to induce proinflammatory T(H)17 cells. Nature 448, 484–487. [DOI] [PMC free article] [PubMed] [Google Scholar]
- Kowalczyk MS, Tirosh I, Heckl D, Rao TN, Dixit A, Haas BJ, Schneider RK, Wagers AJ, Ebert BL, and Regev A. (2015). Single-cell RNA-seq reveals changes in cell cycle and differentiation programs upon aging of hematopoietic stem cells. Genome Res 25, 1860–1872. [DOI] [PMC free article] [PubMed] [Google Scholar]
- Lamb CA, Mansfield JC, Tew GW, Gibbons D, Long AK, Irving P, Diehl L, Eastham-Anderson J, Price MB, O’Boyle G, et al. (2017). alphaEbeta7 Integrin Identifies Subsets of Pro-Inflammatory Colonic CD4+ T Lymphocytes in Ulcerative Colitis. J Crohns Colitis 11, 610–620. [DOI] [PMC free article] [PubMed] [Google Scholar]
- Langmead B, and Salzberg SL (2012). Fast gapped-read alignment with Bowtie 2. Nat Methods 9, 357–359. [DOI] [PMC free article] [PubMed] [Google Scholar]
- Lee Y, Awasthi A, Yosef N, Quintana FJ, Xiao S, Peters A, Wu C, Kleinewietfeld M, Kunder S, Hafler DA, et al. (2012). Induction and molecular signature of pathogenic TH17 cells. Nature immunology 13, 991–999. [DOI] [PMC free article] [PubMed] [Google Scholar]
- Li B, and Dewey CN (2011). RSEM: accurate transcript quantification from RNA-Seq data with or without a reference genome. BMC Bioinformatics 12, 323. [DOI] [PMC free article] [PubMed] [Google Scholar]
- Liu JZ, van Sommeren S, Huang H, Ng SC, Alberts R, Takahashi A, Ripke S, Lee JC, Jostins L, Shah T, et al. (2015). Association analyses identify 38 susceptibility loci for inflammatory bowel disease and highlight shared genetic risk across populations. Nat Genet 47, 979–986. [DOI] [PMC free article] [PubMed] [Google Scholar]
- Lopez R, Regier J, Cole MB, Jordan MI, and Yosef N. (2018). Deep generative modeling for single-cell transcriptomics. Nat Methods 15, 1053–1058. [DOI] [PMC free article] [PubMed] [Google Scholar]
- Madisen L, Zwingman TA, Sunkin SM, Oh SW, Zariwala HA, Gu H, Ng LL, Palmiter RD, Hawrylycz MJ, Jones AR, et al. (2010). A robust and high-throughput Cre reporting and characterization system for the whole mouse brain. Nat Neurosci 13, 133–140. [DOI] [PMC free article] [PubMed] [Google Scholar]
- Mailand N, and Diffley JF (2005). CDKs promote DNA replication origin licensing in human cells by protecting Cdc6 from APC/C-dependent proteolysis. Cell 122, 915–926. [DOI] [PubMed] [Google Scholar]
- Masopust D, and Soerens AG (2019). Tissue-Resident T Cells and Other Resident Leukocytes. Annu Rev Immunol 37, 521–546. [DOI] [PMC free article] [PubMed] [Google Scholar]
- McGeachy MJ, Chen Y, Tato CM, Laurence A, Joyce-Shaikh B, Blumenschein WM, McClanahan TK, O’Shea JJ, and Cua DJ (2009). The interleukin 23 receptor is essential for the terminal differentiation of interleukin 17-producing effector T helper cells in vivo. Nature immunology 10, 314–324. [DOI] [PMC free article] [PubMed] [Google Scholar]
- Mills EL, Ryan DG, Prag HA, Dikovskaya D, Menon D, Zaslona Z, Jedrychowski MP, Costa ASH, Higgins M, Hams E, et al. (2018). Itaconate is an anti-inflammatory metabolite that activates Nrf2 via alkylation of KEAP1. Nature 556, 113–117. [DOI] [PMC free article] [PubMed] [Google Scholar]
- Murphy CA, Langrish CL, Chen Y, Blumenschein W, McClanahan T, Kastelein RA, Sedgwick JD, and Cua DJ (2003). Divergent pro- and antiinflammatory roles for IL-23 and IL-12 in joint autoimmune inflammation. J Exp Med 198, 1951–1957. [DOI] [PMC free article] [PubMed] [Google Scholar]
- Nurieva R, Yang XO, Martinez G, Zhang Y, Panopoulos AD, Ma L, Schluns K, Tian Q, Watowich SS, Jetten AM, and Dong C. (2007). Essential autocrine regulation by IL-21 in the generation of inflammatory T cells. Nature 448, 480–483. [DOI] [PubMed] [Google Scholar]
- Patel DD, and Kuchroo VK (2015). Th17 Cell Pathway in Human Immunity: Lessons from Genetics and Therapeutic Interventions. Immunity 43, 1040–1051. [DOI] [PubMed] [Google Scholar]
- Picelli S, Bjorklund AK, Faridani OR, Sagasser S, Winberg G, and Sandberg R. (2013). Smart-seq2 for sensitive full-length transcriptome profiling in single cells. Nat Methods 10, 1096–1098. [DOI] [PubMed] [Google Scholar]
- Powrie F, Leach MW, Mauze S, Menon S, Caddle LB, and Coffman RL (1994). Inhibition of Th1 responses prevents inflammatory bowel disease in scid mice reconstituted with CD45RBhi CD4+ T cells. Immunity 1, 553–562. [DOI] [PubMed] [Google Scholar]
- Rasouli J, Casella G, Yoshimura S, Zhang W, Xiao D, Garifallou J, Gonzalez MV, Wiedeman A, Kus A, Mari ER, et al. (2020). A distinct GM-CSF(+) T helper cell subset requires T-bet to adopt a TH1 phenotype and promote neuroinflammation. Sci Immunol 5. [DOI] [PubMed] [Google Scholar]
- Robinson MD, McCarthy DJ, and Smyth GK (2010). edgeR: a Bioconductor package for differential expression analysis of digital gene expression data. Bioinformatics 26, 139–140. [DOI] [PMC free article] [PubMed] [Google Scholar]
- Roman J, Planell N, Lozano JJ, Aceituno M, Esteller M, Pontes C, Balsa D, Merlos M, Panes J, and Salas A. (2013). Evaluation of responsive gene expression as a sensitive and specific biomarker in patients with ulcerative colitis. Inflamm Bowel Dis 19, 221–229. [DOI] [PubMed] [Google Scholar]
- Sandborn WJ, Gasink C, Gao LL, Blank MA, Johanns J, Guzzo C, Sands BE, Hanauer SB, Targan S, Rutgeerts P, et al. (2012). Ustekinumab induction and maintenance therapy in refractory Crohn’s disease. N Engl J Med 367, 1519–1528. [DOI] [PubMed] [Google Scholar]
- Sands BE, Peyrin-Biroulet L, Loftus EV Jr., Danese S, Colombel JF, Toruner M, Jonaitis L, Abhyankar B, Chen J, Rogers R, et al. (2019a). Vedolizumab versus Adalimumab for Moderate-to-Severe Ulcerative Colitis. N Engl J Med 381, 1215–1226. [DOI] [PubMed] [Google Scholar]
- Sands BE, Sandborn WJ, Panaccione R, O’Brien CD, Zhang H, Johanns J, Adedokun OJ, Li K, Peyrin-Biroulet L, Van Assche G, et al. (2019b). Ustekinumab as Induction and Maintenance Therapy for Ulcerative Colitis. N Engl J Med 381, 1201–1214. [DOI] [PubMed] [Google Scholar]
- Sato K, Miyoshi F, Yokota K, Araki Y, Asanuma Y, Akiyama Y, Yoh K, Takahashi S, Aburatani H, and Mimura T. (2011). Marked induction of c-Maf protein during Th17 cell differentiation and its implication in memory Th cell development. J Biol Chem 286, 14963–14971. [DOI] [PMC free article] [PubMed] [Google Scholar]
- Schiering C, Krausgruber T, Chomka A, Frohlich A, Adelmann K, Wohlfert EA, Pott J, Griseri T, Bollrath J, Hegazy AN, et al. (2014). The alarmin IL-33 promotes regulatory T-cell function in the intestine. Nature 513, 564–568. [DOI] [PMC free article] [PubMed] [Google Scholar]
- Schneider M, Schumacher V, Lischke T, Lucke K, Meyer-Schwesinger C, Velden J, Koch-Nolte F, and Mittrucker HW (2015). CD38 is expressed on inflammatory cells of the intestine and promotes intestinal inflammation. PLoS One 10, e0126007. [DOI] [PMC free article] [PubMed] [Google Scholar]
- Schnell A, Huang L, Singer M, Singaraju A, Barilla RM, Regan BML, Bollhagen A, Thakore PI, Dionne D, Delorey TM, et al. (2021). Stem-like intestinal Th17 cells give rise to pathogenic effector T cells during autoimmunity. Cell 184, 6281–6298 e6223. [DOI] [PMC free article] [PubMed] [Google Scholar]
- Singer M, Wang C, Cong L, Marjanovic ND, Kowalczyk MS, Zhang H, Nyman J, Sakuishi K, Kurtulus S, Gennert D, et al. (2016). A Distinct Gene Module for Dysfunction Uncoupled from Activation in Tumor-Infiltrating T Cells. Cell 166, 1500–1511 e1509. [DOI] [PMC free article] [PubMed] [Google Scholar]
- Singh UP, Singh S, Taub DD, and Lillard JW Jr. (2003). Inhibition of IFN-gammain-ducible protein-10 abrogates colitis in IL-10−/− mice. J Immunol 171, 1401–1406. [DOI] [PubMed] [Google Scholar]
- Tan CL, Peluso MJ, Drijvers JM, Mera CM, Grande SM, Brown KE, Godec J, Freeman GJ, and Sharpe AH (2018). CD160 Stimulates CD8(+) T Cell Responses and Is Required for Optimal Protective Immunity to Listeria monocytogenes. Immunohorizons 2, 238–250. [DOI] [PMC free article] [PubMed] [Google Scholar]
- Teng MW, Bowman EP, McElwee JJ, Smyth MJ, Casanova JL, Cooper AM, and Cua DJ (2015). IL-12 and IL-23 cytokines: from discovery to targeted therapies for immune-mediated inflammatory diseases. Nat Med 21, 719–729. [DOI] [PubMed] [Google Scholar]
- Tu TC, Brown NK, Kim TJ, Wroblewska J, Yang X, Guo X, Lee SH, Kumar V, Lee KM, and Fu YX (2015). CD160 is essential for NK-mediated IFN-gamma production. J Exp Med 212, 415–429. [DOI] [PMC free article] [PubMed] [Google Scholar]
- Uniken Venema WT, Voskuil MD, Vila AV, van der Vries G, Jansen BH, Jabri B, Faber KN, Dijkstra G, Xavier RJ, Wijmenga C, et al. (2019). Single-Cell RNA Sequencing of Blood and Ileal T Cells From Patients With Crohn’s Disease Reveals Tissue-Specific Characteristics and Drug Targets. Gastroenterology 156, 812–815 e822. [DOI] [PMC free article] [PubMed] [Google Scholar]
- van der Maaten L. (2014). Accelerating t-SNE using Tree-Based Algorithms. Journal of Machine Learning Research 15, 3221–3245. [Google Scholar]
- Wagner A, Wang C, Fessler J, DeTomaso D, Avila-Pacheco J, Kaminski J, Zaghouani S, Christian E, Thakore P, Schellhaass B, et al. (2021). Metabolic modeling of single Th17 cells reveals regulators of autoimmunity. Cell 184, 4168–4185 e4121. [DOI] [PMC free article] [PubMed] [Google Scholar]
- Wang X, Sumida H, and Cyster JG (2014). GPR18 is required for a normal CD8alphaalpha intestinal intraepithelial lymphocyte compartment. J Exp Med 211, 2351–2359. [DOI] [PMC free article] [PubMed] [Google Scholar]
- Weder B, Mozaffari M, Biedermann L, Mamie C, Moncsek A, Wang L, Clarke SH, Rogler G, McRae BL, Graff CL, et al. (2018). BCL-2 levels do not predict azathioprine treatment response in inflammatory bowel disease, but inhibition induces lymphocyte apoptosis and ameliorates colitis in mice. Clin Exp Immunol 193, 346–360. [DOI] [PMC free article] [PubMed] [Google Scholar]
- Wells ML, Perera L, and Blackshear PJ (2017). An Ancient Family of RNA-Binding Proteins: Still Important! Trends Biochem Sci 42, 285–296. [DOI] [PMC free article] [PubMed] [Google Scholar]
- Wolf FA, Angerer P, and Theis FJ (2018). SCANPY: large-scale single-cell gene expression data analysis. Genome Biol 19, 15. [DOI] [PMC free article] [PubMed] [Google Scholar]
- Yu H. (2007). Cdc20: a WD40 activator for a cell cycle degradation machine. Mol Cell 27, 3–16. [DOI] [PubMed] [Google Scholar]
- Zhang H, Madi A, Yosef N, Chihara N, Awasthi A, Pot C, Lambden C, Srivastava A, Burkett PR, Nyman J, et al. (2020). An IL-27-Driven Transcriptional Network Identifies Regulators of IL-10 Expression across T Helper Cell Subsets. Cell Rep 33, 108433. [DOI] [PMC free article] [PubMed] [Google Scholar]
- Zhang P, Lee JS, Gartlan KH, Schuster IS, Comerford I, Varelias A, Ullah MA, Vuckovic S, Koyama M, Kuns RD, et al. (2017). Eomesodermin promotes the development of type 1 regulatory T (TR1) cells. Sci Immunol 2, eaah7152. [DOI] [PMC free article] [PubMed] [Google Scholar]
- Zhang Q, and Vignali DA (2016). Co-stimulatory and Co-inhibitory Pathways in Autoimmunity. Immunity 44, 1034–1051. [DOI] [PMC free article] [PubMed] [Google Scholar]
Associated Data
This section collects any data citations, data availability statements, or supplementary materials included in this article.
Supplementary Materials
Supplementary tables related to the smart-seq2 in-vitro T cell cytokine stimulation experiments. Includes cell-level meta-data (Stimulus/Genotype/GFP) along with the results of differential expression comparisons (GFP+ vs GFP- comparisons along with the results of the combined, two-factor model).
Supplementary table containing the RNAseq differential expression results for comparisons between T cells in-vitro differentiated with different cytokine combinations. Contains the list of differential genes (FDR < 0.1) for each pairwise comparison along with effect size.
Supplementary tables related to the 10x single-cell sequencing on T cells derived from the in vivo mouse experiments. Contains cell-level meta-data for all 32,764 sequenced cells along with the results of Tissue vs. Tissue differential expression comparisons (both between-tissue comparisons and within-tissue, genotype comparisons).
Supplementary tables related to the 10x single-cell sequencing on T cells derived from the in vivo mouse experiments originating from the small intestine or colonic lamina propria. Contains the results of 1 vs all differential expression tests for each of the 12 clusters defined in the study. Additionally, contains the results of within-cluster, between-genotype differential expression comparisons.
Supplementary table detailing the ranking procedure used to prioritize genes for follow-up study. It gathers, for each gene, the final score used for ranking in addition to the component statistics used in computing this score. Details on the formula used are provided in the supplementary methods.
Supplementary table containing the RNAseq differential expression results comparing CD160 deficient and wildtype T cells. Samples for this comparison were adoptively transferred into immunodeficient mice and later isolated from the colonic mucosa prior to RNAseq. Table contains the list of differential genes (FDR < 0.1) along with effect size.
Data Availability Statement
Single-cell RNA-seq and population RNA-seq data have been deposited at GEO and are publicly available as of the date of publication. The accession number is listed in the key resources table.
All original code has been deposited at GitHub and Zenodo and is publicly available as of the date of publication. The URL and DOI are listed in the key resources table.
Any additional information required to reanalyze the data reported in this paper is available from the lead contact upon request.