Abstract
Aging is associated with changes in a variety of biological processes at the transcriptomic level, including gene expression. Two types of aging occur during a lifetime: chronological and physiological aging. However, dissecting the difference between chronological and physiological ages at the transcriptomic level has been a challenge because of its complexity. We analyzed the transcriptomic features associated with physiological and chronological aging using Caenorhabditis elegans as a model. Many structural and functional transcript elements, such as noncoding RNAs and intron-derived transcripts, were up-regulated with chronological aging. In contrast, mRNAs with many biological functions, including RNA processing, were down-regulated with physiological aging. We also identified an age-dependent increase in the usage of distal 3′ splice sites in mRNA transcripts as a biomarker of physiological aging. Our study provides crucial information for dissecting chronological and physiological aging at the transcriptomic level.
Aging is accompanied by gradual changes in organisms at various molecular levels, including the transcriptomic level (Stegeman and Weake 2017; Ham and Lee 2020; Xia et al. 2021). Two types of age-associated changes occur: chronological and physiological aging processes (Perez-Gomez et al. 2020). Chronological age is the time after birth and represents physical time, whereas physiological age indicates the youthful or aged state of organisms. Whereas chronological age equally progresses in organisms that are born on the same time point, the changes associated with physiological aging occur at different rates among organisms with the same chronological ages. Although previous studies have characterized various aspects of aging, dissecting the difference between chronological and physiological ages at the transcriptomic level has remained as a challenge for the field of aging research.
Microarray and RNA sequencing (RNA-seq) analyses have identified the transcriptomic changes associated with aging in various organisms, including Caenorhabditis elegans. Pioneering microarray studies identified various transcription factors as important regulators of aging, including ELT-3 (Budovskaya et al. 2008), ELT-2 (Zhang et al. 2013), and PQM-1 (Tepper et al. 2013). Aging increases intragenic spurious transcription, cryptic transcription (Sen et al. 2015), the transcription of repetitive elements (LaRocca et al. 2020; Li et al. 2021), and transcriptional drift (Rangaraju et al. 2015) in C. elegans. In addition, the reorganization of the transcription program during aging is accompanied by chromatin remodeling (Riedel et al. 2013), histone methylation (Pu et al. 2015, 2018), and transcription elongation (Ghazi et al. 2009; Amrit et al. 2019; Debès et al. 2019). Aging also influences cotranscriptional and/or post-transcriptional RNA-processing events, including alternative pre-mRNA splicing (Heintz et al. 2017), backsplicing (Cortés-López et al. 2018), and nonsense-mediated mRNA decay (Son et al. 2017). However, it remains largely unknown which of the transcriptomic changes are associated with chronological or physiological aging.
The proper reduction of insulin/insulin-like growth factor 1 (IGF-1) signaling (IIS) slows aging processes and increases lifespan in many species, including C. elegans (Kenyon et al. 1993; Antebi 2007; Kenyon 2010; Murphy and Hu 2013; Altintas et al. 2016). Loss-of-function mutations in C. elegans daf-2, which encodes insulin/IGF-1 receptor, appear to delay physiological aging. Growing evidence indicates that daf-2 mutations delay aging throughout adulthood by affecting life trajectory and transcriptome (Murphy et al. 2003; Rangaraju et al. 2015; Stroustrup et al. 2016; Tarkhov et al. 2019). This is different from transient interventions early in adulthood, including short-term heat shock, which induces a period-specific beneficial effect on lifespan (Stroustrup et al. 2016). Here, we comprehensively analyzed transcriptomic changes that match physiological aging and chronological aging, by using wild-type and daf-2 mutant C. elegans.
Results
Transcriptional fidelity becomes attenuated during C. elegans aging
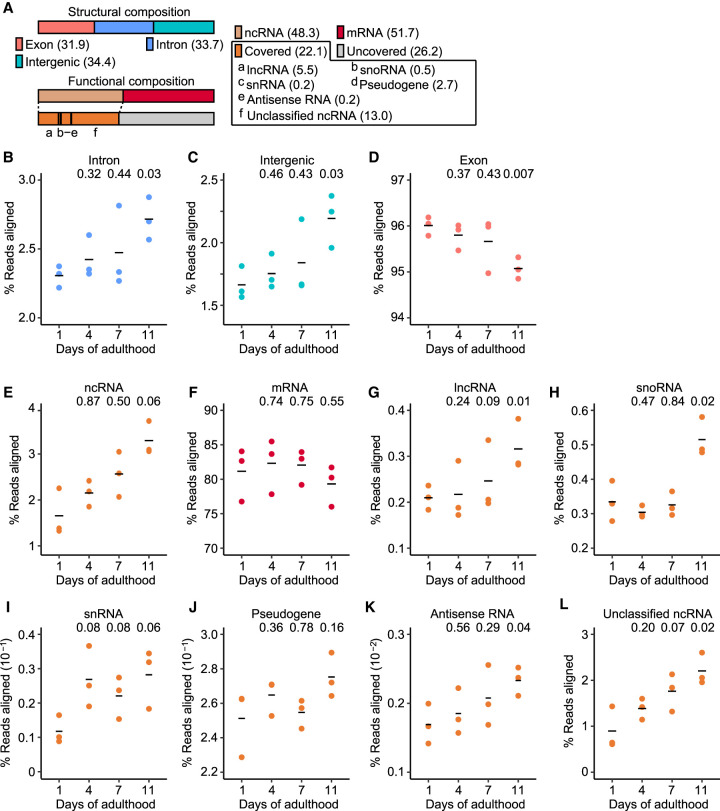
We sought to determine age-dependent transcriptomic changes in different genomic components in C. elegans by performing RNA-seq analysis. Genome composition can be categorized based on structural and functional elements (Fig. 1A). Among structural elements, we found that the read fractions of introns and intergenic regions increased during aging (Fig. 1B,C). In addition, the expressed intron levels of individual nonoverlapping genes increased (Supplemental Fig. S1A,B). In contrast, the fraction of exonic RNA-seq reads decreased during aging (Fig. 1D). These results indicate that aging is associated with transcriptional derepression of non-exonic regions in the genome.
Figure 1.
Reduced transcriptional fidelity is pervasive during aging in Caenorhabditis elegans. (A) Structural and functional compositions (%) of genomic elements in C. elegans. Structural composition includes exon, intron, and intergenic regions. Functional composition includes noncoding RNA (ncRNA) and protein-coding messenger RNA (mRNA). ncRNA is further divided into long ncRNA (lncRNA), small nucleolar RNA (snoRNA), small nuclear RNA (snRNA), pseudogene-coded RNA (pseudogene), antisense RNA, and unclassified ncRNA. Numbers in parentheses indicate relative proportions in the composition. “Covered” indicates ncRNAs that can generally be detected with RNA-seq, whereas “Uncovered” indicates ncRNAs that require specialized procedures for detection. (B–D) Overall expression levels of structural elements during aging: intron (B), intergenic (C), and exon regions (D). (E–L) Age-dependent changes in the expression levels of functional elements, including ncRNA (E), mRNA (F), lncRNA (G), snoRNA (H), snRNA (I), pseudogene-coded RNA (J), antisense RNA (K), and unclassified ncRNA (L). P value is shown on top of each panel. Two-tailed Welch's t-test relative to the data obtained with animals at day 1 of adulthood.
We then analyzed the relative levels of RNA-seq reads aligned to specific functional compositions. We found that the levels of annotated noncoding RNAs (ncRNAs) increased during aging (Fig. 1E). Consistently, the fraction of ncRNAs was significantly higher among age-dependently up-regulated transcripts than down-regulated transcripts (Supplemental Fig. S1C,D). In contrast, overall levels of protein-coding mRNAs did not significantly change during aging (Fig. 1F). We further analyzed age-dependent changes of the subcategories of ncRNAs, and showed that long ncRNAs (lncRNAs), small nucleolar RNAs (snoRNAs), small nuclear RNAs (snRNAs), pseudogene-coded RNAs, antisense RNAs, and unclassified ncRNAs manifested age-dependent increases (Fig. 1G–L). These data suggest that the levels of ncRNAs generally increase during aging in C. elegans, possibly because of impaired transcriptional repression and fidelity in aged organisms.
Alternative selection of 3′ splice sites contributes to age-dependent increases in transcript isoform levels
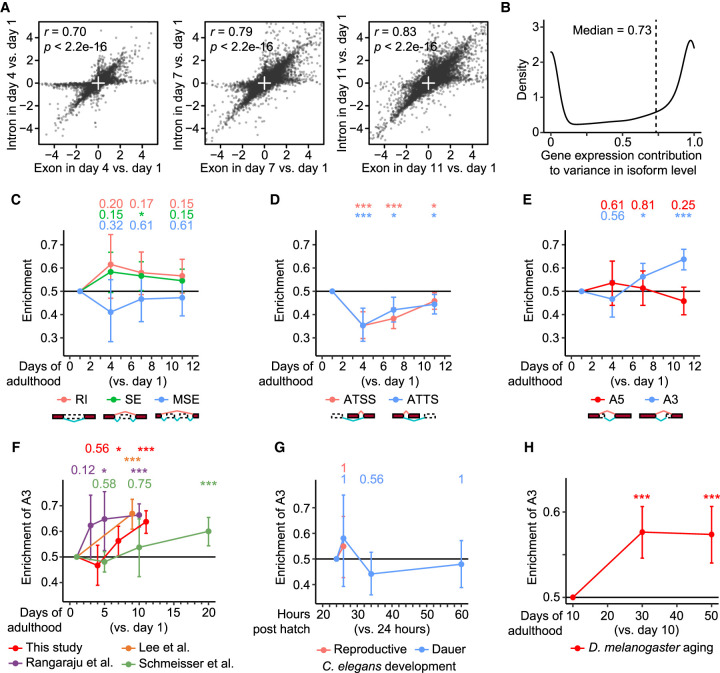
The levels of transcripts are determined by transcription and subsequent RNA processing. Therefore, transcriptional fidelity influences the expression of genes and, consequently, the levels of transcript isoforms, because transcription is coupled to RNA-processing events, such as splicing (Bentley 2014; Peck et al. 2019). We found that the correlation between the expression levels of exons and introns of the same genes increased during aging (Fig. 2A). These data are consistent with the idea that unprocessed RNAs, which contain both exons and introns, accumulate age-dependently, possibly resulting from impaired RNA processing. We then quantified the effects of the age-associated impairment in RNA processing by measuring the proportion of variance in isoform levels compared with that in expressed gene levels at different ages (Supplemental Fig. S2A). We found that the variance in expressed gene levels resulting from transcription accounted for 73.4% (median) of the variance in isoform levels among different ages (Fig. 2B); therefore, the action of RNA-processing events other than transcription contributed to 26.6% of the effect of aging on the variance in isoform levels. These data imply that aging is accompanied by the impaired fidelity of RNA processing as well as transcriptional events.
Figure 2.
Aging increases the alternative selection of distal 3′ splice sites (A3) in transcript isoforms. (A) Comparisons between age-dependent expression changes of exon and intron regions in individual nonoverlapping genes. Pearson correlation coefficient r and its significance P are marked. (B) Gene expression contribution to variance in isoform level. See Supplemental Figure S2A for the schematic overview. (C–E) Enrichment of different RNA-processing events in isoform fractions that were up-regulated during Caenorhabditis elegans aging. RNA-processing events include retained introns (RI), skipped exons (SE), multiple skipped exons (MSE) (C), alternative transcription start sites (ATSS), alternative transcription termination sites (ATTS) (D), alternative 5′ splice sites (A5), and alternative 3′ splice sites (A3) (E). (F–H) Enrichment of A3 in isoform fractions up-regulated during aging (F), during reproductive and dauer larval development (G) in C. elegans, and during aging in Drosophila melanogaster (H). We noticed that only a single A3 isoform was detected as up-regulated in the comparison between animals at 34 h post-hatching and at 24 h post-hatching in reproductive larval development. Adjusted P value is shown at the top of each panel, calculated by one-proportion Z-test adjusted using false discovery rates; (*) adjusted P < 0.1, (***) adjusted P < 0.001.
We then focused our aging transcriptome analysis on seven representative RNA-processing events: retained introns (RI), skipped exons (SE), multiple skipped exons (MSE), alternative transcription start sites (ATSS), alternative transcription termination sites (ATTS), alternative 5′ splice sites (A5), and alternative 3′ splice sites (A3). We found that A3 was enriched in isoforms with age-dependent up-regulation, whereas RI, SE, MSE, ATSS, ATTS, or A5 was not (Fig. 2C–E). This result is also consistent with the finding that isoforms with at least one A3 tended to be up-regulated rather than down-regulated during aging (Supplemental Fig. S2B) and with our analysis of various published data sets (Fig. 2F; Schmeisser et al. 2013; Rangaraju et al. 2015; Lee et al. 2021). In contrast, we did not detect any enrichment in A3 during C. elegans larval development (Fig. 2G). In addition, Drosophila melanogaster also showed age-dependent enrichment of A3 (Fig. 2H; Weigelt et al. 2020), consistent with the conservation of aging-associated global mRNA changes between C. elegans and D. melanogaster (McCarroll et al. 2004). Thus, A3 specifically contributes to the increased levels of relevant transcript isoforms in aged C. elegans and D. melanogaster.
Aging increases the usage of distal optimal 3′ splice sites over proximal 3′ splice sites in transcript isoforms
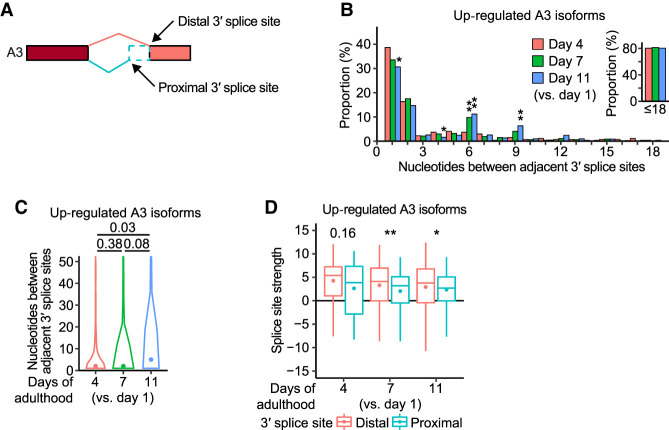
We performed further analysis of A3 isoforms with an age-dependently up-regulated isoform fraction, specifically the alternative use of distal 3′ splice sites instead of proximal 3′ splice sites (Fig. 3A). Among the age-dependently up-regulated A3 isoforms, the distance between proximal and distal 3′ splice sites was mostly (∼80%) within 18 nucleotides (nt) and increased with age (Fig. 3B,C). In particular, the proportion of the adjacent 3′ splice sites, separated by 6 nt and 9 nt, significantly increased (Fig. 3B). In addition, the splice site strength of age-dependently up-regulated A3 isoforms, based on the meta-analysis of RNA-seq data (Tourasse et al. 2017), was higher at distal 3′ splice sites than at proximal ones in aged animals (Fig. 3D; Supplemental Fig. S3A,B). By comparing our data with a previous report that analyzed A3 enriched in gonads and somatic tissues (Ragle et al. 2015), we found that the age-dependent up-regulation of A3 isoforms occurs in somatic tissues as well as in gonads (Supplemental Fig. S3C–I). Thus, aging appears to increase the usage of distal optimal 3′ splice sites in transcript isoforms, while decreasing that of proximal 3′ splice sites.
Figure 3.
Aging increases the usage of distal optimal 3′ splice sites over proximal suboptimal 3′ splice sites in transcript isoforms. (A) Proximal and distal 3′ splice sites for alternative 3′ splice site (A3) isoforms. (B) Nucleotides between adjacently located proximal and distal 3′ splice sites in age-dependently up-regulated A3 isoforms. Inset: Proportion of the cases for which adjacent 3′ splice sites are located within 18 nt. P values are shown at the top of the bars, calculated by two-tailed Fisher's exact test; (*) P < 0.05, (**) P < 0.01. (C) Distribution of nucleotides between adjacent 3′ splice sites in age-dependently up-regulated A3 isoforms. P values are shown at the top of the data points, calculated using two-tailed Wilcoxon rank-sum exact test. (D) Splice site strength of proximal and distal 3′ splice sites in age-dependently up-regulated A3 isoforms. The strength was calculated based on a maximum entropy model. P values are indicated at the top of the data points, calculated using two-tailed Wilcoxon rank-sum exact test; (*) P < 0.05, (**) P < 0.01. See Supplemental Figure S4 for additional sequence analyses of the 3′ splice sites.
Age-dependent up-regulation of intron-derived transcripts and noncoding RNAs matches chronological aging
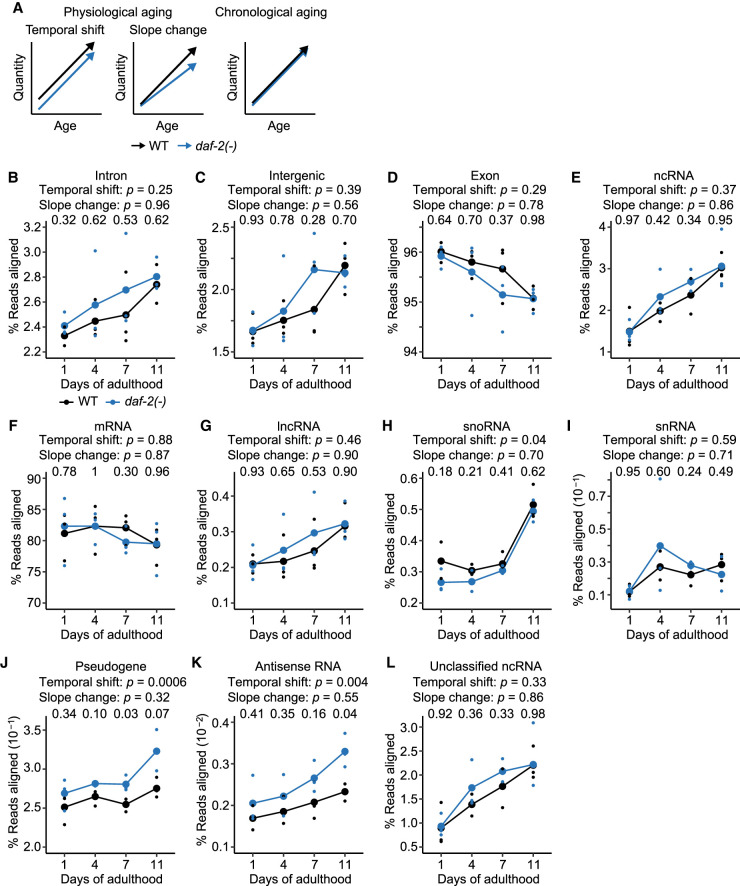
We then investigated whether the rates of age-dependent deregulation of transcriptome were affected by a longevity-promoting regimen, focusing on daf-2/insulin/IGF-1 receptor mutations, which slow physiological aging (Fig. 4A; Antebi 2007; Kenyon 2010; Murphy and Hu 2013; Altintas et al. 2016; Stroustrup et al. 2016). We postulated that two types of transcriptomic changes were related to physiological aging: temporal shift that begins at early adulthood, and slope change that alters aging rates throughout adulthood (Fig. 4A). In contrast, transcriptomic changes related to chronological aging would depend on the time after birth, regardless of genotypes (Fig. 4A).
Figure 4.
daf-2 mutations affect age-dependent changes in transcriptional fidelity. (A) Schematic of transcriptomic features that match physiological and chronological aging in wild-type (WT) and daf-2(e1370) [daf-2(-)] animals. The transcriptomic features associated with physiological aging were categorized as temporal shift that begins at early adulthood and slope change that alters aging rates throughout adulthood. (B–D) Overall expression levels of structural elements, including intron (B), intergenic (C), and exon regions (D) in WT and daf-2(-) animals at different ages. (E,F) Overall expression levels of functional elements, including noncoding RNA (ncRNA) (E) and protein-coding messenger RNA (mRNA) (F) in WT and daf-2(-) animals at indicated ages. (G–L) Age-dependent level changes in ncRNA, including long ncRNA (lncRNA) (G), small nucleolar RNA (snoRNA) (H), small nuclear RNA (snRNA) (I), pseudogene-coded RNA (pseudogene) (J), antisense RNA (K), and unclassified ncRNA (L) in WT and daf-2(-) animals. Overall snoRNA levels increased with age and shifted down in daf-2(-) animals compared with those in WT animals at day 1 of adulthood (H). The levels of pseudogene-coded RNAs (J) and antisense RNAs (K) increased with age and shifted up in daf-2(-) animals at day 1 of adulthood (Supplemental Fig. S5D,E). P value is shown at each day, calculated by two-tailed Welch's t-test between WT and daf-2(-) animals of the same chronological age. In each panel, two P values are shown for the effects of genotypes on transcript levels that correspond to “Temporal shift,” and those for interaction between genotypes and ages that correspond to “Slope change,” calculated by using two-way analysis of variance (ANOVA). Note that results from WT animals are the same as those used in Figure 1B–L; they are shown here for the comparison with daf-2(-) animals.
We analyzed the transcriptomic changes related to chronological and physiological aging by comparing the structural and functional transcriptome compositions of wild-type and daf-2 mutant animals. We found that the levels of analyzed structural compositions of transcripts, including intron (Fig. 4B; Supplemental Fig. S5A,B), intergenic (Fig. 4C), and exon regions (Fig. 4D), were not significantly affected by daf-2 mutations during aging. In addition, daf-2 mutations did not influence the overall levels of functional compositions of transcripts, including ncRNAs (Fig. 4E; Supplemental Fig. S5C) and mRNAs (Fig. 4F), during aging. These data indicate that the overall age-dependent changes in these categories of transcripts match chronological aging. We then analyzed subcategories of ncRNAs, and found that lncRNAs (Fig. 4G), snRNAs (Fig. 4I), and unclassified ncRNAs (Fig. 4L), which comprise the majority of ncRNAs (72%; Fig. 1A), were not significantly changed by daf-2 mutations. Unexpectedly, snoRNAs (Fig. 4H), pseudogene-coded RNAs (Fig. 4J), and antisense RNAs (Fig. 4K) displayed increased temporal shift and slope change in the daf-2 mutants (see Discussion for detail). By analyzing published RNA-seq data with four tissues, neurons, the hypodermis, the intestine, and the muscles (Kaletsky et al. 2018), we showed that changes in transcripts enriched in neurons and the intestine were generally similar to those in the whole body (Supplemental Figs. S6, S7). Overall, these data indicate that the age-dependent expression changes of the majority of the structural and functional transcripts match chronological aging, consistent with a previous report (Murphy et al. 2003).
daf-2 mutations slow age-dependent changes in the expression of RNA-processing factors
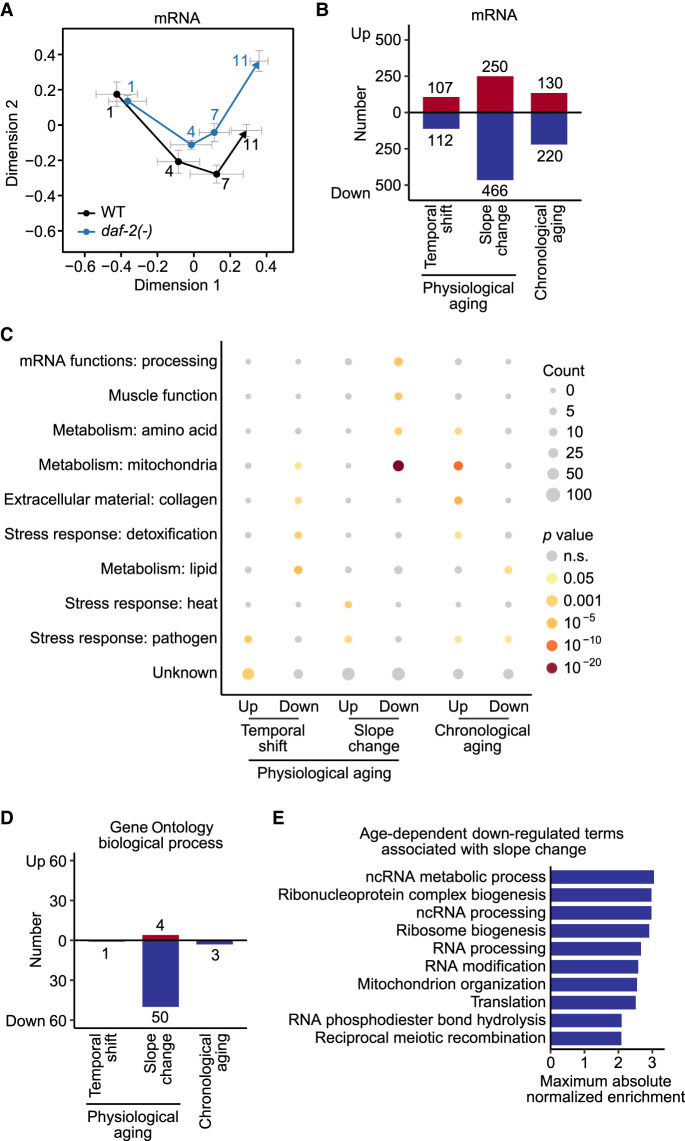
We further analyzed mRNA transcripts by using multiple dimension scaling analysis. We found that the trajectories of aging inferred from mRNA levels in wild-type and in daf-2 mutant animals were substantially different (Fig. 5A). We therefore analyzed individual mRNA transcripts with respect to chronological and physiological aging (see Methods for detail, Supplemental Table S1). We showed that the expression of 935 and 350 transcripts matched physiological and chronological aging, respectively (Fig. 5B). Among the transcripts associated with physiological aging, the expression of 219 and 716 transcripts matched temporal shift and slope change, respectively; specifically, the 466 mRNAs for which the down-regulation matched slope change comprised the largest proportion, and were specifically associated with the term “mRNA functions: processing (genes encoding proteins that modify, bind or store mRNAs after transcription)” and “muscle function” in the WormCat annotation (Fig. 5C; Holdorf et al. 2020). By analyzing the GO terms of 8883 genes, we found that 55 and 3 out of 688 biological processes were associated with physiological and chronological aging, respectively (Fig. 5D; Supplemental Fig. S8; Supplemental Table S2). Among the 55 biological processes that were associated with physiological aging, 1 and 54 were specifically categorized as temporal shift and slope change, respectively (Fig. 5D; Supplemental Fig. S8A,B). We showed that the processes for which down-regulation was associated with slope change included “RNA processing” (Fig. 5E; Supplemental Fig. S8B). Together, these data indicate that the age-dependent down-regulation of mRNAs tends to match slope change and likely affects RNA processing during aging.
Figure 5.
daf-2 mutations contribute to changes in mRNA levels and biological processes that match chronological and physiological aging. (A) Multiple dimension scaling analysis of mRNA levels in wild-type (WT) and daf-2(e1370) [daf-2(-)] animals at indicated ages. (B) The number of mRNAs with levels that matched physiological aging that is categorized to temporal shift and slope change, and chronological aging. Red and blue bars represent up-regulated and down-regulated terms, respectively, during aging. (C) Overrepresented WormCat terms of genes identified in B. P values were calculated by using a hypergeometric test. (D) The number of Gene Ontology biological process (GO-BP) terms that matched physiological aging that are divided into temporal shift and slope change, and chronological aging. Red and blue bars represent up-regulated and down-regulated terms during aging, respectively. (E) Normalized enrichment of age-dependent down-regulated terms associated with slope change. Terms were sorted based on the maximum absolute normalized enrichment in descending order.
Differential expression of RNA-processing factors contributes to longevity conferred by daf-2 mutations
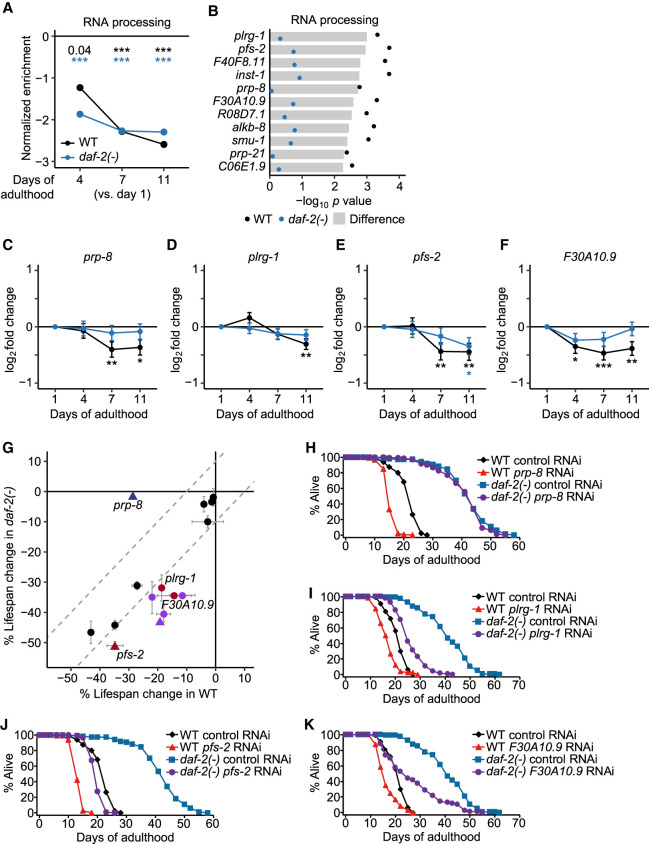
Next, we focused on the age-dependent expression changes in 513 genes that encode components annotated as “RNA processing” (GO:0006396), because these genes may contribute to the alteration in RNA levels during chronological or physiological aging. We found that these genes were generally down-regulated during aging and their slopes were steeper in wild-type animals than in daf-2 mutants (Fig. 6A); thus, the expression of these RNA-processing components may contribute to physiological aging. To further identify RNA-processing components responsible for the delayed age-dependent transcriptional deregulation in daf-2 mutants, we analyzed the genes whose age-dependent expression decrease was significantly greater in wild-type than in daf-2 mutant animals (see Methods for detail). Among the 513 “RNA processing” genes, 11 genes satisfied the criteria (Fig. 6B); the expression of these genes was substantially decreased during aging in wild-type animals, but less so in daf-2 mutants (Fig. 6C–F; Supplemental Fig. S9). These data raise the possibility that these 11 genes encoding RNA-processing components contribute to delayed physiological aging by daf-2 mutations.
Figure 6.
RNA-processing factors with altered expression during physiological aging contribute to the longevity of daf-2 mutants. (A) Normalized enrichment of expression changes in genes that encode components annotated as RNA processing (GO:0006396) in aged animals. Adjusted P values are shown at the top of the data points, calculated by gene set enrichment analysis test and adjusted using false discovery rates; (***) adjusted P < 0.001. (B) Significance of the likelihood-ratio test for 11 genes that encode RNA-processing components and were down-regulated during aging specifically in wild-type (WT) but not in daf-2(e1370) [daf-2(-)] animals. (C–F) Expression changes of prp-8 (C), plrg-1 (D), pfs-2 (E), and F30A10.9 (F) during aging in WT and daf-2(-) animals. Adjusted P values are shown, calculated by using DESeq2's Wald test relative to day 1 of adulthood and adjusted by using the procedure of Benjamini and Hochberg; (*) adjusted P < 0.05, (**) adjusted P < 0.01, (***) adjusted P < 0.001. (G) Comparison of lifespan changes conferred by RNAi targeting each of the eleven genes in B and daf-16 (a positive control, purple symbols) in WT and that in daf-2(-) animals. Red symbols represent RNAi clones that shortened the lifespan of daf-2(-) animals by at least 10% more than that of WT animals, whereas a blue symbol represents a condition that shortened the lifespan of WT animals by at least 10% more than that of daf-2(-) animals. Whole-life RNAi treatment was used except those noted with triangles, which were performed using adult-only RNAi treatment. On excluding prp-8 RNAi data, an outlier that deviated from normal Q-Q line and Cook's distance (> 4/n = 0.14; n = 28), our results indicate that the effects of RNAi clones on lifespan were proportionally larger in daf-2(-) animals than in WT animals (y = 1.42x, simple linear regression without an intercept, adjusted R2 = 0.89). These data are consistent with the age-dependent changes in the expression levels of the candidate genes whose down-regulation was greater in WT than in daf-2(-) animals. (H–K) Lifespan (n ≥ 90 for each condition) of WT and daf-2(-) animals treated with control RNAi and RNAi targeting each of prp-8 (H), plrg-1 (I), pfs-2 (J), and F30A10.9 (K). See Supplemental Source files for additional repeats and statistical analysis of the lifespan data shown in this figure.
Next, we determined the functional importance of these 11 genes by measuring the lifespan of wild-type and daf-2 mutant animals upon knocking down each of these 11 genes with RNAi (Fig. 6G; Supplemental Fig. S10, Supplemental Source files). We found that prp-8 RNAi substantially reduced the lifespan of wild-type animals, but did not affect that of daf-2 mutants. This result raises the possibility that prp-8 may act upstream of DAF-2 to regulate longevity. We found that RNAi targeting each of the plrg-1/a spliceosome component PLRG1, the pfs-2/a pre-mRNA 3′-end processing protein WDR33, and the F30A10.9/rRNA-processing protein FCF1 ortholog shortened the lifespan of daf-2 mutants by at least 10% greater than that of the wild-type animals (Fig. 6H–K); these effects are similar to that of RNAi targeting daf-16/FOXO, an established longevity-promoting transcription factor acting downstream from the insulin/IGF-1 signaling pathway (Fig. 6G; Supplemental Fig. S10B; Antebi 2007; Kenyon 2010; Murphy and Hu 2013; Altintas et al. 2016). Thus, decelerated down-regulation of RNA-processing components may contribute to delaying physiological aging by daf-2 mutations, possibly through the amelioration of age-dependent transcriptional deregulation.
daf-2 mutations slow age-dependent increases in A3 transcript levels
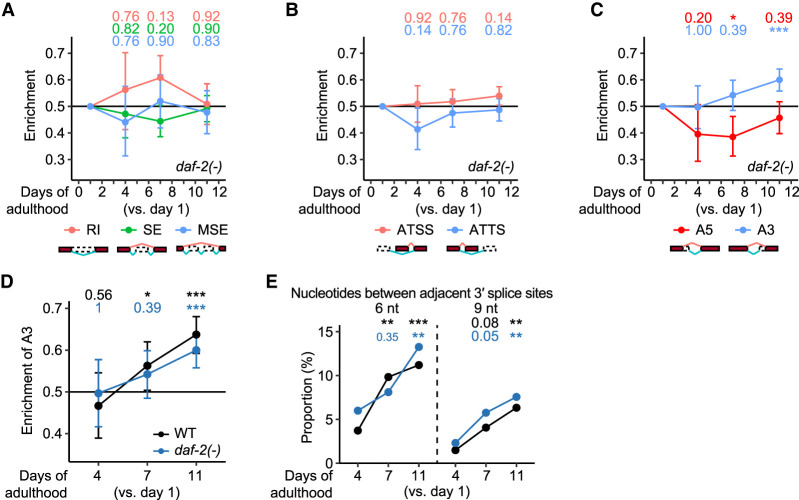
We then compared the age-dependent changes in RNA-processing events, RI, SE, MSE, ATSS, ATTS, A5, and A3, and observed that A3 showed an age-dependent increase (Fig. 7A–C). Importantly, we found that daf-2 mutations decreased the slope of the age-dependent increase in A3 compared with that in wild-type animals (Fig. 7D) as well as A3 isoforms (Supplemental Fig. S11B,C; Supplemental Table S3), in multiple tissues (Supplemental Fig. S12; Kaletsky et al. 2018). In addition, the fraction of the age-dependently up-regulated A3 isoforms increased slowly in aged daf-2 mutants compared with wild-type animals (two-way analysis of variance [ANOVA], age × genotype, P = 0.011). Among the age-dependently up-regulated A3 isoforms in daf-2 mutants, the proportion of the proximal and distal 3′ splice sites separated by 6 nt increased at day 11 of adulthood, compared with those in wild-type animals at day 7 of adulthood (Fig. 7E; Supplemental Fig. S11D). We also found that the distance between the adjacent 3′ splice sites did not increase with age in daf-2 mutants (Supplemental Fig. S11E). In addition, dietary restriction mimetic eat-2 mutations tended to decrease the slope of the age-dependent increase in A3 (Supplemental Fig. S13), based on the analysis of published RNA-seq data (Heintz et al. 2017). These results suggest that age-dependent increases in the A3 usage correlate with physiological aging, using two different longevity paradigms, reduced insulin/IGF-1 signaling and dietary restriction.
Figure 7.
daf-2 mutations slow age-dependent increases in the usage of distal 3′ splice sites in transcript isoforms. (A–C) Enrichment of different RNA-processing events in isoform fractions that were up-regulated among isoform fractions changed during aging in daf-2(e1370) [daf-2(-)] animals. RNA-processing events include retained introns (RI), skipped exons (SE), multiple skipped exons (MSE) (A), alternative transcription start sites (ATSS), alternative transcription termination sites (ATTS) (B), alternative 5′ splice sites (A5), and alternative 3′ splice sites (A3) (C). (D) Enrichment of A3 in isoforms that were up-regulated among isoforms whose fractions changed during aging in wild-type (WT) and daf-2(-) animals. Adjusted P values are shown at the top of the data points, calculated by one-proportion Z-test and adjusted using false discovery rates; (*) adjusted P < 0.1, (**) adjusted P< 0.01, (***) adjusted P < 0.001. Note that results of WT are the same as those used in Figure 2E, and shown here for comparison with those of daf-2(-) animals. (E) Proportion of the proximal and distal 3′ splice sites separated by 6 nt and 9 nt in age-dependently up-regulated A3 isoforms in WT and daf-2(-) animals. P values are shown at the top of the data points, calculated by using two-tailed Fisher's exact test; (*) P < 0.05, (**) P < 0.01, (***) P < 0.001. See Supplemental Figure S11 for detailed analysis results of A3 isoforms in daf-2(-) animals.
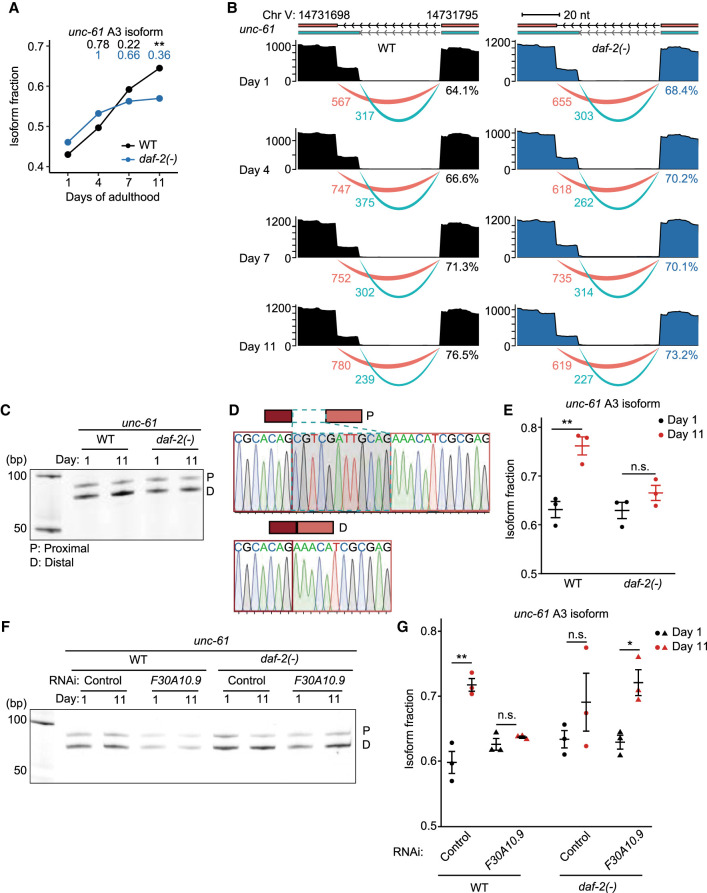
We then focused on characterizing individual A3 isoforms of representative genes, unc-61 and gale-1, whose age-dependent increases were slowed by daf-2 mutations (Fig. 8A,B; Supplemental Fig. S14). We verified the changes in A3 and the products of the usage of proximal and distal 3′ splice sites by using reverse transcription PCR (RT-PCR) followed by Sanger sequencing (see Methods for detail, Fig. 8C–E; Supplemental Fig. S15). In addition, the age-dependent up-regulation of A3 isoforms of gale-1 and unc-61 occurred in germline-defective glp-4 mutants, indicating that the age-associated increase in the A3 usage occurs in somatic tissues (Supplemental Fig. S16). Next, we determined the effect of RNAi targeting F30A10.9, an RNA-processing factor that we showed to be required for the longevity of daf-2 mutants (Fig. 6K), on the A3 of unc-61, which showed more pronounced level changes than those of gale-1 in daf-2 mutants (Fig. 8E; Supplemental Fig. S15C). We found that F30A10.9 RNAi accelerated the age-dependent increases in the A3 of unc-61 in daf-2 mutants (Fig. 8F,G). Together, these data suggest that daf-2 mutations decrease the slope of the age-dependent increases in the A3 usage and A3 isoform levels, which may contribute to changes in physiological aging.
Figure 8.
daf-2 mutations slow age-dependent increases in the usage of distal 3′ splice sites in unc-61. (A) Changes in isoform fraction of unc-61 A3 isoforms during aging in wild-type (WT) and daf-2(e1370) [daf-2(-)] animals. Adjusted P values are shown on top of the data points, calculated relative to day 1 of adulthood data using IsoformSwitchAnalyzeR; (**) adjusted P < 0.01. (B) Aligned reads (top) and junction usage (bottom) of unc-61 (Chr V: 14,731,698–14,731,795) A3 isoforms in WT and daf-2(-) animals at indicated ages. Pink lines represent junctions with distal 3′ splice sites, whereas cyan lines represent those with proximal 3′ splicing sites. Numbers below the lines indicate the numbers of reads aligned at the junctions. Percent numbers represent the ratios of reads at junctions with distal 3′ splicing sites to total reads at junctions with proximal and distal 3′ splicing sites. (C) RT-PCR analysis of the proximal (P) and distal (D) splice sites of unc-61 isoforms at days 1 and 11 of adulthoods. (D) Sequences and electropherograms of the RT-PCR amplicons of unc-61 isoforms. (E) Isoform fraction of unc-61 A3 isoforms that were obtained from three independent RT-PCR experiments. Error bars represent standard error of the mean (SEM). P values were calculated by two-tailed Student's t-test relative to day 1 of adulthood data; (**) P < 0.01, n.s.: not significant. (F) RT-PCR analysis of the P and D splice sites of unc-61 isoforms at days 1 and 11 of adulthoods in control RNAi- and F30A10.9 RNAi-treated animals. (G) Isoform fraction of unc-61 A3 isoforms that were obtained from three independent RT-PCR experiments. Error bars represent standard error of the mean (SEM). P values were calculated by two-tailed Student's t-test relative to day 1 of adulthood data; (*) P < 0.05, (**) P < 0.01, and n.s.: not significant. See Supplemental Source files for statistical analysis of the RT-PCR data shown in this figure and Supplemental Table S4 for primer sequences used in this RT-PCR.
Discussion
Dissecting the difference between chronological and physiological ages at the transcriptomic level is crucial for understanding the molecular mechanisms underlying aging processes. In the current work, we analyzed RNA-seq data using wild-type and long-lived daf-2 mutant C. elegans at four different ages of adulthoods and determined the transcriptomic features that matched chronological and physiological aging. We found that the regulation of structural and functional transcriptome compositions, including intron and intergenic regions, and the majority of ncRNAs, matched chronological aging. We identified several RNA-processing factors whose age-dependent down-regulation was retarded by delayed physiological aging contributed to longevity in daf-2 mutants. We also found that daf-2 mutations decelerated age-dependent increases in the usage of distal 3′ splice sites in transcript isoforms. Overall, our study identified the age-dependent alteration of transcriptomic features that match physiological aging.
Our data suggest that aging is accompanied by a decrease in transcriptional and RNA-processing fidelity. A potential candidate that mediates the transcriptional and RNA-processing fidelity is RNA polymerase II (Pol II), which determines the emergence of splice sites and regulatory elements in nascent transcripts during transcriptional elongation (Bentley 2014; Tellier et al. 2020). A recent study reported that transcriptional elongation speed, regulated by Pol II, increases with age in various organisms, including C. elegans and D. melanogaster (Debès et al. 2019). Fast transcriptional elongation by Pol II reduces the time for proximal suboptimal splicing sequences to recruit the RNA-processing machinery. Thus, fast Pol II-mediated transcriptional elongation in aged organisms may lead to increases in the usage of distal optimal 3′ splice sites over proximal suboptimal 3′ splice sites in A3. It will be crucial to determine whether changes in Pol II elongation speeds at different ages are responsible for the age-dependent changes in A3 usage, with techniques such as in situ single molecule imaging.
We propose an increase in the level of A3 as a novel biomarker of physiological aging. Our analysis identified the increased usage of A3 during aging in both C. elegans and D. melanogaster, suggesting a potential evolutionary conservation. In humans, mutations that affect the recognition of 3′ splice sites occur frequently in patients with myelodysplastic syndromes (Yoshida et al. 2011), which display increased prevalence in the elderly (Ria et al. 2009). An alternative choice of 3′ splice sites increases the diversity and function of transcripts (Kornblihtt et al. 2013). Thus, we speculate that the age-dependent up-regulation of A3, which increases the fraction of usually a major isoform with an optimal splice site, decreases the diversity of transcripts in aged organisms. It will be interesting to test whether A3 is a general or specific biomarker of physiological aging by analyzing more extensive data from multiple species.
Our systematic approach provides crucial transcriptomic information on the difference between chronological and physiological aging. Our study shows that aging is accompanied by impaired transcriptional and RNA-processing fidelity, which is essential for the correct functioning of biological processes. We also propose an increased usage of distal 3′ splice sites for alternative splicing as a novel and evolutionarily conserved transcriptomic biomarker of physiological aging. Lastly, our functional results raise the possibility that several RNA-processing regulators can be used as targets for developing therapeutics against physiological aging and age-related diseases.
Methods
Strains and RNAi clones
All strains were maintained under standard laboratory culture conditions on nematode growth media (NGM) seeded on Escherichia coli OP50. The list of strains and RNAi clones used in this study are described as follows.
Strains: wild-type N2, CF1041 daf-2(e1370) III, SS104 glp-4(bn2ts) I
RNAi plasmids: control, daf-16, F30A10.9, plrg-1, ints-1, R08D7.1, F40F8.11, alkb-8, smu-1, prp-21, C06E1.9, pfs-2, prp-8
RNA library preparation and sequencing
Total RNA was isolated using RNAiso plus (Takara) following the manufacturer's instructions. cDNA library was prepared and paired-end RNA-seq was performed by using Illumina NovaSeq 6000 platform (Macrogen, Inc.). Detailed information is included in “RNA library preparation and sequencing,” “Identification of age-dependently regulated transcripts and terms,” “Analysis of RNA-processing events in age-dependently regulated transcript isoforms,” and “Analysis of transcripts associated with physiological and chronological aging” in the Supplemental Methods.
Lifespan assays
Lifespan assays were performed as described previously with minor modifications (Park et al. 2020). Detailed information is included in “Lifespan assays” in the Supplemental Methods.
Quantitative RT-PCR
Quantitative RT-PCR was performed with Power SYBR Green PCR Master Mix (Thermo Fisher Scientific) using StepOne real-time PCR system (Applied Biosystems, Thermo Fisher Scientific) following the manufacturer's instructions. Detailed information is included in “Quantitative reverse transcription PCR” in the Supplemental Methods.
RT-PCR
RT-PCR was performed with gene-specific primers and 5 μL cDNA from the RT reaction. Detailed information is included in “Reverse transcription PCR” in the Supplemental Methods.
Data access
All raw and processed sequencing data generated in this study have been submitted to the NCBI Gene Expression Omnibus (GEO; https://www.ncbi.nlm.nih.gov/geo/) under accession number GSE190068. All strains or plasmids are available at the Wellcome/CRC Institute at University of Cambridge and Addgene (Addgene ID:186731).
Supplementary Material
Acknowledgments
We thank all Lee laboratory members for comments on the manuscript and discussion. This work was supported by the National Research Foundation of Korea (NRF) grant funded by the Korea government (MSIT) NRF-2019R1A3B2067745 to S.-J.V.L.
Author contributions: S.H. and S.-J.V.L. designed the research. S.P., S.S.K., E.J.E.K., S.K., H.-E.H.P., and Y.J. prepared the samples for RNA-seq. S.H. performed data analyses. S.S.K., S.P., and E.J.E.K. performed quantitative PCR. S.S.K., S.P., E.J.E.K., and S.K. performed lifespan experiments. S.S.K. performed reverse transcription PCR and Sanger sequencing. S.H., S.S.K., S.P., and S.-J.V.L. wrote the manuscript. All authors read and approved the manuscript.
Footnotes
[Supplemental material is available for this article.]
Article published online before print. Article, supplemental material, and publication date are at https://www.genome.org/cgi/doi/10.1101/gr.276515.121.
Competing interest statement
The authors declare no competing interests.
References
- Altintas O, Park S, Lee SJ. 2016. The role of insulin/IGF-1 signaling in the longevity of model invertebrates, C. elegans and D. melanogaster. BMB Rep 49: 81–92. 10.5483/BMBRep.2016.49.2.261 [DOI] [PMC free article] [PubMed] [Google Scholar]
- Amrit FRG, Naim N, Ratnappan R, Loose J, Mason C, Steenberge L, McClendon BT, Wang G, Driscoll M, Yanowitz JL, et al. 2019. The longevity-promoting factor, TCER-1, widely represses stress resistance and innate immunity. Nat Commun 10: 3042. 10.1038/s41467-019-10759-z [DOI] [PMC free article] [PubMed] [Google Scholar]
- Antebi A. 2007. Genetics of aging in Caenorhabditis elegans. PLoS Genet 3: 1565–1571. 10.1371/journal.pgen.0030129 [DOI] [PMC free article] [PubMed] [Google Scholar]
- Bentley DL. 2014. Coupling mRNA processing with transcription in time and space. Nat Rev Genet 15: 163–175. 10.1038/nrg3662 [DOI] [PMC free article] [PubMed] [Google Scholar]
- Budovskaya YV, Wu K, Southworth LK, Jiang M, Tedesco P, Johnson TE, Kim SK. 2008. An elt-3/elt-5/elt-6 GATA transcription circuit guides aging in C. elegans. Cell 134: 291–303. 10.1016/j.cell.2008.05.044 [DOI] [PMC free article] [PubMed] [Google Scholar]
- Cortés-López M, Gruner MR, Cooper DA, Gruner HN, Voda AI, van der Linden AM, Miura P. 2018. Global accumulation of circRNAs during aging in Caenorhabditis elegans. BMC Genomics 19: 8. 10.1186/s12864-017-4386-y [DOI] [PMC free article] [PubMed] [Google Scholar]
- Debès C, Grönke S, Karalay Ö, Tain L, Nakamura S, Hahn O, Weigelt C, Zirkel A, Sofiadis K, Brant L, et al. 2019. Aging-associated changes in transcriptional elongation influence metazoan longevity. bioRxiv 10.1101/719864 [DOI] [PMC free article] [PubMed]
- Ghazi A, Henis-Korenblit S, Kenyon C. 2009. A transcription elongation factor that links signals from the reproductive system to lifespan extension in Caenorhabditis elegans. PLoS Genet 5: e1000639. 10.1371/journal.pgen.1000639 [DOI] [PMC free article] [PubMed] [Google Scholar]
- Ham S, Lee SV. 2020. Advances in transcriptome analysis of human brain aging. Exp Mol Med 52: 1787–1797. 10.1038/s12276-020-00522-6 [DOI] [PMC free article] [PubMed] [Google Scholar]
- Heintz C, Doktor TK, Lanjuin A, Escoubas C, Zhang Y, Weir HJ, Dutta S, Silva-García CG, Bruun GH, Morantte I, et al. 2017. Splicing factor 1 modulates dietary restriction and TORC1 pathway longevity in C. elegans. Nature 541: 102–106. 10.1038/nature20789 [DOI] [PMC free article] [PubMed] [Google Scholar]
- Holdorf AD, Higgins DP, Hart AC, Boag PR, Pazour GJ, Walhout AJM, Walker AK. 2020. WormCat: an online tool for annotation and visualization of Caenorhabditis elegans genome-scale data. Genetics 214: 279–294. 10.1534/genetics.119.302919 [DOI] [PMC free article] [PubMed] [Google Scholar]
- Kaletsky R, Yao V, Williams A, Runnels AM, Tadych A, Zhou S, Troyanskaya OG, Murphy CT. 2018. Transcriptome analysis of adult Caenorhabditis elegans cells reveals tissue-specific gene and isoform expression. PLoS Genet 14: e1007559. 10.1371/journal.pgen.1007559 [DOI] [PMC free article] [PubMed] [Google Scholar]
- Kenyon CJ. 2010. The genetics of ageing. Nature 464: 504–512. 10.1038/nature08980 [DOI] [PubMed] [Google Scholar]
- Kenyon C, Chang J, Gensch E, Rudner A, Tabtiang R. 1993. A C. elegans mutant that lives twice as long as wild type. Nature 366: 461–464. 10.1038/366461a0 [DOI] [PubMed] [Google Scholar]
- Kornblihtt AR, Schor IE, Alló M, Dujardin G, Petrillo E, Muñoz MJ. 2013. Alternative splicing: a pivotal step between eukaryotic transcription and translation. Nat Rev Mol Cell Biol 14: 153–165. 10.1038/nrm3525 [DOI] [PubMed] [Google Scholar]
- LaRocca TJ, Cavalier AN, Wahl D. 2020. Repetitive elements as a transcriptomic marker of aging: evidence in multiple datasets and models. Aging Cell 19: e13167. 10.1111/acel.13167 [DOI] [PMC free article] [PubMed] [Google Scholar]
- Lee Y, Jung Y, Jeong DE, Hwang W, Ham S, Park HH, Kwon S, Ashraf JM, Murphy CT, Lee SV. 2021. Reduced insulin/IGF1 signaling prevents immune aging via ZIP-10/bZIP-mediated feedforward loop. J Cell Biol 220: e202006174. 10.1083/jcb.202006174 [DOI] [PMC free article] [PubMed] [Google Scholar]
- Li CL, Pu M, Wang W, Chaturbedi A, Emerson FJ, Lee SS. 2021. Region-specific H3K9me3 gain in aged somatic tissues in Caenorhabditis elegans. PLoS Genet 17: e1009432. 10.1371/journal.pgen.1009432 [DOI] [PMC free article] [PubMed] [Google Scholar]
- McCarroll SA, Murphy CT, Zou S, Pletcher SD, Chin CS, Jan YN, Kenyon C, Bargmann CI, Li H. 2004. Comparing genomic expression patterns across species identifies shared transcriptional profile in aging. Nat Genet 36: 197–204. 10.1038/ng1291 [DOI] [PubMed] [Google Scholar]
- Murphy CT, Hu PJ. 2013. Insulin/insulin-like growth factor signaling in C. elegans. WormBook 1–43. 10.1895/wormbook.1.164.1 [DOI] [PMC free article] [PubMed] [Google Scholar]
- Murphy CT, McCarroll SA, Bargmann CI, Fraser A, Kamath RS, Ahringer J, Li H, Kenyon C. 2003. Genes that act downstream of DAF-16 to influence the lifespan of Caenorhabditis elegans. Nature 424: 277–283. 10.1038/nature01789 [DOI] [PubMed] [Google Scholar]
- Park S, Artan M, Han SH, Park HH, Jung Y, Hwang AB, Shin WS, Kim KT, Lee SV. 2020. VRK-1 extends life span by activation of AMPK via phosphorylation. Sci Adv 6: eaaw7824. 10.1126/sciadv.aaw7824 [DOI] [PMC free article] [PubMed] [Google Scholar]
- Peck SA, Hughes KD, Victorino JF, Mosley AL. 2019. Writing a wrong: coupled RNA polymerase II transcription and RNA quality control. Wiley Interdiscip Rev RNA 10: e1529. 10.1002/wrna.1529 [DOI] [PMC free article] [PubMed] [Google Scholar]
- Perez-Gomez A, Buxbaum JN, Petrascheck M. 2020. The aging transcriptome: read between the lines. Curr Opin Neurobiol 63: 170–175. 10.1016/j.conb.2020.05.001 [DOI] [PMC free article] [PubMed] [Google Scholar]
- Pu M, Ni Z, Wang M, Wang X, Wood JG, Helfand SL, Yu H, Lee SS. 2015. Trimethylation of Lys36 on H3 restricts gene expression change during aging and impacts life span. Genes Dev 29: 718–731. 10.1101/gad.254144.114 [DOI] [PMC free article] [PubMed] [Google Scholar]
- Pu M, Wang M, Wang W, Velayudhan SS, Lee SS. 2018. Unique patterns of trimethylation of histone H3 lysine 4 are prone to changes during aging in Caenorhabditis elegans somatic cells. PLoS Genet 14: e1007466. 10.1371/journal.pgen.1007466 [DOI] [PMC free article] [PubMed] [Google Scholar]
- Ragle JM, Katzman S, Akers TF, Barberan-Soler S, Zahler AM. 2015. Coordinated tissue-specific regulation of adjacent alternative 3′ splice sites in C. elegans. Genome Res 25: 982–994. 10.1101/gr.186783.114 [DOI] [PMC free article] [PubMed] [Google Scholar]
- Rangaraju S, Solis GM, Thompson RC, Gomez-Amaro RL, Kurian L, Encalada SE, Niculescu AB III, Salomon DR, Petrascheck M. 2015. Suppression of transcriptional drift extends C. elegans lifespan by postponing the onset of mortality. eLife 4: e08833. 10.7554/eLife.08833 [DOI] [PMC free article] [PubMed] [Google Scholar]
- Ria R, Moschetta M, Reale A, Mangialardi G, Castrovilli A, Vacca A, Dammacco F. 2009. Managing myelodysplastic symptoms in elderly patients. Clin Interv Aging 4: 413–423. 10.2147/CIA.S5203 [DOI] [PMC free article] [PubMed] [Google Scholar]
- Riedel CG, Dowen RH, Lourenco GF, Kirienko NV, Heimbucher T, West JA, Bowman SK, Kingston RE, Dillin A, Asara JM, et al. 2013. DAF-16 employs the chromatin remodeller SWI/SNF to promote stress resistance and longevity. Nat Cell Biol 15: 491–501. 10.1038/ncb2720 [DOI] [PMC free article] [PubMed] [Google Scholar]
- Schmeisser S, Priebe S, Groth M, Monajembashi S, Hemmerich P, Guthke R, Platzer M, Ristow M. 2013. Neuronal ROS signaling rather than AMPK/sirtuin-mediated energy sensing links dietary restriction to lifespan extension. Mol Metab 2: 92–102. 10.1016/j.molmet.2013.02.002 [DOI] [PMC free article] [PubMed] [Google Scholar]
- Sen P, Dang W, Donahue G, Dai J, Dorsey J, Cao X, Liu W, Cao K, Perry R, Lee JY, et al. 2015. H3K36 methylation promotes longevity by enhancing transcriptional fidelity. Genes Dev 29: 1362–1376. 10.1101/gad.263707.115 [DOI] [PMC free article] [PubMed] [Google Scholar]
- Son HG, Seo M, Ham S, Hwang W, Lee D, An SW, Artan M, Seo K, Kaletsky R, Arey RN, et al. 2017. RNA surveillance via nonsense-mediated mRNA decay is crucial for longevity in daf-2/insulin/IGF-1 mutant C. elegans. Nat Commun 8: 14749. 10.1038/ncomms14749 [DOI] [PMC free article] [PubMed] [Google Scholar]
- Stegeman R, Weake VM. 2017. Transcriptional signatures of aging. J Mol Biol 429: 2427–2437. 10.1016/j.jmb.2017.06.019 [DOI] [PMC free article] [PubMed] [Google Scholar]
- Stroustrup N, Anthony WE, Nash ZM, Gowda V, Gomez A, López-Moyado IF, Apfeld J, Fontana W. 2016. The temporal scaling of Caenorhabditis elegans ageing. Nature 530: 103–107. 10.1038/nature16550 [DOI] [PMC free article] [PubMed] [Google Scholar]
- Tarkhov AE, Alla R, Ayyadevara S, Pyatnitskiy M, Menshikov LI, Shmookler Reis RJ, Fedichev PO. 2019. A universal transcriptomic signature of age reveals the temporal scaling of Caenorhabditis elegans aging trajectories. Sci Rep 9: 7368. 10.1038/s41598-019-43075-z [DOI] [PMC free article] [PubMed] [Google Scholar]
- Tellier M, Maudlin I, Murphy S. 2020. Transcription and splicing: a two-way street. Wiley Interdiscip Rev RNA 11: e1593. 10.1002/wrna.1593 [DOI] [PubMed] [Google Scholar]
- Tepper RG, Ashraf J, Kaletsky R, Kleemann G, Murphy CT, Bussemaker HJ. 2013. PQM-1 complements DAF-16 as a key transcriptional regulator of DAF-2-mediated development and longevity. Cell 154: 676–690. 10.1016/j.cell.2013.07.006 [DOI] [PMC free article] [PubMed] [Google Scholar]
- Tourasse NJ, Millet JRM, Dupuy D. 2017. Quantitative RNA-seq meta-analysis of alternative exon usage in C. elegans. Genome Res 27: 2120–2128. 10.1101/gr.224626.117 [DOI] [PMC free article] [PubMed] [Google Scholar]
- Weigelt CM, Sehgal R, Tain LS, Cheng J, Eßer J, Pahl A, Dieterich C, Grönke S, Partridge L. 2020. An insulin-sensitive circular RNA that regulates lifespan in Drosophila. Mol Cell 79: 268–279.e5. 10.1016/j.molcel.2020.06.011 [DOI] [PMC free article] [PubMed] [Google Scholar]
- Xia X, Wang Y, Yu Z, Chen J, Han JJ. 2021. Assessing the rate of aging to monitor aging itself. Ageing Res Rev 69: 101350. 10.1016/j.arr.2021.101350 [DOI] [PubMed] [Google Scholar]
- Yoshida K, Sanada M, Shiraishi Y, Nowak D, Nagata Y, Yamamoto R, Sato Y, Sato-Otsubo A, Kon A, Nagasaki M, et al. 2011. Frequent pathway mutations of splicing machinery in myelodysplasia. Nature 478: 64–69. 10.1038/nature10496 [DOI] [PubMed] [Google Scholar]
- Zhang P, Judy M, Lee SJ, Kenyon C. 2013. Direct and indirect gene regulation by a life-extending FOXO protein in C. elegans: roles for GATA factors and lipid gene regulators. Cell Metab 17: 85–100. 10.1016/j.cmet.2012.12.013 [DOI] [PMC free article] [PubMed] [Google Scholar]
Associated Data
This section collects any data citations, data availability statements, or supplementary materials included in this article.


