

Abstract
Background
Postinfectious autoimmunity is a hallmark of Guillain-Barré syndrome (GBS), and GBS incidence closely parallels that of its immune triggers. Sociobehavioural interventions implemented during the COVID-19 pandemic have altered the infectious disease landscape.
Methods
This nationwide time-series correlation study analysed GBS incidence, sentinel surveillance and SARS-CoV-2 vaccination data from January 2017 to December 2021 in the National Health Insurance Service and Korean Disease Control and Prevention Agency databases. The incidence of GBS and sentinel gastrointestinal and respiratory infectious diseases during the pandemic (2020–2021) was estimated and compared with both prepandemic (2017–2019) and incidence predicted in a time-series forecasting model. Time-series correlation analysis was used to examine the temporal association between GBS, infectious triggers and SARS-CoV-2 vaccination.
Results
During the pandemic, the total crude cumulative incidence rate was 2.1 per 100 000 population, which is lower than the prepandemic incidence, especially in age groups of less than 60 years. Seasonality was briefly interrupted during the winter of 2021. The majority of respiratory and some gastrointestinal conditions had a lower-than-expected incidence during the pandemic. Compared with the prepandemic state, during the pandemic period a higher number of gastrointestinal pathogens (Escherichia coli, Campylobacter spp., Clostridium perfringens, Yersinia enterocolitica and enteric adenovirus) had significant, moderate-to-strong positive temporal associations with GBS. The temporal association between SARS-CoV-2 infection and GBS was not significant, but SARS-CoV-2 vaccination exhibited a strong positive temporal association with GBS in 2021.
Conclusion
The incidence of GBS and sentinel infectious diseases decreased to below-expected levels during the pandemic, with the former attributable to the decreased incidence of non-COVID-19 respiratory and gastrointestinal infections. The evolving incidence of autoimmune postinfectious phenomena following the pandemic needs attention.
Keywords: Guillain-Barre syndrome, COVID-19, infectious diseases, neuroepidemiology
WHAT IS ALREADY KNOWN ON THIS TOPIC
A lower incidence of Guillain-Barré syndrome (GBS) and decreased number of diagnoses in respiratory and gastrointestinal infections during the COVID-19 pandemic have each been independently documented in the literature. However, only limited number of researches describe the real-world correlation between the two trends.
WHAT THIS STUDY ADDS
The actual pandemic incidence of GBS was lower than both the prepandemic rates and the forecasted estimates in 2020. Marked decrease in sentinel respiratory infectious diseases was associated with the downward incidence trend, while gastrointestinal infections became the main drivers of GBS during pandemic period.
HOW THIS STUDY MIGHT AFFECT RESEARCH, PRACTICE OR POLICY
Our research supports the utilisation of time-series analysis for tracking down evolving incidence of postinfectious autoimmune phenomena, with a focus on the current source of pandemic itself and its collateral findings and related public health measures.
Introduction
Until August 2022, more than 590 million confirmed COVID-19 cases have been reported worldwide.1 Despite the diminished speed of contagion and less disease severity following mass vaccination campaigns, regional-to-national scale outbreaks continue to occur, and the number of confirmed cases increases continually. The Guillain-Barré syndrome (GBS) is an acute-onset monophasic autoimmune polyradiculoneuropathy that is generally accepted as being mediated by molecular mimicry between immune stimuli and membrane proteins on the myelin sheath or axon of a neuron.2 Although not exclusively a postinfectious phenomenon, GBS has frequently been associated with diverse mucosal barrier-disrupting respiratory and gastrointestinal infections,3 4 predominantly between Campylobacter jejuni and the anti-GM1 ganglioside antibody-positive acute motor axonal neuropathy subtype of GBS.5 More recent associations of infections with GBS include the Zika virus, following an outbreak in 2016,6 and the SARS-CoV-2 following the COVID-19 pandemic in 2020–2021.7 Furthermore, vaccination may play a role in the pathogenesis of this rare autoimmune disease.8
Seasonality is an epidemiological hallmark of GBS, presumably due to the seasonal trend of potential immune triggers,9 and seasonal patterns of GBS vary significantly by geographical location. This variability has been attributed to regional differences in the seasonality of the prevalent prodromal infectious disease triggers. In South Korea, GBS has consistently had a peak incidence in the late spring to summer months, similar to that in the summer peaks in the Indian subcontinent, Latin America and Northern China, whereas winter peaks are observed in Western countries and in the Middle East.10 11
During the ongoing COVID-19 pandemic, the prevalence of non-COVID-19 infectious diseases has significantly decreased.12 Therefore, determining changes in GBS incidence during this period of upheaval is important because the prodromal infectious disease landscape has drastically changed during the years of the pandemic with the number of non-pharmacological interventions (NPIs) that were implemented by the government. Nevertheless, no study has focused specifically on the time-series correlation between common infectious diseases and GBS incidence during the pandemic era.
To bridge the gap between the changes in non-COVID-19 infectious disease landscape and the actual incidence of GBS during the pandemic, in this study, we aimed to: (1) reinforce a comparative understanding of the pandemic versus prepandemic epidemiological distribution and seasonality of GBS incidence, (2) compare the forecasted values of GBS incidence with actual observed values during the pandemic and (3) reveal the temporal association between the incidence of GBS and common respiratory and gastrointestinal infections, which are potential triggers for GBS. Furthermore, in order to assess the impact of recently emerging factors, we also aimed to reveal the temporal association between GBS, SARS-CoV-2 infection and SARS-CoV-2 vaccination during the pandemic.
Methods
Study design
We conducted a stepwise nationwide time-series correlation study from 2017 to 2021 using data collected from National Health Insurance Service (NHIS) and Korea Disease Control and Prevention Agency (KDCA) database to compare and analyse the GBS incidence from the pre-COVID-19 pandemic (2017–2019) era to the COVID-19 pandemic (2020–2021) era. Furthermore, we ascertained the incidence of non-COVID-19 respiratory and gastrointestinal infectious diseases and their time-series correlation with that of GBS.
Data collection: NHIS database
Nationwide data on patients with a diagnosis of new-onset GBS, who were hospitalised or received outpatient treatment from January 2017 to December 2021, were obtained from the NHIS database. Among patients with a principal diagnosis of GBS (International Classification of Diseases, ICD-10: G61.0; n=5794), 3641 and 2153 cases occurred during the pre-pandemic (2017–2019) and the pandemic (2020–2021) periods, respectively (figure 1). Demographic data, including age and sex, were obtained from the identical data source.
Figure 1.

Flow diagram of study participants. KDCA, Korea Disease Control and Prevention Agency.
Data collection: KDCA database – sentinel surveillance pathogens, SARS-CoV-2 infection and SARS-CoV-2 vaccination
The weekly KDCA sentinel surveillance system data from week 1 in 2017 to week 52 in 2021 were collected and consisted of mandatorily reported cases of communicable diseases caused by specified pathogens from 200 predesignated hospitals across 17 different cities and provinces in South Korea. The database covers a broad category of 23 infectious diseases that are attributable to ongoing or potential outbreaks, collectively termed the ‘Group 4 infectious diseases’ under the Infectious Disease Control and Prevention Act (ie, sexually transmitted, endemic or overseas parasitic, acute respiratory, gastrointestinal and drug-resistant illnesses). The incidence of each infectious disease was updated using the weekly reports. The viral and bacterial agents under national surveillance selected for our study included 10 respiratory agents (Mycoplasma pneumoniae, Chlamydia pneumoniae, adenovirus, human bocavirus, parainfluenza virus, respiratory syncytial virus, rhinovirus, human coronavirus, human metapneumnovirus and influenza virus) and 14 gastrointestinal (Salmonella spp., Vibrio parahaemolyticus, pathogenic Escherichia coli, Campylobacter spp., Clostridium perferingens, Staphylococcus aureus, Bacillus cereus, Yersinia enterocolitica, Listeria monocytogenes, group A rotavirus, astrovirus, enteric adenovirus, norovirus and sapovirus) pathogens. The reported values from the weekly reports were reconstructed for use as monthly data.
Additionally, the nationwide SARS-CoV-2 infection data from January 2020 to December 2021 and SARS-CoV-2 vaccination status from February 2021 to December 2021 were extracted from the KDCA database for further analyses (figure 1).
Statistical analysis
In this study, the total sex-specific and age-specific crude cumulative incidence rate (CIR) and its seasonal distribution were calculated per 100 000 population for the prepandemic (2017–2019) and pandemic (2020–2021) periods. Moreover, we estimated the total, sex, age and season-specific standard morbidity ratio (SMR) for GBS. SMR was calculated as the ratio of the index (observed) value to the reference (expected) value. The reference period from January 2017 to December 2019 provided the expected incidence before the spread of SARS-CoV-2. The 95% CIs for CIR and SMR were estimated using Byar’s approximation method.13
For time-series analysis, the Holt-Winters exponential smoothing model was selected,14 based on the baseline prepandemic (2017–2019) estimates, to forecast the expected incidence and 95% prediction intervals of GBS and infectious disease under sentinel surveillance during the pandemic (2021–2021) period. We used an additive model for GBS because the seasonal variation was relatively constant over time. For infectious diseases caused by sentinel surveillance pathogens, the multiplicative model was more suitable owing to the increase in seasonal variation over time; log transformation was implemented to obtain a constant residual variance, and the time-series linear regression was used for further analysis. The OR between the expected (forecasted) value and observed value (number of reported GBS or infectious disease cases) was used for comparison. The OR, not including 1.0, was considered to be clinically significant at the 5% level.
The temporal association between GBS and sentinel surveillance pathogens, SARS-CoV-2 infection and SARS-CoV-2 vaccination was determined using Pearson’s correlation analysis for data collected during the prepandemic (2017–2019) and pandemic (2020–2021) periods. The degree of correlation followed a conventional paradigm (weak: 0.10≤r <0.30, moderate: 0.30≤r < 0.50 and strong: r≥0.50).15
Data analysis was performed using R statistical software (V.4.1.2; R Core Team 2021). The R Holt-Winters filtering package contains parameters for optimal values of level, trend and seasonality, which were used for statistical analysis in this study.16 17
Results
Incidence of GBS in the prepandemic (2017–2019) versus pandemic (2020–2021) periods
The total prepandemic (2017–2019) CIR was 2.4 per 100 000 population, whereas during the pandemic (2020–2021) period, the CIR was 2.1 per 100 000 population, which indicates a statistically significant lower incidence than was expected (SMR: 0.88; 95% CI 0.83 to 0.94). Moreover, the sex-specific CIR showed a lower-than-expected incidence in both sexes (SMR: 0.88; 95% CI 0.82 to 0.95; men: 0.89; 95% CI 0.80 to 0.97). However, the male-to-female ratio was maintained, with minimal change at the 1.5–1.6 level. The age-specific CIR was lower than expected for most age groups below 60 years, whereas in age groups of 60 years or more showed equivocal or increased SMR during the pandemic (2020–2021) period. A statistically significant decrease was detected for age groups <10, 10–19, 30–39, 40–49 and 50–59 years. With regard to the seasonal distribution, spring and winter seasonal occurrences were lower than expected (SMR: 0.72; 95% CI 0.63 to 0.82; SMR: 0.79; 95% CI 0.69 to 0.89) during the pandemic (2020–2021) period (table 1).
Table 1.
Sex-specific and age-specific crude cumulative incidence and seasonal distribution of Guillain-Barré syndrome during the prepandemic (2017–2019) and pandemic (2020–2021) periods
| 2017–2019 | 2020–2021 | SMR‡ (95% CI) | |
| CIR* (95% CI) | CIR (95% CI) | ||
| Total | 2.4 (2.22 to 2.49) | 2.1 (1.96 to 2.21) | 0.88 (0.83 to 0.94)* |
| Sex | |||
| Male | 2.8 (1.47 to 3.06) | 2.5 (2.33 to 2.72) | 0.88 (0.82 to 0.95)* |
| Female | 1.9 (1.70 to 2.04) | 1.6 (1.49 to 1.81) | 0.89 (0.80 to 0.97)* |
| M:F ratio | 1.5 | 1.6 | |
| Age, years | |||
| <10 | 2.2 (1.57 to 2.89) | 1.2 (0.76 to 1.80) | 0.56 (0.37 to 0.82)* |
| 10–19 | 1.8 (1.40 to 2.31) | 1.1 (0.78 to 1.48) | 0.60 (0.43 to 0.81)* |
| 20–29 | 1.6 (1.31 to 1.93) | 1.4 (1.12 to 1.67) | 0.86 (0.69 to 1.04) |
| 30–39 | 1.5 (1.26 to 1.79) | 1.3 (1.02 to 1.51) | 0.82 (0.67 to 0.99)* |
| 40–49 | 1.9 (1.56 to 2.17) | 1.3 (1.03 to 1.54) | 0.69 (0.56 to 0.83)* |
| 50–59 | 3.2 (2.83 to 3.69) | 2.7 (2.28 to 3.08) | 0.82 (0.71 to 0.95)* |
| 60–69 | 3.5 (3.02 to 3.92) | 3.8 (3.37 to 4.33) | 1.10 (0.97 to 1.25) |
| 70–79 | 3.8 (3.27 to 4.42) | 3.7 (3.19 to 4.29) | 0.97 (0.83 to 1.12) |
| ≥80 | 2.0 (1.57 to 2.53) | 2.4 (1.97 to 2.98) | 1.21 (0.97 to 1.48) |
| Seasons§ | |||
| Spring | 0.6 (0.53 to 0.67) | 0.4 (0.38 to 0.49) | 0.72 (0.63 to 0.82)* |
| Summer | 0.7 (0.61 to 0.75) | 0.7 (0.61 to 0.76) | 1.01 (0.90 to 1.11) |
| Autumn | 0.5 (0.43 to 0.56) | 0.5 (0.45 to 0.57) | 1.03 (0.91 to 1.16) |
| Winter | 0.6 (0.52 to 0.65) | 0.5 (0.40 to 0.52) | 0.79 (0.69 to 0.89)* |
Statistical significance was set at *p<0.05.
†Crude CIR was calculated per 100 000 population.
‡The standardised morbidity ratio was calculated as (2020–2021 mean CIR)/(2017–2019 mean CIR).
§Spring: March–May; summer: June–August; autumn: September–November; winter: December–February.
CIR, cumulative incidence rate; SMR, standardised morbidity ratio.
Real-world GBS incidence during the pandemic period (2020–2021) versus forecasted estimates
The observed incidence of GBS was lower than the expected incidence in 2020 (rate ratio: 0.83; 95% CI 0.62 to 1.27), but the difference was not statistically significant. However, when ascertained by month, the rate ratio of observed versus expected values was significantly low from February to December 2020 with a statistically significant decline from March to May 2020 (rate ratios: 0.56, 0.67 and 0.68, respectively). Moreover, GBS incidence was lower than expected in 2021 (rate ratio: 0.95; 95% CI 0.67 to 1.65) but was also not statistically significant. Nevertheless, when analysed month-wise, the observed incidence was lower than expected through January–May, October and December 2021, although a statistically significant decline was observed only in January (rate ratio: 0.53; 95% CI 0.39 to 0.83; table 2; figure 2).
Table 2.
The cumulative frequency and rate ratio of incident Guillain–Barré syndrome during the COVID–19 pandemic period (2020–2021) were compared with values that were forecasted based on the incidence in the prepandemic period (2017–2019)
| 2020 | Number of patients | Rate ratio (95% CI) | 2021 | Number of patients | Rate ratio (95% CI) | ||
| Observed | Expected | Observed | Expected | ||||
| Total | 1001 | 1200 | 0.83 (0.62 to 1.27) | Total | 1152 | 1208 | 0.95 (0.67 to 1.64) |
| January | 110 | 107 | 1.03 (0.80 to 1.44) | January | 57 | 108 | 0.53 (0.39 to 0.83)* |
| February | 81 | 83 | 0.98 (0.71 to 1.57) | February | 65 | 84 | 0.78 (0.53 to 1.48) |
| March | 50 | 89 | 0.56 (0.41 to 0.88)* | March | 80 | 90 | 0.89 (0.62 to 1.61) |
| April | 66 | 99 | 0.67 (0.50 to 0.96)* | April | 75 | 99 | 0.76 (0.54 to 1.28) |
| May | 76 | 111 | 0.68 (0.52 to 0.98)* | May | 100 | 112 | 0.89 (0.65 to 1.42) |
| June | 104 | 120 | 0.87 (0.68 to 1.22) | June | 123 | 120 | 1.02 (0.76 to 1.57) |
| July | 108 | 117 | 0.92 (0.71 to 1.31) | July | 137 | 118 | 1.16 (0.85 to 1.81) |
| August | 111 | 115 | 0.97 (0.74 to 1.41) | August | 122 | 115 | 1.06 (0.77 to 1.69) |
| September | 60 | 73 | 0.82 (0.55 to 1.63) | September | 113 | 74 | 1.53 (0.96 to 3.77) |
| October | 78 | 89 | 0.88 (0.62 to 1.50) | October | 85 | 90 | 0.95 (0.63 to 1.88) |
| November | 77 | 92 | 0.84 (0.59 to 1.42) | November | 112 | 93 | 1.21 (0.81 to 2.35) |
| December | 80 | 106 | 0.76 (0.56 to 1.19) | December | 83 | 106 | 0.78 (0.55 to 1.36) |
Statistical significance was set at *p<0.05.
Figure 2.
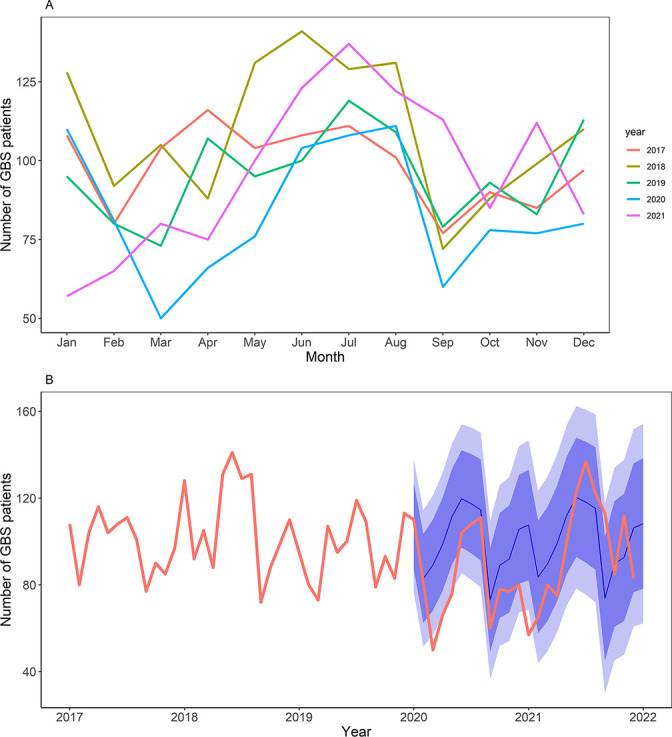
The trailing GBS incidence from 2017 to 2021. (A) Overlaid time-series plots; general decrease of incidence was detected from March to May 2020, compared with respective periods in 2017~2019; the winter peak was diminished in January, 2021, compared with the same month in 2017~2019. Each colour matches the year indicated in the graph. (B) Continuous time-series plot; the bold red line indicates the real-world observed incidence, blue line indicates the predicted incidence and darker and lighter blue shades denote 95% and 80% CI of the predicted incidence, respectively. GBS, Guillain-Barré syndrome.
Real-world incidence of non-COVID-19 respiratory and gastrointestinal infections during the pandemic period (2020–2021) versus forecasted estimates
Among respiratory infectious diseases listed under sentinel surveillance, a significantly lower incidence was found for most of the specified pathogens (M. pneumoniae, C. pneumoniae, adenovirus, human bocavirus, parainfluenza virus, respiratory syncytial virus, rhinovirus and human coronavirus) than the forecasted estimates. This tendency persisted through 2021, with only minor changes: the incidence of human bocavirus was no longer significantly lower than expected, whereas the incidence of influenza virus was significantly lower than expected. Among the gastrointestinal infectious diseases under sentinel surveillance, a significantly lower incidence was found for several specified viral pathogens (enteric adenovirus, astrovirus and sapovirus). However, in 2021, the incidence of enteric adenovirus and astrovirus was equivocal compared with forecasted estimates, and the incidence of V. parahaemolyticus was significantly lower than expected (table 3; figures 3 and 4).
Table 3.
Cumulative frequency and rate ratio of common respiratory and gastrointestinal infectious diseases detected under sentinel surveillance during the pandemic period (2020–2021), compared with values forecasted based on the values from the prepandemic period (2017–2019)
| Mode of infection | Specific pathogen | 2020 | 2021 | ||||
| n=38 557 | Rate ratio (95% CI) | n=34 224 | Rate ratio (95% CI) | ||||
| Observed | Expected | Observed | Expected | ||||
| Respiratory infectious disease | Mycoplasma | 4004 | 25 745 | 0.16 (0.10 to 0.38)* | 1258 | 28 669 | 0.04 (0.02 to 0.63)* |
| Chlamydia | 175 | 498 | 0.35 (0.24 to 0.64)* | 184 | 597 | 0.31 (0.20 to 0.65)* | |
| Adenovirus | 2283 | 20 991 | 0.11 (0.06 to 0.34)* | 1089 | 27 317 | 0.04 (0.02 to 0.38)* | |
| Human bocavirus | 1309 | 6768 | 0.19 (0.10 to 0.53)* | 3215 | 7482 | 0.43 (0.22 to 1.12) | |
| Parainfluenza virus | 707 | 14 712 | 0.05 (0.03 to 0.10)* | 4406 | 16 708 | 0.26 (0.18 to 0.50)* | |
| Respiratory syncytial virus | 4390 | 12 405 | 0.35 (0.16 to 0.92)* | 742 | 14 972 | 0.05 (0.02 to 0.26)* | |
| Rhinovirus | 7307 | 33 551 | 0.22 (0.17 to 0.31)* | 6918 | 37 427 | 0.18 (0.15 to 0.25)* | |
| Human coronavirus | 782 | 8180 | 0.10 (0.04 to 0.29)* | 34 | 9204 | 0.00 (0.00 to 0.01)* | |
| Human metapneumnovirus | 3303 | 5160 | 0.64 (0.17 to 4.43) | 126 | 6592 | 0.02 (0.01 to 5.38) | |
| Influenza virus | 347 | 857 | 0.40 (0.20 to 1.12) | 99 | 952 | 0.10 (0.05 to 0.28)* | |
| Gastrointestinal infectious disease | Salmonella spp. | 1939 | 2801 | 0.69 (0.48 to 1.23) | 2998 | 2977 | 1.01 (0.70 to 1.75) |
| Vibrio parahaemolyticus | 55 | 173 | 0.32 (0.13 to 1.05) | 61 | 202 | 0.30 (0.13 to 0.95)* | |
| Pathogenic Escherichia coli | 169 | 267 | 0.63 (0.35 to 1.76) | 452 | 309 | 1.46 (0.86 to 3.63) | |
| Campylobacter spp. | 3435 | 4393 | 0.78 (0.42 to 1.86) | 3367 | 5686 | 0.59 (0.25 to 2.72) | |
| Clostridium perfringens | 3146 | 4367 | 0.72 (0.49 to 1.30) | 3150 | 5166 | 0.61 (0.36 to 1.80) | |
| Yersinia enterocolitica | 108 | 154 | 0.70 (0.42 to 2.23) | 148 | 182 | 0.81 (0.51 to 1.93) | |
| Norovirus | 3219 | 4985 | 0.65 (0.27 to 2.21) | 4078 | 5832 | 0.70 (0.20 to 9.85) | |
| Group A rotavirus | 1416 | 2439 | 0.58 (0.21 to 1.80) | 1053 | 2355 | 0.45 (0.09 to 7.09) | |
| Enteric adenovirus | 201 | 597 | 0.34 (0.18 to 0.64)* | 379 | 370 | 1.03 (0.21 to 5.91) | |
| Astrovirus | 192 | 362 | 0.53 (0.24 to 0.91)* | 400 | 251 | 1.59 (0.35 to 3.54) | |
| Sapovirus | 70 | 1016 | 0.07 (0.05 to 0.12)* | 67 | 1645 | 0.04 (0.03 to 0.06)* | |
Specific pathogens with monthly averages of less than 10 cases were omitted from the table (S. aureus, B. cereus, L. monocytogenes); *p<0.05 was considered statistically significant.
Figure 3.
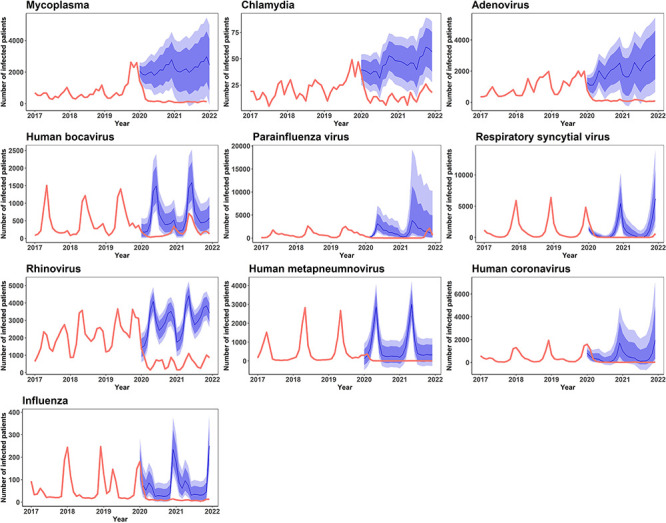
The real-world incidence of respiratory infectious disease from 2020 to 2021 versus estimated incidence projections based on 2017–2019 incidence data. The bold red lines denote the observed incidence, blue line the expected incidence, darker and lighter blue shades 95% and 80% CI of the predicted incidence, respectively.
Figure 4.
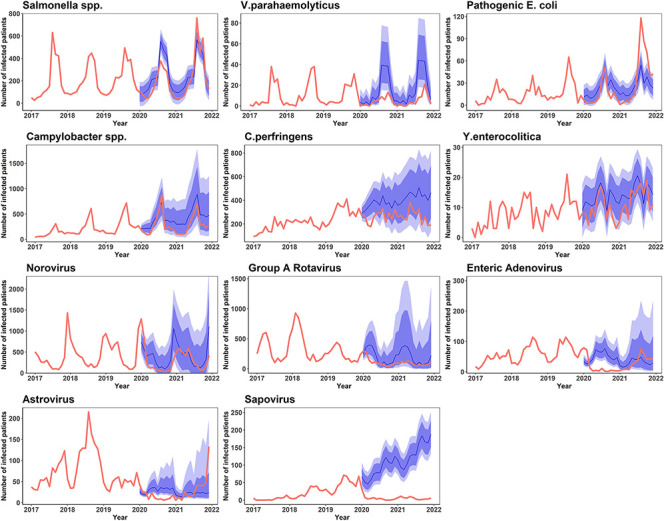
The real-world incidence of gastrointestinal infectious disease from 2020 to 2021 versus estimated incidence projections based on 2017–2019 incidence data. The bold red lines denote the observed incidence, blue line the expected incidence, darker and lighter blue shades 95% and 80% CI of the predicted incidence, respectively.
Time-series correlation analysis of the prepandemic (2017–2019) and pandemic (2020–2021) incidence of GBS and sentinel surveillance pathogens
We performed a Pearson correlation analysis to analyse the time-series association between GBS and infectious diseases caused by the sentinel surveillance pathogens during the prepandemic (2017–2019) and pandemic (2020–2021) periods. Among respiratory pathogens, human bocavirus (r=0.46, p=0.004) and parainfluenza virus (r=0.38, p=0.019) showed a significant, moderate positive temporal association with GBS incidence trends during the prepandemic (2017–2019) period. However, during the pandemic (2020–2021) period, no significant temporal association was detected for respiratory infectious disease pathogens. Among gastrointestinal pathogens, only Campylobacter spp. (r=0.36, p=0.027) showed a statistically significant, moderately positive temporal association with GBS trends during the prepandemic (2017–2019) period. However, during the pandemic period (2020–2021), pathogenic E. coli, Campylobacter spp., C. perfringens, Y. enterocolitica and enteric adenovirus all showed statistically significant, moderate-to-strong positive temporal associations with GBS trends (r=0.63, p<0.001; r=0.74, p<0.001; r=0.42, p=0.045; r=0.74, p<0.001; r=0.5, p=0.010; table 4).
Table 4.
Summary of time–series correlation analyses between Guillain-Barré syndrome and specific respiratory and gastrointestinal infectious disease pathogens in the prepandemic (2017–2019) and pandemic (2020–2021) eras
| Mode of infection | Specific pathogen | 2017–2019 | 2020–2021 | ||
| R | P value | R | P value | ||
| Respiratory infectious disease | Mycoplasma | −0.08 | 0.653 | −0.11 | 0.628 |
| Chlamydia | −0.14 | 0.405 | 0.22 | 0.324 | |
| Adenovirus | 0.03 | 0.871 | 0.02 | 0.926 | |
| Human bocavirus | 0.46 | 0.004 | 0.38 | 0.077 | |
| Parainfluenza virus | 0.38 | 0.019 | 0.15 | 0.502 | |
| Respiratory syncytial virus | −0.04 | 0.823 | −0.16 | 0.460 | |
| Rhinovirus | 0.00 | 0.977 | 0.41 | 0.052 | |
| Human coronavirus | 0.23 | 0.174 | −0.14 | 0.510 | |
| Human metapneumnovirus | 0.13 | 0.437 | −0.18 | 0.421 | |
| Influenza virus | 0.21 | 0.218 | −0.17 | 0.437 | |
| Gastrointestinal infectious disease | Salmonella spp. | −0.13 | 0.444 | 0.56 | 0.005 |
| Vibrio parahaemolyticus | −0.25 | 0.133 | 0.26 | 0.229 | |
| Pathogenic Escherichia coli | 0.14 | 0.416 | 0.63 | <0.001 | |
| Campylobacter spp. | 0.36 | 0.027 | 0.74 | <0.001 | |
| Clostridium perfringens | 0.12 | 0.492 | 0.42 | 0.045 | |
| Yersinia enterocolitica | 0.20 | 0.238 | 0.74 | <0.001 | |
| Norovirus | −0.18 | 0.753 | −0.18 | 0.399 | |
| Group A rotavirus | 0.05 | 0.624 | −0.31 | 0.155 | |
| Enteric adenovirus | 0.08 | 0.131 | 0.50 | 0.010 | |
| Astrovirus | 0.25 | 0.118 | 0.11 | 0.620 | |
| Sapovirus | 0.26 | 0.977 | –0.13 | 0.550 | |
| COVID-19 related | SARS-CoV-2 infection | – | – | 0.23 | 0.299 |
| SARS-CoV-2 vaccination | – | – | 0.55 | 0.006 | |
Statistical significance was set at p<0.05.
r, Pearson’s correlation coefficient.
Time-series correlation analysis of the pandemic (2020–2021) incidence of GBS versus SARS-CoV-2 infection and SARS-CoV-2 vaccination
We performed a Pearson correlation analysis to analyse the time-series association between GBS, SARS-CoV-2 infection and SARS-CoV-2 vaccination. No significant temporal association was found between SARS-CoV-2 infection and GBS from 2020 to 2021 (r=0.23, p=0.299). However, SARS-CoV-2 vaccination showed strong positive temporal association with GBS trends in 2021 (r=0.55, p=0.006).
Discussion
We performed a nationwide cross-sectional correlational study featuring 5794 GBS cases from the prepandemic (2017–2019) and pandemic (2020–2021) periods. Specifically, we examined the demographic distribution and seasonality of GBS, compared the real-world incidence of GBS with the forecasted trajectory based on the prepandemic incidence data and evaluated the temporal association between the time-series trends of common infectious diseases and GBS. This study is the first to integrate temporal changes in the incidence of GBS and common respiratory and gastrointestinal infectious diseases during the pandemic era. The key findings of this study are as follows: (1) in general, older adults and men showed a higher incidence of GBS, although differences in certain age groups and interruption of seasonality were detected during the pandemic; (2) the actual incidence of GBS was lower than the forecasted estimates in 2020, and a statistically significant decrease in common respiratory and gastrointestinal infectious diseases was temporally associated with the downward incidence trend; and (3) the actual GBS incidence in 2021 was higher than the forecasted estimates in 2021, although the infectious disease landscape did not change significantly from that in 2020.
First, with regard to demographic factors, a higher incidence of GBS was detected in older adults and men during the COVID-19 pandemic, which is consistent with the results of prepandemic large-scale epidemiological studies.18 19 Notably, compared with the prepandemic incidence, the GBS incidence during the pandemic was lower than expected across most age groups below 60 years, which may be attributable to socioeconomic and behavioural changes during the pandemic. Specifically, age groups 30–39, 40–49 and 50–59 years comprised nearly 65% of the economically active age groups in 2020–2021 and were responsible for the most intimate workplace human–human interactions. We postulated that policy measures such as lockdowns, increase in at-home workforce and NPIs collectively influenced the incidence of community-based infections that originally spread via contact, droplets or airborne modes of transmission, and these subsequently contributed to a decline in postinfectious GBS. Similarly, younger age groups (<10 years old and ages 10–19 years, which represent the school-age population) underwent a drastic transition from regular schooling to online schooling during the early to-mid pandemic period, preventing their excessive exposure to many community pathogens. Second, a brief interruption in the seasonal pattern of GBS was observed during the pandemic. Previous longitudinal epidemiological studies on GBS incidence in South Korea have suggested a peak incidence in the late spring to summer months.10 However, in our analysis, we observed a double peak during the prepandemic era: from late spring to summer and in the winter months. Although the late spring to summer peak was maintained during the pandemic period, likely due to a lesser decrease in gastrointestinal infections (especially from bacterial pathogens), the winter peak diminished in 2021, likely due to a substantial decrease in the outbreak of respiratory infections, which mostly tended to have a peak incidence during the winter in South Korea (figure 2A and table 1).
The incidence of GBS was significantly lower in 2020 than the forecasted estimates based on the prepandemic (2017–2019) incidence data. We hypothesised that this was due to a decrease in non-COVID-19 infectious triggers during the COVID-19 pandemic. A potential link between SARS-CoV-2 infection and GBS has been suggested in a systematic review, where sevenfold to eightfold increased prevalence of GBS has been reported in patients with COVID-19, compared with the general population rates.20 At a population level, however, previous epidemiological studies have indicated a rather decreased incidence of GBS overall during the pandemic.21 Additionally, a study based on the diagnoses of alleged infectious aetiology showed that respiratory and gastrointestinal infectious diseases have significantly decreased during the pandemic period.12 Therefore, we inferred that the change in the incidence of non-COVID-19 infectious disease may have exhibited a close temporal association with the changes in GBS incidence during the pandemic months.
The incidence of common non-COVID-19 respiratory and gastrointestinal infections that were evaluated from sentinel surveillance data were significantly lower than expected during the pandemic era. This finding may be attributable to the effect of NPIs that were implemented at a national level from as early as 6 May 2020, to mitigate SARS-CoV-2 spread22 23; mask wearing may have effectively decreased respiratory pathogen spread23; and hand hygiene may have prevented the spread of gastrointestinal pathogens.24 The lockdowns prevented social gatherings and eating out, thus limiting the spread of communicable diseases.25 Notably, there was a significant decrease in almost all respiratory sentinel surveillance pathogens from 2020 to 2021. In contrast, only a few gastrointestinal pathogens showed a significant decrease during the same period. With regard to the time-series correlation analyses for infectious diseases, respiratory pathogens, human bocavirus and parainfluenza virus showed a significant positive correlation with the incidence of GBS, whereas only Campylobacter spp. showed a significant positive correlation for gastrointestinal pathogens. In 2020–2021, the respiratory pathogens lost statistical significance in their correlation, but a host of other gastrointestinal pathogens such as Salmonella, pathogenic E. coli, Y. enterocolitica, adenovirus and Campylobacter showed a positive temporal association, reflecting their increased explanatory power over the incidence of GBS during the pandemic. We hypothesised that these gastrointestinal pathogens were the main drivers of postinfectious GBS in 2020 and 2021. The loss of significance in respiratory infection may probably be due to a significant decrease in respiratory infectious disease, as discussed earlier; this may have acted as a force that shifted the GBS incidence curve further down the y-axis (figure 2B). Moreover, the significantly lower incidence of GBS in 2020 from March to May, which are traditionally the peak incidence months, added to the magnitude of the downward trend that was presumably caused by the decrease in respiratory and gastrointestinal infections. The same interpretation can be implemented to explain the seasonal pattern of GBS during the pandemic, for which there was a significantly lower incidence during the spring and winter months than expected. Of interest, SARS-CoV-2 infection during the pandemic period showed no significant temporal association with the incidence of GBS in our study. Although an increased risk of GBS may be suspected in patients with COVID-19, this may not have translated into the whole population, where non-COVID-19 infections serve as the major driving force behind GBS onset.
In 2021, a general decrease in non-COVID 19 infectious diseases may have persisted; however, since February 2021, a new variable to the equation was introduced: the SARS-CoV-2 vaccine. During this period, the common respiratory and gastrointestinal infection landscape did not change significantly from 2020 (table 3), but GBS incidence increased above the forecasted estimates. This finding holds special value, because from June 2021 to November 2021, COVID-19 incidence was relatively stable (ranging from a few hundreds to thousands of new confirmed cases per day), and NPIs were strictly executed across the nation. The only novel factor consistently introduced to the public during this period was the SARS-CoV-2 vaccine: starting from February 2021, vaccines from four different manufacturers were approved in South Korea: ChAdOx1-S/nCoV-19 (Oxford-Astrazeneca), Ad.26. COV2.S (Janssen), BNT162b2 (Pfizer-BioNTech) and mRNA-1273 (Moderna) vaccines. Most studies have concluded that, in the two recent decades, there has been no or only minutely increased risk of GBS following influenza vaccination.26–28 A potential link between GBS and vaccination against measles, mumps, rubella (MMR), hepatitis B, diphtheria, tetanus, pertussis (DTP) and polio vaccines was also suggested, but the strength of association has been negligible.29–31 The only case in which a strong association was supported by evidence was swine influenza vaccination in New Jersey in 1976.8 During the pandemic period, large population-based, database-driven studies have confirmed an increased risk of GBS with viral vector-based SARS-CoV-2 vaccines.32 33 We hypothesised that the relative increase in GBS incidence during this period may have been temporarily associated with a mass vaccine rollout (r=0.55, p=0.006). Notably, older age groups were injected primarily with viral vector-based vaccines in the early vaccine rollout in South Korea, and the increased GBS incidence from June to September 2021 coincided with the increase in vaccination in the 60–69 and 70–79 year age groups (online supplemental figure 1). Nevertheless, this hypothesis needs to be validated in future studies and should be interpreted with caution, as the benefit of the SARS-CoV-2 vaccine outweighs the risk of rare complications. We are currently investigating the contribution of the vaccine mechanism, dose and homogeneity of serial SARS-CoV-2 vaccinations to GBS incidence in 2021.
bmjno-2022-000378supp001.pdf (238.5KB, pdf)
Our study had several limitations. First, this was a cross-sectional study, so only an association can be suggested. However, gastrointestinal and respiratory tract infections account for a large portion of the total infectious disease spectrum and are the widely accepted triggers of GBS.34 Therefore, the temporal association observed in our study may not be just be a coincidental finding. Second, in seeking the fluctuation in the incidence of infectious diseases, we only used sentinel surveillance data collected from predesignated hospitals mandated to report specified pathogens. Nevertheless, we believe that pathogen-specific data collection and analysis has an advantage over diagnosis code-based data collection and analysis in terms of reliance and clarity, as some diagnoses allegedly related to infection may also be due to non-infectious causes (eg, acute pharyngitis and gastroenteritis of unspecified origin). Furthermore, the use of specific pathogens considers the seasonality of each pathogen, which is inevitably neglected in the diagnosis-oriented approach. Third, our correlation analysis was based on the hypothesis that most mucosa-associated infections can potentially cause GBS. There is a varying degree of evidence for each listed infectious disease having an association with GBS, some with more extensive research than others. However, we also hoped to ensure that the potential pathogens insufficiently covered by the previous literature were not overlooked. Lastly, no human behavioural factors were considered; reluctance to visit the hospital in mild cases of these infections may also be a behavioural factor contributing to under-reporting bias.
In conclusion, the COVID-19 pandemic continues to exert influence on socioeconomic and epidemiological grounds, thereby impacting public health. Remarkably, the pandemic is responsible for the changes in the epidemiology of traditional infectious immune triggers (ie, non-COVID-19 infections) and the introduction of novel immune stimuli (ie, SARS-CoV-2 vaccines) to the general public. Henceforth, it would be prudent to remain vigilant and carefully monitor the evolution of autoimmune phenomena in the long term. GBS is one of many rare examples of these conditions, and the same analogy may be implicated in diseases that share a similar molecular mimicry-based pathophysiology. We believe that tracking down changes in these potential immune triggers and evaluating the temporal association of these attributable risk factors with disease incidence can be used as supportive evidence of coherence in causation analysis and can improve the accuracy of expectations of future epidemiological outcomes.
Acknowledgments
The authors acknowledge the assistance of each colleague at the Korea Disease Control and Prevention Agency and Gyeonggi Infectious Disease Control Center for their dedication to public health and overall support for this project.
Footnotes
DK and JH contributed equally.
Contributors: HL contributed to the conception of the study, acquisition and analysis of the data and drafted a significant portion of the manuscript and figures. NH contributed to the conception of the study, interpretation of data and revision of the manuscript. DK contributed to the acquisition and verification of data and revision of the manuscript. JH contributed to the conception of the study, interpretation of the data and drafting and revising a significant portion of the manuscript. JH was also the author responsible for the overall content as the guarantor.
Funding: This study was supported by the Korea Disease Control and Prevention Agency (grant number 2022, 6231-335-210-01).
Competing interests: None declared.
Provenance and peer review: Not commissioned; externally peer reviewed.
Supplemental material: This content has been supplied by the author(s). It has not been vetted by BMJ Publishing Group Limited (BMJ) and may not have been peer-reviewed. Any opinions or recommendations discussed are solely those of the author(s) and are not endorsed by BMJ. BMJ disclaims all liability and responsibility arising from any reliance placed on the content. Where the content includes any translated material, BMJ does not warrant the accuracy and reliability of the translations (including but not limited to local regulations, clinical guidelines, terminology, drug names and drug dosages), and is not responsible for any error and/or omissions arising from translation and adaptation or otherwise.
Data availability statement
Data are available on reasonable request. The data used and/or analysed in this study are available on reasonable request from the corresponding author.
Ethics statements
Patient consent for publication
Not applicable.
Ethics approval
The Institutional Review Board at KDCA exempted this study from ethical approval because of the retrospective analysis of deidentified data that were already obtained through epidemiological investigation, presented minimal privacy or confidentiality risk to participants and met the current public health interest requirements. All study procedures have been reported in accordance with the Strengthening the Reporting of Observational Studies in Epidemiology reporting guidelines. The requirement for consent was waived because we retrospectively collected deidentified data.
References
- 1.World Health Organization . Who COVID-19 Dashboard. Geneva: World Health Organization, 2020. https://covid19.who.int/ [Google Scholar]
- 2.Shahrizaila N, Lehmann HC, Kuwabara S. Guillain-Barré syndrome. Lancet 2021;397:1214–28. 10.1016/S0140-6736(21)00517-1 [DOI] [PubMed] [Google Scholar]
- 3.Bragazzi NL, Kolahi A-A, Nejadghaderi SA, et al. Global, regional, and national burden of Guillain-Barré syndrome and its underlying causes from 1990 to 2019. J Neuroinflammation 2021;18:264. 10.1186/s12974-021-02319-4 [DOI] [PMC free article] [PubMed] [Google Scholar]
- 4.Huang W-C, Lu C-L, Chen SC-C. A 15-year nationwide epidemiological analysis of Guillain-Barré syndrome in Taiwan. Neuroepidemiology 2015;44:249–54. 10.1159/000430917 [DOI] [PubMed] [Google Scholar]
- 5.Yuki N, Kuwabara S. Axonal Guillain-Barré syndrome: carbohydrate mimicry and pathophysiology. J Peripher Nerv Syst 2007;12:238–49. 10.1111/j.1529-8027.2007.00153.x [DOI] [PubMed] [Google Scholar]
- 6.Uncini A, Shahrizaila N, Kuwabara S. Zika virus infection and Guillain-Barré syndrome: a review focused on clinical and electrophysiological subtypes. J Neurol Neurosurg Psychiatry 2017;88:266–71. 10.1136/jnnp-2016-314310 [DOI] [PubMed] [Google Scholar]
- 7.Trujillo Gittermann LM, Valenzuela Feris SN, von Oetinger Giacoman A. Relation between COVID-19 and Guillain-Barré syndrome in adults. systematic review. Neurologia 2020;35:646–54. 10.1016/j.nrl.2020.07.004 [DOI] [PMC free article] [PubMed] [Google Scholar]
- 8.Sencer DJ, Millar JD. Reflections on the 1976 swine flu vaccination program. Emerg Infect Dis 2006;12:23–8. 10.3201/eid1201.051007 [DOI] [PMC free article] [PubMed] [Google Scholar]
- 9.Chroni E, Papapetropoulos S, Gioldasis G, et al. Guillain-Barré syndrome in Greece: seasonality and other clinico-epidemiological features. Eur J Neurol 2004;11:383–8. 10.1111/j.1468-1331.2004.00799.x [DOI] [PubMed] [Google Scholar]
- 10.Yi S-W, Lee JH, Hong J-M, et al. Incidence, disability, and mortality in patients with Guillain-Barré syndrome in Korea: a nationwide population-based study. J Clin Neurol 2022;18:48–58. 10.3988/jcn.2022.18.1.48 [DOI] [PMC free article] [PubMed] [Google Scholar]
- 11.Webb AJS, Brain SAE, Wood R, et al. Seasonal variation in Guillain-Barré syndrome: a systematic review, meta-analysis and Oxfordshire cohort study. J Neurol Neurosurg Psychiatry 2015;86:1196–201. 10.1136/jnnp-2014-309056 [DOI] [PubMed] [Google Scholar]
- 12.Tanislav C, Kostev K. Fewer non‐COVID‐19 respiratory tract infections and gastrointestinal infections during the COVID‐19 pandemic. J Med Virol 2022;94:298–302. 10.1002/jmv.27321 [DOI] [PMC free article] [PubMed] [Google Scholar]
- 13.Breslow NE, Day NE. Statistical methods in cancer research. Volume II--The design and analysis of cohort studies. IARC Sci Publ 1987;82:1–406. [PubMed] [Google Scholar]
- 14.Chatfield C, Yar M. Holt-Winters forecasting: some practical issues. The Statistician 1988;37:129–40. 10.2307/2348687 [DOI] [Google Scholar]
- 15.Parker RI, Hagan-Burke S. Useful effect size interpretations for single case research. Behav Ther 2007;38:95–105. 10.1016/j.beth.2006.05.002 [DOI] [PubMed] [Google Scholar]
- 16.Charles CH. Forecasting seasonals and trends by exponentially weighted moving averages. International Journal of Forecasting 2004;20:5–10. 10.1016/j.ijforecast.2003.09.015 [DOI] [Google Scholar]
- 17.Winters PR. Forecasting sales by exponentially weighted moving averages. Manage Sci 1960;6:324–42. 10.1287/mnsc.6.3.324 [DOI] [Google Scholar]
- 18.Sejvar JJ, Baughman AL, Wise M, et al. Population incidence of Guillain-Barré syndrome: a systematic review and meta-analysis. Neuroepidemiology 2011;36:123–33. 10.1159/000324710 [DOI] [PMC free article] [PubMed] [Google Scholar]
- 19.Sipilä JOT, Soilu-Hänninen M, Ruuskanen JO, et al. Epidemiology of Guillain-Barré syndrome in Finland 2004-2014. J Peripher Nerv Syst 2017;22:440–5. 10.1111/jns.12239 [DOI] [PMC free article] [PubMed] [Google Scholar]
- 20.Palaiodimou L, Stefanou Maria‐Ioanna, Katsanos AH, et al. Prevalence, clinical characteristics and outcomes of Guillain−Barré syndrome spectrum associated with COVID‐19: a systematic review and meta‐analysis. Eur J Neurol 2021;28:3517–29. 10.1111/ene.14860 [DOI] [PMC free article] [PubMed] [Google Scholar]
- 21.Keddie S, Pakpoor J, Mousele C, et al. Epidemiological and cohort study finds no association between COVID-19 and Guillain-Barré syndrome. Brain 2021;144:682–93. 10.1093/brain/awaa433 [DOI] [PMC free article] [PubMed] [Google Scholar]
- 22.Chan LYH, Yuan B, Convertino M. COVID-19 non-pharmaceutical intervention portfolio effectiveness and risk communication predominance. Sci Rep 2021;11:10605. 10.1038/s41598-021-88309-1 [DOI] [PMC free article] [PubMed] [Google Scholar]
- 23.Liu Y, Morgenstern C, Kelly J, et al. The impact of non-pharmaceutical interventions on SARS-CoV-2 transmission across 130 countries and territories. BMC Med 2021;19:40. 10.1186/s12916-020-01872-8 [DOI] [PMC free article] [PubMed] [Google Scholar]
- 24.Aiello AE, Coulborn RM, Perez V, et al. Effect of hand hygiene on infectious disease risk in the community setting: a meta-analysis. Am J Public Health 2008;98:1372–81. 10.2105/AJPH.2007.124610 [DOI] [PMC free article] [PubMed] [Google Scholar]
- 25.Rotulo GA, Percivale B, Molteni M, et al. The impact of COVID-19 lockdown on infectious diseases epidemiology: the experience of a tertiary Italian pediatric emergency department. Am J Emerg Med 2021;43:115–7. 10.1016/j.ajem.2021.01.065 [DOI] [PMC free article] [PubMed] [Google Scholar]
- 26.Dieleman J, Romio S, Johansen K, et al. Guillain-Barre syndrome and adjuvanted pandemic influenza A (H1N1) 2009 vaccine: multinational case-control study in Europe. BMJ 2011;343:d3908. 10.1136/bmj.d3908 10.1136/bmj.d3908 [DOI] [PMC free article] [PubMed] [Google Scholar]
- 27.Baxter R, Lewis N, Bakshi N, et al. Recurrent Guillain-Barre syndrome following vaccination. Clin Infect Dis 2012;54:800–4. 10.1093/cid/cir960 [DOI] [PubMed] [Google Scholar]
- 28.Baxter R, Bakshi N, Fireman B, et al. Lack of association of Guillain-Barré syndrome with vaccinations. Clin Infect Dis 2013;57:197–204. 10.1093/cid/cit222 [DOI] [PubMed] [Google Scholar]
- 29.Schattner A. Consequence or coincidence? The occurrence, pathogenesis and significance of autoimmune manifestations after viral vaccines. Vaccine 2005;23:3876–86. 10.1016/j.vaccine.2005.03.005 [DOI] [PubMed] [Google Scholar]
- 30.Souayah N, Nasar A, Suri MFK, et al. Guillain-Barre syndrome after vaccination in United States a report from the CDC/FDA vaccine adverse event reporting system. Vaccine 2007;25:5253–5. 10.1016/j.vaccine.2007.03.053 [DOI] [PubMed] [Google Scholar]
- 31.Chen Y, Zhang J, Chu X, et al. Vaccines and the risk of Guillain-Barré syndrome. Eur J Epidemiol 2020;35:363–70. 10.1007/s10654-019-00596-1 [DOI] [PubMed] [Google Scholar]
- 32.Hanson KE, Goddard K, Lewis N, et al. Incidence of Guillain-Barré syndrome after COVID-19 vaccination in the vaccine safety Datalink. JAMA Netw Open 2022;5:e228879. 10.1001/jamanetworkopen.2022.8879 [DOI] [PMC free article] [PubMed] [Google Scholar]
- 33.Keh RYS, Scanlon S, Datta-Nemdharry P, et al. COVID-19 vaccination and Guillain-Barré syndrome: analyses using the National immunoglobulin database. Brain 2022. doi: 10.1093/brain/awac067. [Epub ahead of print: 18 Feb 2022]. [DOI] [PMC free article] [PubMed] [Google Scholar]
- 34.Wakerley BR, Yuki N. Infectious and noninfectious triggers in Guillain-Barré syndrome. Expert Rev Clin Immunol 2013;9:627–39. 10.1586/1744666X.2013.811119 [DOI] [PubMed] [Google Scholar]
Associated Data
This section collects any data citations, data availability statements, or supplementary materials included in this article.
Supplementary Materials
bmjno-2022-000378supp001.pdf (238.5KB, pdf)
Data Availability Statement
Data are available on reasonable request. The data used and/or analysed in this study are available on reasonable request from the corresponding author.