Abstract
Fungi produce and excrete various proteins, enzymes, polysaccharides, and secondary metabolites, which may be used as media for the “green” synthesis of metal and semiconductor nanoparticles (NPs). ZnO NPs with a flower-like morphology were synthesized by an affordable colloidal route, using an aqueous extract of Ganoderma lucidum as a reducing agent and stabilizer. Each individual “flower” has a large effective surface, which is preserved when the particles are close packed into a dense film, which is advantageous for numerous applications. The phonon Raman spectrum and X-ray diffraction (XRD) pattern prove the high crystallinity of the NPs, with the distinct pattern of a hexagonal (wurtzite) lattice, negligible residual stress, and a crystallite size of 12–14 nm determined from the XRD. The photoluminescence (PL) spectrum of the as-synthesized ZnO NPs contains a structured defect-related feature in the violet-blue range, while the green PL, common for nanostructures synthesized by “green” routes, is very weak. By applying dimethylsulfoxide as an additional passivating agent, the excitonic (UV) PL band was activated without enhancement of the defect-related features. Ag NP-decorated ZnO flowers were synthesized by subsequent silver reduction by pepper extract. The ZnO/Ag NPs exhibited efficient surface-enhanced Raman scattering (SERS) of a standard dye analyte, rhodamine 6G, ensuring the feasibility of other applications that require close contact of ZnO/Ag to other nanostructures or molecules to realize the energy of the charge transfer.
Fungi and plants produce and excrete various proteins, enzymes, polysaccharides, and secondary metabolites, which may be used as media for the “green” synthesis of metal and semiconductor nanoparticles (NPs).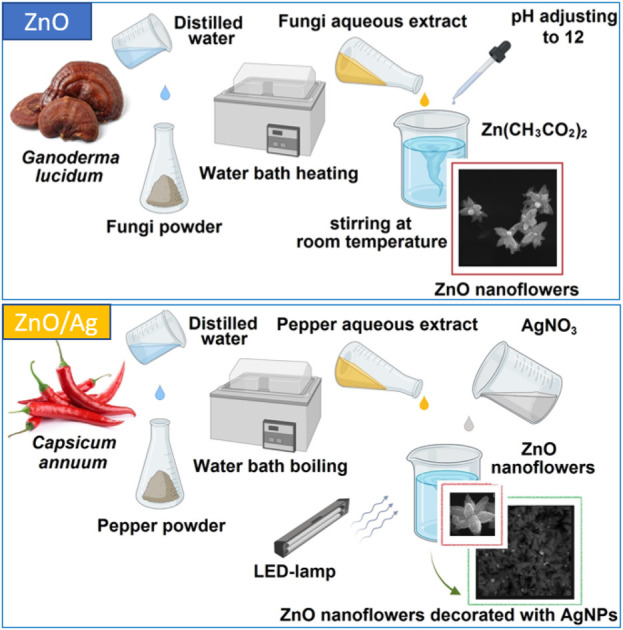
1. Introduction
ZnO, including ZnO nanoparticles and microstructures, has attracted the steady interest of researchers for decades.1–3 The variety of its applications explains the need for different approaches to its synthesis3–11 and the formation of its heterostructures with semiconductor or metal nanostructures.4–6 Green chemistry approaches to nanoparticle (NP) production have the advantages of eco-friendly and hazard-free manufacturing, and economic and time-effective biosynthesis.6–12 In their biosynthesis, NPs are coated with bioorganic molecules, which makes them more easily disposable and suitable for biomedical applications. While the most significant previous work has been devoted to bio-synthesized Ag NPs,11,13–15 recently there has been an increasing amount of work reporting the synthesis of ZnO NPs based on plant and fungi extracts8,10,12,16 and their use for various biomedical applications and catalysis.10,12,17 An extension or enhancement of the applied functionality of ZnO nano-/microstructures can be achieved by forming heterostructures with noble metal NPs.5,6,18,19
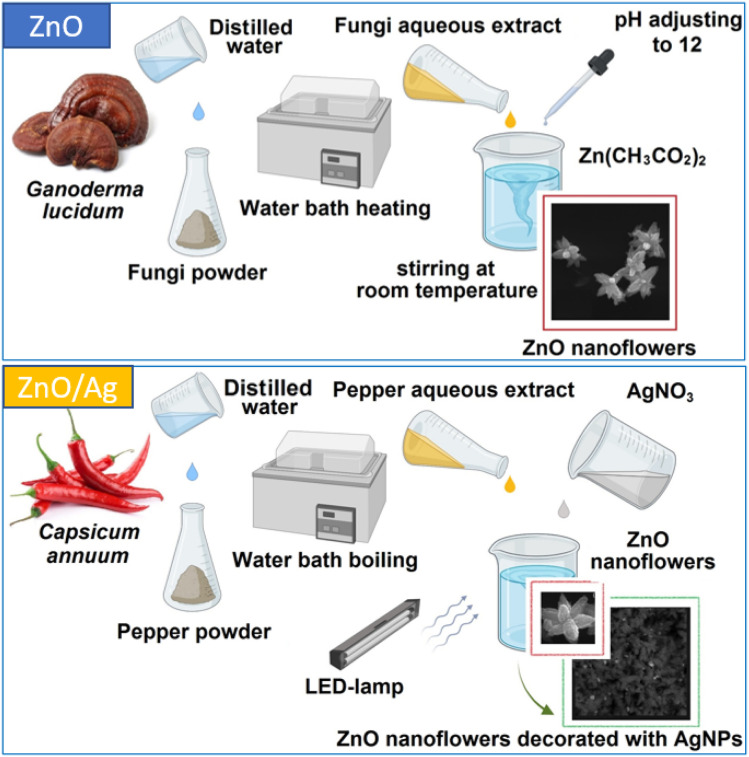
This work is the first report on the synthesis of ZnO NPs using Ganoderma lucidum (G. lucidum) fruiting body extract as the bio-reducing and stabilizing agent. G. lucidum is a wood-degrading and traditional medical Basidiomycota (reishi mushroom), containing over 400 bioactive compounds with bioreductive properties, including different proteins, amino acids, polysaccharides, fatty acids, phenolic compounds, triterpenoids, steroids, and alkaloids.20,21 Therefore, the NPs synthesized have additional potential applications owing to the well-known medical properties of Ganoderma extracts.20 On the other hand, ZnO nanostructures with flower-like morphologies have attracted much attention recently, with a whole review paper devoted to them.22 The particular morphologies and other properties of the ZnO nanoflowers obtained in different works are shown to be quite different, primarily due to the different methods of their synthesis, such as chemical vapor deposition, facile hydrothermal synthesis, thermal evaporation, chemical reduction, bio-synthesis, and the solvothermal method. The range of demonstrated and prospective applications of ZnO and ZnO/Ag nanoflowers is also broad, including in biosensors, catalysts, bio-markers for the diagnosis of diseases and therapeutic processes, wastewater remediation and gas sensing.22 The decoration of the ZnO surface with Ag NPs is performed to improve catalytic and sensing applications, in particular, so the Ag NP plasmon can be used to enhance the Raman scattering of analyte molecules. For many of the applications an affordable, bio- and environmentally friendly, and scalable synthesis is preferred. Green synthesis from plant extracts is a suitable option, as highlighted in previous work.22 Both the bio-compatibility and flower-like morphology of the ZnO NPs synthesized in this work for the first time from (medical) fungi extract are consistent with the work described above. The large effective surface of the films prepared from these flower-shaped NPs is also advantageous for fabricating plasmonic nanostructures, which can be used as substrates for surface-enhanced Raman scattering (SERS) or other similar sensing applications, as demonstrated in this work (Fig. 1).
Fig. 1. Schematic illustration for the fabrication of ZnO and Ag NP-decorated ZnO nanoflowers.
2. Experimental
The sample material – fruiting bodies of Ganoderma lucidum (reishi mushroom) – was collected from the Holosiivskyi National Natural Park (50°22′33.4′′N 30°30′39.2′′E) in Holosiivskyi district, Kyiv, Ukraine, and brought to the laboratory for further studies. After grinding, the fungi powder was transferred into Erlenmeyer flasks containing distilled water (in a ratio of 2 g to 100 mL). The aqueous extract was prepared by heating the mixture at 60 °C for 30 minutes. Then the extract was filtered using Whatman no. 1 filter paper and the filtrates were stored in a refrigerator.
For the myco-synthesis of ZnO NPs, zinc acetate dihydrate (Zn(CH3COOH)2·2H2O) (1.095 g) was dissolved in deionized water (100 mL) by stirring at ambient temperature. Then, 10 (sample #1) or 5 mL (#2) of fungi extract was added, the pH of the obtained solution was adjusted to approx. 12 with 1.0 M NaOH, and the mixture was stirred for 3 hours at room temperature. Following this, the dispersion was centrifuged, and the solid precipitate was washed with deionized water and ethanol three times, respectively. The obtained white powder was dried for 10 hours at 60 °C.
For the synthesis of AgNP-decorated ZnO NPs, dried white ZnO NP powder (0.05 g) was dissolved in deionized water (100 mL) by stirring at ambient temperature. Then, to test the effectiveness of the synthesis of the AgNP-decorated ZnO NPs, four experimental mixtures were made: 2 mL of the ZnO NP solution was mixed with 2 mL of 0.001 M silver nitrate (AgNO3); 1 mL of the ZnO NP solution was mixed with 3 mL of 0.001 M silver nitrate (AgNO3); 3 mL of the ZnO NP solution was mixed with 1 mL of 0.001 M silver nitrate (AgNO3); and 2 mL of the ZnO NP solution was mixed with 2 mL of 0.001 M silver nitrate (AgNO3) and 1 mL of chili pepper (Capsicum annuum) fruit extract, which was pre-prepared according to the method described in ref. 23.
The size and morphology of the ZnO NPs were studied using scanning electron microscopy (SEM, Tescan Mira 3 MLU). The X-ray diffraction (XRD) study was performed using a Philips X'Pert PRO – MRD setup with a Cu Kαl line (λ = 0.15406 nm) in a symmetric (2Θ − ω) mode, with a scan step of 0.025°. Optical absorption spectra were recorded using a StellarNet Silver Nova 25 BWI6 spectrometer. PL spectra were measured with a Shimadzu RF-1501 spectrophotometer at a spectral resolution of 1 nm. For Raman spectra, a 532 nm solid-state laser was used for excitation, and a single-stage spectrometer RM1000 (Renishaw) equipped with a cooled CCD detector for acquisition. The laser power density on the samples was approx. 104–105 W cm−2 to preclude irreversible thermal or photo-induced modification of the samples. A spectral resolution of 1 cm−1 was determined from the Si phonon peak width of a single crystal Si substrate. The Si phonon peak position of 520.5 cm−1 was used as a reference for determining the positions of the Raman peaks.
3. Results and discussion
3.1. Characterization of ZnO NPs
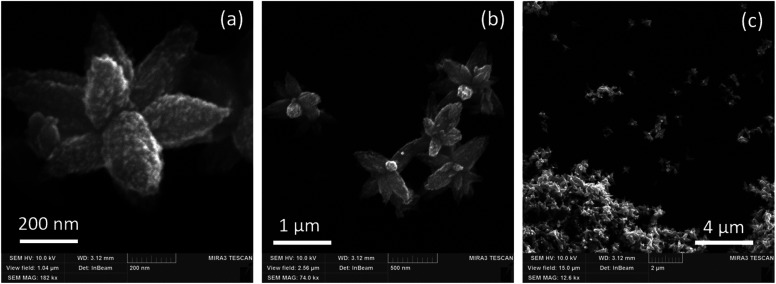
The ZnO NPs synthesized here using G. lucidum extract exhibit a flower-like morphology, with an average size of a single whole particle of several hundreds of nanometers, and the dimensions of its “petals” around 50–200 nm (Fig. 2). The surface of the petals exhibits an additional nanostructure, with a size not exceeding 10–20 nm (Fig. 2a). Therefore, each individual “flower” has a large effective surface, and the morphology allows for the preservation of this large effective surface when such “flowers” are close packed into a dense film (Fig. 2c). This is an advantageous property of the obtained nanostructures for many potential applications, where the large surface per volume is one factor determining the application's efficiency.
Fig. 2. Representative SEM images of the ZnO NPs (#1) synthesized with G. lucidum aqueous extract, acquired with different magnifications: 182 000 (a), 74 000 (b), and 12 600 (c).
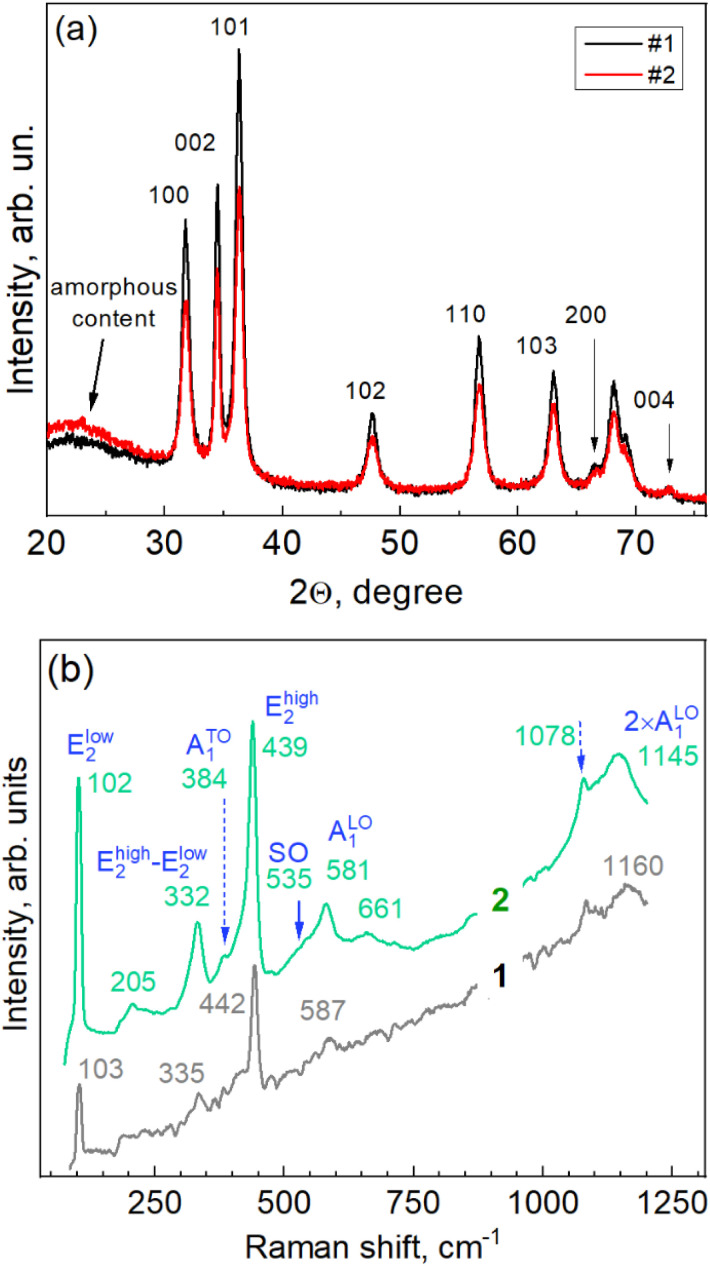
The NPs exhibit a distinct diffraction pattern of hexagonal ZnO of wurtzite-type structure (ICDD PDF No. 010-75-0576).24 The diffraction peaks of sample #1, synthesized with a concentration of the extract twice that of sample #2, are slightly stronger and narrower, and the contribution of the amorphous feature is weaker, indicating a higher crystallization degree in this sample.
From the angle positions and widths of the reflections 002\004 and 100\200, the crystallite sizes and residual deformations were calculated using the Williamson–Hall method (Table 1):β cos θ = λ/D + 4ε sin θ,where β is the full width at half maximum of the reflex, θ is the position of the reflection in degrees, λ is the excitation wavelength, D is the area of coherent scattering, and ε is the mean deformation value.
Crystallite sizes and residual strain were calculated from the XRD patterns using the Williamson–Hall method.
| Sample | Strain ε along a | D along a | Strain ε along c | D along a |
|---|---|---|---|---|
| 1 | 1.4 10−3 | 12.3 | 1.0 10−3 | 14.3 |
| 2 | 3.4 10−3 | 12.7 | 2.3 10−3 | 13.3 |
The hexagonal type of structure and even the particular ratio of peak intensities observed for the ZnO flower-like particles in this work is very common for ZnO NPs synthesized using various other extracts.10,19,25 The particle morphology, on the contrary, is rather sensitive to the particular extract used.26 Particles with round shapes12 and hexagonal shapes,25 and only rarely particles with a developed morphology have been reported.16 The major difference in the XRD patterns in other works is the intensity of the 002 reflection (relative to the other peaks),17 which can be indicative of the different aspect ratios of the crystalline domains along the a and c axes of the hexagonal crystal structure, or some minor admixture of the zinc blende phase, which has its primary reflection close to the 002 peak of the wurtzite.27
Additional information on the internal structure of the ZnO-Gan NPs, as well as on the lattice vibration (phonon) properties, was obtained by Raman spectroscopy. The Raman scattering acquired with two different powers (5 × 10⁻⁴ W cm−2 and 10−5 W cm−2) of the excitation laser line (λexc = 532 nm) is presented in Fig. 3b. The few cm−1 downward shifting of the phonon peaks in the Raman spectra of the NPs and other nano-sized materials excited with a higher laser power/intensity is of thermal nature, i.e., the thermal energy generated in the NP is larger than that which can be dissipated into the environment and thus leads to an increased temperature in the NPs. Nevertheless, the spectrum acquired at a laser power of ten times higher contains more spectral features that are intense enough for analysis. Their spectral position needs to be corrected using the position of the peaks in the spectrum acquired at a lower laser power. The set of peaks observed for our ZnO (Fig. 3b) corresponds to the well-known pattern of nanocrystalline ZnO at off-resonant (sub-bandgap) excitation:28–32Elow2 at 103 cm−1, Ehigh2 at 442 cm−1, Ehigh2 − Elow2 at 335 cm−1, ATO1 at 384 cm−1, and ALO1 at 587 cm−1, as well as the first overtone of the ALO1 at 1160 cm−1 (Fig. 3b). Several weaker features observed in our spectra are also present in the higher-power spectrum: the 205 cm−1 mode can be attributed to 2 × Elow2, and the 661 cm−1 one to TA + LO (TA stands for “transversal acoustical” and LO for “longitudinal optical” phonons).30–32 The shoulder (at about 535 cm−1) of the LO mode is characteristic of a nanostructure surface optical (SO) phonon mode.33,34 In microcrystalline ZnO the LO and its overtone peaks are very strong both in resonant (near- or above-bandgap) and off-resonant (e.g. green laser line) excitation.35 In the NPs, the LO peak and its overtones usually dominate the Raman spectrum under the resonant excitation with a 325 nm laser source.4,36,37 The moderate intensity of the LO and 2LO features and their comparable intensity in our non-resonant spectra are fully consistent with the 12–13 nm size of the nanocrystallites obtained from the XRD measurements.
Fig. 3. XRD patterns (a) and Raman spectra (b) of ZnO NPs synthesized using G. lucidum extract. XRD data are shown for the two synthesized samples with different volumes of the extract (10 mL for #2 and 5 mL for #1). Raman spectra for sample #1 were measured at different laser powers: 104 W cm−2 (curve 1) and 105 W cm−2 (curve 2).
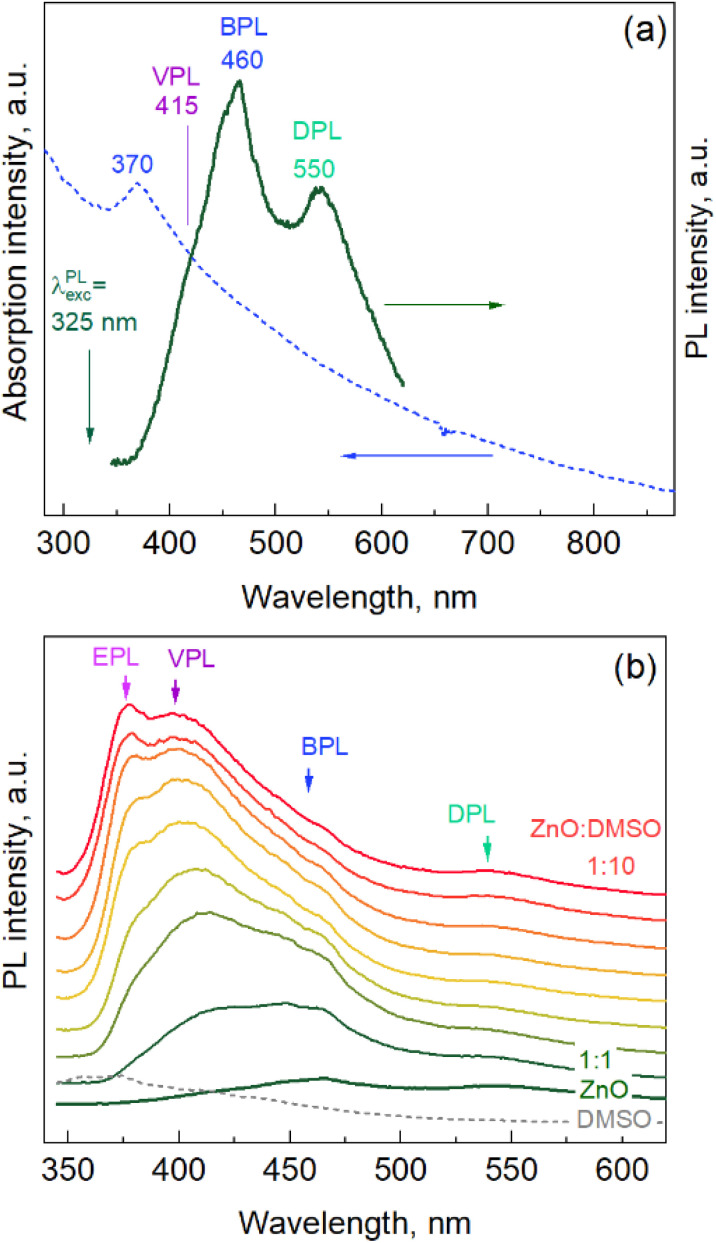
ZnO NPs synthesized in water or under other mild conditions usually exhibit only a broad-band PL in the visible range, centered around 550 nm, attributed to defects such as oxygen vacancies (primarily on the NP surface).37,38 The excitonic PL (EPL) is more typical for NPs and polycrystalline films obtained at higher temperatures,36,39 while NPs synthesized under mild conditions also showed pronounced EPL in some previous work.37,40 The spectrum of the as-synthesized ZnO NPs in the present work exhibits distinct bands centered at 460 and 550 nm, and another band is seen as a shoulder at 415 nm (Fig. 4a). We labeled these bands as BPL (“blue PL”), DPL (defect PL, see above), and VPL (violet PL) bands, respectively. The PL features similar to BPL were attributed earlier to zinc interstitials41 or zinc vacancies.42,43 The origin of the VPL has been related in some previous work to unspecified intrinsic defects,44 although it also matches spectrally the range discussed by others concerning zinc vacancies44 and zinc interstitials.43 It should be noted that establishing the nature of the components of the PL spectrum requires tremendous research efforts and goes beyond the scope of the present paper.
Fig. 4. (a) UV-vis and PL spectra of ZnO NPs synthesized using extracts of G. lucidum. (b) Evolution of the PL spectrum of ZnO NPs as a result of post-synthesis addition of DMSO. See the text for a discussion of the induced changes in the ratios of the particular PL components marked here (EPL, VPL, BPL, and DPL).
Modifying the NP surface is a well-known approach to both modifying the properties of the NPs and clarifying the nature of some properties, particularly the origin of different PL bands.40,45,46 Dimethyl sulfoxide (DMSO), for instance, a very useful solvent, miscible with water, often used in biomedical applications and the synthesis of nanoparticles,47–49 was shown to be an efficient stabilizer of the ZnO colloidal NPs,37,38 ensuring a very high intensity of both surface-related (DPL)38,45 and excitonic (EPL)37,40 bands. Therefore, we investigated the influence of adding DMSO (after synthesis) on the PL spectrum of the present ZnO NPs. The evolution of the PL spectra of the ZnO NPs upon the addition of DMSO to the as-synthesized NP solution is shown in Fig. 4b. One can see that the DPL and BPL remain unaffected, while the VPL intensity increases dramatically, and the EPL band appears and evolves into a distinctly resolved feature at the highest DMSO content (ZnO : DMSO ratio 1 : 10, top spectrum). We varied the content of DMSO in a broader range, and subjected the mixture to ultrasound and heating at different temperatures (below 100 °C). All these changes did not cause much more quantitative or qualitative change in the spectra than that shown in Fig. 4b.
The experiment with DMSO addition demonstrates the high sensitivity of the PL spectrum of the synthesized ZnO NPs to the environment, indicating the high potential of these NPs in various sensing applications, not only optical, but also any other sensing applications that involve charge transfer between the NP (surface) and the environment.
3.2. ZnO nanoflowers decorated with Ag NPs
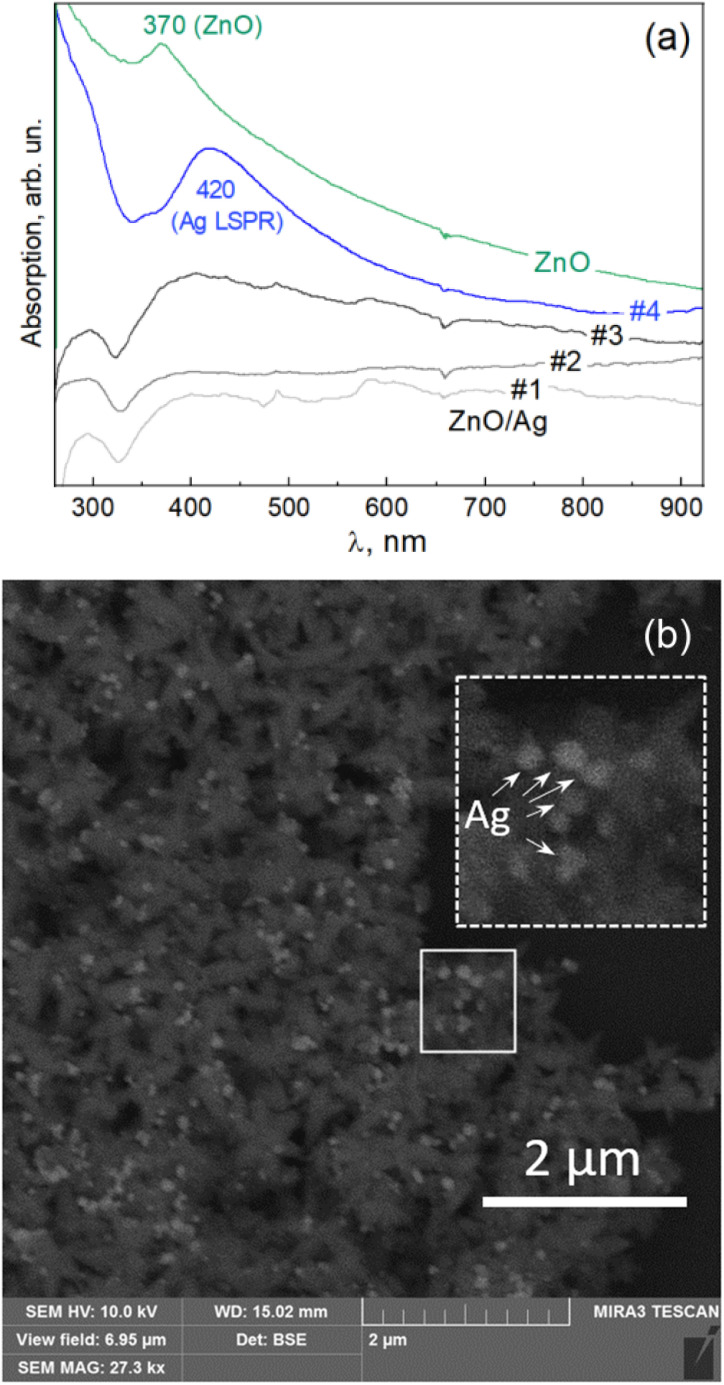
A large part of the previous work on ZnO nanostructures is related to their heterostructures with noble metal nanoparticles.46,50–54 The ZnO NPs obtained in this work using G. lucidum mycoextract were also found to be a suitable basis for forming ZnO/Ag heterostructures. The reduction of silver ions that leads to Ag NP formation on the surface of the ZnO flower-like NPs was attempted in the present work with different extracts, including G. lucidum mycoextract, but here we present only the results obtained with the chili pepper (Capsicum annuum) fruit extract. The latter has been recently demonstrated to mediate the formation of free-standing colloidal Ag NPs,11,23 and that synthesis is shown here to be compatible with the G. lucidum mycoextract-mediated synthesis of ZnO NPs, producing ZnO/Ag heteroparticles. Fig. 5a shows the evolution of the UV-vis optical absorption spectra of the colloidal solutions with increasing concentrations of Ag. A pronounced absorption feature characteristic of LSPR in Ag NPs is observed for sample #4, corresponding to silver. The SEM image of this sample (Fig. 5b) confirms the formation of the AgNPs on the surface of the ZnO nanoflowers.
Fig. 5. (a) UV-vis absorption of the bare ZnO NPs and ZnO NPs decorated with Ag NPs synthesized with aqueous pepper extract at different concentrations of silver nitrate. (b) SEM image of the ZnO/Ag sample (#4) with the largest concentration of Ag. Ag NPs are seen as small bright spots. A representative area (solid line) is enlarged in the inset (dashed line) for a better view.
The obtained hetero NPs were investigated as a substrate for surface enhanced Raman scattering using a standard analyte Rhodamine 6G (R6G). The advantage of these ZnO/Ag heteroNPs for SERS application is expected to be the combination of the enhancement stemming from the individual Ag NPs on each of the ZnO particles and the occurrence of so-called “hot spots” between the Ag NPs attached to different/neighboring ZnO particles. The flower-like morphology of the latter allows their close-packing into a dense film with a high probability of contact points between the “petals” of the neighboring ZnO/Ag particles.
3.3. SERS study on ZnO NPs decorated with Ag NPs
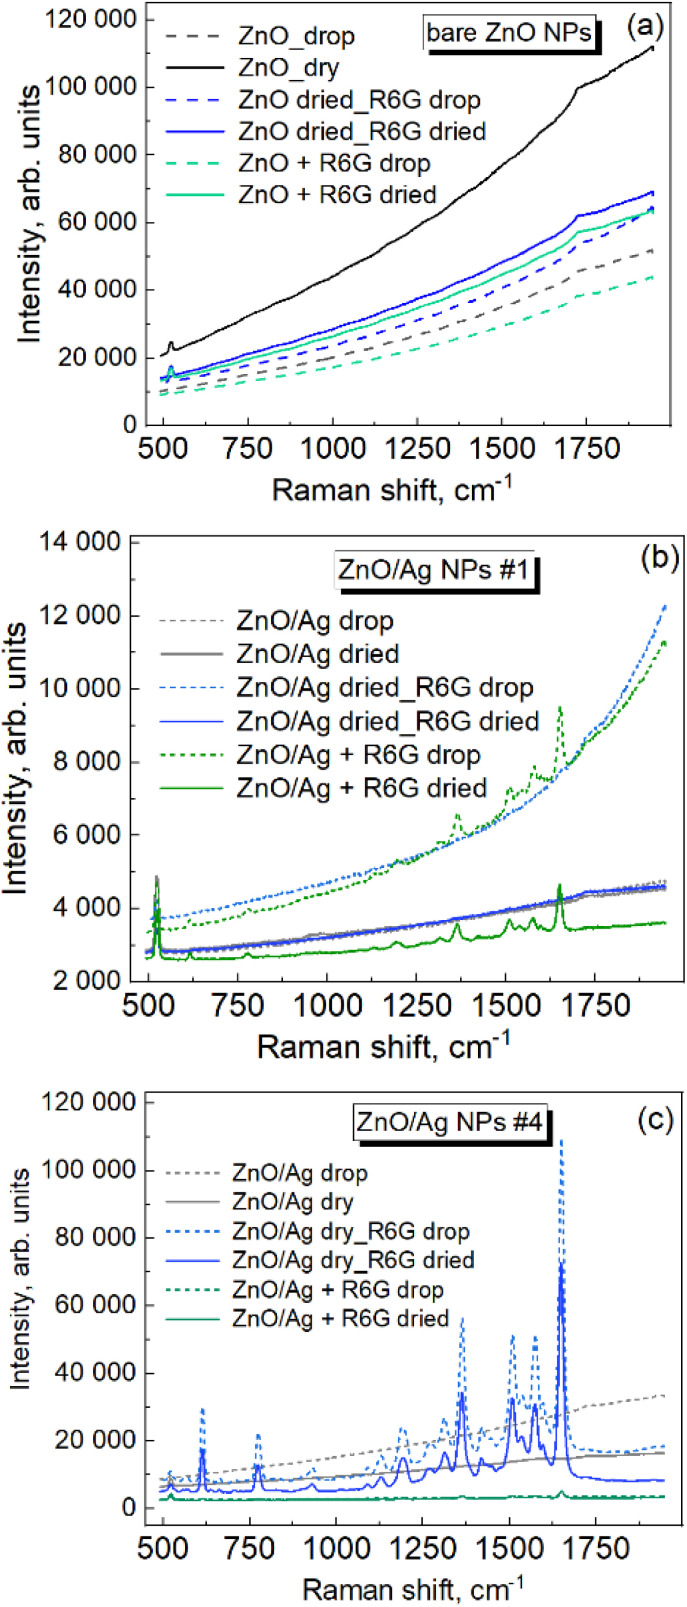
The Raman spectrum of bare ZnO NPs exhibits no peaks in the range of molecular vibrations (Fig. 6a, black curves), i.e., the molecules of the extract used for their synthesis do not show noticeable SERS enhancement, which is one of the prerequisites of an efficient application of the material as a SERS substrate for the detection of low concentrations of other (analyte) molecules. For control measurements, the analyte (R6G, 10−5 M) solution was deposited on the dried ZnO NPs (blue curves), and also mixed with the ZnO NPs in solution (green curves). No R6G peaks could be registered in both cases under the given excitation conditions (i.e., the wavelength of the exciting laser line, 457 nm, its power, and the spectra accumulation time).
Fig. 6. Raman spectra of Rhodamine 6G (10−5 M) with bare ZnO NPs (a), ZnO/Ag sample #1 (b), and ZnO/Ag sample #4 (c).
An analogous series of experiments (Fig. 6b) performed for ZnO/Ag NP sample #1 (with the lowest amount of Ag) revealed no Raman peaks for the extract when only ZnO/Ag NPs were measured (black curves), and no R6G peaks when R6G was deposited on dried ZnO/Ag NPs (blue curves), while distinct analyte features could be registered when the analytes were mixed with ZnO/Ag NPs in the solution (green curves). This result indicates that mixing the analyte with the ZnO/Ag NPs in the solution may provide a higher probability/concentration of the analyte molecule occurring in the “hot spot” between the Ag NPs of the neighboring ZnO NPs. The same series of measurements performed for ZnO/Ag NP sample #4 (with the largest amount of Ag) is presented in Fig. 6c. Surprisingly, the increased amount of AgNPs in this sample compared to #1 did not cause an increase in the Raman intensity in the solution mixed approach (green curves), while a SERS signal at least 5 orders of magnitude stronger is observed in the case of the R6G solution deposited on the preliminarily dried ZnO NPs (blue curves). No Raman signal in this deposition mode was observed for the ZnO/Ag #1 NPs. To explain this observation, we can assume that in addition to the different morphological and optical properties of the individual ZnO/Ag NPs with different amounts of Ag, as well as possible differences in their aggregation properties (responsible for the interparticle contact), the mechanism of the analyte drying and finding of the hot spots may also be complex and dependent on the concentration of Ag NPs in the given system. In particular, the potential advantage of mixing solutions for placing R6G molecules in the hot spots at low Ag NP concentrations (sample #1 above) may turn out to be less critical when the Ag NP concentration is high (sample #4 above). In the latter case, the analyte molecules may better “find” the hot spots on the preliminarily dried ZnO NP layer because of a surface tension-driven accumulation of the molecules in the points of contact between the neighboring ZnO/Ag NPs.
4. Conclusions
ZnO NPs with a flower-like morphology were synthesized by an affordable colloidal route, using an aqueous extract of Ganoderma lucidum as a reducing agent and stabilizer. Each individual “flower” has a large effective surface, which is preserved when the particles are close packed into a dense film, which is advantageous for applications, e.g. in sensing and catalysis. The well-known medical properties of G. lucidum make the obtained ZnO NPs attractive for biomedical applications. The obtained ZnO NPs are highly crystalline, as confirmed by strong Raman scattering and XRD patterns. From the analysis of the XRD peaks, the hexagonal (wurtzite) lattice structure is concluded, with single crystal domains with sizes of 12–14 nm. The as-synthesized ZnO NPs exhibit a PL spectrum in the violet-blue range and only weak broad-band PL in the green range, which is more common for nanostructures synthesized by “green” routes. By applying DMSO as an additional passivating agent, the excitonic (UV) band can also be activated without enhancing the defect-related features. The ZnO NPs synthesized with G. lucidum extract can be used as the basis for forming ZnO/Ag nanoheterostructures by subsequent in situ silver reduction by pepper extract. The ZnO/Ag NPs exhibited efficient SERS of a standard dye analyte, Rhodamine 6G, showing the feasibility of other applications that require close contact with ZnO/Ag and other nanostructures or molecules to realize the energy of charge transfer.
Author contributions
O. S.: conceptualization, methodology, formal analysis, visualization. V. D.: conceptualization, methodology, supervision, formal analysis, project administration, writing – original draft. M. K.: investigation. O. G.: investigation, methodology, formal analysis, visualization. N. M.: investigation, formal analysis. O. I.: investigation, formal analysis, methodology. Z. M.: investigation, methodology, validation. S. K.: investigation, formal analysis. M. S.: investigation, methodology, formal analysis. V. Y.: funding acquisition, supervision, writing – review and editing.
Conflicts of interest
The authors declare that they have no known competing financial interests or personal relationships that could have appeared to influence the work reported in this paper.
Supplementary Material
Acknowledgments
Financial support from National Research Foundation of Ukraine is greatly acknowledged – project no. 2020.02/0204 for OS, VD, OI, NM, VY.
References
- Pearton S. J. Norton D. P. Ip K. Heo Y. W. Steiner T. Prog. Mater. Sci. 2005;50:293–340. [Google Scholar]
- Mishra P. K. Mishra H. Ekielski A. Talegaonkar S. Vaidya B. Drug Discovery Today. 2017;22:1825–1834. doi: 10.1016/j.drudis.2017.08.006. [DOI] [PubMed] [Google Scholar]
- Falamas A. Marica I. Popa A. Toloman D. Pruneanu S. Pogacean F. Nekvapil F. Silipas T. D. Stefan M. Mater. Sci. Semicond. Process. 2022;145:106644. [Google Scholar]
- Kozytskiy A. V. Stroyuk O. L. Kuchmiy S. Y. Dzhagan V. M. Zahn D. R. T. Skoryk M. A. Moskalyuk V. O. J. Mater. Sci. 2013;48:7764–7773. [Google Scholar]
- Lin R. Iang L. H. U. Hang W. E. Z. Uan S. H. R. Opt. Lett. 2018;43:2244–2247. doi: 10.1364/OL.43.002244. [DOI] [PubMed] [Google Scholar]
- Jacinto M. J. Vasconcelos L. G. Sousa Jr P. T. Dall’Oglio E. L. Ferreira L. F. Silva C. F. Oliveira E. S. J. Sol-Gel Sci. Technol. 2019;91:21–32. [Google Scholar]
- Soltys L. Olkhovyy O. Tatarchuk T. Magnetochemistry. 2021;7:145. [Google Scholar]
- Stan M. Popa A. Toloman D. Stan M. Popa A. Toloman D. Silipas T. Vodnar C. Katona G. AIP Conf. Proc. 2017;1700:060004. [Google Scholar]
- Tabassam L. Jawad M. Shahzad K. Shaukat H. Khattak A. Karim S. Bhatti A. S. J. Sol-Gel Sci. Technol. 2022;101:401–410. [Google Scholar]
- Stan M. Popa A. Toloman D. Dan T. S. Vodnar C. Acta Metall. Sin. 2016;29:228–236. [Google Scholar]
- Dzhagan V. Smirnov O. Kovalenko M. Mazur N. Hreshchuk O. Taran N. Plokhovska S. Pirko Y. Yemets A. Yukhymchuk V. Zahn D. R. T. Chemosensors. 2022;10:129. [Google Scholar]
- Stan M. Popa A. Toloman D. Dehelean A. Lung I. Katona G. Mater. Sci. Semicond. Process. 2015;39:23–29. [Google Scholar]
- Adriana G. Florea A. Olteanu D. Clichici S. David L. Moldovan B. Cenariu M. Scrobota I. Potara M. Baldea I. Mater. Sci. Eng., C. 2021;123:111974. doi: 10.1016/j.msec.2021.111974. [DOI] [PubMed] [Google Scholar]
- Borovaya M. Horiunova I. Plokhovska S. Pushkarova N. Blume Y. Yemets A. Int. J. Mol. Sci. 2021;22:12202. doi: 10.3390/ijms222212202. [DOI] [PMC free article] [PubMed] [Google Scholar]
- David L. Moldovan B. Nanomaterials. 2020;10:202. doi: 10.3390/nano10020202. [DOI] [PMC free article] [PubMed] [Google Scholar]
- Huang Y. Haw C. Y. Zheng Z. Kang J. Zheng J. Wang H. Adv. Sustainable Syst. 2021;5:2000266. [Google Scholar]
- Sadiq H. Sher F. Sehar S. Lima E. C. Zhang S. Iqbal H. M. N. J. Mol. Liq. 2021;335:116567. [Google Scholar]
- Mikac L. Ivanda M. Gotic M. Mihelj T. Horvat L. J. Nanopart. Res. 2014;16:2748. [Google Scholar]
- Thu T. Pham H. Vu X. H. Dien N. D. Trang T. T. Thi T. Chi K. Phuong P. H. Nghia N. T. RSC Adv. 2022;12:7850–7863. doi: 10.1039/d2ra00620k. [DOI] [PMC free article] [PubMed] [Google Scholar]
- Al-ansari M. M. Dhasarathan P. Ranjitsingh A. J. A. Al-humaid L. A. Saudi J. Biol. Sci. 2020;27:2993–3002. doi: 10.1016/j.sjbs.2020.09.008. [DOI] [PMC free article] [PubMed] [Google Scholar]
- Seo D. J. Choi C. Viruses. 2021;13:350. doi: 10.3390/v13020350. [DOI] [PMC free article] [PubMed] [Google Scholar]
- Jeevan V. Ghosh R. Girigoswami A. Girigoswami K. BBA Adv. 2022;2:100051. doi: 10.1016/j.bbadva.2022.100051. [DOI] [PMC free article] [PubMed] [Google Scholar]
- Smirnov O. E. Kalynovskyi V. Y. Yumyna Y. M. Zelena P. P. Skoryk M. A. Dzhagan V. M. Taran N. Y. Ukr. Biochem. J. 2021;93:102–110. [Google Scholar]
- Sabine T. M. Hogg S. Acta Crystallogr., Sect. B: Struct. Crystallogr. Cryst. Chem. 1968;B25:2254–2256. [Google Scholar]
- Abbasi B. H. Hano C. RSC Adv. 2017;7:15931–15943. [Google Scholar]
- Ishak N. A. I. Kamarudin S. K. Timmiati S. N. Mater. Res. Express. 2019;6:112004. [Google Scholar]
- Snedeker L. P. Risbud A. S. Masala O. Zhang J. P. Seshadri R. Solid State Sci. 2005;7:1500–1505. [Google Scholar]
- Strelchuk V. Kolomys O. Rarata S. Lytvyn P. Khyzhun O. Chey C. O. Nur O. Willander M. Nanoscale Res. Lett. 2017;12:351. doi: 10.1186/s11671-017-2127-4. [DOI] [PMC free article] [PubMed] [Google Scholar]
- Vinogradov V. S. Dzhagan V. N. Zavaritskaya T. N. Kucherenko I. V. Mel’nik N. N. Novikova N. N. Janik E. Wojtowicz T. Plyashechnik O. S. Zahn D. R. T. Phys. Solid State. 2012;54:2083–2090. [Google Scholar]
- Online V. A. Lopes O. F. Umar A. Chuahan M. S. Kumar R. Chauhan S. Ribeiro C. New J. Chem. 2015;39:4624–4630. [Google Scholar]
- Romčević N. Kostić R. Romčević M. Hadžić B. Kuryliszyn-Kudelska I. Dobrowolski W. D. Narkiewicz U. Sibera D. Acta Phys. Pol., A. 2008;114:1323–1328. [Google Scholar]
- Romčević N. Kostić R. Hadžić B. Romčević M. Kuryliszyn-Kudelska I. Dobrowolski W. D. Narkiewicz U. Sibera D. J. Alloys Compd. 2010;507:386–390. [Google Scholar]
- Hadžić B. Romčević N. Romčević M. Kuryliszyn-Kudelska I. Dobrowolski W. Trajić J. Timotijević D. Narkiewicz U. Sibera D. J. Alloys Compd. 2012;540:49–56. [Google Scholar]
- Hadzic B. Matovic B. Randjelovic M. Kostic R. Romcevic M. Trajic J. Paunovic N. Romcevic N. J. Raman Spectrosc. 2021;52:616–625. [Google Scholar]
- Shtepliuk I. Khyzhun O. Lashkarev G. Khomyak V. Lazorenko V. Acta Phys. Pol., A. 2012;122:1034–1038. [Google Scholar]
- Rani T. D. Tamilarasan K. Elangovan E. Leela S. Ramamurthi K. Thangaraj K. Himcinschi C. Trenkmann I. Schuize S. Hietschold M. Liebig A. Salvan G. Zahn D. R. T. Superlattices Microstruct. 2015;77:325–332. [Google Scholar]
- Toma M. Selyshchev O. Havryliuk Y. Pop A. Zahn D. R. T. Photochem. 2022;2:515–527. [Google Scholar]
- V Panasiuk Y. V. Raevskaya O. E. E. Stroyuk O. L. L. Kuchmiy S. Y. Y. Dzhagan V. M. M. Hietschold M. Zahn D. R. T. R. T. Nanotechnology. 2014;25:075601. doi: 10.1088/0957-4484/25/7/075601. [DOI] [PubMed] [Google Scholar]
- Fan H. J. Fuhrmann B. Scholz R. Himcinschi C. Berger A. Leipner H. Dadgar A. Krost A. Christiansen S. Gösele U. Zacharias M. Nanotechnology. 2006;17:S231–S239. [Google Scholar]
- Dzhagan V. Stroyuk O. Raievska O. Isaieva O. Kapush O. Selyshchev O. Yukhymchuk V. Valakh M. Nanomaterials. 2020;10:2565. doi: 10.3390/nano10122565. [DOI] [PMC free article] [PubMed] [Google Scholar]
- Kasumov A. M. Strelchuk V. V. Kolomys O. F. Bykov O. I. Yukhymchuk V. O. Zahornyi M. M. Korotkov K. A. Karavaieva V. M. Korychev S. F. Ievtushenko A. I. Semicond. Phys., Quantum Electron. Optoelectron. 2021;24:139–147. [Google Scholar]
- Ratajczak R. Prucnal S. Guziewicz E. Mieszczynski C. Snigurenko D. Stachowicz M. Skorupa W. Turos A. J. Appl. Phys. 2017;121:075101–075108. [Google Scholar]
- Ratajczak R. Guziewicz E. Prucnal S. Łuka G. Böttger R. Heller R. Mieszczynski C. Wozniak W. Turos A. Phys. Status Solidi A. 2018;215:1700889. [Google Scholar]
- Khomchenko V. Sopinskyy M. Mazin M. Dan V. Lytvyn O. J. Lumin. 2019;213:519–524. [Google Scholar]
- Raevskaya A. E. Panasiuk Y. V. Stroyuk O. L. Kuchmiy S. Y. Dzhagan V. M. Milekhin A. G. Yeryukov N. A. Sveshnikova L. A. Rodyakina E. E. Plyusnin V. F. Zahn D. R. T. RSC Adv. 2014;4:63393–63401. [Google Scholar]
- Qin F. F. Xu C. X. Chen F. Zhu Q. X. Lu J. F. You D. T. Xu W. Zhu Z. Manohari A. G. Nanoscale. 2018;10:623–627. doi: 10.1039/c7nr07846c. [DOI] [PubMed] [Google Scholar]
- Dzhagan V. Kapush O. Plokhovska S. Buziashvili A. Pirko Y. Yeshchenko O. Yukhymchuk V. Yemets A. Zahn D. R. T. RSC Adv. 2022;12:21591–21599. doi: 10.1039/d2ra03605c. [DOI] [PMC free article] [PubMed] [Google Scholar]
- Orletskyi I. G. Solovan M. M. Brus V. V. Pinna F. Cicero G. Maryanchuk P. D. Maistruk E. V. Ilashchuk M. I. Boichuk T. I. Tresso E. J. Phys. Chem. Solids. 2017;100:154–160. [Google Scholar]
- Khademian M. Zandi M. Amirhoseiny M. Dorranian D. J. Cluster Sci. 2017;28:2753–2764. [Google Scholar]
- Andrade G. R. S. Nascimento C. C. Lima Z. M. Teixeira-Neto E. Costa L. P. Gimenez I. F. Appl. Surf. Sci. 2016;399:573–582. [Google Scholar]
- Muravitskaya A. Rumyantseva A. Kostcheev S. Dzhagan V. Stroyuk O. Adam P.-M. Opt. Express. 2016;24:A168–A173. doi: 10.1364/OE.24.00A168. [DOI] [PubMed] [Google Scholar]
- Pal A. K. Mohan D. B. Appl. Surf. Sci. 2015;333:244–253. [Google Scholar]
- Xu C. Qin F. Zhu Q. Lu J. Wang Y. Li J. Lin Y. Cui Q. Shi Z. Manohari A. G. Nano Res. 2018;11:3050–3064. [Google Scholar]
- Liu Y. Xu C. Lu J. Zhu Z. Zhu Q. Manohari A. G. Shi Z. Appl. Surf. Sci. 2018;427:830–836. [Google Scholar]


