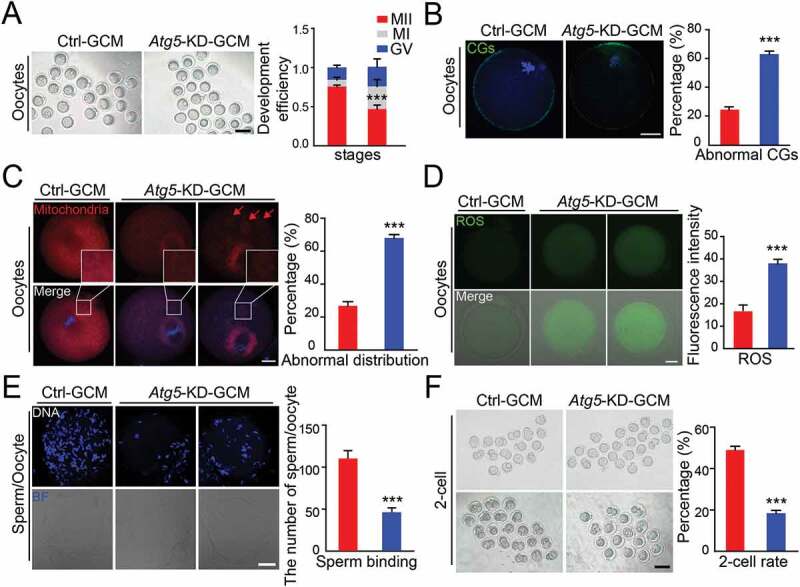
Figure 3.

Atg5-mediated cell autophagy promotes oocyte maturation and improves embryo development. (A) Representative images of matured oocytes co-cultured in control and Atg5 knockdown cumulus granulosa cells. The rate of PB1 was recorded from three independent biological replicates to indicate oocyte maturation, n = 40 oocytes in each group. Scale bar: 80 mm. (B, C, and D) Representative images of CG distribution (B), mitochondrial distribution, aggregated mitochondrial in the cytoplasm is marked in red (C), and ROS levels (D) stained with indicated antibody in control and Atg5 knockdown groups. Scale bar: 20 μm. (E) Representative images of sperm binding to the zona pellucida of matured oocytes co-cultured in control and Atg5 knockdown cumulus granulosa cells. The sperm binding to the surface of the zona pellucida surrounding oocytes were counted from control and Atg5 knockdown groups. Scale bar: 20 μm. (F) Representative images of early embryos developed from control (n = 16; n = 20) and Atg5 knockdown (n = 16; n = 23) groups and the rate of 2 cell embryos was recorded. The rate of 2 cell was recorded from three independent biological replicates. Scale bar: 50 μm. The data in (B), (C), (D), and (E) are presented as mean percentage (mean ± SEM) of at least three independent experiments, n = 30 oocytes in each group. ***p < 0.001 by unpaired two-tailed Student’s t test.
