Figure 4.

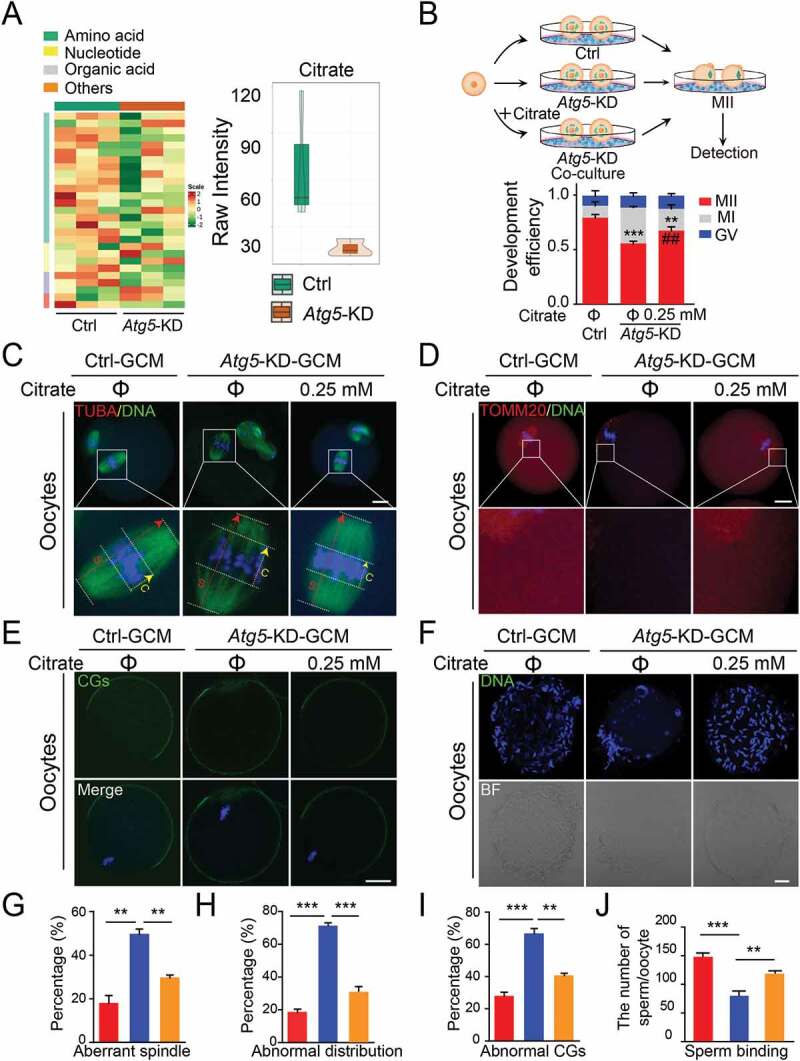
Citrate supplementation improves the quality of oocytes. (A) Heatmap illustration displaying cell culture metabolites of control and Atg5 knockdown groups, classified by metabolic pathways. (Right panel) Violin plots showing the metabolomic level of citrate in control and Atg5 knockdown groups. Mean Raw intensity are indicated by the numerical value. (B) Schematic protocols for citrate supplementation experiment. (Right panel) The rate of PB1 was recorded in control (n = 30), Atg5 knockdown (n = 40), and Atg5 knockdown + citrate (n = 45) groups after maturation for 15 h in vitro, Data are presented as mean percentage (mean ± SEM) of at least three independent experiments. (C, D, and E) Representative images of meiotic spindle and chromosomes (C), mitochondrial distribution (D), and CG distribution (E) in control, Atg5 knockdown and Atg5 knockdown + citrate groups. Oocytes were immunoassayed with indicated antibody to show the spindle, C indicates maximal span of chromosomes; S indicates maximal spindle lengths (C), TOMM20 (D), and CG (E), respectively. Scale bar: 20 μm. (f) Representative images of sperm binding to the zona pellucida of matured oocytes co-cultured in control, Atg5 knockdown and Atg5 knockdown + citrate groups. Scale bar: 20 μm. (G, H, I and J) The rate of aberrant spindles (G), abnormal mitochondria distribution (H), mis-localized CGs (I) and the number of sperm binding to the surface of the zona pellucida surrounding oocytes were recorded in groups, respectively. Data in (G), (H), (I), and (J) are presented as mean percentage (mean ± SEM) of at least three independent experiments. **p < 0. 01, ***p < 0.001 by unpaired two-tailed Student’s t test.
