

Abstract
Purpose
This study aimed to develop and demonstrate the in vivo feasibility of a 3D stack-of-spiral balanced steady-state free precession(3D-bSSFP) urea sequence, interleaved with a metabolite-specific GRE sequence for pyruvate and metabolic products, for improving the signal-to-noise ratio(SNR) and spatial resolution of the first hyperpolarized 13C MRI human study with injection of co-hyperpolarized [1-13C]pyruvate and [13C,15N2]urea.
Methods
A metabolite-specific bSSFP urea imaging sequence was designed using a urea-specific excitation pulse, optimized repetition time(TR), and 3D stack-of-spiral readouts. Simulations and phantom studies were performed to validate the spectral response of the sequence. The image quality of urea data acquired by the 3D-bSSFP sequence and the 2D gradient echo(2D-GRE) sequence was evaluated with two identical injections of co-hyperpolarized [1-13C]pyruvate and [13C,15N2]urea formula in a rat. Subsequently, the feasibility of the acquisition strategy was validated in a prostate cancer patient.
Results
Simulations and phantom studies demonstrated that 3D-bSSFP sequence achieved urea-only excitation, while minimally perturbing other metabolites(<1%). An animal study demonstrated that compared to GRE, bSSFP sequence provided an approximately 2.5-fold improvement in SNR without perturbing urea or pyruvate kinetics, and bSSFP approach with a shorter spiral readout reduced blurring artifacts caused by J-coupling of [13C,15N2]urea. The human study demonstrated the in-vivo feasibility and data quality of the acquisition strategy.
Conclusion
The 3D-bSSFP urea sequence with a stack-of-spiral acquisition demonstrated significantly increased SNR and image quality for [13C,15N2]urea in co-hyperpolarized [1-13C]pyruvate and [13C,15N2]urea imaging studies. This work lays the foundation for future human studies to achieve high-quality and high-SNR metabolism and perfusion images.
Keywords: human clinical study, 13C hyperpolarization, bSSFP, urea, metabolism imaging, perfusion imaging
1. Introduction
Hyperpolarized magnetic resonance imaging has become essential for the characterization, treatment selection, and monitoring treatment response of tumors.1–3 While performing these assessments based on anatomy and structure is valuable, other functional imaging targets such as metabolism and perfusion provide information at the cellular and tissue level to improve such assessments.4–7 Combining metabolism and perfusion is particularly attractive because alterations in both processes are hallmarks of cancer.8–11 Concurrence or mismatch in the changes in metabolism and perfusion has been shown to be particularly valuable for cancer assessment.8–12
Hyperpolarized 13C MRI offers the unique capability to simultaneously image perfusion and metabolism using co-hyperpolarized [1-13C]pyruvate and [13C,15N2]urea, where each compound and downstream metabolic products can be separately imaged according to their chemical shifts.4,13–15 This is a distinct advantage over positron emission tomography (PET), where metabolic and perfusion probes cannot be distinguished from each other and thus would require separate injections.
Our recent work has developed the co-polarization procedure of [1-13C]pyruvate and [13C,15N2]urea on a clinical SPINlab DNP polarizer, investigated its safety profile, and demonstrated the imaging feasibility of this imaging probe in pre-clinical studies using a 3T clinical MRI scanner.15 Regulatory approvals from the U.S. Food and Drug Administration (FDA) for the investigational use of co-hyperpolarized [1-13C]pyruvate and [13C,15N2]urea in human studies was subsequently obtained.
In this work, we developed and demonstrated the in vivo feasibility of a specialized acquisition strategy for co-hyperpolarized [1-13C]pyruvate and [13C,15N2]urea to provide high SNR and improved spatial resolution. The design was based on an SNR-efficient 3D balanced steady-state free precession (bSSFP) sequence13,16–18 for urea combined with rapid metabolite specific imaging for pyruvate.19,20 This approach builds off our recent work using the metabolite-specific bSSFP for 13C-lactate21 that provided an over 2-fold SNR improvement and was translated into human studies. The co-hyperpolarized [1-13C]pyruvate and [13C,15N2]urea strategy was tested in simulation, validated and characterized in phantoms and animal models, before being applied in first-in-human study demonstrating feasibility in prostate.
2. Methods
Sequence Design and Simulations
The strategy developed for co-hyperpolarized [1-13C]pyruvate and [13C,15N2]urea uses a metabolite-specific gradient echo (GRE)19,20 for pyruvate and its metabolic products (lactate in this work) interleaved with a metabolite-specific bSSFP sequence for urea that we hypothesized will provide SNR benefits due to refocusing and the long T2 relaxation times of [13C, 15N2]urea.13
The metabolite-specific 3D bSSFP urea sequence (Figure 1) designed in this study consists of spectrally-selective multiband RF pulses, corresponding catalyzation RF pulses with amplitude increment/decrement, center-out uniform density stack-of-spiral readouts, and a spoiler gradient. The RF pulse applied to excite [13C,15N2]urea resonance was designed based on a published multiband RF pulse design approach21,22 for minimizing the pulse duration. The parameters of this RF pulse include 6ms pulse duration, 0.252G maximum B1, 60Hz passband on urea frequency, which can cover ±20Hz JCN splitting frequencies, 40Hz-stopband with 0.4% ripples on pyruvate (240Hz) frequency, and 40Hz-stopband with 0.45% ripples on alanine (425Hz), pyruvate hydrate (507Hz), and lactate (635Hz) frequencies (Figure 2(a&b)). To decrease the excitation intensity on the bicarbonate frequency from to initial designs15, the center frequency of passband was higher to move the bicarbonate frequency out of passband of urea (Figure SI-2(a&c)). Correspondingly, the signal response of bSSFP is decreased by 50% in the new designed RF pulse (Figure SI-2(b&d)). In the bSSFP sequence, the excitation train was set as a series of alternating flip angle pulses to oscillate magnetization around z-axis. To suppress signal oscillation and obtain a stable frequency response from the first readout, a set of catalyzation pulses were applied before acquisition. They were composed of six identical pulses with a nonlinear amplitude increment (i.e., 2.5°, 6°, 19°, 34.5°, 46.5°, 50°). The acquisition used the 3D stack-of-spiral readout with 4 interleaves and 16 stacks for kz encoding. All gradients were balanced within each repetition time (TR). After the acquisition, the magnetization was returned to z-axis by a set of reversed order catalyzation pulses. Considering the catalyzation pulses can be affected by B1 field inhomogeneity, one spoiler gradient was applied in z-axis to crush residual magnetization in xy-plane at the end of the sequence.
FIGURE 1.

The proposed 3D urea bSSFP sequence consists of catalyzation, 3D-bSSFP stack-of-spiral acquisition (urea-selective RF excitation pulse and stack-of-spiral readout), and spoiler gradients. The stack-of-spiral readout has 16 slices per stack, and each slice has 4 interleaves. The highlighted grey region denotes the spiral readout duration (4ms).
FIGURE 2.

The corresponding excitation profiles of metabolite-specific bSSFP urea sequence and urea phantom results. (a) Bloch simulation of the excitation profile for the RF pulse alone; (b) Zoomed views (±40Hz) of excitation profiles at each metabolite frequency. The excitation pulse has a 6ms duration, 60Hz passband on urea (0Hz), 40Hz stopband with 0.4% ripples on pyruvate (240Hz) frequency, 0.45% ripples on alanine (425Hz), pyruvate hydrate (507Hz), and lactate (635Hz) frequencies. (c) The simulated excitation profile (red line) including the RF pulse and bSSFP sequence using the averaged magnetization of 64 pulses. The vertical green dot lines show the frequency locations of banding artifacts. (d) Zoomed views (±40Hz) of excitation profiles at each metabolite frequency. (e) 13C urea phantom images. The grey circles and arrows show the location of the urea phantom. The normalized signals of urea phantom measurements are indicated pointed by the blue cross points. The experimental results showed excellent agreement with simulation.
The steady state magnetization of the bSSFP sequence is sensitive to the off-resonance frequencies that cause dephasing within TR and cause banding artifacts that occur periodically at intervals of . 23 A longer TR allows longer readouts with higher SNR efficiency but is more sensitive to the off-resonance frequencies. In this sequence, the optimal TR was set as 12.26ms to maximize the distance between the banding artifacts frequencies and the other metabolite frequencies. Meanwhile, the banding artifacts can be suppressed by a larger flip angle, but the optimal flip angle of bSSFP sequence is smaller in the short T2 tissues (Figure 3(a)). To compare the bSSFP sequence and GRE sequence, the flip angle of bSSFP was chosen as 50°, whose effective flip angle equaled to the optimal flip angle of GRE (25°), providing a tradeoff between banding artifacts and residual magnetization for dynamic metabolic imaging. This 3D bSSFP urea sequence was implemented on a 3T GE MRI scanner (MR750, GE Healthcare, Waukesha, WI) using an additional scanner control commercial software (RTHawk Reseach, HeartVista, Los Altos, CA) to implement the bSSFP sequence for [13C,15N2]urea acquisition and the metabolite-specific 2D-GRE sequence for acquisition of HP [1-13C]pyruvate and its metabolites.
FIGURE 3.
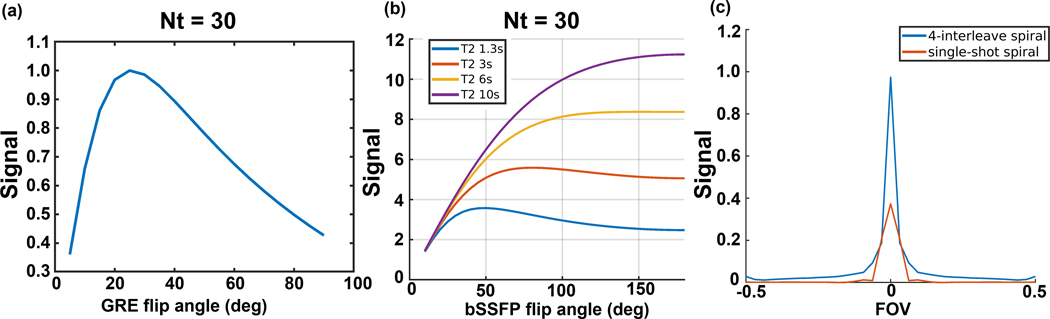
(a&b) Simulations of GRE and bSSFP urea AUC signal with 30 timepoints and a 3s temporal resolution. (c) Simulated PSFs of a 4-interleave spiral readout as used in the bSSFP sequence and single-shot spiral readout as used in the GRE sequence for [13C,15N2]urea with JCN splitting frequencies (±20Hz).
The RF pulse excitation profile was calculated using Bloch simulation. The simulation parameters were 6 catalyzation RF pulses with ramp increasing flip angles, T1 = 30s, T2 = 1s, TR = 12.26ms, number of TR = 64, and flip angle = . The excitation profile shown in Figure 2(c) is the averaged transverse magnetization of all bSSFP acquisitions.
The GRE and bSSFP signal in a dynamic urea acquisition were simulated using analytic models24. The simulation parameters of the GRE sequence were T1 = 30s, readout duration = 22ms, TR = 3s, time points = 30. The simulation parameters of bSSFP sequence were readout duration = 4ms, TR = 12.26ms, T1 = 30s, number of TR per time point = 64, temporal resolution = 3s, time points = 30. The simulated AUC signals are shown as a function of applied flip angles in Figures 3(a&b) and normalized by the maximum signal of the GRE sequence.
The point spread functions (PSF) with JCN splitting frequencies of [13C,15N2]urea were simulated for the 4-interleaved spiral readout used in the bSSFP sequence and the single-shot spiral readout used in the GRE sequence. The simulation parameters were JCN coupling frequencies = ±20Hz, peak ratio = 1:2:1, readout duration of 4-interleaved spiral = 4ms, readout duration of single-shot spiral = 22ms, sampling rate = 200kHz. The PSF of two spiral readouts are shown in Figure 3(c).
Phantom Experiment
To measure the excitation profile of the RF pulse, phantom experiments were performed on a 13C-enriched sodium 8M urea phantom (diameter = 1cm, length = 6.5cm) doped with a Gd-based contrast agent () with a single-channel 13C transceiver birdcage coil. The 13C images were acquired at the frequencies of bicarbonate, urea, pyruvate, alanine, pyruvate hydrate, and lactate. For bicarbonate and urea frequencies, 13C images were acquired with a frequency offset from −20Hz to 20Hz. For the frequencies of other four metabolites, 13C images were acquired with a frequency offset from −40 to 40Hz. In this acquisition of phantom study, the frequency step size was set as 10Hz. Other main parameters included diameter of urea phantom = 1cm, resolution = 1×1cm2, TR = 500ms, flip angle = , and NEX = 400.
Animal Experiment
The co-hyperpolarized [1-13C]pyruvate and [13C,15N2]urea animal study was performed on a healthy adult Sprague-Dawley rat (490g, 24 weeks old) with two identical injections of co-hyperpolarized [1-13C]pyruvate and [13C,15N2]urea to compare the metabolite-specific 3D bSSFP sequence (3D-bSSFP) with metabolite-specific 2D gradient echo sequence (2D-GRE). All animal experiments were performed according to the University of California, San Francisco Institutional Animal Care and Use Committee (IACUC) approved protocols. All animal data were acquired by a 1H/13C transceiver single channel birdcage coil.
The co-hyperpolarized [1-13C]pyruvate and [13C,15N2]urea imaging contrast agents were prepared and polarized as previously reported 15. Briefly, 0.378g [13C,15N2]urea (ISOTEC MilliporeSigma, Miamisburg, OH) prepared in sterile water (9.6M) with AH111501 sodium salt (12.5mM) was loaded in a cryovial first. Subsequently, a mixture of 1.098g [1-13C]pyruvic acid (ISOTEC, MilliporeSigma, Miamisburg, OH) and AH111501 (12.5mM in pyruvic acid) was loaded to the cryovial on the top of [13C,15N2]urea. The resulting mixture was loaded into a 5T SPINlab system (GE Healthcare, Waukesha, WI) and polarized at 0.8K with 139.96GHz microwaves for ~5h. After polarization, the polarized frozen sample was rapidly dissolved in 41mL pressurized superheated (130°C) sterile water and then neutralized by a buffer solution prepared as a mixture of 13.5g of neutralization media consisting of NaOH (600mM) and Tris (333mM) and 19.0g of sterile water to produce a hyperpolarized [1-13C]pyruvate and [13C,15N2]urea solution with pH of 7.2–7.5. The final concentrations of formulation are pyruvate 146.3–153.9mM, urea 33.5–37.7mM, Tris ~66.6mM. The osmolality measured by a micro osmometer (μ OSMETTE precision system) is ~390 (mOsm/kg H2O). For each scan, the rat was intravenously injected with 2.5mL of the solution via tail vein in 12s. The rat’s respiration was checked before and after injection.
The sequence parameters of co-hyperpolarization study for the animal experiments were shown in Table 1. The signal of [1-13C]pyruvate and its downstream metabolite [1-13C]lactate were acquired by the metabolite-specific 2D-GRE sequence in both injections. 13C-urea signal was acquired by the metabolite-specific 3D-bSSFP in the first injection (Experiment A) and the metabolite-specific 2D-GRE in the second injection (Experiment B).
TABLE 1.
A summary of 13C sequence parameters used in animal study and human study.
| (a) Sequence parameters for animal experiments | ||
|---|---|---|
| Experiment A | Experiment B | |
| Pyruvate | Metabolite-Specific 2D-GRE, lactate to pyruvate frequency 395Hz, FOV 8×8×21cm, resolution 2.5×2.5×21mm, Tread 22ms, TR 100ms, temporal resolution 3s, flip angle for pyruvate, flip angle 3 for lactate, 30 timepoints | |
| Lactate | ||
| Urea | Metabolite-Specific 3D-bSSFP, urea to pyruvate frequency −240Hz, FOV 8×8×33.6cm, resolution 2.5×2.5×21mm, Tread 4ms, TR 12.26ms, flip angle | Same sequence as pyruvate and lactate except urea to pyruvate frequency −240Hz, flip angle for urea |
| (b) Sequence parameters for human study | |
|---|---|
| Pyruvate | Metabolite-Specific 2D-GRE, lactate to pyruvate frequency 395Hz, FOV 22.4×22.4×11.6cm, resolution 7×7×11.6mm, Tread 22ms, TR 80ms, temporal resolution 2.6s, flip angle for pyruvate, flip angle 3 for lactate, 20 timepoints |
| Lactate | |
| Urea | Metabolite-Specific 3D-bSSFP, urea to pyruvate frequency −240Hz, FOV 21.7×21.7×18.56cm, resolution 7×7×11.6mm, Tread 4ms, TR 12.26ms, flip angle |
| Frequency Calibration & Spectrum Acquisition | Slice-selective spectrum, slice thickness = 3cm, TR 150ms, flip angle for calibration before metabolite imaging acquisition, flip angle 9 for spectrum acquisition after metabolite imaging acquisition |
| B1+ Mapping | Pyruvate-Specific 2D-GRE with Bloch Siegert pulse, FOV 33.6×33.6cm, resolution 11.2×11.2mm, slice thickness = 3cm, TR 200ms, flip angle RF ±4.5kHz |
Notes: (a) Two experiments (A&B) were performed to compare urea signal acquired by two sequences. In experiment A, urea signal was acquired with metabolite specific 3D-bSSFP sequence while pyruvate and lactate signals were acquired with metabolite specific 2D-GRE sequence. In experiment B, all metabolite signals were acquired by metabolite specific 2D-GRE sequence; (b) urea data was acquired by metabolite specific 3D-bSSFP sequence for validating feasibility. Immediately following imaging, two 13C spectra data were acquired for calibration measurements.
The metabolite-specific 2D-GRE sequence consists of a spectral-spatial excitation pulse25, single-shot spiral readouts, and spoiler gradients. The parameters of RF pulse include the pulse duration 25.17ms, passband 80Hz, and stopband 770Hz. The readout gradient is a single-shot spiral gradient with 22ms duration. The spatial resolution, temporal resolution, and total acquisition time points were kept the same for both injection experiments. The acquisitions were automatically triggered at 5s after the injection started. In each acquisition, the frequency of [1-13C]pyruvate was calibrated before imaging acquisition, which was automatically triggered at 5s after the start of injection26. A real-time B1+ calibration27 was performed following the frequency calibration in Experiment A. In Experiment B, the acquisition was the same except that the B1 scaling was not updated but fixed to the value in Experiment A for comparison consistency.
Human Clinical Study
To demonstrate imaging feasibility of the optimized 3D-bSSFP urea sequence acquisition strategy in patients, a pre-surgical patient with histologically confirmed localized prostate cancer was recruited and consented after obtaining FDA IND (IND #109956) and UCSF institutional review board approval.
The formulation and composition of co-hyperpolarized [1-13C]pyruvate and [13C,15N2]urea solution for the human clinical studies were identical as the above-mentioned animal studies, but was performed using Good Manufacturing Practices (GMP) products under aseptic conditions in an ISO 5 environment with specific pharmacy kits (GE Healthcare, Milwaukee, WI). The mixture was loaded and polarized using an automated hyperpolarizer and quality control instrument of 5T SPINlab polarizer (GE Healthcare, Niskayuna, NY) for 4.35h before rapidly dissolved with 41mL of sterile water and forced through a mechanical filter to remove electron paramagnetic agent (EPA). The solution was subsequently neutralized using equivalent NaOH and Tris (hydroxyethyl) aminomethane. The receive assembly that accommodated quality-control processes provided rapid measurements of pyruvate concentration (176mM), pH (7.7), EPA concentration (0.8μM), temperature (), and hyperpolarization (36.5%) prior to the injection. In parallel, the co-hyperpolarized probe went through an integrity of the 0.2μm sterile filter (Saint-Gobain Life Sciences, Gaithersburg, MD). Finally, the co-hyperpolarized probes were injected at a dosage of 0.43mL/kg body weight with a rate of 5mL/s followed by a 20mL saline flush at 5mL/s.
The co-hyperpolarization human clinical study was performed on a 57-year-old man with a biopsy-proven prostate adenocarcinoma (Gleason score 4 + 5 = 9) located posteriorly in the peripheral zone of the mid-portion and apex of the prostate on the left. The 1H/13C imaging data from the human prostate was acquired using a clamshell transmit coil for signal excitation and a double-tuned 1H/13C endorectal coil for signal reception. The transmit gain of the coil was calibrated by a non-selective spectrum pre-scan using a built-in urea phantom (Figure SI-8). The parameters for 13C data acquisition are shown in Table 1. Data acquisition started at 8s after injection of co-polarized [1-13C]pyruvate and [13C,15N2]urea and saline flush was completed. A real-time [1-13C]pyruvate frequency calibration was performed over the region of the prostate before the perfusion/metabolic images were acquired. A single slice Bloch-Siegert B1+ map was acquired as a reference but was not used to update the transmit gain. With the acquisition design used for the animal study in Experiment A, the [1-13C]pyruvate and [1-13C]lactate data were acquired using a metabolite-specific 2D-GRE sequence and [13C,15N2]urea data using the metabolite-specific 3D-bSSFP urea sequence. After dynamic metabolic imaging, a spectral profile was acquired from the whole prostate volume in order to measure the frequencies of all the metabolites in vivo.
Reconstruction and Data Analysis
All data were processed using MATLAB 2021a (Mathworks Inc.). Spiral data were gridded using a Kaiser-Bessel gridding method28 (http://web.stanford.edu/class/ee369c/mfiles/gridkb.m). For the animal studies, the k-space data were directly inverse Fourier transformed to image domain after gridding. For the human study, a bulk off-resonance correction was applied during the reconstruction process. The off-resonance frequencies of different metabolites were measured from the frequency calibration data, and the spectrum acquisition data. To overlay the 13C images on the proton localizer images, the reconstructed images were zero-padded to match the resolution of FSE images with a 2D fermi filter to reduce truncation artifacts. The lactate-to-pyruvate ratio images were measured by the division of lactate area-under-curve (AUC) images to pyruvate AUC images with flip angle compensation. Hyperpolarized spectra were apodized by a Lorentzian function in time domain before applying Fourier transform.
In the phantom study, the signals of phantom voxel were measured by the AUC of the complex data. The signals at all offset frequencies were normalized by the signal at urea on-resonance frequency.
In the animal study, the AUC images and dynamic signals were normalized according to the concentrations of [1-13C]pyruvate and [13C,15N2]urea between two injections measured using a 13C NMR spectrometer and the noise levels calculated using the mean of signals in the last time point of each metabolite data. The dynamic signals were measured by the region of interest (ROI) on the right kidney of the rat (Figure 5).
FIGURE 5.
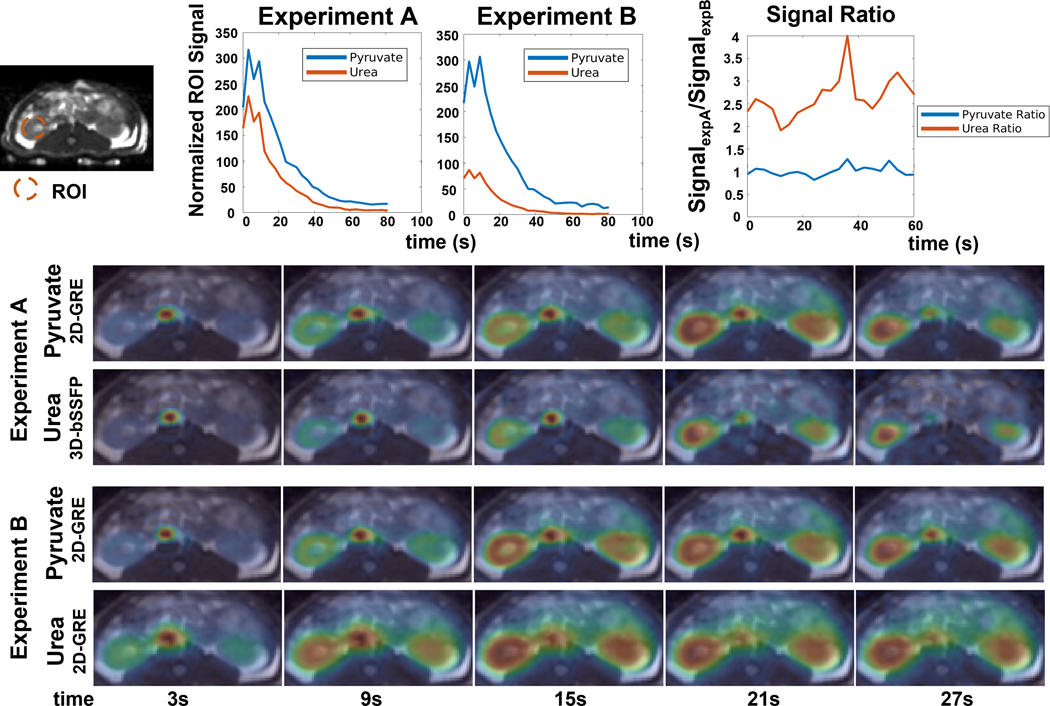
Comparison of the 3D-bSSFP urea sequence with a 2D-GRE sequence with dynamic kidney images of a healthy Sprague Dawley rat. Experiment A (pyruvate/lactate 2D-GRE, urea 3D-bSSFP) and Experiment B (pyruvate/lactate/urea 2D-GRE) were described in the methods. Dynamic curves of pyruvate and urea signals and their signal ratios were measured on the ROI region in the kidney region. All signals have been normalized by the concentration measured by 13C NMR spectrometer of each injection and corresponding noise levels. The urea signal levels were further divided by a factor of 4 according to the concentration equivalence of probes to present in the plots. Each dynamic figure is displayed with an independent color scale. The 3D-bSSFP urea sequence shows an approximately 2.5X SNR improvement over the 2D-GRE urea sequence.
In the human study, the AUC images and dynamic signals were normalized by the mean of noise at the last time point of each metabolite data. The dynamic signals of all metabolite data were measured using symmetrical ROIs placed on regions of healthy- and malignant appearing prostate on T2 and diffusion weighted images. For display, the urea phantom in the endorectal coil has been masked in the urea dynamic images.
3. Results
Excitation Simulation and Phantom Imaging
The Bloch simulated excitation profile of the 3D-bSSFP urea sequence using the averaged transverse magnetization over all readouts are shown in Figure 2(c). The banding artifacts (green dash lines) are separated from the other metabolites by at least 36Hz for pyruvate, 24Hz for alanine, and 23Hz for pyruvate hydrate and lactate. For the 50° excitation simulated here, a ±20Hz frequency shift leads to a 21% signal intensity increase for urea. Since the frequency difference between the resonance of central [13C, 15N2]urea and bicarbonate is only 82Hz, the RF pulse is unable to suppress excitation at bicarbonate frequency with a reasonably short pulse duration. In the simulation, the excitation signal intensity at bicarbonate frequency is 50.5% of that of urea.
A urea phantom study was performed for validating the excitation profile of the 3D-bSSFP urea sequence by measuring the signal intensity under different excitation frequencies in the Figure 2(e). Overall, these showed excellent agreement with simulation results. The pyruvate hydrate phantom image has a blurring artifact, which we believe was caused by the transient excitation from the nearby banding artifact of the sequence.
The levels of all the metabolites signals () in the 3D-bSSFP urea sequence were estimated by the concentration ratio () between all metabolites, the stopbands () of the bSSFP signal response, and the of the proposed readout at different offset frequencies with the equation 21. Based on Experiment B of the animal study, the concentration ratio of lactate to pyruvate was estimated by the signal level with a flip angle compensation (). The molar concentration ratio of pyruvate to urea was measured by NMR spectroscopy (). The stopband amplitudes were measured in the phantom study as 0.9% for pyruvate and 0.1% for lactate. The simulated off-resonance PSF amplitudes of the proposed readout were 0.197 for pyruvate and 0.085 for lactate (Figure SI-1). Thus, the signal level of undesired metabolites when imaging urea using the proposed 3D-bSSFP sequence were 0.75% for pyruvate and 0.002% for lactate.
To compare the signal response between two sequences, [13C,15N2]urea signal was simulated and point spread analysis was performed for GRE and bSSFP sequences. For the GRE sequence, the AUC signal only depends on T1 and flip angle. The total signal reaches its highest value when excited by a 25° flip angle, the same value used for our in vivo experiments. Meanwhile, the AUC signal of bSSFP sequence commonly depends on T1 and T2 and flip angle. In vivo [13C,15N2]urea has a relatively long T2, with T2 =1.3s measured in the vascular pool, T2 values of 3s to 10s in the kidneys.29 As shown in Figure 3(b), the optimal flip angle increases with a longer T2. The 50° flip angle used for our in vivo experiments is near optimal for the shortest T2=1.3s, but these results suggest that larger bSSFP flip angles may improve SNR if the urea T2 is longer. The PSF in Figure 3(c) shows the signal response of short and long readout duration of spiral readouts used in the bSSFP and GRE sequences, respectively. The peak PSF amplitudes are 0.974 for bSSFP and 0.373 for GRE, while the full-width half-maximum (FWHM) are ±0.02 FOV for bSSFP and ±0.05 FOV GRE. This demonstrates the severity of blurring introduced by the J-coupling of [13C,15N2]urea in the presence of long readout durations.
Animal Imaging
In the animal study, we compared HP 13C imaging results from two acquisition methods using 3D-bSSFP and 2D-GRE sequences on a rat’s kidney, liver, and cardiac slices (Figure 4). In the comparison of the urea AUC maps between Experiment A and Experiment B, no banding artifacts in the 3D-bSSFP images were observed. These could be ascribed to the loss of urea signal or spiral off-resonance artifacts if other metabolites were excited. This is consistent with the measured B0 map since the frequencies of the tissues in all three organ slices fell in the span of banding artifact frequency (ΔB0 < = ± 40 Hz). In the field map, the heart slice exhibits a much larger B0 inhomogeneity. In 2D-GRE sequence, the readout time was 22ms, which is much longer than 4ms of 3D-bSSFP sequence. Therefore, in the 2D-GRE images, the heart has a more severe off-resonance blurring artifact, while in the 3D-bSSFP images, the heart has a sharper edge that corresponds better with the anatomical image. Comparing the kidneys and liver slices in two experiments, the vessel signals in the pyruvate images appear identical, but the vessel signals in the urea images are different - more blurred vessel signals were observed with the 2D-GRE urea acquisition. The B0 maps showed an accurate resonance frequency in the kidneys and liver slice. Therefore, the blurred vessel signals were caused by the JCN dephasing of [13C,15N2]urea during the readout13,14, which agrees with a larger resolution loss of GRE simulated in Figure 3(b).
FIGURE 4.

Comparison of the 3D-bSSFP urea sequence with a 2D-GRE sequence on a healthy Sprague Dawley rat: Experiment A (pyruvate/lactate 2D-GRE, urea 3D-bSSFP) and Experiment B (pyruvate/lactate/urea 2D-GRE) AUC images. Each AUC image is scaled by its own maximum signal to visualize metabolite distribution. Lactate-to-pyruvate AUC ratio images are displayed with the fixed scale range [0, 0.5]. The 3D-bSSFP urea sequence shows improved image quality compared to the MS-GRE sequence, with better delineation of the vasculature, kidneys and heart due to the shorter readout length 15,21. The 2D-GRE sequence particularly suffers from more severe blurring artifacts in the heart than the 3D-bSSFP sequence where there is larger B0 inhomogeneity. Even when B0 inhomogeneity is small, the vessel signal acquired by 3D-bSSFP has a sharper edge in the kidneys and liver slices than data acquired by 2D-GRE because of the JCN coupling of [13C,15N2]urea.
The dynamic curves and dynamic renal images acquired by the 2D-GRE and 3D-bSSFP urea sequences were compared in Figure 5. The vessel is sharper acquired by the 3D-bSSFP sequence as was also shown in the AUC images. With a shorter readout time, the 3D-bSSFP sequence suffers less from off-resonance and J-coupling artifacts compared to the 2D-GRE sequence.
As shown in Figure 5, compared to the 2D-GRE urea sequence, the 3D-bSSFP urea sequence shows an approximately 2.5× SNR improvement over the 2D-GRE urea sequence, demonstrating a substantial improvement in performance. Furthermore, the SNR improvement is consistent across the acquisition, indicating no incidental saturation of pyruvate or accelerated urea signal loss due to the 3D-bSSFP urea sequence. The 3D-bSSFP urea sequence also has a similar signal decay rate as that of the 2D-GRE pyruvate signal.
Human Imaging
In the human prostate cancer study, a real-time frequency calibration was applied to calibrate based on the pyruvate frequency prior to the metabolite imaging acquisition. Figure 6(c) shows the spectrum profile of the frequency calibration. As shown in the first pyruvate image in Figure 6(b), after the frequency calibration, both the right recto-prostatic angle and left femoral vessels regions have high signal. This was 8s after the end of injection. Meanwhile, the B0 map (Figure 6(a) shows the 13C off-resonance frequency in the left femoral vessels region has a 20Hz shift compared to the prostate region. Thus, the spectrum data in the Figure 6(c) has two peaks with 20Hz difference. However, due to the higher signal in the left femoral vessels region when the pyruvate frequency was calibrated, there was an inadvertent offset in the prostate region. This was identified through the measurements shown in Figure 6(c), and the frequency offset was corrected in the prostate region. Furthermore, 20Hz shift is still within the passbands/stopbands of the imaging acquisitions.
FIGURE 6.

Co-hyperpolarized [1-13C]pyruvate and [13C,15N2]urea human imaging study. (a) B0 field map (scaled to 13C frequency), (b) pyruvate image acquired after frequency calibration, and (c&d) The 13C spectrum. The spectrum data before metabolite imaging acquisition in (c) has two [1-13C]pyruvate peaks with 20Hz difference. This can be explained by the B0 map in (a) that shows an off-resonance in the left superficial femoral vein region with 20Hz shift compared to the prostate region, and the initial pyruvate images in (b) showing signal near the prostate and the left superficial femoral vein. The spectrum data after metabolite imaging acquisition in the (d) shows frequency of urea to pyruvate is −244.6Hz, alanine to pyruvate is 195.7Hz, lactate to pyruvate is 401.1Hz, with single peaks for each metabolite due to localization to the prostate region.
Due to being the first clinical human study, one more slice-selective 13C spectrum data was acquired after the metabolite imaging to check the in vivo frequencies of all the metabolites. The spectrum profile is shown in Figure 6(d). The frequency differences of urea to pyruvate, alanine to pyruvate, and lactate to pyruvate were −244.6Hz, 195.7Hz, and 401.1Hz, respectively.
The AUC maps of pyruvate, lactate, urea, and lactate-to-pyruvate ratio images are shown in Figure 7. The T2-weighted, DWI/ADC, and DCE images were used to clinically characterize the tumor. All three metabolite images show a higher AUC in the tumor than that in the contra-lateral healthy-appearing prostate region. Comparing the pyruvate AUC images with urea AUC images, urea data shows higher relative signals in the vessels within the rectal wall. This phenomenon shows the difference in information between metabolite imaging and perfusion imaging.
FIGURE 7.

AUC maps of pyruvate, lactate, and urea, and lactate-to-pyruvate ratio images in the prostate across 5 slices. The biopsy-confirmed prostate tumor showed hypointensity on T2-weighted images, restricted diffusion on DWI/ADC, and early arterial enhancement on DCE images. All images of each metabolite used the same display range. The lactate-to-pyruvate ratio images were measured by the division of lactate AUC images to pyruvate AUC images with flip angle compensation. These show good image quality with no apparent artifacts.
The dynamic metabolite signal intensity over time curves between prostate tumor and contra-lateral prostate regions were shown in Figure 8. The [1-13C]pyruvate and [1-13C]lactate signals were acquired by the metabolite-specific 2D-GRE sequence and [13C,15N2]urea signal was acquired by the 3D-bSSFP urea sequence. The tumor signals of both pyruvate and urea reach their peaks at around 10.4s after acquisition. As to maximal signal intensity, the tumor voxel was approximately 2.5 times higher than the contralateral healthy-appearing prostate.
FIGURE 8.

Dynamic prostate images with pyruvate, lactate and urea signals, in SNR units and extracted dynamic curves of DCE images. Each dynamic figure is displayed with the independent color scale. The tumor signal of both pyruvate and urea reaches peak at around 10.4s after acquisition. The signal peak of tumor voxel is approximately 2.5 times higher than the signal peak of the contralateral prostate voxel in urea data, which agrees with the signal peak shown in the DCE curve.
4. Discussion
Urea Excitation for the bSSFP Sequence
In the design of the urea-only excitation sequence, we used a short TR in the bSSFP sequence and constrained the multiband RF pulse (Figure 1) for spectrally selective excitation on urea frequency, while minimizing the excitation of other metabolites. We determined the minimum pulse duration to be 6ms, which was constrained by the 240Hz frequency difference between urea and pyruvate at 3T. The efficiency of the bSSFP urea sequence would be reduced by using a longer duration pulse that would be required for avoiding excitation at the bicarbonate frequency.
We optimized the TR of the bSSFP sequence according to the banding pattern and excitation profile of the RF pulse. In the 13C bSSFP sequences, the banding can result in two types of artifacts: nulling of signals for the desired metabolite in the high-flip regime, and exciting undesired metabolites in the low-flip regime for which we have observed ring-shaped artifacts. Therefore, we aimed at using a shorter TR for both a larger frequency interval of banding artifacts and a larger difference between the banding artifacts frequencies and the other undesired metabolite frequencies. Considering the feasibility of the pulse duration and readout duration, we chose 12.26ms as the optimal TR of the bSSFP urea sequence.
Exciting undesired metabolites can introduce artifacts and reduce their magnetization. Comparing the AUC images in Figure 4 and the dynamic pyruvate signal ratio in Figure 5, there is no significant difference in pyruvate and lactate signals between using the 3D-bSSFP and 2D-GRE urea sequences. This is in good agreement with numerical simulation that estimate only 0.74% pyruvate and 0.002% lactate would be excited by the 3D-bSSFP urea sequence.
3D-bSSFP vs 2D-GRE
The 3D-bSSFP urea sequence is based on an interleaved spiral readout, which has a shorter readout duration than a single-shot spiral readout used in 2D-GRE sequence. This short readout duration can improve the efficiency of acquisition and provides a higher SNR in bSSFP sequence. Another advantage of short readout duration is to reduce the dephasing of the spins from J-coupling and T2* effects, which can provide a higher signal intensity in bSSFP sequence, as shown in Figure 3(c). A rough estimation of imaging SNR improvement in the dynamic imaging of bSSFP sequence to GRE sequence is shown in Figure 3(a&b), which shows an expected improvement of 3× for bSSFP. However, this simulation does not account for spatial filtering and blurring differences due to J-coupling or flow and bolus effects, which could explain why the actual SNR improvement of 3D-bSSFP is lower than the simulation results. In the animal study, 3D-bSSFP urea sequence shows a 2.5× SNR improvement compared to the 2D-GRE sequence. This is very similar to the previous 3D-bSSFP lactate sequence results that showed a 2 to 2.5× SNR improvement compared to a 2D-GRE sequence. Owing to a relatively long T2 (~1.3–10s) of [13C,15N2]urea in vivo29, the transverse magnetization can be efficiently used in the 3D-bSSFP sequence for improving the SNR of the urea images. For example, in the human study (Figure 8), the ratio of the dynamic signal of pyruvate to urea is around 2× in the prostate tumor and 1.3× in the contra-lateral prostate region. With the flip angle compensation, the signal ratios become 2×sin(50°/2)⁄ sin15°=3.27 and 1.3×sin(50°/2)⁄ sin15°=2.12, both of which are smaller than the molar equivalent of pyruvate to urea of 4 in the injected solution.
We also noticed that both 3D-bSSFP sequence and 2D-GRE sequence are sensitive to B0 inhomogeneity, and a good shimming prior to 13C spiral acquisition is essential to improve the image quality. In the 3D-bSSFP sequence, the excitation intensity will be perturbed due to a limited excitation bandwidth and a small flip angle. In the 2D-GRE sequence, the off-resonance effects lead to the blurring artifacts due to the long readout time combined with the JCN coupling (20Hz) of [13C,15N2]urea. Even with very good shimming, we still observed a blurring artifact in the vessel (Figure 4) due to dephasing from JCN coupling (20Hz) that was previously reported and cannot be eliminated.15 As the comparison results demonstrated in the animal study, the bSSFP sequence provides a new method to remove blurring artifacts caused by J-coupling splitting frequencies through an interleaved readout with a shorter TR, which was only addressed by multi-echo imaging in previous studies30.
Spiral Readout vs Cartesian Readout
We used an interleaved spiral readout gradient in the 3D-bSSFP urea sequence for accelerating the acquisition. This differs from the previous studies where [13C,15N2]urea data were acquired by a SSFP sequence with Cartesian readout.13,14,31 In these studies, only single slice [13C,15N2]urea data were acquired with low temporal resolution. In our spiral readout acquisition pipelines, multi-slice [1-13C]pyruvate, [1-13C]lactate and 3D [13C,15N2]urea data can be acquired one by one with 2.6s temporal resolution.
Human Study
Our previous HP 13C prostate cancer studies have used echo-planar readouts (EPI) for multiple metabolite dynamic imaging.6,32–34 They had a set of typical parameters including matrix size 16×16, resolution 8×8mm, and corresponding FOV is 12.8×12.8cm. The spiral readout used in our acquisitions used a higher in-plane spatial resolution of 7×7mm and larger FOV of 22×22cm. As shown in Figure 6(b) and Figure SI-3&5&7, the increased FOV allows us to observe the left femoral vessels signal in the first three time points, providing a valuable information for analyzing the probe perfusion in the blood vessels, for example, by using the arterial input function (AIF) in the analysis.35 This region is relatively far from the endorectal coil, which has dimensions of 2.5×8.5cm, and this determined the FOV used in the prior studies. Despite the distance from the endorectal surface coil, the vessel had sufficiently high signal to observe the bolus arrival. Moreover, the spiral readout has shorter TE than the EPI readout and will improve the SNR for 13C metabolites with a shorter T2*. These advantages of a spiral readout provide the potential to improve spatial resolution and coverage for HP 13C imaging.
Furthermore, we demonstrated the advancement of our sequences to the prior 13C MRI prostate cancer studies, which relied on lactate-to-pyruvate conversion. As shown in Figure 7, we can now simultaneously observe lactate production, pyruvate perfusion, and urea perfusion. The hyperpolarized [13C,15N2]urea is metabolically inert and almost exclusively experiences perfusion effects in vivo. However, the pyruvate, in addition to perfusion, is also metabolically active and undergoes cellular transport, so it is not an ideal measurement of perfusion. Thus the hyperpolarized [13C,15N2]urea plays an important role of characterizing the perfusion, and through co-polarization can also provide a simultaneous measurement to pyruvate for analysis. In particular, the urea signal can potentially be used to correct the vascular pyruvate signals that will confound metabolism measurements based on tissue perfusion.
Compared to using two separate injections, the co-injection of [1-13C]pyruvate and [13C,15N2]urea is more practical to minimize effects from patient physiology differences, motion between scans, and provides data for more accurate perfusion and metabolic signal modeling. However, in consideration of the safety issue of high osmolality in the injection, lower concentrations of pyruvate and urea must be applied in co-injection studies compared to separate injections, leading to an expected lower SNR. Considering the concentration of urea is only a quarter of pyruvate, it is necessary to design a more efficient bSSFP acquisition method for [13C,15N2]urea imaging. In addition, having more frequencies of metabolites present makes the spectral-selective RF pulse design and bSSFP sequence design more constrained.
One Bloch-Siegert B1+ map was acquired at the pyruvate frequency after the real-time frequency calibration. However, the pyruvate only has a high concentration in the vasculature in the early stage of the acquisition when calibration was performed. Thus, the B1+ map could not be accurately measured in the prostate region. This could be improved by moving the real-time B1+ mapping in the middle of acquisition in the future.
A urea phantom was placed in the endorectal coil for calibration and was excited by the 3D-bSSFP urea sequence. Due to the short readout time, the edge of phantom image is quite sharp. From the image acquired at last time point after the hyperpolarization has decayed (Figure SI-4), we determined that the phantom signal would not affect signal in the prostate region.
Limitations of Using 3D-bSSFP Sequence
For future human studies with co-hyperpolarized [1-13C]pyruvate and [13C,15N2]urea probes, we are aware of several important precautions in our data acquisition methods.
First, the short duration of the bSSFP RF pulse may lead to the signal contamination from bicarbonate, which has a small frequency to urea (−82Hz at 3T). However, this is not a major concern for prostate imaging due to the low level of bicarbonate typically seen in the prostate and surrounding tissues32. Also, 13C-bicarbonate will appear later in the dynamic acquisition, thus reducing its effect on the urea signal particularly in the early time points that can be used for perfusion analysis. For the organs with high bicarbonate signal (i.e., brain, heart), a variable TR approach36 or a quadratic RF phase37 may be able to control the bicarbonate excitation profile developed in the MR-Fingerprinting acquisition38. Another possible approach is to add multi-echo technique in the acquisition and separate bicarbonate and urea signal in the reconstruction process.39
Second, due to the sensitivity of the bSSFP sequence to B0 inhomogeneity, a real-time frequency calibration and shimming are crucial for good imaging quality. In the human prostate study, the high superficial femoral vein signal at the beginning of the acquisition affected the frequency calibration because of the field inhomogeneity. Thus, local shimming should be applied to a FOV covering the entire region where 13C signal maybe detected.
Third, the [13C,15N2]urea signal was acquired by a 3D imaging acquisition, which are more sensitive to motion effects compared to 2D methods. In comparison, [1-13C]pyruvate and [1-13C]lactate signal were acquired by a 2D imaging that are very fast and robust with motion. To minimize the motion sensitivity, we used a center-out spiral acquisition that will reduce motion-related artifacts in 3D-bSSFP urea sequence.
Fourth, because the T2 relaxation and excitation are different between pyruvate and urea, a more detailed model of the magnetization evolution will be useful to simultaneously analyze metabolic imaging of [1-13C]pyruvate and perfusion imaging of [13C,15N2]urea.
Lastly, to the advantage of longer T2 values, the 3D bSSFP urea sequence could use larger flip angles to provide a larger expected SNR improvement (Figure 3(b). In this study, we used a 50° flip angle to match to the effective GRE flip angle. Since the T2 value is variable among different tissues29, optimization of flip angle for the different anatomies is worthwhile to improve future human studies.
5. Conclusion
We have developed a highly efficient method for imaging co-hyperpolarized 13C pyruvate and urea for human studies. Using a metabolite-specific bSSFP strategy with RF pulses and a TR optimized for urea provided approximately 2.5-fold improvement in SNR compared to a GRE approach due to the repeated usage of the transverse magnetization. Furthermore, bSSFP had reduced blurring artifacts in vivo due to short readout durations, whereas the J-coupling of [13C,15N2]urea leads to noticeable blurring with GRE methods. The dynamic urea perfusion imaging capability was not affected by the bSSFP method, and 13C pyruvate imaging, performed with a metabolite-specific GRE approach, was also not affected by the bSSFP method. Finally, we demonstrated excellent results in the first-in-human study using co-hyperpolarized 13C pyruvate and urea, which is both the first-time multiple agents have been injected into a human as well as the first non-pyruvate agent used in a human subject. This work lays the foundation for future human studies to achieve high-quality, high-SNR, simultaneous metabolism and perfusion imaging.
Supplementary Material
References
- 1.Hanahan D, Weinberg RA. Hallmarks of cancer: The next generation. Cell. 2011;144(5):646–674. doi: 10.1016/j.cell.2011.02.013 [DOI] [PubMed] [Google Scholar]
- 2.Hanahan D, Weinberg RA. The Hallmarks of Cancer Review Evolve Progressively from Normalcy via a Series of Pre. Vol 100.; 2000. [Google Scholar]
- 3.Welch DR, Hurst DR. Defining the Hallmarks of Metastasis. Cancer Research. 2019;79(12):3011–3027. doi: 10.1158/0008-5472.CAN-19-0458 [DOI] [PMC free article] [PubMed] [Google Scholar]
- 4.von Morze C, Larson PEZ, Hu S, et al. Investigating tumor perfusion and metabolism using multiple hyperpolarized 13C compounds: HP001, pyruvate and urea. Magnetic Resonance Imaging. 2012;30(3):305–311. doi: 10.1016/j.mri.2011.09.026 [DOI] [PMC free article] [PubMed] [Google Scholar]
- 5.Wilson DM, Keshari KR, Larson PEZ, et al. Multi-compound polarization by DNP allows simultaneous assessment of multiple enzymatic activities in vivo. Journal of Magnetic Resonance. 2010;205(1):141–147. doi: 10.1016/j.jmr.2010.04.012 [DOI] [PMC free article] [PubMed] [Google Scholar]
- 6.Bok R, Lee J, Sriram R, et al. The role of lactate metabolism in prostate cancer progression and metastases revealed by dual-agent hyperpolarized 13 C MRSI. Cancers. 2019;11(2). doi: 10.3390/cancers11020257 [DOI] [PMC free article] [PubMed] [Google Scholar]
- 7.Mu C, Korenchan DE, Wang S, Wilson DM, Flavell RR. Tumor Microenvironment Biosensors for Hyperpolarized Carbon-13 Magnetic Resonance Spectroscopy. Molecular Imaging and Biology. 2021;23(3):323–334. doi: 10.1007/s11307-020-01570-0 [DOI] [PMC free article] [PubMed] [Google Scholar]
- 8.Kurhanewicz J, Vigneron DB, Ardenkjaer-Larsen JH, et al. Hyperpolarized 13C MRI: Path to Clinical Translation in Oncology. Neoplasia. 2019;21(1):1–16. doi: 10.1016/j.neo.2018.09.006 [DOI] [PMC free article] [PubMed] [Google Scholar]
- 9.Wang ZJ, Ohliger MA, Larson PEZ, et al. Hyperpolarized 13C MRI: State of the art and future directions. Radiology. 2019;291(2):273–284. doi: 10.1148/radiol.2019182391 [DOI] [PMC free article] [PubMed] [Google Scholar]
- 10.Kabir Anaraki A, Ayati M, Kazemi F. Magnetic resonance imaging-based brain tumor grades classification and grading via convolutional neural networks and genetic algorithms. Biocybernetics and Biomedical Engineering. 2019;39(1):63–74. doi: 10.1016/j.bbe.2018.10.004 [DOI] [Google Scholar]
- 11.van Elmpt W, Zegers CML, Reymen B, et al. Multiparametric imaging of patient and tumour heterogeneity in non-small-cell lung cancer: quantification of tumour hypoxia, metabolism and perfusion. European Journal of Nuclear Medicine and Molecular Imaging. 2016;43(2):240–248. doi: 10.1007/s00259-015-3169-4 [DOI] [PMC free article] [PubMed] [Google Scholar]
- 12.Chen HY, Larson PEZ, Bok RA, et al. Assessing prostate cancer aggressiveness with hyperpolarized dual-agent 3D dynamic imaging of metabolism and perfusion. Cancer Research. 2017;77(12):3207–3216. doi: 10.1158/0008-5472.CAN-16-2083 [DOI] [PMC free article] [PubMed] [Google Scholar]
- 13.Reed GD, von Morze C, Bok R, et al. High resolution 13C MRI with hyperpolarized urea: In vivo T 2 mapping and 15N labeling effects. IEEE Transactions on Medical Imaging. 2014;33(2):362–371. doi: 10.1109/TMI.2013.2285120 [DOI] [PMC free article] [PubMed] [Google Scholar]
- 14.Nielsen PM, Szocska Hansen ES, Nørlinger TS, et al. Renal ischemia and reperfusion assessment with three-dimensional hyperpolarized 13C,15N2-urea. Magnetic Resonance in Medicine. 2016;76(5):1524–1530. doi: 10.1002/mrm.26377 [DOI] [PubMed] [Google Scholar]
- 15.Qin H, Tang S, Riselli AM, et al. Clinical translation of hyperpolarized 13C pyruvate and urea MRI for simultaneous metabolic and perfusion imaging. Magnetic Resonance in Medicine. 2022;87(1):138–149. doi: 10.1002/mrm.28965 [DOI] [PMC free article] [PubMed] [Google Scholar]
- 16.Milshteyn E, von Morze C, Gordon JW, Zhu Z, Larson PEZ, Vigneron DB. High spatiotemporal resolution bSSFP imaging of hyperpolarized [1–13C]pyruvate and [1–13C]lactate with spectral suppression of alanine and pyruvate-hydrate. Magnetic Resonance in Medicine. 2018;80(3):1048–1060. doi: 10.1002/mrm.27104 [DOI] [PMC free article] [PubMed] [Google Scholar]
- 17.Leupold J, Månsson S, Stefan Petersson J, Hennig J, Wieben O. Fast multiecho balanced SSFP metabolite mapping of 1H and hyperpolarized 13C compounds. Magnetic Resonance Materials in Physics, Biology and Medicine. 2009;22(4):251–256. doi: 10.1007/s10334-009-0169-z [DOI] [PubMed] [Google Scholar]
- 18.Tang S, Meng M v., Slater JB, et al. Metabolic imaging with hyperpolarized 13C pyruvate magnetic resonance imaging in patients with renal tumors—Initial experience. Cancer. 2021;127(15):2693–2704. doi: 10.1002/cncr.33554 [DOI] [PMC free article] [PubMed] [Google Scholar]
- 19.Cunningham CH, Chen AP, Lustig M, et al. Pulse sequence for dynamic volumetric imaging of hyperpolarized metabolic products. Journal of Magnetic Resonance. 2008;193(1):139–146. doi: 10.1016/j.jmr.2008.03.012 [DOI] [PMC free article] [PubMed] [Google Scholar]
- 20.Gordon JW, Vigneron DB, Larson PEZ. Development of a symmetric echo planar imaging framework for clinical translation of rapid dynamic hyperpolarized 13C imaging. Magnetic Resonance in Medicine. 2017;77(2):826–832. doi: 10.1002/mrm.26123 [DOI] [PMC free article] [PubMed] [Google Scholar]
- 21.Tang S, Bok R, Qin H, et al. A metabolite-specific 3D stack-of-spiral bSSFP sequence for improved lactate imaging in hyperpolarized [1–13C]pyruvate studies on a 3T clinical scanner. Magnetic Resonance in Medicine. 2020;84(3):1113–1125. doi: 10.1002/mrm.28204 [DOI] [PMC free article] [PubMed] [Google Scholar]
- 22.Shang H, Larson PEZ, Kerr A, et al. Multiband RF pulses with improved performance via convex optimization. Journal of Magnetic Resonance. 2016;262:81–90. doi: 10.1016/j.jmr.2015.11.010 [DOI] [PMC free article] [PubMed] [Google Scholar]
- 23.Scheffler K, Lehnhardt S. Principles and applications of balanced SSFP techniques. European Radiology. 2003;13(11):2409–2418. doi: 10.1007/s00330-003-1957-x [DOI] [PubMed] [Google Scholar]
- 24.Svensson J, Månsson S, Johansson E, Petersson JS, Olsson LE. Hyperpolarized 13C MR angiography using trueFISP. Magnetic Resonance in Medicine. 2003;50(2):256–262. doi: 10.1002/mrm.10530 [DOI] [PubMed] [Google Scholar]
- 25.Hyperpolarized-MRI-Toolbox. https://github.com/LarsonLab/hyperpolarized-mri-toolbox.
- 26.Tang S, Jiang W, Chen HY, Bok R, Vigneron DB, Larson PEZ. A 2DRF pulse sequence for bolus tracking in hyperpolarized 13C imaging. Magnetic Resonance in Medicine. 2015;74(2):506–512. doi: 10.1002/mrm.25427 [DOI] [PMC free article] [PubMed] [Google Scholar]
- 27.Tang S, Milshteyn E, Reed G, et al. A regional bolus tracking and real-time B1 calibration method for hyperpolarized 13C MRI. Magnetic Resonance in Medicine. 2019;81(2):839–851. doi: 10.1002/mrm.27391 [DOI] [PMC free article] [PubMed] [Google Scholar]
- 28.Jackson JI, Meyer CH, Nishimura DG, Macovski A. Selection of a Convolution Function for Fourier Inversion Using Gridding. IEEE Transactions on Medical Imaging. 1991;10(3):473–478. doi: 10.1109/42.97598 [DOI] [PubMed] [Google Scholar]
- 29.Reed GD, von Morze C, Verkman AS, et al. Imaging Renal Urea Handling in Rats at Millimeter Resolution Using Hyperpolarized Magnetic Resonance Relaxometry. Tomography. 2016;2(2):125–137. doi: 10.18383/j.tom.2016.00127 [DOI] [PMC free article] [PubMed] [Google Scholar]
- 30.Furuyamaa JK, Nagarajan R, Roberts CK, Lee CC, Hahn TJ, Thomas MA. A pilot validation of multi-echo based echo-planar correlated spectroscopic imaging in human calf muscles. NMR in Biomedicine. 2014;27(10):1176–1183. doi: 10.1002/nbm.3171 [DOI] [PMC free article] [PubMed] [Google Scholar]
- 31.Bertelsen LB, Nielsen PM, Qi H, et al. Diabetes induced renal urea transport alterations assessed with 3D hyperpolarized 13C,15N-Urea. Magnetic Resonance in Medicine. 2017;77(4):1650–1655. doi: 10.1002/mrm.26256 [DOI] [PubMed] [Google Scholar]
- 32.Nelson SJ, Kurhanewicz J, Vigneron DB, et al. Metabolic imaging of patients with prostate cancer using hyperpolarized [1–13C]pyruvate. Science Translational Medicine. 2013;5(198). doi: 10.1126/scitranslmed.3006070 [DOI] [PMC free article] [PubMed] [Google Scholar]
- 33.Crane JC, Gordon JW, Chen HY, et al. Hyperpolarized 13C MRI data acquisition and analysis in prostate and brain at University of California, San Francisco. NMR in Biomedicine. 2021;34(5). doi: 10.1002/nbm.4280 [DOI] [PMC free article] [PubMed] [Google Scholar]
- 34.Larson PEZ, Chen HY, Gordon JW, et al. Investigation of analysis methods for hyperpolarized 13C-pyruvate metabolic MRI in prostate cancer patients. NMR in Biomedicine. 2018;31(11). doi: 10.1002/nbm.3997 [DOI] [PMC free article] [PubMed] [Google Scholar]
- 35.Bankson JA, Walker CM, Ramirez MS, et al. Kinetic modeling and constrained reconstruction of hyperpolarized [1–13C]-pyruvate offers improved metabolic imaging of tumors. Cancer Research. 2015;75(22):4708–4717. doi: 10.1158/0008-5472.CAN-15-0171 [DOI] [PMC free article] [PubMed] [Google Scholar]
- 36.Assländer J, Glaser SJ, Hennig J. Pseudo Steady-State Free Precession for MR-Fingerprinting. Magnetic Resonance in Medicine. 2017;77(3):1151–1161. doi: 10.1002/mrm.26202 [DOI] [PubMed] [Google Scholar]
- 37.Wang CY, Coppo S, Mehta BB, Seiberlich N, Yu X, Griswold MA. Magnetic resonance fingerprinting with quadratic RF phase for measurement of T2* simultaneously with δf, T1, and T2. Magnetic Resonance in Medicine. 2019;81(3):1849–1862. doi: 10.1002/mrm.27543 [DOI] [PMC free article] [PubMed] [Google Scholar]
- 38.Jiang Y, Ma D, Seiberlich N, Gulani V, Griswold MA. MR fingerprinting using fast imaging with steady state precession (FISP) with spiral readout. Magnetic Resonance in Medicine. 2015;74(6):1621–1631. doi: 10.1002/mrm.25559 [DOI] [PMC free article] [PubMed] [Google Scholar]
- 39.Lau AZ, Miller JJ, Robson MD, Tyler DJ. Simultaneous assessment of cardiac metabolism and perfusion using copolarized [1–13C]pyruvate and 13C-urea. Magnetic Resonance in Medicine. 2017;77(1):151–158. doi: 10.1002/mrm.26106 [DOI] [PMC free article] [PubMed] [Google Scholar]
Associated Data
This section collects any data citations, data availability statements, or supplementary materials included in this article.