Abstract
For personalized drug dosing, prediction models may be utilized to overcome the inter-individual variability. Multiple linear regression has been used as a conventional method to model the relationship between patient features and optimal drug dose. However, linear regression cannot capture non-linear relationships and may be adversely affected by non-normal distribution and collinearity of data. To overcome this hurdle, machine learning models have been extensively adapted in drug dose prediction. In this tutorial, random forest and neural network models will be trained in tandem with a multiple linear regression model on the International Warfarin Pharmacogenetics Consortium dataset using the scikit-learn python library. Subsequent model analyses including performance comparison, permutation feature importance computation and partial dependence plotting will be demonstrated. The basic methods of model training and analysis discussed in this article may be implemented in drug dose-related studies.
Keywords: Machine Learning, Personalized Medicine, Pharmacotherapy, Clinical Decision Rules, Warfarin
INTRODUCTION
Dose prediction models are beneficial for drugs that have high inter-individual variability. Multiple linear regression (LR) models are mainly used to capture the relationship between patient characteristics and individual drug doses. However, LR has limitations. For instance, the model assumes that the variables are independent and that the dependent variable is linearly related to the independent variables. Normality and homoscedasticity are often violated in real world data [1]. Machine learning models have advantages over LR models in terms of its ability to handle non-linear relationships, and robustness to assumptions regarding distribution and correlations between variables [2].
Warfarin is a commonly used anticoagulant that is used to prevent blood clots. This drug has a narrow therapeutic window and a high degree of interindividual variability [3]. Therefore, warfarin dose prediction has attracted high interest and multiple machine learning-based studies have been reported [4,5,6,7].
In this tutorial we will build prediction models using neural network (NN) and random forest (RF) models along with a LR model on the International Warfarin Pharmacogenetics Consortium (IWPC) dataset. Subsequently, the model performances will be evaluated and feature contributions of each model will be analyzed.
DATASET AND PREPROCESSING
IWPC open access dataset was downloaded from PharmGKB website (https://www.pharmgkb.org/downloads) [8]. This dataset consists of multiple demographic information as well as pharmacogenomic information. Stable weekly warfarin dose in milligrams for each patient is also provided.
The dataset went through preprocessing steps including:
• Patients with warfarin dose of 0 were removed.
• Patients that did not reach stable dose were removed.
• Patients with unknown age or sex were removed.
• Patients’ age is described in 10-year bins, but a random integer value in the range was selected.
• Patients missing both weight and height information were removed.
• Patients with CYP2C9 minor alleles (*5, *6, *11, *13, *14) were removed.
• Other missing values were imputed using MissForest from missingpy library.
Categorical values were converted to discrete values as follows:
• Gender: Female = 0, Male = 1
• Race: Asian = 0, White = 1, Black = 2
• Diabetes: No = 0, Yes = 1
• CHF: No = 0, Yes = 1
• ValveReplacement: No = 0, Yes = 1
• Aspirin: No = 0, Yes = 1
• Tylenol: No = 0, Yes = 1
• Simvastatin: No = 0, Yes = 1
• Amiodarone: No = 0, Yes = 1
• Vitamin: No = 0, Yes = 1
• Smoking: No = 0, Yes = 1
• CYP2C9: *1/*1 = 0, *1/*2 = 1, *1/*3 = 2, *2/*2 = 3, *2/*3 = 4, *3/*3 = 5
• VKORC1_1693: A/A = 0, A/G = 1, G/G = 2
For the sake of simplicity, the genetic data was also converted to discrete values instead of using one-hot encoding. The preprocessing steps have been omitted for brevity in this tutorial, and the final preprocessed dataset is available at https://github.com/mahlernim/warfarin_prediction_kscpt_tutorial
MODEL TRAINING
Importing libraries and data
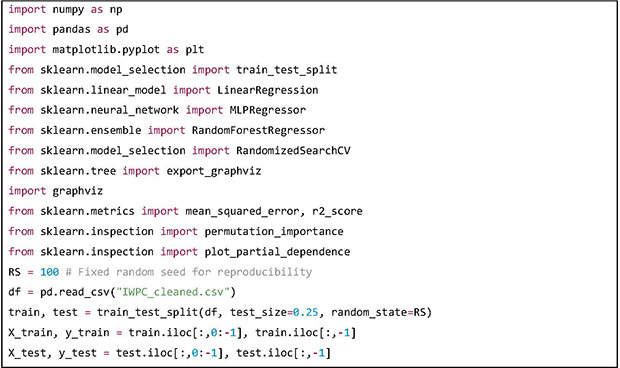
Python version 3.8.10 and “scikit-learn” library version 1.0.1 has been used in this tutorial. The “scikit-learn” library is a widely used Python library for machine learning and data science. In this tutorial “LinearRegression,” “MLPRegressor” and “RandomForestRegressor” classes will be used to build predictive models. The functions “permutation_importance” and “plot_partial_dependence” will be used to analyze how the features are contributing to the predictions. After loading the preprocessed dataset, a random 75:25 split is performed, and the dependent variables are denoted X and independent variable is denoted as y. The train dataset will be used to train the prediction models and the test dataset will be used to evaluate the models.
Multiple linear regression model

In the “scikit-learn” library, the fit method is called to train a model with the training data. After training, the predict method can be used to predict with the given test data. An LR model has been built and the predictions on the test data have been stored in the variable “pred1.” The model parameters including the intercept and coefficients have been printed out in the example.
Neural network model
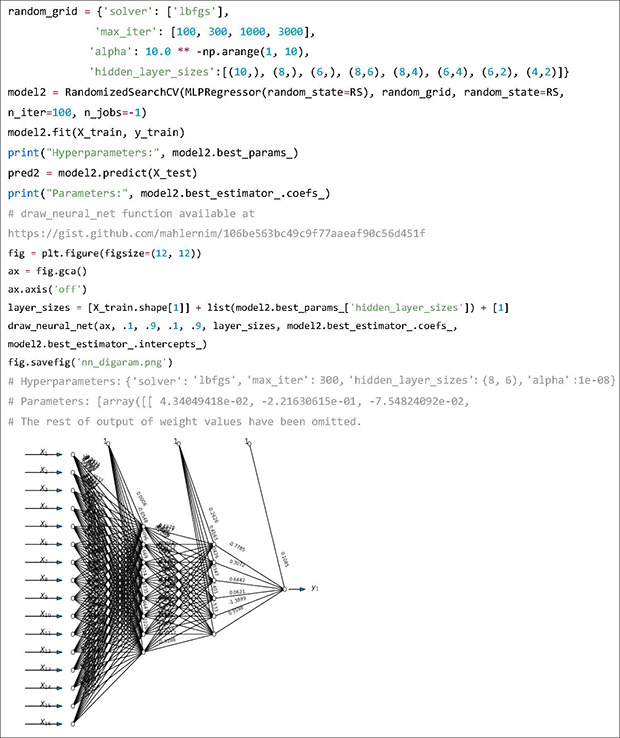
Next, we will create a NN model and fit it with the training data. Most machine learning algorithms need hyperparameter tuning, which is a step where multiple combination of hyperparameter values for the algorithms are set and trained, and then compared to find out the best combination of hyperparameters. In this example, a randomized search approach is used. Other methods including grid search and Bayesian optimization are also available. The hyperparameters to tune are “solver,” “max_iter” and “alpha,” which control the NN optimizer, number of iterations allowed for training and learning rate, respectively. The “hidden_layer_sizes” determines the structure of the hidden layers of the NN. In the output, we can confirm that the selected hyperparameters are 300 iterations, two hidden layers with 8 and 6 nodes, alpha value of 10-8. The following output of parameters are weight values for each connection between nodes. Predicted weekly warfarin doses using the NN model on the test dataset are stored in the variable “pred2.”
Random forest model
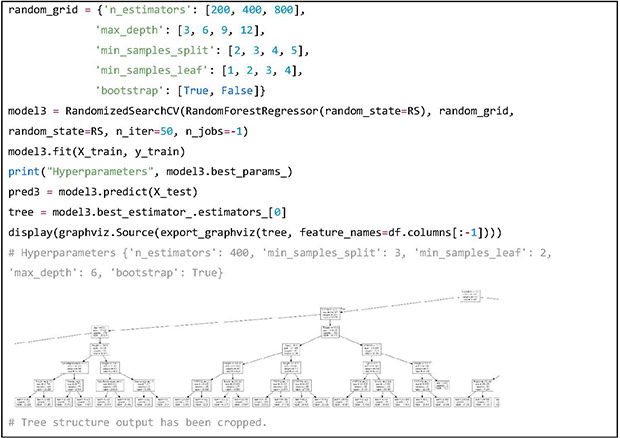
The RF model is built in a similar way, and the hyperparameters that have been tuned are “n_estimators,” “max_depth,” “min_samples_split,” “min_samples_leaf” and “bootstrap.” The results of hyperparameter tuning are printed out. In order to visualize one of the 400 trees in the RF model, the “graphviz” library has been used. Predicted weekly warfarin doses using the RF model on the test dataset are stored in the variable “pred3.”
MODEL ANALYSIS
Performance comparison
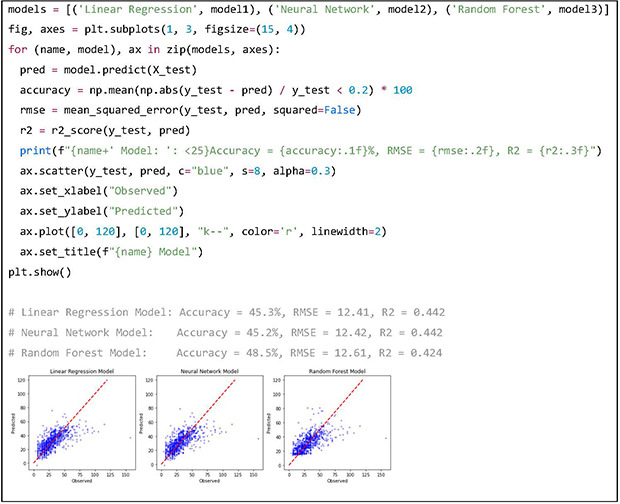
After training the 3 models, the performance of each model is evaluated. The metrics used for evaluation are the root mean square error (RMSE), coefficient of determination (R2) and accuracy. Accuracy is conventionally defined as the proportion of instances where the predicted dose is within a 20% margin of the actual dose. The results indicate that the RF model has highest accuracy, while the LR model and NN model have lower RMSE and R2 scores. In the scatterplots, the x, y axes are the observed dose of the test dataset and predicted dose by the prediction models respectively. The red dotted line is the line of unity, where predicted dose is equal to the actual dose. Scatterplots of prediction values may help visualize the trend of predictions. In this example, the RF model does not make low value predictions and all 3 models tend to underpredict patients with high doses.
Permutation feature importance
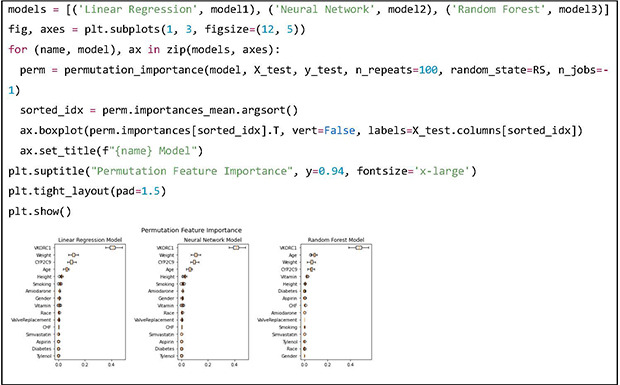
In order to quantify the relationship between each feature and the dependent variable, permutation feature importances were obtained using the “permutation_importance” function. The permutation feature importance is defined as the decrease in model performance when a single feature is randomly shuffled [9]. If the prediction model is highly dependent on a certain feature, the accuracy of predictions made on the permutated dataset will severely decline, resulting in a higher feature importance value. This method is referred as a model agnostic method, in contrast to adjusted coefficients or Gini importance, which can be used exclusively in LR or tree-based models, respectively. In all 3 models, VKORC1 genotype showed prominently high importance, while weight, CYP2C9 genotype and age were the second to forth most important features.
Partial dependence plots (PDPs)
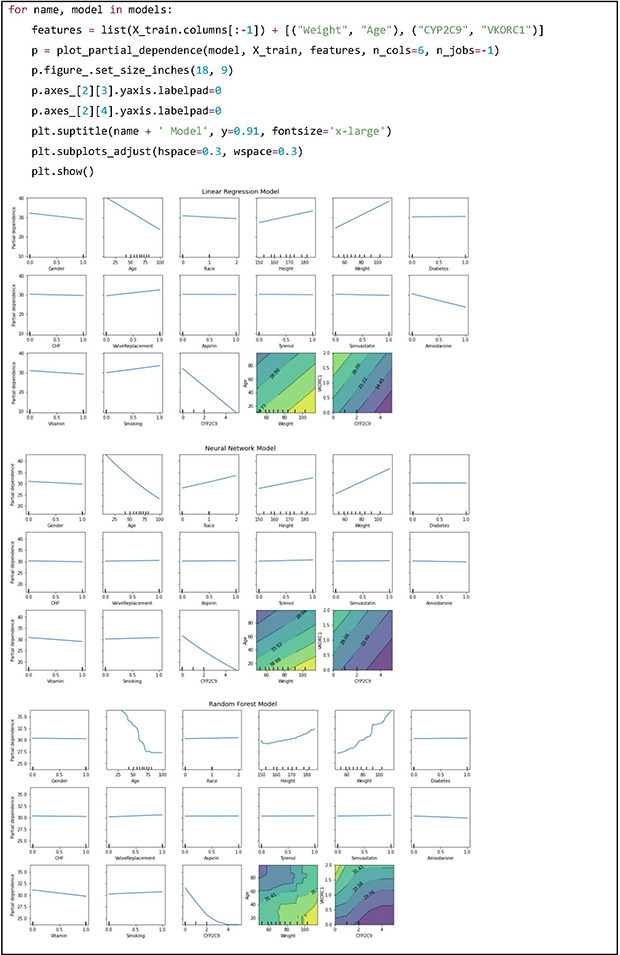
PDPs can be used to visualize and analyze interactions between a set of input features of interest and the dependent variable [10]. While keeping all other features same as the original data, the feature of interest is changed across a range and predictions are made with the model. Intuitively, we can interpret the partial dependence as the expected target response as a function of the input features of interest. The PDPs of the LR model are straight lines and in case of the NN model there are curved lines which are similar to the LR model. This observation is in line with the fact that the performance metrics and feature importance scores are similar between the LR and NN models. However, the RF model shows complex patterns which indicates that it is modelling features in a highly nonlinear fashion. Two-dimensional plots may be used to visualize interactions between two features of interest.
CONCLUSION
In this tutorial, multiple linear regression and machine learning-based models were trained on patient features to predict the warfarin dose using an open dataset, and the performance and characteristics have been explored. Using machine learning or any type of modelling technique with patient data has mainly two purposes: generation of a possibly black box model that can make predictions when provided with new patient data, and gaining insight into how the features contribute to the dependent variable [11]. When the target of a study is to build a predictive model per se, machine learning methods are usually engaged to obtain accurate predictions. However, in research with a more exploratory purpose, methods such as permutation feature importance and partial dependence analysis can be used after training a model to generate and visualize insights of how the model is making predictions. The fundamental model training and analysis processes demonstrated in this article may be implemented in dose optimization studies based on patient data.
Footnotes
Funding: This work was supported by the National Research Foundation of Korea (NRF) grant funded by the Korean government (MSIT) (No. 2018R1A5A2021242).
Conflict of Interest: - Author: Nothing to declare
- Reviewers: Nothing to declare
- Editors: Nothing to declare
Reviewer: This article was reviewed by peer experts who are not TCP editors.
- Conceptualization: Ahn S.
- Writing - original draft preparation: Ahn S.
- Writing - review and editing: Ahn S.
References
- 1.Osborne JW, Waters E. Four assumptions of multiple regression that researchers should always test. Pract Assess Res Eval. 2002;8:2. [Google Scholar]
- 2.Hastie T, Tibshirani R, Friedman JH, Friedman JH. The elements of statistical learning: data mining, inference, and prediction. New York (NY): Springer; 2009. [Google Scholar]
- 3.Li X, Li D, Wu JC, Liu ZQ, Zhou HH, Yin JY. Precision dosing of warfarin: open questions and strategies. Pharmacogenomics J. 2019;19:219–229. doi: 10.1038/s41397-019-0083-3. [DOI] [PubMed] [Google Scholar]
- 4.Cosgun E, Limdi NA, Duarte CW. High-dimensional pharmacogenetic prediction of a continuous trait using machine learning techniques with application to warfarin dose prediction in African Americans. Bioinformatics. 2011;27:1384–1389. doi: 10.1093/bioinformatics/btr159. [DOI] [PMC free article] [PubMed] [Google Scholar]
- 5.Ma Z, Wang P, Gao Z, Wang R, Khalighi K. Ensemble of machine learning algorithms using the stacked generalization approach to estimate the warfarin dose. PLoS One. 2018;13:e0205872. doi: 10.1371/journal.pone.0205872. [DOI] [PMC free article] [PubMed] [Google Scholar]
- 6.Roche-Lima A, Roman-Santiago A, Feliu-Maldonado R, Rodriguez-Maldonado J, Nieves-Rodriguez BG, Carrasquillo-Carrion K, et al. Machine learning algorithm for predicting warfarin dose in Caribbean Hispanics using pharmacogenetic data. Front Pharmacol. 2020;10:1550. doi: 10.3389/fphar.2019.01550. [DOI] [PMC free article] [PubMed] [Google Scholar]
- 7.Nguyen VL, Nguyen HD, Cho YS, Kim HS, Han IY, Kim DK, et al. Comparison of multivariate linear regression and a machine learning algorithm developed for prediction of precision warfarin dosing in a Korean population. J Thromb Haemost. 2021;19:1676–1686. doi: 10.1111/jth.15318. [DOI] [PubMed] [Google Scholar]
- 8.Klein TE, Altman RB, Eriksson N, Gage BF, Kimmel SE, Lee MT, et al. Estimation of the warfarin dose with clinical and pharmacogenetic data. N Engl J Med. 2009;360:753–764. doi: 10.1056/NEJMoa0809329. [DOI] [PMC free article] [PubMed] [Google Scholar]
- 9.Fisher A, Rudin C, Dominici F. All models are wrong, but many are useful: learning a variable’s importance by studying an entire class of prediction models simultaneously. J Mach Learn Res. 2019;20:1–81. [PMC free article] [PubMed] [Google Scholar]
- 10.Zhao Q, Hastie T. Causal interpretations of black-box models. J Bus Econ Stat. 2021;39:272–281. doi: 10.1080/07350015.2019.1624293. [DOI] [PMC free article] [PubMed] [Google Scholar]
- 11.Guidotti R, Monreale A, Ruggieri S, Turini F, Giannotti F, Pedreschi D. A survey of methods for explaining black box models. ACM Comput Surv. 2018;51:1–42. [Google Scholar]


