

Abstract
Background:
This meta-analysis was performed to investigate the effect of serum lipids on the risk of breast cancer incidence.
Methods:
PubMed, Web of Science, Scopus, and EMBASE were searched systematically from January 1998 to April 2019. Inclusion criteria were English observational studies (cohort or case-control) and the concentration of at least one of the lipid profile components (total cholesterol/triglycerides/low-density lipoprotein cholesterol/high-density lipoprotein cholesterol) measured before a diagnosis of breast cancer (BC). The studies were included in which the relative risk (RR) had been reported with 95% confidence intervals (CIs). A random-effects model was used.
Results:
A total of 25 studies were found, including 2,882,789 participants in cohort studies with 45,481 cases with BC, and 1983 BC cases and 2963 case-control studies. Combined RR of cohort studies for the highest versus lowest for the BC was LDL-C: 0.95 (95% CI: 0.89–1.01), triglycerides (TG): 0.95 (95% CI: 0.91–0.99; P = 0.02), total cholesterol (TC): 0.98 (95% CI: 0.91–1.05), and HDL-C: 0.86 (95% CI: 0.63–1.18). Combined RR of case-control studies for the highest versus lowest was LDL-C: 1.08 (95% CI: 0.78–1.48), TG: 1.73 (95% CI: 0.94–3.18), TC: 1.02 (95% CI: 0.80–1.29), and HDL-C: 0.79 (95% CI: 0.65–0.97).
Conclusions:
Based on the results, it can be concluded that only TG but not TC and/or LDL-C had a significant inverse association with the risk of BC incidence. HDL-C showed a significant protective effect against breast cancer in postmenopausal women and case-control studies.
Keywords: Meta-analysis, breast cancer, cholesterol, HDL, LDL, triglycerides
Introduction
The association of serum lipids (total cholesterol [TC], high-density lipoprotein cholesterol [HDL-C], low-density lipoprotein cholesterol [LDL-C], and triglycerides [TG]) with the risk and incidence of different cancers has been proposed by many researchers.[1,2,3,4] Modifications in the serum cholesterol levels are related to the etiology of colorectal and breast carcinoma.[5] It could be due to the important role of cholesterol as a precursor of steroid hormones.[6] In a study that was conducted on mice with breast cancer (BC), it was revealed that the primary metabolites of cholesterol could increase the size of tumor and metastasis.[7] A meta-analysis that was based only on cohort studies found an inverse relationship between TG levels in serum and the risk of BC, but TC and LDL did not show any significant relationship with BC risk and occurrence. They found the protective effect of HDL among postmenopausal women.[8] However, they did not consider the case-control studies[9,10,11] and several large cohort studies[12,13,14,15,16] that inevitably could introduce biases. Another meta-analysis reviewed the association of TC, HDL-C, and LDL-C levels with the BC risk and confirmed the inverse association between TC and HDL-C and the risk of BC,[17] but did not investigate the effect of TG on BC. Given the different and controversial results obtained from various studies and meta-analyses about the effect of lipid profiles on the risk of BC, the effect of lipid profile on BC remains questionable. Therefore, the current meta-analysis was performed to systematically evaluate the association between individual lipid components (TC, HDL, LDL, and TG) and BC risk in a more comprehensive study taking into account both updated studies in this area after 2015 through April 2020 and also case-control studies that were not included in the previous meta-analysis by Haibo et al. 2015.[8]
Material and Methods
These systematic review and meta-analysis were performed following the Preferred Reporting Items for Systematic Reviews and Meta-Analyses statement recommendations.
Systematic search
Relevant studies were identified by searching PubMed, Scopus, Web of Science, and EMBASE from 1998 up to April 2019 using Medical Subject Heading [MeSH] and related keywords. We used AND and OR Boolean Operators to combine different concepts and similar concepts, respectively. The following keywords were used: “lipid,” “cholesterol,” “triglyceride,” “high-density lipoprotein [HDL],” “low-density lipoprotein [LDL],” “breast neoplasms,” “breast cancer,” “risk,” “incidence,” and “prevalence.” The search strategy in PubMed was “(lipid[Title/Abstract]) OR (cholesterol[Title/Abstract])) OR (HDL[Title/Abstract])) OR (LDL[Title/Abstract])) OR (triglycerides[Title/Abstract])) AND ((breast cancer[Title/Abstract]) OR (breast tumor[Title/Abstract]))) AND (breast tumor[Title/Abstract]).
We included prospective cohort and case-control studies estimating the relative risk (RR) with 95% confidence intervals (CIs) for the associations of specific lipid components including TC, HDL-C, LDL-C, and TG with breast cancer risk of incidence.
Study screening
Eligible studies for this meta-analysis were fulfilled in the following criteria: (1) the study design was an observational study (cohort or case-control study), (2) the exposure of interest was serum concentration of at least one of the selected lipid components (TC, HDL-C, LDL-C, and TG) measured before a diagnosis of BC, (3) the outcome of interest was the occurrence of BC, and (4) the relative risk (RR) with corresponding 95% CI or data to calculate it had been reported. If data had been duplicated in more than one study, we included the study with the most number of cases.
Quality assessment
Since all of the included studies were observational, their methodological quality was assessed by the nine-star Newcastle Ottawa Scale,[18] which consists of three major aspects: selection, comparability, and exposure or outcome. A study with seven or more stars is considered to be high quality. Quality assessment was performed by two authors independently.
Data extraction
Two independent investigators (AA and GV) screened all retrieved articles and extracted the data from all eligible publications. Any disagreement was settled by discussion. In the end, a third researcher (ZF) approved the selection to ensure the accuracy of the data. The following data were recorded: first author's surname, publication year, country of origin, ethnicity, study and follow-up periods, characteristics of the study population (age and menopausal status), numbers of cases and participants, ranges of serum lipid levels, RRs from the most fully adjusted model for the highest versus lowest category of serum lipids, and the corresponding 95% CIs and matching or adjustments for confounding factors.
Statistical analysis
Two measures of association were used in the studies: Odds Ratio (OR) in the case-control and incidence rate ratio or Hazard Ratio (HR) in the cohort studies. For simplicity, we report the Relative Risk (RR) as a common measure of association. As the prevalence of BC is quite low, the OR in case-control and HR in cohort studies yielded a similar estimation of RR.[19] In each study, the risk estimates reflected the comparison of the highest versus lowest categories. We produced some forest plots to evaluate the adjusted RRs and corresponding 95% CI visually across studies. If the heterogeneity among the studies was significant, the random-effects model using Der Simonian and Laird methods was used to summary RR and its corresponding 95% CI, otherwise, a model with fixed effect was calculated.[20] The homogeneity among the studies was assessed with Cochran's Q statistic and the I2 statistic. For the I2 statistic, values above 50%, and for the Chi-square test, P values < 0.1 were statistically supposed significant.[21] We did subgroup analyses for each component to assess the impacts of different variables on outcomes and identify the sources of heterogeneity based on some characteristics including the geographic area, follow-up length, study design, and menopausal status. The sensitivity analysis was measured for assessment of the robustness of the combined risk estimates to evaluate whether the low-quality studies would influence the overall result. Publication bias was evaluated with Begg's rank correlation tests and Egger's linear regression tests.[22,23] All analyses were performed using STATA version 14.
Results
Study characteristics
PubMed, Scopus, Web of Science, and EMBASE were searched for observational studies from 1998 to April 2019 and a total of 3544 articles were found. After removing duplicates, non-human studies, and non-English studies, 125 remained. After excluding the studies which did not meet our inclusion criteria finally, 25 studies were selected including 21 cohort studies[13,14,15,16,24,25,26,27,28,29,30,31,32,33,34,35,36,37,38,39,40] and 4 case-control studies.[9,11,12,41] The main characteristics of the selected studies have been summarized in Table 1. Studies were found and collected through the systematic search and selection process. Figure 1 shows the study selection procedure.
Table 1.
The characteristics of the studies on serum lipids and breast cancer included in this meta-analysis
| Author/Year | Country | Type of study | No. of cases/participants | Age (years) | Follow up (years) | Outcome | Menopausal status | Study quality | Adjustments |
|---|---|---|---|---|---|---|---|---|---|
| Chandler et al., 2016 | United States | Cohort | 864/15,602 | >45 | 19 | HDL, LDL, TC, TG | overall | 9 | Age, race, hormone replacement therapy, cigarette smoking, exercise, alcohol consumption, postmenopausal status, family history of cancer, aspirin use, history of fibrocystic or benign breast disease, total vegetable and fruit intake, history of mammogram, reproductive history including the age of menarche, oral contraceptive use, age, and BMI |
| Laamiri et al., 2013 | Moroccan | Case-control | Case: 400 Control: 400 | 45.83 | 2 | HDL, LDL, TC, TG | overall | 8 | Age |
| Capasso et al., 2010 | Italy | Case-control | Case: 210 Control: 289 | 57.5 | NA | HDL | Postmenopause | 6 | Tobacco use, alcohol abuse, food intake, physical activity grade, parity, age of menarche, menopausal status, oral contraceptive use, hormonal therapy use, personal and familial history of cancer |
| Furberg et al., 2004 | Norwegian | Cohort | 708/38,823 | 58.4 | 17.2 | HDL | Postmenopause, Premenopause | 9 | Age, BMI, county of residence, parity, height, serum TC, physical activity, blood pressure, serum TG, age at first birth, time since last meal, smoking, energy and fat intake, menopausal status |
| His et al., 2014 | France | Cohort | 141/4433 | 49.5 | 11.5 | HDL, LDL, TC, TG | overall | 9 | Age, BMI, intervention group, number of dietary records, alcohol intake, physical activity, smoking, education, height, family history of breast cancer, menopausal status, number of full-term, HRT use, energy intake, hyperlipidemia medication use, glycemia |
| His et al., 2017 | Switzerland | Cohort | 583/1043 | 40–65 | NA | HDL, LDL, TC, TG | overall | 8 | Age, BMI, menopausal status, history of breast cancer in first-degree relatives, personal history of benign breast disease, daily alcohol intake, daily glycemic load, daily lipid intake daily energy intake without alcohol |
| Bjorge, et al., 2010 | England | Cohort | 4862/287320 | 58 | 11 | TC, TG | overall | 8 | Age, BMI, year of birth, smoking, glucose |
| Agnoli et al., 2010 | Italy | Case-control | Case: 236 Control: 556 | 35-69 | 13.5 | HDL, TG | Postmenopause | 9 | Age, years from menopause, number of full-term pregnancies, age at first birth, oral contraceptives, hormone therapy, years of education, history of breast cancer in first degree relatives, breastfeeding, smoking, and alcohol consumption |
| Hoyer et al., 1992 | Danish | Cohort | 51/5207 | 30-80 | 4-26 | HDL, LDL, TC, TG | overall | 8 | Age, BMI, smoking, menopausal status, age at menarche, number of full-term, pregnancies, alcohol, and coffee consumption |
| Gaard et al., 1994 | Norwegian | Cohort | 302/31,209 | 20-54 | 10.4 | LDL | overall | 9 | Age, BMI, height, menopausal status, smoking |
| Eliassan et al., 2005 | United States | Cohort | 3177/71,921 | 42-69 | <10 | TC | overall | 6 | Age, BMI, age at menarche, parity, age at first birth, height, family history of breast cancer and BBD, alcohol consumption, physical activity, menopausal status, age at menopause, HRT use |
| Kucharaska et al., 2008 | United States | Cohort | 359/7575 | 54-64 | NA | HDL | Overall | 9 | Age, race, BMI, age at menarche, smoking, HRT use, age at menopause |
| Kabat et al., 2009 | United States | Cohort | 165/4888 | 50-79 | 8 | HDL, TG | Postmenopause | 6 | Age, education, race, BMI, oral contraceptive use, HRT use, age at menarche, age at first birth, age at menopause, alcohol, family history of breast cancer, history of breast biopsy, physical activity, energy intake, smoking, randomization of HRT, calcium plus vitamin D, and dietary modification trials, waist circumference, glucose, blood pressure |
| Inoue et al., 2009 | Japan | Cohort | 120/18,176 | 40-69 | 10.2 | HDL, TG | Overall | 8 | Age, study area, smoking, ethanol intake, serum TC |
| Iso et al., 2009 | Japan | Cohort | 178/21,685 | 40-69 | 12.4 | TC | Overall | 9 | Age, BMI, smoking, hypertension, diabetes, hyperlipidemia medication use, intake of total vegetable, coffee, and ethanol, public health center |
| Fagherazzi et al., 2010 | France | Cohort | 2932/69,088 | 40-65 | 12 | TC, TG | Overall, Premenopause | 6 | Age, intake of alcohol, total fat, and energy, oral contraceptives use, age at menarche, age at menopause, number of children, age at first pregnancy, family history of breast cancer, history of BBD, diabetes status, education, HRT use |
| Kitahara et al., 2011 | Korea | Cohort | 3805/433,115 | 30-95 | 12.7 | TC | Overall, Postmenopause, Premenopause | 8 | Age, BMI, smoking, alcohol intake, glucose, hypertension, physical activity |
| Bosco et al., 2012 | United States | Cohort | 1228/49,172 | 21-69 | 10.5 | TC | Overall, Postmenopause, Premenopause | 7 | Age, BMI, education, physical activity, obesity, Type 2 diabetes, hypertension |
| Melvin et al., 2012 | Swedish | Cohort | 6105/234,494 | >25 | 8.3 | HDL, LDL, TC, TG | Overall | 7 | Age, parity, level of glucose, TG, TC, fasting status, and socioeconomic status |
| Strohmaier et al., 2013 | European | Cohort | 5228/288,057 | 40.3-47.5 | 11.7 | TC | Overall | 8 | Age, BMI, smoking |
| Ha et al., 2009 | Korea | Cohort | 741/170,374 | 40- 64 | 8.84 | TC | Postmenopause | 8 | Age, age at menarche, BMI, nulliparity, hormone replacement therapy, duration of breastfeeding, smoking habit, and alcohol consumption |
| Moorman et al., 1998 | United States | Case-control | Case: 196 Control: | NA | NA | HDL | Postmenopause, Premenopause | 8 | Education, smoking status, BMI, alcohol consumption, and history of benign breast disease |
| Osaki et al., 2011 | Japan | Cohort | 78/15,386 | 55 | 9.1 | HDL, TG | Overall | 9 | Age, smoking status, heavy drinking, presence of metabolic syndrome or pre-metabolic syndrome of each definition. |
| Borena et al., 2010 | European | Cohort | 5006/256,512 | 44.2 | 11.9 | TG | Overall | 9 | Baseline age, BMI, and smoking status |
| Manjer et al., 2001 | European | Cohort | 409/9738 | 49.6 | 15 | TC | Postmenopause, Premenopause | 9 | Age, nulliparity, current oral contraceptive use, current HRT, smoking, alcohol consumption, height, and weight |
Figure 1.
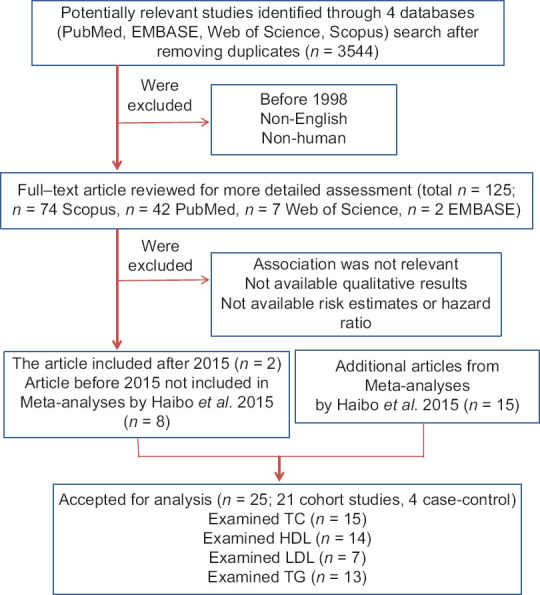
Flow diagram of study selection. The flow chart shows literature search and selection for prospective cohort and case-control studies of serum lipids about the breast cancer risk. TC = total cholesterol; HDL-C = high-density lipoprotein cholesterol; LDL-C = low-density lipoprotein cholesterol; TG = triglycerides.
Altogether, 2,882,789 cases had participated in the cohort studies of which, 45,481 cases were affected with BC. Moreover, 1983 cases and 2963 controls have participated in the case-control studies. Studies were published between 1998 and 2019, and their follow-up periods had a range from 2 to 13.5 years for the case-control and 4 to 26 years for the cohort studies. The populations were categorized into three groups: Americans (n = 6), Europeans (n = 13), Africans (n = 1), and Asians (n = 5). Except for two studies conducted among nurses and teachers,[24,25] the rest were population-based. Of the 25 included studies, 15 contained the results for TC, 14 for HDL-C, 13 for TG, and 7 for LDL-C. Four studies only included postmenopausal women[9,12,15,26] and 5 studies presented the estimates by menopausal status.[24,27,28,29,40,41]
The results of the study quality assessment (score 0–9) ranged from 6 to 9, with an average score of 7.8, indicating high-quality studies.
Main results
HDL-C: Combined RR for the highest versus lowest HDL-C categories are shown in Figure 2. The summary result of 14 studies that examined the effect of HDL-C categories on BC was 0.86 (95% CI: 0.63–1.18). The negative association between HDL-C and BC in the case-control studies was significant at 0.79 (95% CI: 0.65–0.97), but the pooled risk estimate in the cohort studies was not 0.87 (95% CI: 0.58–1.32).
Figure 2.
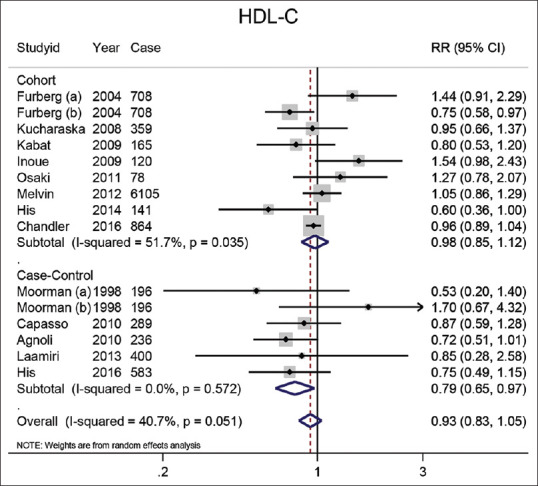
Forest plot of the highest versus lowest categories of serum HDL-C levels and breast cancer risk. Squares indicate study-specific relative risk estimates (size of the square reflects the study-specific statistical weight); horizontal lines indicate 95% confidence intervals (CI); diamond indicates the overall relative risk with its 95% confidence interval. a: Premenopausal; b: Postmenopausal
LDL-C: Seven studies examined the relationship between LDL-C and BC. As shown in Figure 3, the combined RR for the highest versus lowest LDL-C concentrations was 0.95 (95% CI: 0.89–1.01). The summary risk estimate of BC in five included cohort studies was 0.94 (95% CI: 0.88–1.01) and the combined result from two included case-control studies was 1.08 (95% CI: 0.78–1.48).
Figure 3.
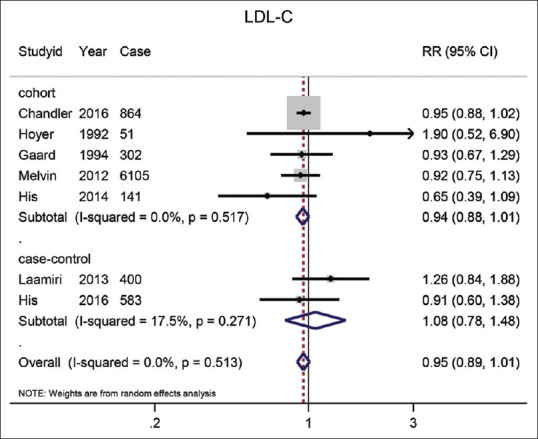
The forest plot of the highest vs. the lowest categories of serum LDL-C levels and breast cancer risk. Squares indicate study-specific relative risk estimates (size of the square reflects the study-specific statistical weight); The horizontal lines indicate 95% confidence intervals (CI); The diamond indicates the overall relative risk with its 95% confidence interval.
TG: An association between BC risk and serum TG was reported in 13 studies [Figure 4]. The pooled RR for the highest category versus the lowest was 1.15 (95% CI: 0.96–1.38). The result of meta-analysis on 10 cohort studies showed that the highest levels of TG compared to the lowest levels had a significant effect on the reduction of BC (RR = 0.95) (95% CI: 0.91–0.99; P = 0.02). Inversely, the combined results of the three case-control studies did not reporte a significant effect of 1.73 (95% CI: 0.94–3.18).
Figure 4.
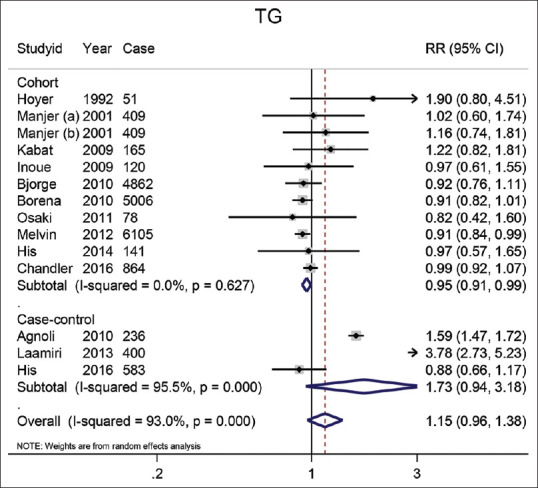
The forest plot of the highest vs. lowest categories of serum TG levels and breast cancer risk. Squares indicate study-specific relative risk estimates (size of the square reflects the study-specific statistical weight); The horizontal lines indicate 95% confidence intervals (CI); The diamond indicates the overall relative risk with its 95% confidence interval. a: Premenopausal; b: Postmenopausal
TC: In 15 studies, the effect of TC on BC had been examined. The summary risk estimate of BC for the highest TC compared with the lowest was 0.98 (95% CI: 0.91–1.05). The combination of the results of 15 cohort studies showed this effect size of 0.97 (95% CI: 0.90–1.06), and in the case-control studies (n = 2) pooled effect size of TC on BC was 1.02 (95% CI: 0.80–1.29). The result is shown in Figure 5.
Figure 5.
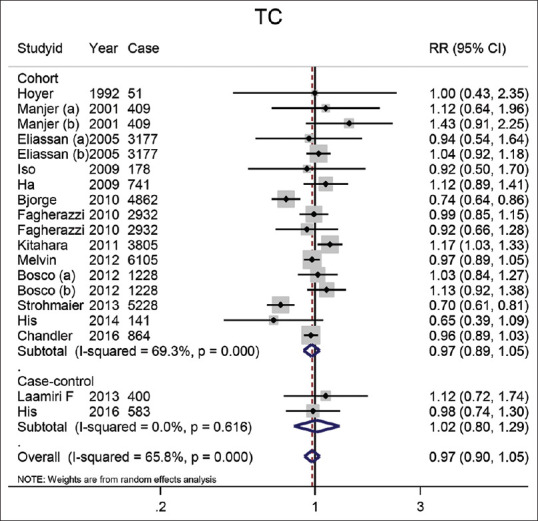
The forest plot of the highest vs. lowest categories of serum TC levels and breast cancer risk. Squares indicate study-specific relative risk estimates (size of the square reflects the study-specific statistical weight); The horizontal lines indicate 95% confidence intervals (CI); The diamond indicates the overall relative risk with its 95% confidence interval. a: Premenopausal; b: Postmenopausal
Subgroup analysis
Subgroup analysis was performed according to some factors, such as the geographic region, follow-up length, the number of cases, and menopausal status. According to the results, when we stratified the analysis according to the geographical region, a significant positive effect of TC on BC in Asian studies (RR = 1.15, 95% CI: 1.03–1.28) and a positive relation between TG and BC (RR = 3.78, 95% CI: 2.73–5.23) among African studies were detected [Table 2]. The stratified analysis according to menopausal status showed that an increase in HDL-C levels could cause a reduction in BC risk among women who were postmenopausal at baseline (RR = 0.84, 95% CI: 0.74–0.97), while a direct relationship between TG and BC risk in the postmenopausal women was found (RR = 1.43, 95% CI: 1.16–1.76). The result of the subgroup analysis based on case-control studies was significant only for TG. As a result, an inverse association between TG and BC risk was observed among the studies with more than 500 cases (RR = 0.94, 95% CI: 0.90–0.99). Inversely in studies with less than 500 cases, a direct relationship between TG and BC was detected (RR = 1.36, 95% CI: 1.01–1.84). We did not find any evidence of significant effects on BC in other subgroups.
Table 2.
The stratified meta-analyses of lipid components and breast cancer risk
| Group | TC | HDL-C | ||||||
|---|---|---|---|---|---|---|---|---|
|
|
|
|||||||
| No. of studies | RR (95%CI) | I2 (%) | P * | No. of studies | RR (95%CI) | I2 (%) | P * | |
| Total | 20 | 0.98 (0.91-1.05) | 64.5 | 0.504 | 17 | 0.93 (0.69-1.25) | 95.5 | 0.611 |
| Study design | ||||||||
| Cohort | 18 | 0.97 (0.90-1.05) | 68 | 0.476 | 10 | 0.78 (0.58-1.32) | 97.3 | 0.521 |
| Case-control | 2 | 1.02 (0.80-1.29) | 0 | 0.977 | 7 | 1.11 (0.93-1.34) | 34.4 | 0.254 |
| Menopausal status | ||||||||
| Premenopausal | 4 | 1 (0.85-1.18) | 0 | 0.982 | 4 | 0.95 (0.57-1.59) | 67 | 0.853 |
| Postmenopausal | 4 | 1.09 (0.99-1.20) | 0 | 0.083 | 7 | 1.01 (0.77-1.31) | 74.1 | 0.959 |
| Geographic area | ||||||||
| Unaited stats | 6 | 1 (0.95-1.05) | 0 | 0.999 | 8 | 1 (0.85-1.18) | 43.2 | 0.273 |
| Europe | 10 | 0.89 (0.78-1.02) | 69.9 | 0.090 | 10 | 0.82 (0.48-1.39) | 97.3 | 0.208 |
| Asia | 3 | 1.15 (1.03-1.28) | 0 | 0.013 | 2 | 1.41 (1.01-1.97) | 0 | 0.045 |
| Africa | 1 | 1.12 (0.72-1.74) | - | 0.613 | 1 | 0.85 (0.28-2.58) | - | 0.510 |
| Length of follow-up | ||||||||
| ≥10 year | 14 | 0.96 (0.86-1.06) | 73.9 | 0.199 | 10 | 0.78 (0.50-1.21) | 97.4 | 0.271 |
| <10 year | 5 | 1 (0.94-1.07) | 0 | 0.944 | 4 | 1.02 (0.86-1.21) | 0 | 0.814 |
| No. of cases | ||||||||
| ≥500 | 14 | 0.97 (0.90-1.05) | 72.7 | 0.433 | 5 | 0.96 (0.89-1.02) | 52.9 | 0.191 |
| <500 | 6 | 1.04 (0.84-1.30) | 7.4 | 0.711 | 12 | 0.91 (0.57-1.47) | 96.4 | 0.710 |
|
| ||||||||
| Group | LDL-C | TG | ||||||
|
|
|
|||||||
| No. of studies | RR (95%CI) | I2 (%) | P * | No. of studies | RR (95%CI) | I2 (%) | P * | |
|
| ||||||||
| Total | 7 | 0.95 (0.89-1.01) | 0 | 0.107 | 16 | 1.11 (0.94-1.30) | 92.4 | 0.226 |
| Study design | ||||||||
| Cohort | 5 | 0.94 (0.88-1.01) | 0 | 0.077 | 12 | 0.95 (0.91-0.99) | 0 | 0.019 |
| Case-control | 2 | 1.08 (0.78-1.48) | 17.5 | 0.654 | 4 | 1.45 (0.89-2.36) | 96.4 | 0.137 |
| Menopausal status | ||||||||
| Premenopausal | - | - | - | - | 4 | 1.17 (0.80-1.69) | 84.9 | 0.415 |
| Postmenopausal | - | - | - | - | 2 | 0.84 (0.66-1.06) | 0 | 0.136 |
| Geographic area | ||||||||
| Unaited stats | 1 | 0.95 (0.88-1.02) | - | 0.169 | 5 | 0.92 (0.82-1.04) | 42 | 0.170 |
| Europe | 5 | 0.90 (0.78-1.05) | 0 | 0.185 | 10 | 1.04 (0.85-1.28) | 92.9 | 0.708 |
| Asia | - | - | - | - | 2 | 0.92 (0.63-1.34) | 0 | 0.660 |
| Africa | 1 | 1.26 (0.84-1.88) | - | 0.261 | 1 | 3.78 (2.73-5.23) | - | <0.001 |
| Length of follow-up | ||||||||
| ≥10 year | 4 | 0.94 (0.84-1.04) | 6 | 0.229 | 13 | 0.99 (0.84-1.18) | 90.7 | 0.950 |
| <10 year | 2 | 1.02 (0.76-1.37) | 42.2 | 0.872 | 4 | 1.38 (0.66-2.89) | 95.8 | 0.392 |
| No. of cases | ||||||||
| ≥500 | 3 | 0.95 (0.88-1.01) | 0 | 0.106 | 6 | 0.94 (0.90-0.98) | 0 | 0.006 |
| <500 | 4 | 0.98 (0.78-1.22) | 40.7 | 0.827 | 10 | 1.28 (0.95-1.73) | 89.3 | 0.098 |
*statistically significant in the level of 0.05. TC: total cholesterol TG: triglycerides. LDL-C: Low-density lipoprotein cholesterol. HDL-C: High-density lipoprotein cholesterol
Publication bias
Begg's rank correlation and Egger linear regression tests were used for the evaluation of publication bias for each lipid component. The obtained results for TC and LDL-C did not confirm the publication bias, while the outcomes of these tests were significant for HDL-C and TG (HDL-C: P value = 0.008, TG: P value = 0.015). Therefore, the Trim and fill methods were used to modify the results; however, the results did not change.
Sensitivity analysis
Sensitivity analysis was done to examine the effect of each study on the final result. Each time, one study was removed and the rest were separately analyzed for each lipid component. According to the HDL-C results, Hoyer et al. (1992)[16] reported the most effective which caused a change in RR estimate of 0.09 (RR = 1.02, 95% CI: 0.92–1.15). Laamiri et al. (2013)[11] also caused a change in RR estimate of 0.09 on TG which with the elimination of this study, the result changed but not significantly (RR = 1.02, 95% CI: 0.88–1.17). The sensitivity analysis on TC showed that three studies, Bosco et al (2012), Bjørge et al (2010), and Fagherazzi et al. (2010),[25,29,38] caused changes in RR estimate of 0.02. So we removed these studies and analyzed the remaining studies. But the result was not still significant (RR = 1, 95% CI: 0.92–1.08). For LDL-C, it was found that studies did not affect the combined risk estimates.
Discussion
In the current meta-analysis, 21 cohort studies[13,14,15,16,24,25,26,27,28,29,30,31,32,33,34,35,36,37,38,39] and 4 case-control studies[9,11,12,40] were pooled and analyzed. Altogether, 45,481 BC cases in cohort studies and 1983 cases in the case-control studies were studied. So far, the most up-to-date and comprehensive meta-analysis on the association of lipid profile with breast cancer risk was published by Haibo et al. 2015,[8] which included 15 cohort studies. In our meta-analysis on this topic, 21 cohort studies and 4 case-control studies[9,11,12,40] were gathered and analyzed in addition to their references. More than two articles that were published between April 2015 and April 2019[31,32] were also reviewed in our meta-analysis. They excluded Borena et al. 2011[14] and Ha et al. 2009[15] because they believed that they duplicated the reports of Strohmaier et al., 2013,[34] and Kitahara et al., 2011,[33] respectively. When we went, however, through the articles more deeply, we found that although the population studied by Borena et al. 2011[14] and Strohmaier et al. 2013[34] was the same (Norway, Austria, and Sweden), the former had studied the role of TG in cancer risk but the later studied the role of cholesterol on cancer risk. Although the population studied by Ha et al. 2009[15] is a subset of a larger one by Kitahara et al. 2011,[33] we considered both in our study because we wanted to study the postmenopausal women separately in our subgroup analysis.
According to the results, all lipid profile components were related to the risk of BC occurrence; however, the association was not significant. The subgroup analysis showed a significant association only for TG. Moreover, an inverse association between TG and BC risk was observed among the studies with more than 500 cases. A significant positive effect of TC was also observed among the studies in Asia and a positive relation between TG and BC in a study in Africa.
According to the subgroup analysis, HDL-C showed a positive protective effect among postmenopausal women. A negative association between HDL-C and BC was also found in the case-control studies. These results are in agreement with reports by Esposito et al. 2013[41] and Haibo et al. 2015[8] about the protective role of HDL-C against BC. The protective effect of HDL-C on BC occurrence can be explained by the role of serum HDL-C level as a marker of androgen status.[41] Among postmenopausal women, the ovaries and adrenals keep on producing androgens which can be converted to biologically active estrogens in peripheral tissues. Therefore, the lack of HDL-C might result in androgen deficiency and subsequent BC development. It is also believed that HDL-C has anti-inflammatory properties which are inversely associated with BC risk.[42]
Dyslipidaemia is considered responsible for BC.[42,43] The carcinogenic potential of TG in tumor growth as an independent source for fatty acid oxidation has been stated previously.[44,45] Recently, it was found that body mass index (BMI) and obesity increase the chance of triple-negative breast cancer (TNBC) occurrence.[45,46,47] An association has also been reported between the increased risk of BC recurrence and mortality with obesity and high BMI.[46,47]
The results on the effect of TG on BC were also conflicting. TG was found to have a positive effect on BC among the studies with less than 500 cases. Meanwhile, despite triglyceride carcinogenic potential, a significant inverse relationship was observed between TG and BC risk in the cohort studies, but not among case-control studies with more than 500 cases. In line with our findings, Haibo et al. 2015[8] also proposed that TG may be inversely associated with BC risk. The biological mechanisms for the inverse association between TG and BC risk still remain unclear. Meanwhile, in our analysis by ethnicity, we observed a significant positive relationship between TG and BC risk in African but not in Asian, European, and American populations. Since only one study for Africa was available, more studies are necessary to determine whether this association is valid.
A positive effect of cholesterol on BC risk was observed among Asian populations in five studies included in this meta-analysis. These findings are in agreement with the ethnicity analysis by Haibo et al. 2015,[8] because they also reported a positive effect of cholesterol on BC risk in two Asian studies. Accordingly, it seems that the ethnicity difference might have an important role in heterogeneity. The positive role of cholesterol in BC progression has been attributed to its role as a precursor of steroid hormones, estrogen, and progesterone.[48,49] Cholesterol has been also reported to accelerate and enhance tumor growth and formation. Some epidemiological studies showed that there is an association between abnormal levels of HDL-C and LDL-C in patients with cancer. However, no positive correlation was observed in our ethnicity analysis between cholesterol levels and the risk of BC except for the Asian population. These discrepancies among different ethnicities could be attributed to genetic variations and high heterogeneity of the BC subtypes. The metabolic heterogeneity which is likely to be present in all cancers, including BC, can be also considered as an explanation for this association.[49,50]
LDL-C level showed no significant effect on BC in our analysis. Meanwhile, LDL-C lowering drugs such as statins have been widely studied for their positive role on BC.[51] Inversely, some studies presented no association between statin use and the BC risk.[52] Mansourian et al. (2016)[53] merged the results for 124,669 cases (eight cohort studies) with BC. Their results suggest a significant reduction in recurrence and death among statin users. On the other hand, Undela et al. (2012)[54] studied 24 studies (76,759 participants), and finally, they did not find any significant reduction in BC incidence among statin users, either short- or long-term. In this study, LDL also showed no significant effects on BC risk even in subgroup analysis. Since statins work through LDL reduction, our results are supported by Undela et al. (2012)’s[54] study. LDL was the only lipid profile content that did not show a significant heterogeneity among the studies. TC was the second with less heterogeneity but TG and HDL showed substantial heterogeneity among the studies. For HDL-C, Hoyer et al. (1992)[16] presented the most effective, and for TG, Laamiri et al. (2013)[11] showed significant heterogeneity. Future research with larger sample sizes, higher quality, detailed information on geographical regions and menopausal status, and less variation in methodology is warranted to extend our findings.
Conclusions
According to this meta-analysis, an inverse association was observed between breast carcinogenesis risk and the serum TG in cohort-design and case-control studies with a population of more than 500. Serum HDL-C showed almost a protective role against breast cancer among postmenopausal women and case-control studies.
Financial support and sponsorship
This study was supported financially by Isfahan University of Medical Sciences.
Conflicts of interest
There are no conflicts of interest.
References
- 1.Schatzkin A, Hoover RN, Taylor PR, Ziegler RG, Carter CL, Albanes D, et al. Site-specific analysis of total serum cholesterol and incident cancer in the national health and nutrition examination survey I epidemiologic follow-up study. Cancer Res. 1988;48:452–8. [PubMed] [Google Scholar]
- 2.Gerber M, Richardson S, Crastes de Paulet P, Pujol H, Crastes de Paulet A. Relationship between vitamin E and polyunsaturated fatty acids in breast cancer. Nutritional and metabolic aspects. Cancer. 1989;64:2347–53. doi: 10.1002/1097-0142(19891201)64:11<2347::aid-cncr2820641126>3.0.co;2-v. [DOI] [PubMed] [Google Scholar]
- 3.Chyou PH, Nomura AM, Stemmermann GN, Kato I. Prospective study of serum cholesterol and site-specific cancers. J Clin Epidemiol. 1992;45:287–92. doi: 10.1016/0895-4356(92)90089-6. [DOI] [PubMed] [Google Scholar]
- 4.Forones NM, Falcao JB, Mattos D, Barone B. Cholesterolemia in colorectal cancer. Hepatogastroenterology. 1998;45:1531–4. [PubMed] [Google Scholar]
- 5.Patel PS, Shah MH, Jha FP, Raval GN, Rawal RM, Patel MM, et al. Alterations in plasma lipid profile patterns in head and neck cancer and oral precancerous conditions. Indian J Cancer. 2004;41:25–31. [PubMed] [Google Scholar]
- 6.Li X, Tang H, Wang J, Xie X, Liu P, Kong Y, et al. The effect of preoperative serum triglycerides and high-density lipoprotein-cholesterol levels on the prognosis of breast cancer. The Breast. 2017;32:1–6. doi: 10.1016/j.breast.2016.11.024. [DOI] [PubMed] [Google Scholar]
- 7.Nelson ER, Wardell SE, Jasper JS, Park S, Suchindran S, Howe MK, et al. Hydroxycholesterol links hypercholesterolemia and breast cancer pathophysiology. Science. 2013;342:1094–8. doi: 10.1126/science.1241908. [DOI] [PMC free article] [PubMed] [Google Scholar]
- 8.Haibo N, Huixiang L, Rong G. Serum lipids and breast cancer risk: A meta-analysis of prospective cohort studies. PLoS One. 2015;10:e0142669. doi: 10.1371/journal.pone.0142669. [DOI] [PMC free article] [PubMed] [Google Scholar]
- 9.Agnoli C, Berrino F, Abagnato CA, Muti P, Panico S, Crosignani P, et al. Metabolic syndrome and postmenopausal breast cancer in the ORDET cohort: A nested case-control study. Nutr Metab Cardiovasc Dis. 2010;20:41–8. doi: 10.1016/j.numecd.2009.02.006. [DOI] [PMC free article] [PubMed] [Google Scholar]
- 10.Martin LJ, Melnichouk O, Huszti E, Connelly PW, Greenberg CV, Minkin S, et al. Serum lipids, lipoproteins, and risk of breast cancer. A nested case-control study using multiple time points. J Natl Cancer Inst. 2015;107:djv032. doi: 10.1093/jnci/djv032. [DOI] [PMC free article] [PubMed] [Google Scholar]
- 11.Laamiri FZ, Otmani A, Ahid S, Barkat A. Lipid profile among Moroccan overweight women and breast cancer: A case-control study. Int. J. Gen Med. 2013;6:439–45. doi: 10.2147/IJGM.S40826. [DOI] [PMC free article] [PubMed] [Google Scholar]
- 12.Capasso I, Esposito E, Pentimalli F, Crispo A, Montella M, Grimaldi M, et al. Metabolic syndrome affects breast cancer risk in postmenopausal women: National Cancer Institute of Naples experience. Cancer Biol Ther. 2010;10:1240–3. doi: 10.4161/cbt.10.12.13473. [DOI] [PubMed] [Google Scholar]
- 13.Osaki Y, Taniguchi S, Tahara A, Okamoto M, Kishimoto T. Metabolic syndrome and incidence of liver and breast cancers in Japan. Cancer Epidemiol. 2012;36:141–7. doi: 10.1016/j.canep.2011.03.007. [DOI] [PubMed] [Google Scholar]
- 14.Borena W, Stocks T, Jonsson H, Strohmaier S, Nagel G, Bjørge T, et al. Serum triglycerides and cancer risk in the metabolic syndrome and cancer (Me-Can) collaborative study. Cancer Causes Control. 2011;22:291–9. doi: 10.1007/s10552-010-9697-0. [DOI] [PubMed] [Google Scholar]
- 15.Ha M, Sung J, Song YM. Serum total cholesterol and the risk of breast cancer in postmenopausal Korean women. Cancer Causes Control. 2009;20:1055–60. doi: 10.1007/s10552-009-9301-7. [DOI] [PubMed] [Google Scholar]
- 16.Høyer AP, Engholm G. Serum lipids and breast cancer risk: A cohort study of 5,207 Danish women. Cancer Causes Control. 1992;3:403–8. doi: 10.1007/BF00051352. [DOI] [PubMed] [Google Scholar]
- 17.Touvier M, Fassier P, His M, Norat T, Chan DS, Blacher J, et al. Cholesterol and breast cancer risk: A systematic review and meta-analysis of prospective studies. Br J Nutr. 2015;114:347–57. doi: 10.1017/S000711451500183X. [DOI] [PubMed] [Google Scholar]
- 18.Stang A. Critical evaluation of the Newcastle-Ottawa scale for the assessment of the quality of nonrandomized studies in meta-analyses. Eur J Epidemiol. 2010;25:603–5. doi: 10.1007/s10654-010-9491-z. [DOI] [PubMed] [Google Scholar]
- 19.Greenland S, Longnecker MP. Methods for trend estimation from summarized dose-response data, with applications to meta-analysis. Am J Epidemiol. 1992;135:1301–9. doi: 10.1093/oxfordjournals.aje.a116237. [DOI] [PubMed] [Google Scholar]
- 20.Lau J, Ioannidis JP, Schmid CH. Quantitative synthesis in systematic reviews. Ann Intern Med. 1997;127:820–6. doi: 10.7326/0003-4819-127-9-199711010-00008. [DOI] [PubMed] [Google Scholar]
- 21.Higgins JP, Thompson SG, Deeks JJ, Altman DG. Measuring inconsistency in meta-analyses. BMJ. 2003;327:557–60. doi: 10.1136/bmj.327.7414.557. [DOI] [PMC free article] [PubMed] [Google Scholar]
- 22.Egger M, Davey Smith G, Schneider M, Minder C. Bias in meta-analysis detected by a simple, graphical test. BMJ. 1997;315:629–34. doi: 10.1136/bmj.315.7109.629. [DOI] [PMC free article] [PubMed] [Google Scholar]
- 23.Begg CB, Mazumdar M. Operating characteristics of a rank correlation test for publication bias. Biometrics. 1994;50:1088–101. [PubMed] [Google Scholar]
- 24.Eliassen AH, Colditz GA, Rosner B, Willett WC, Hankinson SE. Serum lipids, lipid-lowering drugs, and the risk of breast cancer. Arch Intern Med. 2005;24(165):2264–71. doi: 10.1001/archinte.165.19.2264. [DOI] [PubMed] [Google Scholar]
- 25.Fagherazzi G, Fabre A, Boutron-Ruault MC, Clavel-Chapelon F. Serum cholesterol level, use of a cholesterol-lowering drug, and breast cancer: Results from the prospective E3N cohort. Eur J Cancer Prev. 2010;19:120–5. doi: 10.1097/CEJ.0b013e3283354918. [DOI] [PubMed] [Google Scholar]
- 26.Kabat GC, Kim M, Chlebowski RT, Khandekar J, Ko MG, McTiernan A, et al. A longitudinal study of the metabolic syndrome and risk of postmenopausal breast cancer. Cancer Epidemiol Biomarkers Prev. 2009;18:2046–53. doi: 10.1158/1055-9965.EPI-09-0235. [DOI] [PMC free article] [PubMed] [Google Scholar]
- 27.Furberg AS, Veierød MB, Wilsgaard T, Bernstein L, Thune I. Serum high-density lipoprotein cholesterol, metabolic profile, and breast cancer risk. J Natl Cancer Inst. 2004;96:1152–60. doi: 10.1093/jnci/djh216. [DOI] [PubMed] [Google Scholar]
- 28.His M, Zelek L, Deschasaux M, Pouchieu C, Kesse-Guyot E, Hercberg S, et al. Prospective associations between serum biomarkers of lipid metabolism and overall, breast and prostate cancer risk. Eur J Epidemiol. 2014;29:119–32. doi: 10.1007/s10654-014-9884-5. [DOI] [PubMed] [Google Scholar]
- 29.Bosco JL, Palmer JR, Boggs DA, Hatch EE, Rosenberg L. Cardiometabolic factors and breast cancer risk in U.S. black women. Breast Cancer Res Treat. 2012;134:1247–56. doi: 10.1007/s10549-012-2131-4. [DOI] [PMC free article] [PubMed] [Google Scholar]
- 30.Manjer J, Kaaks R, Riboli E, Berglund G. Risk of breast cancer in relation to anthropometry, blood pressure, blood lipids and glucose metabolism: A prospective study within the Malmö Preventive Project. Eur J Cancer Prev. 2001;10:33–42. doi: 10.1097/00008469-200102000-00004. [DOI] [PubMed] [Google Scholar]
- 31.Chandler PD, Song Y, Lin J, Zhang S, Sesso HD, Mora S, et al. Lipid biomarkers and long-term risk of cancer in the Women's Health Study. Am J Clin Nutr. 2016;103:1397–407. doi: 10.3945/ajcn.115.124321. [DOI] [PMC free article] [PubMed] [Google Scholar]
- 32.His M, Dartois L, Fagherazzi G, Boutten A, Dupré T, Mesrine S, et al. Associations between serum lipids and breast cancer incidence and survival in the E3N prospective cohort study. Cancer Causes Control. 2017;28:77–88. doi: 10.1007/s10552-016-0832-4. [DOI] [PubMed] [Google Scholar]
- 33.Kitahara CM, Berrington de González A, Freedman ND, Huxley R, Mok Y, Jee SH, et al. Total cholesterol and cancer risk in a large prospective study in Korea. J Clin Oncol. 2011;29:1592–8. doi: 10.1200/JCO.2010.31.5200. [DOI] [PMC free article] [PubMed] [Google Scholar]
- 34.Strohmaier S, Edlinger M, Manjer J, Stocks T, Bjørge T, Borena W, et al. Total serum cholesterol and cancer incidence in the Metabolic syndrome and Cancer Project (Me-Can) PLoS One. 2013;8:e54242. doi: 10.1371/journal.pone.0054242. [DOI] [PMC free article] [PubMed] [Google Scholar]
- 35.Inoue M, Noda M, Kurahashi N, Iwasaki M, Sasazuki S, Iso H, et al. Impact of metabolic factors on subsequent cancer risk: Results from a large-scale population-based cohort study in Japan. Eur J Cancer Prev. 2009;18:240–7. doi: 10.1097/CEJ.0b013e3283240460. [DOI] [PubMed] [Google Scholar]
- 36.Iso H, Ikeda A, Inoue M, Sato S, Tsugane S JPHC Study Group. Serum cholesterol levels in relation to the incidence of cancer: The JPHC study cohorts. Int J Cancer. 2009;125:2679–86. doi: 10.1002/ijc.24668. [DOI] [PubMed] [Google Scholar]
- 37.Kucharska-Newton AM, Rosamond WD, Mink PJ, Alberg AJ, Shahar E, Folsom AR. HDL-cholesterol and incidence of breast cancer in the ARIC cohort study. Ann Epidemiol. 2008;18:671–7. doi: 10.1016/j.annepidem.2008.06.006. [DOI] [PMC free article] [PubMed] [Google Scholar]
- 38.Bjørge T, Lukanova A, Jonsson H, Tretli S, Ulmer H, Manjer J, et al. Metabolic syndrome and breast cancer in the Me-Can (Metabolic Syndrome and Cancer) project. Cancer Epidemiol Biomarkers Prev. 2010;19:1737–45. doi: 10.1158/1055-9965.EPI-10-0230. [DOI] [PubMed] [Google Scholar]
- 39.Melvin JC, Seth D, Holmberg L, Garmo H, Hammar N, Jungner I, et al. Lipid profiles and risk of breast and ovarian cancer in the Swedish AMORIS study. Cancer Epidemiol Biomarkers Prev. 2012;21:1381–4. doi: 10.1158/1055-9965.EPI-12-0188. [DOI] [PubMed] [Google Scholar]
- 40.Moorman PG, Hulka BS, Hiatt RA, Krieger N, Newman B, Vogelman JH, et al. Association between high-density lipoprotein cholesterol and breast cancer varies by menopausal status. Cancer Epidemiol Biomarkers Prev. 1998;7:483–8. [PubMed] [Google Scholar]
- 41.Esposito K, Chiodini P, Capuano A, Bellastella G, Maiorino MI, Rafaniello C, et al. Metabolic syndrome and postmenopausal breast cancer: Systematic review and meta-analysis. Menopause. 2013;20:1301–9. doi: 10.1097/GME.0b013e31828ce95d. [DOI] [PubMed] [Google Scholar]
- 42.Sarrel PM. Cardiovascular aspects of androgens in women. Semin Reprod Endocrinol. 1998;16:121–8. doi: 10.1055/s-2007-1016262. [DOI] [PubMed] [Google Scholar]
- 43.Cibeira GH, Giacomazzi J, Aguiar E, Schneider S, Ettrich B, DE Souza CI, et al. Apolipoprotein E genetic polymorphism, serum lipoprotein levels and breast cancer risk: A case-control study. Mol Clin Oncol. 2014;2:1009–15. doi: 10.3892/mco.2014.369. [DOI] [PMC free article] [PubMed] [Google Scholar]
- 44.Saavedra-García P, Nichols K, Mahmud Z, Fan LY, Lam EW. Unravelling the role of fatty acid metabolism in cancer through the FOXO3-FOXM1 axis. Mol Cell Endocrinol. 2017;462:82–92. doi: 10.1016/j.mce.2017.01.012. [DOI] [PubMed] [Google Scholar]
- 45.Agresti R, Meneghini E, Baili P, Minicozzi P, Turco A, Cavallo I, et al. Association of adiposity, dysmetabolisms, and inflammation with aggressive breast cancer subtypes: A cross-sectional study. Breast Cancer Res Treat. 2016;157:179–89. doi: 10.1007/s10549-016-3802-3. [DOI] [PubMed] [Google Scholar]
- 46.Gershuni V, Li YR, Williams AD, So A, Steel L, Carrigan E, et al. Breast cancer subtype distribution is different in normal weight, overweight, and obese women. Breast Cancer Res Treat. 2017;163:375–81. doi: 10.1007/s10549-017-4192-x. [DOI] [PubMed] [Google Scholar]
- 47.Duggan C, Irwin ML, Xiao L, Henderson KD, Smith AW, Baumgartner RN, et al. Associations of insulin resistance and adiponectin with mortality in women with breast cancer. J Clin Oncol. 2011;29:32–9. doi: 10.1200/JCO.2009.26.4473. [DOI] [PMC free article] [PubMed] [Google Scholar]
- 48.Warner M, Gustafsson JA. On estrogen, cholesterol metabolism, and breast cancer. N Engl J Med. 2014;370:572–3. doi: 10.1056/NEJMcibr1315176. [DOI] [PubMed] [Google Scholar]
- 49.Kim Y, Park SK, Han W, Kim DH, Hong YC, Ha EH, et al. Serum high-density lipoprotein cholesterol and breast cancer risk by menopausal status, body mass index, and hormonal receptor in Korea. Cancer Epidemiol Biomarkers Prev. 2009;18:508–15. doi: 10.1158/1055-9965.EPI-08-0133. [DOI] [PubMed] [Google Scholar]
- 50.Martinez-Outschoorn UE, Peiris-Pages M, Pestell RG, Sotgia F, Lisanti MP. Cancer metabolism: A therapeutic perspective. Nat Rev Clin Oncol. 2017;14:11–31. doi: 10.1038/nrclinonc.2016.60. [DOI] [PubMed] [Google Scholar]
- 51.Cauley JA, McTiernan A, Rodabough RJ, LaCroix A, Bauer DC, Margolis KL, et al. Statin use and breast cancer: Prospective results from the Women's Health Initiative. J Natl Cancer Inst. 2006;98:700–7. doi: 10.1093/jnci/djj188. [DOI] [PubMed] [Google Scholar]
- 52.Boudreau DM, Yu O, Miglioretti DL, Buist DS, Heckbert SR, Daling JR. Statin use and breast cancer risk in a large population-based setting. Cancer Epidemiol Biomarkers Prev. 2007;16:416–1. doi: 10.1158/1055-9965.EPI-06-0737. [DOI] [PMC free article] [PubMed] [Google Scholar]
- 53.Mansourian M, Haghjooy-Javanmard S, Eshraghi A, Vaseghi G, Hayatshahi A, Thomas J. Statins use and risk of breast cancer recurrence and death: A systematic review and meta-analysis of observational studies. J Pharm Sci. 2016;19:72–81. doi: 10.18433/J3202B. [DOI] [PubMed] [Google Scholar]
- 54.Undela K, Srikanth V, Bansal D. Statin use and risk of breast cancer: A meta-analysis of observational studies. Breast Cancer Res Treat. 2012;135:261–9. doi: 10.1007/s10549-012-2154-x. [DOI] [PubMed] [Google Scholar]