

Abstract
Background:
Depression and anxiety are two mental disorders that are often comorbid. However, the associations of long-term air pollution exposure with depression and anxiety remain inconclusive.
Objective:
We conducted a cross-sectional and prospective study to examine the associations of ambient exposure to particulate matter (PM) with a diameter of (), (), and (), nitrogen oxides (), and nitrogen dioxide () with the risk of depression and anxiety in the UK Biobank.
Methods:
This study included 398,241 participants from the UK Biobank, 128,456 of whom participated the 7-y online mental health survey. A total of 345,876 individuals were free of depression and anxiety at baseline; of those, 16,185 developed incident mental disorders during a median of 8.7 y of follow-up. Depression and anxiety were assessed using hospital admission records and mental health questionnaires. Associations of air pollution with prevalent and incident mental disorders were examined using logistic regression and Cox regression models, respectively.
Results:
Elevated levels of the five air pollutants were associated with higher odds of mental disorders at baseline. Levels of four pollutants but not were also associated with higher odds and risks of mental disorders during follow-up; specifically, hazard ratios [HR, 95% confidence interval (CI)] of an interquartile range increase in , , , and for incident mental disorders were 1.03 (95% CI: 1.01, 1.05), 1.06 (95% CI: 1.04, 1.08), 1.03 (95% CI: 1.01, 1.05), and 1.06 (95% CI: 1.04, 1.09), respectively. An air pollution index reflecting combined effects of pollutants also demonstrated a positive association with the risk of mental disorders. HR (95% CI) of incident mental disorders were 1.11 (95% CI: 1.05, 1.18) in the highest quintile group in comparison with the lowest quintile of the air pollution index. We further observed that the associations between air pollution and mental disorders differed by a genetic risk score based on single nucleotide polymorphisms previously associated with genetic susceptibility to mental disorders in the UK Biobank cohort.
Discussion:
To our knowledge, this research is one of the largest cohort studies that demonstrates an association between mental health disorders and exposure to long-term air pollution, which could be further enhanced by genetic predisposition. https://doi.org/10.1289/EHP10391
Introduction
Depression and anxiety are common mental health disorders that often co-occur and can broadly impact the longevity by promoting aging-related conditions.1,2 With the rapidly increasing prevalence of depression and anxiety, as well as their unclear etiology, the task of identifying modifiable risk factors for mental disorders and developing relevant prevention strategies has drawn increasing attention.3,4 Recently, mounting numbers of epidemiological studies have examined the associations between exposure to ambient air pollutants and the risk of depression and anxiety.5–8 However, although the short-term impact of air pollution on mental disorders, especially depression, has been widely studied, results of previous population-based studies on the long-term impact of air pollution exposure remain controversial due to heterogeneities of study designs.5,6,8 Several studies were cross-sectional or crossover analyses with limited time of follow-up at the city level and focused on only particulate matter (PM) with a diameter of () and/or ().8–10 Other studies implemented insurance data without personal assessment using questionnaires,11 which may underestimate the influence of air pollution on mental health because people with mild syndromes are not inclined to seek insurance services. A study by Newbury et al. employed the data of mental health service use as the surrogate for the prevalence of mental disorders and specifically examined the relapse of disorders, but similar underestimation of mild syndromes might exist.12 Therefore, it is worthwhile to study the associations of long-term exposure to ambient air pollution with depression and anxiety in a large independent study with a prospective design and comprehensive assessments of depression and anxiety.
Notably, previous studies addressing the associations between air pollution and the risk of depression or anxiety also mainly focused on the individual effect of each air pollutant.5–8 Considering that ambient air pollution is a mixture of gaseous pollutants and particles,13 exploring their synergistic effects of on mental disorders is critical to uncover the holistic nature of air pollution on mental health in real-world settings, which, to our knowledge, have not been assessed in a prospective cohort study. Additionally, mental health disorders have been commonly recognized to be influenced by genetic and environmental factors.14,15 Recently, evidence has suggested that the gene–environment interplay could influence the development of health disorders,16 but the knowledge on whether the genetic susceptibility could modify the association between the combined exposure to multiple air pollutants and mental disorders is scarce.
Hence, we investigated the associations of five major air pollutants, including , , PM with diameters of (), and nitrogen oxides ( and ), with the prevalence and incidence of depression and anxiety with a prospective design. This study was based on data of UK Biobank participants enrolled in a nationwide population-based cohort study in the UK with a median follow-up of 8.7 y. Leveraging the detailed records of air pollution and genetic variations of UK Biobank, we constructed an air pollution index to examine to what extent exposure to multiple air pollutants was associated with a greater burden of depression and/or anxiety and assessed the possible gene–air pollution interplay.
Methods
Study Design and Population
Study design of UK Biobank was reported in detail previously.17 Briefly, UK Biobank is an ongoing prospective study with 502,536 participants recruited in 2006–2010 at the age of 37–73 y old (baseline survey) with multiple follow-ups. At baseline survey, participants were asked to attend 22 examination centers located in the UK to provide information on their lifestyle and health, and their biological samples were collected. As shown in Figure S1, in this study, we included 398,241 participants with available data on mental health status, air pollution, and genetic variants at baseline to analyze the association between air pollution and prevalent mental disorders. Two subsets were subsequently used to conduct further analyses; accordingly, from 2016 to 2017, a subset with 128,456 participants reported their detailed mental health status via an online 7-y survey and were used to evaluate the prospective associations between baseline air pollution and the detailed syndromes of depression or anxiety at the 7-y survey. A second subset with 345,876 participants who were free of depression or anxiety at baseline was employed to assess the association between air pollution and the incidence of mental disorders diagnosed by the 7-y survey and/or hospital records (see details below). UK Biobank research has received the approval from the North West Multicenter Research Ethical Committee. Written informed consents were provided by all participants.
Assessment of Depression and Anxiety
The assessments of depression and anxiety were conducted using both linked hospital admission records (UK Biobank Data-Fields: 41202 and 41204) and mental health questionnaires at baseline and follow-up. Participants were considered as depression or anxiety positive if either record was positive. For hospital records, participants were classified as cases if they had either an ICD-9/10 primary or secondary diagnosis for depression (ICD-9: 311; ICD-10: F32–F33) and/or anxiety (ICD-9: 300; ICD-10: F40–F41). Mental disorder was defined as participants with depression and/or anxiety. The end date of follow-up was 31 December 2018. For participants who were free of mental disorders at baseline, especially for those included in both subset analyses (), their follow-up time was estimated based on the dates of hospital records of incident mental disorder, the dates of the 7-y survey with a positive classification of depression/anxiety, or the date of censoring, whichever occurred first.
For questionnaire screening, at baseline, depression and anxiety symptoms were assessed only by Patient Health Questionnaire (PHQ)-4 questionnaire.18 Participants were required to rate, on a four-point Likert scale from 0 (not at all) to 3 (nearly every day), their response to four items: a) “frequency of depressed mood in the last 2 weeks” (UK Biobank Data-Field: 2050), b) “frequency of unenthusiasm/disinterest in the last 2 weeks” (UK Biobank Data-Field: 2060), c) “frequency of tenseness/restlessness in the last 2 weeks” (UK Biobank Data-Field: 2070), and d) “frequency of tiredness/lethargy in the last 2 weeks” (UK Biobank Data-Field: 2080). Total score ranged from 0 to 12, and a score of was considered emotional disorder positive. A total score of for items 1 and 2 was considered as positive for depression, and a total score of for items 3 and 4 was considered as positive for anxiety based on the reported criteria.18
At the 7-y survey, mental health status was assessed using PHQ-9 (an updated PHQ-4)19 and Generalized Anxiety Disorder (GAD)-7 questionnaires20 between 2016 and 2017 with the same four-point Likert scale from 0 (not at all) to 3 (nearly every day). PHQ-9 consists of 9 items for thoughts and feelings in the last 2 wk: a) “recent thoughts of suicide or self-harm” (Suicidal ideation; UK Biobank Data-Field: 20513), b) “trouble falling or staying asleep, or sleeping too much” (Sleeping problems; UK Biobank Data-Field: 20517), c) “recent changes in speed/amount of moving or speaking” (Psychomotor changes; UK Biobank Data-Field: 20518), d) “recent feelings of inadequacy” (Feelings of inadequacy; UK Biobank Data-Field: 20507). e) “recent feelings of tiredness or low energy” (Fatigue; UK Biobank Data-Field: 20519), f) “recent feelings of depression” (Depressed mood; UK Biobank Data-Field: 20510), g) “recent trouble concentrating on things” (Cognitive problems; UK Biobank Data-Field: 20508), h) “recent poor appetite or overeating” (Appetite changes; UK Biobank Data-Field: 20511), and i) “recent lack of interest or pleasure in doing things” (Anhedonia; UK Biobank Data-Field: 20514). GAD-7 consists of seven items for thoughts and feelings in the last 2 wk: a) “recent inability to stop or control worrying” (Worrying control; UK Biobank Data-Field: 20509), b) “recent restlessness” (Restlessness; UK Biobank Data-Field: 20516), c) “recent trouble relaxing” (Lack of relaxation; UK Biobank Data-Field: 20515), d) “recent easy annoyance or irritability” (Irritability; UK Biobank Data-Field: 20505), e) “recent worrying too much about different things” (Generalized worrying; UK Biobank Data-Field: 20520), f) “recent feelings of foreboding” (Foreboding; UK Biobank Data-Field: 20512), and g) “recent feelings of nervousness or anxiety” (Anxiety feeling; UK Biobank Data-Field: 20506). Any item with a score of was considered as positive for this symptom. A PHQ-9 or GAD-7 total score of was considered as depression or anxiety symptoms positive according to the corresponding criteria,19,20 respectively.
Exposure Assessments
As previously described,21 the 1-y moving average concentrations of , , , , and of UK Biobank were calculated based on a Land Use Regression (LUR) model developed by the ESCAPE project. LUR models calculate the annual moving average concentrations of air pollutants using the predictor variables retrieved from the GIS variables, including land use, traffic, and topography by a resolution. Participants’ ambient air pollution concentrations were then assigned according to their residential coordinates in the grid cells. Previous reports using leave-one-out cross-validation demonstrated good model performance for , , and ( of , 88%, 87%, and 88%, respectively) and a moderate performance for (cross-validation ) in the southeast England area, where a majority of the participants came from (London/Oxford). Therefore, participants living in northern England and Scotland (; Figure S1) were eliminated from the PM analyses. Details of the ESCAPE LUR models have been described previously.22,23 The LUR estimates of PM were valid within a area from Greater London for participants living in this area. The 1-y moving average ambient concentrations of , , and were collected in 2010 only, but because 1-y moving average concentrations of and were available for several years (2005, 2006, 2007, and 2010 for and 2007 and 2010 for ), their averaged values were included in our analysis.
Measurements of Covariates
To control for potential bias resulting from covariates that were reported to be related to mental health or air pollution,6,11,24,25 we included the following, reported at baseline: age (year; continuous), sex (male/female; categorical), body mass index (BMI, ; continuous), race (based on UK Biobank Data-Field 1657 “self-reported ethnic group,” categorized into White, Black, Asian, and Other; Other included those reported “White and Black mixed” and “other ethnic group” to the question), smoking status (current/former/never; categorical), healthy alcohol intake status (yes/no; categorical), healthy physical activity status (yes/no; categorical), years of education ( and ; categorical), forced respiratory volume in the first second (, liter; continuous), forced vital capacity (FVC, liter; continuous), Townsend deprivation index (continuous), live in urban area (yes/no; categorical), and prevalent hypertension, coronary heart disease (CHD), and diabetes (yes/no; categorical). Height and weight were measured by nurses during the baseline assessment visit, and BMI was calculated by dividing weight (kilograms) by the square of height (meters). Healthy alcohol intake was defined as: for male and for female. Healthy physical activity status was defined as: moderate or vigorous or 150 min/wk mixed () activity. The activity was assessed using the Metabolic Equivalent Task (MET) minutes based on the short International Physical Activity Questionnaire (IPAQ).26 and FVC were measured at baseline via spirometry. Townsend deprivation index ranged from to 10.2 and was constructed based on the percentages of four key variables in the UK Biobank according to previously reported algorithm,27 unemployment, overcrowded household, non–car ownership, and non–home ownership. The percentages for each area were based on postcodes and census data at the year of baseline visit, with each participant assigned percentages corresponding to the postcode of their home dwelling but not based on individual-level factors. The percentages of unemployment and overcrowded household were normalized by ln () because the two were skewed. The four percentages were then z-scored and summarized as the Townsend deprivation index. A higher index indicates a higher level of deprivation. The history of hypertension, CHD, and diabetes was based on self-reported information and medical records. Because all covariates were missing (Table 1), we imputed continuous variables with sex-specific mean values and implemented a missing indicator approach for the categorical variables.28
Table 1.
Characteristics of 398,241 participants from the UK Biobank at baseline and the subgroups of participants with 7-y survey data and participants free of mental disorders at baseline.
| Characteristica | All () |
Participants with 7-y survey data () |
Participants free of mental disorders at baseline () |
|---|---|---|---|
| Age (y) | 56.55 (8.07) | 55.93 (7.74) | 56.83 (8.04) |
| BMI () | 27.38 (4.76) | 26.77 (4.54) | 27.22 (4.58) |
| (L) | 2.83 (0.80) | 2.92 (0.77) | 2.85 (0.80) |
| FVC (L) | 3.74 (1.06) | 3.84 (1.03) | 3.76 (1.06) |
| Sex | |||
| Male | 184,198 (46.3%) | 56,692 (44.1%) | 162,869 (47.1%) |
| Female | 214,043 (53.7%) | 71,764 (55.9%) | 183,007 (52.9%) |
| Race | |||
| White | 379,373 (95.3%) | 124,925 (97.3%) | 331,922 (96.0%) |
| Black | 5,421 (1.3%) | 1,345 (1.0%) | 4,092 (1.2%) |
| Asian | 7,641 (1.9%) | 1,296 (1.0%) | 5,527 (1.6%) |
| Other | 5,806 (1.5%) | 890 (0.7%) | 4,335 (1.2%) |
| Smoking status | |||
| Current smoker | 40,282 (10.1%) | 9,020 (7.0%) | 31,625 (9.2%) |
| Former smoker | 139,671 (35.2%) | 45,511 (35.5%) | 122,804 (35.6%) |
| Never smoker | 217,167 (54.7%) | 73,725 (57.5%) | 190,501 (55.2%) |
| Missing | 1,121 | 200 | 946 |
| Healthy alcohol intakeb | |||
| Yes | 198,922 (50.0%) | 68,602 (53.4%) | 176,951 (51.2%) |
| No | 199,064 (50.0%) | 59,818 (46.6%) | 168,759 (48.8%) |
| Missing | 255 | 36 | 166 |
| Healthy physical activityc | |||
| Yes | 280,132 (71.5%) | 92,811 (72.6%) | 249,022 (73.0%) |
| No | 111,686 (28.5%) | 34,955 (27.4%) | 92,140 (27.0%) |
| Missing | 6,423 | 690 | 4,714 |
| Years of education | |||
| 263,065 (66.1%) | 101,925 (79.4%) | 232,515 (67.2%) | |
| 135,176 (33.9%) | 26,531 (20.6%) | 113,361 (32.8%) | |
| Townsend deprivation indexd | (2.99) | (2.79) | (2.90) |
| Live in an urban area | |||
| Yes | 336,257 (85.2%) | 106,236 (83.5%) | 290,304 (84.7%) |
| No | 58,300 (14.8%) | 20,986 (16.5%) | 52,502 (15.3%) |
| Missing | 3,684 | 1,234 | 3,070 |
| Hypertensione | |||
| Yes | 220,764 (55.4%) | 65,925 (51.3%) | 193,121 (55.8%) |
| No | 177,477 (44.6%) | 62,531 (48.7%) | 152,755 (44.2%) |
| Coronary heart diseasef | |||
| Yes | 22,136 (5.6%) | 4,519 (3.5%) | 17,348 (5.0%) |
| No | 376,105 (94.4%) | 123,937 (96.5%) | 328,528 (95.0%) |
| Diabetesg | |||
| Yes | 20,288 (5.1%) | 4,261 (3.3%) | 15,946 (4.6%) |
| No | 377,953 (94.9%) | 124,195 (96.7) | 329,930 (95.4%) |
| Mental health status at baseline | |||
| PHQ-4 score | 1.60 (2.10) | 1.36 (1.84) | 5.58 (2.49) |
| Mental disorders | |||
| Yes | 52,365 (13.2%) | 12,417 (9.7%) | — |
| No | 345,876 (86.8%) | 116,039 (90.3%) | — |
| Depression | |||
| Yes | 25,715 (6.5%) | 5,368 (4.2%) | — |
| No | 372,526 (93.5%) | 123,088 (95.8%) | — |
| Anxiety | |||
| Yes | 41,783 (10.5%) | 10,032 (7.8%) | — |
| No | 356,458 (89.5%) | 118,424 (92.2%) | — |
| Mental health status at 7-y survey | |||
| PHQ-9 score | — | 2.70 (3.66) | — |
| GAD-7 score | — | 2.07 (3.33) | — |
| Mental disorders | |||
| Yes | — | 9,443 (7.4%) | — |
| No | — | 119,013 (92.6) | — |
| Depression | |||
| Yes | — | 7,100 (5.5%) | — |
| No | — | 121,356 (94.5%) | — |
| Anxiety | |||
| Yes | — | 5,287 (4.1%) | — |
| No | — | 123,169 (95.9%) | — |
Note: BMI, Body mass index; ; FVC, forced vital capacity; GAD-7, General Anxiety Disorder-7 questionnaire; min, minutes; PHQ-4, Patient Health Questionnaire-4 questionnaire; PHQ-9, Patient Health Questionnaire-9 questionnaire; —, no data.
Mean values (standard deviation) for continuous variables and n (%) for categorical variables.
Healthy alcohol intake: male: ; female: .
Healthy physical activity: moderate or vigorous or 150 min/wk mixed () activity.
Data missing in 453 (0.11%) participants. This index is composite score based on four key variables: unemployment, overcrowded household, non–car ownership, and non–home ownership (detail see methods).
Hypertension diagnosed by doctor according to self-reported information and/or medical records.
Coronary heart disease diagnosed by doctor according to self-reported information and/or medical records.
Diabetes diagnosed by doctor according to self-reported information and/or medical records.
Genetic Risk Scores for Mental Disorders
Details of the genotyping, data imputation, and quality control in UK Biobank have been previously reported.17,29 Briefly, of participants were genotyped using the Applied Biosystems UK BiLEVE Axiom Array by Affymetrix (807,411 sites), with the remaining participants being genotyped using the Applied Biosystems UK Biobank Axiom Array (825,927 sites), both of which were specifically designed for the UK Biobank with 95% shared sites. Phasing and imputation of the remaining 5% unique single-nucleotide polymorphisms (SNPs) were conducted using SHAPEIT3 and IMPUTE2 with both the merged UK10K and 1000 Genomes Phase 3 reference panel and the Haplotype Reference Consortium (HRC) reference panel (i.e., array imputation). SNPs after the array imputation were considered for building a genetic risk score (GRS). We directly used the imputed genetic data without further quality control.29 Based on the availability of imputed SNPs, we created a GRS for mental disorders using 37/44 depression-related SNPs and 9 out of 10 unique anxiety-related SNPs based on the two largest genome-wide association studies (GWASs).30,31 Each SNP was recoded as 0, 1, or 2 according to the number of risk alleles, and missing SNP values of individuals were imputed by corresponding mean values (i.e., individual imputation). To avoid the bias from nonlinearity, this GRS based on multiple genes was calculated and weighted by summing up after multiplying the logarithmic odds ratios (ORs) of each included SNP reported by the selected GWASs on depression or anxiety with the number of risk alleles and then divided by the total effect size. The GRS ranged from 0.85 to 2.70. The detailed SNPs are reported in Table 2.
Table 2.
Characteristics of genetic variants associated with depression and anxiety in UK Biobank.
| Trait | SNP | CHR | Position | -Value | Allele 1 | Allele 2 | OR | SE | Frequency |
|---|---|---|---|---|---|---|---|---|---|
| Depression | rs1432639 | 1 | 72813218 | A | C | 1.04 | 0.005 | 0.63 | |
| rs12129573 | 1 | 73768366 | A | C | 1.04 | 0.005 | 0.37 | ||
| rs2389016 | 1 | 80799329 | T | C | 1.03 | 0.0053 | 0.28 | ||
| rs4261101 | 1 | 90796053 | A | G | 0.97 | 0.005 | 0.37 | ||
| rs9427672 | 1 | 197754741 | A | G | 0.97 | 0.0058 | 0.24 | ||
| rs11682175 | 2 | 57987593 | T | C | 0.97 | 0.0048 | 0.52 | ||
| rs1226412 | 2 | 157111313 | T | C | 1.03 | 0.0059 | 0.79 | ||
| rs7430565 | 3 | 158107180 | A | G | 0.97 | 0.0048 | 0.58 | ||
| rs34215985 | 4 | 42047778 | C | G | 0.96 | 0.0063 | 0.24 | ||
| rs11135349 | 5 | 164523472 | A | C | 0.97 | 0.0048 | 0.48 | ||
| rs4869056 | 5 | 166992078 | A | G | 0.97 | 0.005 | 0.63 | ||
| rs9402472 | 6 | 99566521 | A | G | 1.03 | 0.0059 | 0.24 | ||
| rs10950398 | 7 | 12264871 | A | G | 1.03 | 0.0049 | 0.41 | ||
| rs12666117 | 7 | 109105611 | A | G | 1.03 | 0.0048 | 0.47 | ||
| rs1354115 | 9 | 2983774 | A | C | 1.03 | 0.0049 | 0.62 | ||
| rs10959913 | 9 | 11544964 | T | G | 1.03 | 0.0057 | 0.76 | ||
| rs7856424 | 9 | 119733595 | T | C | 0.97 | 0.0053 | 0.29 | ||
| rs7029033 | 9 | 126682068 | T | C | 1.05 | 0.0093 | 0.07 | ||
| rs61867293 | 10 | 106563924 | T | C | 0.96 | 0.0061 | 0.2 | ||
| rs1806153 | 11 | 31850105 | T | G | 1.04 | 0.0059 | 0.22 | ||
| rs4074723 | 12 | 23947737 | A | C | 0.97 | 0.0049 | 0.41 | ||
| rs4143229 | 13 | 44327799 | A | C | 0.95 | 0.0091 | 0.92 | ||
| rs12552 | 13 | 53625781 | A | G | 1.04 | 0.0048 | 0.44 | ||
| rs4904738 | 14 | 42179732 | T | C | 0.97 | 0.0049 | 0.57 | ||
| rs915057 | 14 | 64686207 | A | G | 0.97 | 0.0049 | 0.42 | ||
| rs10149470 | 14 | 104017953 | A | G | 0.97 | 0.0049 | 0.49 | ||
| rs8025231 | 15 | 37648402 | A | C | 0.97 | 0.0048 | 0.57 | ||
| rs8063603 | 16 | 6310645 | A | G | 0.97 | 0.0053 | 0.65 | ||
| rs7198928 | 16 | 7666402 | T | C | 1.03 | 0.005 | 0.62 | ||
| rs7200826 | 16 | 13066833 | T | C | 1.03 | 0.0055 | 0.25 | ||
| rs11643192 | 16 | 72214276 | A | C | 1.03 | 0.0049 | 0.41 | ||
| rs17727765 | 17 | 27576962 | T | C | 0.95 | 0.0088 | 0.92 | ||
| rs62099069 | 18 | 36883737 | A | T | 0.97 | 0.0049 | 0.42 | ||
| rs11663393 | 18 | 50614732 | A | G | 1.03 | 0.0049 | 0.45 | ||
| rs1833288 | 18 | 52517906 | A | G | 1.03 | 0.0054 | 0.72 | ||
| rs12958048 | 18 | 53101598 | A | G | 1.03 | 0.0051 | 0.33 | ||
| rs5758265 | 22 | 41617897 | A | G | 1.03 | 0.0054 | 0.28 | ||
| Anxiety | rs79928194 | 2 | 233649290 | T | C | 0.862 | 0.0515 | 0.905 | |
| rs342422 | 5 | 83470986 | A | G | 0.92 | 0.036 | 0.53 | ||
| rs2451828 | 5 | 7748796 | T | C | 1.34 | 0.156 | 0.019 | ||
| rs6462203 | 7 | 3676002 | A | C | 0.901 | 0.0345 | 0.265 | ||
| rs16916239 | 8 | 87643741 | A | G | 0.903 | 0.037 | 0.783 | ||
| rs113209956 | 9 | 2511193 | T | C | 0.828 | 0.057 | 0.085 | ||
| rs1458103 | 11 | 81047274 | A | C | 0.898 | 0.0345 | 0.741 | ||
| rs11855560 | 15 | 41024303 | T | C | 1.089 | 0.0365 | 0.469 | ||
| rs6030245 | 20 | 41070559 | T | C | 1.12 | 0.049 | 0.795 |
Note: The 37 risk alleles of depression were selected based on Wray et al.’s study,30 and the nine risk alleles of anxiety were selected based on Meier et al.’s study.31 The ORs, p-values, and frequencies are based on selected GWASs. CHR, chromosome; GWAS, genome-wide association study; OR, odds ratio; SNP, single-nucleotide polymorphism.
Construction of Air Pollution Index
As a post hoc analysis, to account for the combined effects of multiple air pollutants on mental disorders, we created an air pollution index by excluding due to its weak associations with mental disorders using a modified algorithm reported by a previous study21 (for details, see the “Results” section). This index is a continuous weighted score by adding concentrations of the air pollutants, weighted by the effect estimates ( coefficients) on the odds of mental disorders at baseline or the risk of incident mental disorders at the follow-up in the crude model, which adjusted for age and sex only. The equation of the index was: and was also categorized into five groups by quintiles.
To avoid upweighting the positive associations retrieved from this study, because the coefficients for the construction of the index were from the same cohort, we validated it with two approaches. First, we conducted a 10-fold cross-validation analysis that was conducted in a previous air pollution-related study based on the UK Biobank.32,33 UK Biobank data were randomly divided into 10 batches. One of the batches was testing data, and the other nine were the training data in each run. Logistic and Cox regression models were applied to obtain regression coefficients to build the air pollution index in the training data, and the constructed index was then tested in the testing data. After being repeated 10 times, the ORs and HRs were then polled using a fixed-effect meta-analysis to obtain the comprehensive ORs and HRs.34 Similar estimates suggested that this air pollution index was robust in the present study (Table S1). Furthermore, we generated a quantile score without taking the prior weights of each air pollutant into consideration. Ambient concentration within the fourth quartile of each air pollutant except was defined as “extreme” exposure to corresponding pollutants. This score was then determined as the sum of “extreme” exposed air pollutants. This score and the air pollution index were highly correlated with each other (Table S2), suggesting that the bias from up-weighting the positive associations in the construction of air pollution index was quite limited.
Statistical Analyses
Sociodemographic and lifestyle factors and mental health outcomes for all participants, participants with the mental health survey data at the 7-y survey, and participants who were free of depression or anxiety were summarized using descriptive statistics.
We first examined the associations of the five air pollutants with the total PHQ-4 score using mixed-effect linear regression models and the odds of mental disorders, depression, and anxiety at baseline using logistic regression models to evaluate the cross-sectional association between air pollution and mental disorders. We adjusted for age, sex, BMI, race, smoking status, healthy alcohol intake status, healthy physical activity status, years of education, , FVC, Townsend deprivation index, residence in an urban area, and prevalent hypertension, CHD, and diabetes, and we controlled for the examination center as a random effect in the model to account for the potential clustering bias from health examinations. Yielded estimates were reported as changes per one interquartile range (IQR) increase in the ambient concentration of each air pollutant. Two forms of air pollution index for baseline analysis were built accordingly, and the corresponding dose–response curves of air pollutants and the index with PHQ-4 score were further assessed by restricted cubic spline regression models controlling for previously described covariates. The 5th, 50th, and 95th percentiles of each air pollutant and air pollution index were selected as knots.
Then, in the subset with 7-y survey data, we examined the prospective associations between the baseline air pollution levels and the odds of mental disorders and corresponding symptoms of each disorder (logistic regression) and the scores of PHQ-9 and GAD-7 (linear regression) at the 7-y survey. Models adjusted for covariates described in the previous section and the status of mental disorders (yes/no) at baseline.
Furthermore, the Cox proportional hazards model was used to assess the prospective associations between baseline air pollution levels and the incidence of mental disorders during the follow-up among participants free of depression and anxiety at baseline. Corresponding air pollution index for the joint association was constructed accordingly, and its dose–response relationships with the risk of incident mental disorders, depression, and anxiety were also assessed by restricted cubic spline regression. The 5th, 50th, and 95th percentiles of the air pollution index were selected as knots.
Finally, to evaluate whether the genetic predisposition of mental disorders may modify the association of air pollution index with the odds of mental disorders at baseline and the risk of mental disorders at the follow-up, we tested the gene–air pollution interaction by employing the interaction terms of the air pollution index with the GRS of mental disorders in the models for the prevalence and incidences of depression and anxiety. In the case that interaction effect did not meet criteria for statistical significance, we generated a category variable based on the quintiles of air pollution index, and dichotomized GRS (by median) was further generated to show the joint association of both factors with mental disorders. For all primary analyses, we used the E-values and the lower confidence interval to indicate the robustness to unmeasured confounding.35 This E-value could test the robustness of an association between exposure and outcome and to evaluate evidence for causation. The unmeasured confounders needed to be associated with both air pollution and mental disorders with a risk ratio of the E-value to fully explain the observed associations between air pollutants and mental disorders.
Additionally, three sensitivity analyses were performed to validate the robustness of our primary findings. We first tested the estimates of air pollutants in relation to incident mental disorders in a model adjusting for , , , and to examine the copollutant cofounding. Then, we examined the associations between air pollutants and the concurrent incidence of depression and anxiety. Last, we conducted another analysis using the primary model in participants who self-reported at the baseline survey that they had been living at the same baseline address for more than 5 y to evaluate whether the mobilization may affect the primary findings.
SAS version 9.4 TS1M7 (SAS Institute Inc.) was used to clean data and conduct analyses. A two-sided p-value was considered statistically significant.
Results
Participants’ Characteristics and Distributions of Air Pollutants
Characteristics of the study population and the subset of participants free of mental disorders at baseline were similar with respect to most variables but slightly different in the subset of people with 7-y survey data (Table 1). For the whole population, participants’ age [ deviation (SD)] was y and () were White. About 35% () and 55% () of participants were former and never smokers, respectively. A majority of participants had healthy physical activity (70.4%, ), of education (66.1%, ), and lived in an urban area (84.4%, ). Half reported a healthy daily intake of alcohol (). About 55% (), 6% (), and 5% () had prevalent hypertension, CHD, or diabetes diagnosed by doctors, respectively, according to self-reported information and medical records. The average PHQ-4 score was , and about 13% (), 7% (), and 11% () were with prevalent mental disorders, depression, and anxiety, respectively, according to the PHQ-4 score definition or hospital records. The subset with 7-y survey data had a higher proportion of people with of education (79.4%, ) than did the total cohort or subset free of mental disorders at baseline; about 10% (), 4% (), and 8% () of the participants in this subgroup had prevalent mental disorders, depression, and anxiety, respectively. The 345,876 participants that were free of mental disorders at baseline were followed for a median time of 8.7 y, and 16,185 of them (4.68%) developed mental disorders (; ).
Average concentrations of air pollutants at baseline for the total population were () for , () for , () for , () for , and () for . Ambient concentrations of all air pollutants were highly correlated with each other (Table 3).
Table 3.
Distributions and correlation matrix of the ambient concentrations of five air pollutants for 398,241 participants at baseline (Pearson correlation).
| Pearson correlation coefficients | |||||||||||
|---|---|---|---|---|---|---|---|---|---|---|---|
| Air pollutants | Mean (SD) | Min | Max | 25th | 75th | IQR | |||||
| () | 9.97 (1.06) | 8.17 | 21.31 | 9.27 | 10.54 | 1.27 | 1 | — | — | — | — |
| () | 6.42 (0.90) | 5.57 | 12.82 | 5.84 | 6.63 | 0.79 | 0.216 | 1 | — | — | — |
| () | 19.24 (2.02) | 5.92 | 30.08 | 18.03 | 20.36 | 2.33 | 0.623 | 0.513 | 1 | — | — |
| () | 43.68 (15.54) | 19.74 | 265.94 | 33.90 | 50.43 | 16.53 | 0.849 | 0.177 | 0.626 | 1 | — |
| () | 29.01 (9.17) | 8.86 | 125.13 | 22.75 | 33.62 | 10.87 | 0.736 | 0.233 | 0.779 | 0.747 | 1 |
Note: —, no data; IQR, interquartile range; max, maximum; min, minimum; ; ; ; ; ; SD, standard deviation.
Associations of Air Pollution with the Odds of Mental Disorders at Baseline and 7-y Survey
As shown in Table 4, after adjusting for potential covariates, the ambient levels of four air pollutants except showed strong associations with the PHQ-4 score and the odds of mental disorders. Particularly, an IQR increment of level was associated with a 0.051-unit [] increase in PHQ-4 score, and with the ORs (95% CI) of 1.07 (95% CI: 1.06, 1.09), 1.08 (95% CI: 1.07, 1.10), and 1.07 (95% CI: 1.05, 1.08) for mental disorders, depression, and anxiety, respectively. To further estimate the combined associations of the five air pollutants with mental health at baseline, we constructed an air pollution index based on the coefficients of the five pollutants for the odds of mental disorders at baseline retrieved from a crude model adjusting for sex and age only to avoid overadjustment bias in the primary analysis models that controlled for all potential covariates. Both continuous and categorical forms of the index were associated with a higher PHQ-4 score and odds of mental disorders in the fully adjusted model. For instance, the ORs of mental disorders were 1.04 (95% CI: 1.00, 1.08), 1.11 (95% CI: 1.07, 1.14), 1.15 (95% CI: 1.11, 1.19), and 1.16 (95% CI: 1.12, 1.20) for second–fifth quintile groups, respectively, in comparison with the first quintile of the air pollution index (Table 4). Except , the other four air pollutants and corresponding air pollution index demonstrated monotonic increasing dose–response relationships with the PHQ-4 score (Figure 1).
Table 4.
Associations of air pollutants (per IQR increase) and air pollution index with the PHQ-4 Score and odds of mental disorders for 398,241 participants at baseline.
| PHQ-4 Score | Mental disordersa | Depression | Anxiety | ||||||||||||
|---|---|---|---|---|---|---|---|---|---|---|---|---|---|---|---|
| Air pollutants | Coefficients (SE) | -Value | E-value (CI) | OR (95% CI) | -Value | E-Value (CI) | OR (95% CI) | p-value | E-value (CI) | Odds ratio (95% CI) | p-value | E-value (CI) | |||
| 0.051 (0.005) | 1.17 (1.15) | 52,365/398,241 | 1.07 (1.06, 1.09) | 1.34 (1.31) | 25,715/398,241 | 1.08 (1.07, 1.10) | 1.37 (1.34) | 41,783/398,241 | 1.07 (1.05–1.08) | 1.34 (1.28) | |||||
| 0.008 (0.003) | 1.06 (1.03) | 52,365/398,241 | 1.01 (1.00, 1.02) | 0.18 | 1.11 (1.00) | 25,715/398,241 | 1.02 (1.00, 1.03) | 0.018 | 1.16 (1.00) | 41,783/398,241 | 1.00 (0.99–1.01) | 0.56 | 1.00 (1.00) | ||
| 0.034 (0.004) | 1.14 (1.12) | 52,365/398,241 | 1.03 (1.01, 1.04) | 1.21 (1.11) | 25,715/398,241 | 1.05 (1.03, 1.07) | 1.28 (1.21) | 41,783/398,241 | 1.02 (1.00–1.03) | 0.010 | 1.16 (1.00) | ||||
| 0.046 (0.004) | 1.16 (1.15) | 52,365/398,241 | 1.05 (1.04, 1.06) | 1.28 (1.24) | 25,715/398,241 | 1.06 (1.05, 1.08) | 1.31 (1.28) | 41,783/398,241 | 1.04 (1.03–1.06) | 1.24 (1.21) | |||||
| 0.044 (0.004) | 1.16 (1.14) | 52,365/398,241 | 1.05 (1.03, 1.06) | 1.28 (1.21) | 25,715/398,241 | 1.08 (1.06, 1.09) | 1.37 (1.31) | 41,783/398,241 | 1.03 (1.02–1.05) | 1.21 (1.16) | |||||
| Air pollution indexb | Coefficients (SE) | -Value | E-value (CI) | OR (95% CI) | -Value | E-value (CI) | OR (95% CI) | p-value | E-value (CI) | Odds ratio (95% CI) | p-value | E-value (CI) | |||
|---|---|---|---|---|---|---|---|---|---|---|---|---|---|---|---|
| Continuous | 0.046 (0.004) | 1.16 (1.15) | 52,365/398,241 | 1.05 (1.04, 1.06) | 1.28 (1.24) | 25,715/398,241 | 1.07 (1.06, 1.09) | 1.34 (1.31) | 41,783/398,241 | 1.05 (1.04–1.06) | 1.28 (1.24) | ||||
| Q1 | Ref | — | — | 8,098/79,649 | Ref | — | — | 3,581/79,649 | Ref | — | — | 6,492/79,649 | Ref | — | — |
| Q2 | 0.024 (0.010) | 0.024 | 1.10 (1.05) | 9,188/79,647 | 1.04 (1.00, 1.08) | 0.034 | 1.24 (1.00) | 4,221/79,647 | 1.04 (0.99, 1.09) | 0.12 | 1.24 (1.00) | 7,392/79,647 | 1.04 (1.00–1.08) | 0.042 | 1.24 (1.00) |
| Q3 | 0.067 (0.011) | 1.20 (1.16) | 10,335/79,648 | 1.11 (1.07, 1.14) | 1.46 (1.34) | 4,981/79,648 | 1.14 (1.09, 1.20) | 1.54 (1.40) | 8,253/79,648 | 1.09 (1.05–1.13) | 1.40 (1.28) | ||||
| Q4 | 0.089 (0.011) | 1.24 (1.20) | 11,584/79,649 | 1.15 (1.11, 1.19) | 1.57 (1.46) | 5,829/79,649 | 1.19 (1.13, 1.25) | 1.67 (1.51) | 9,249/79,649 | 1.13 (1.09–1.18) | 1.61 (1.40) | ||||
| Q5 | 0.127 (0.011) | 1.30 (1.27) | 13,160/79,648 | 1.16 (1.12, 1.20) | 1.59 (1.49) | 7,103/79,648 | 1.24 (1.18, 1.30) | 1.79 (1.64) | 10,397/79,648 | 1.14 (1.10–1.19) | 1.54 (1.43) |
Note: Associations of air pollution with PHQ-4 score were tested with mixed-effect linear regression models and associations with the odds of mental disorders, depression, and anxiety at baseline were tested with logistic regression models. Model adjusted for age, sex, BMI, race (White, Black, Asian, and other), smoking status (current/former/never), healthy alcohol intake status (male: ; female: ), healthy physical activity status [ moderate or vigorous or 150 min/week mixed () activity], years of education (), , FVC, Townsend deprivation index, live in urban area (yes/no), and prevalent hypertension, CHD, and diabetes (yes/no). The examination center was controlled for as a random effect. Estimates were reported by one IQR increase in each air pollutant. IQRs of , , , , . —, no data; BMI, body mass index; CHD, coronary heart disease; CI, confidence interval; FVC, forced vital capacity; IQR, interquartile range; , nitrogen dioxide; , nitrogen oxides; OR, odds ratio; PHQ-4, Patient Health Questionnaire-4 questionnaire; , particulate matter with diameters ; , particulate matter with diameters ; , particulate matter diameter of ; Q1–Q5, first to fifth quintiles; Ref, reference; SE, standard error.
Mental disorders, with depression and/or anxiety, based on PHQ-4 questionnaires and hospital records.
To estimate the joint effect of multiple air pollutants on each outcome, an air pollution index was estimated using the coefficients of , , , , and for the odds of mental disorders retrieved from the crude logistic model which adjusted for age and sex only.
Figure 1.
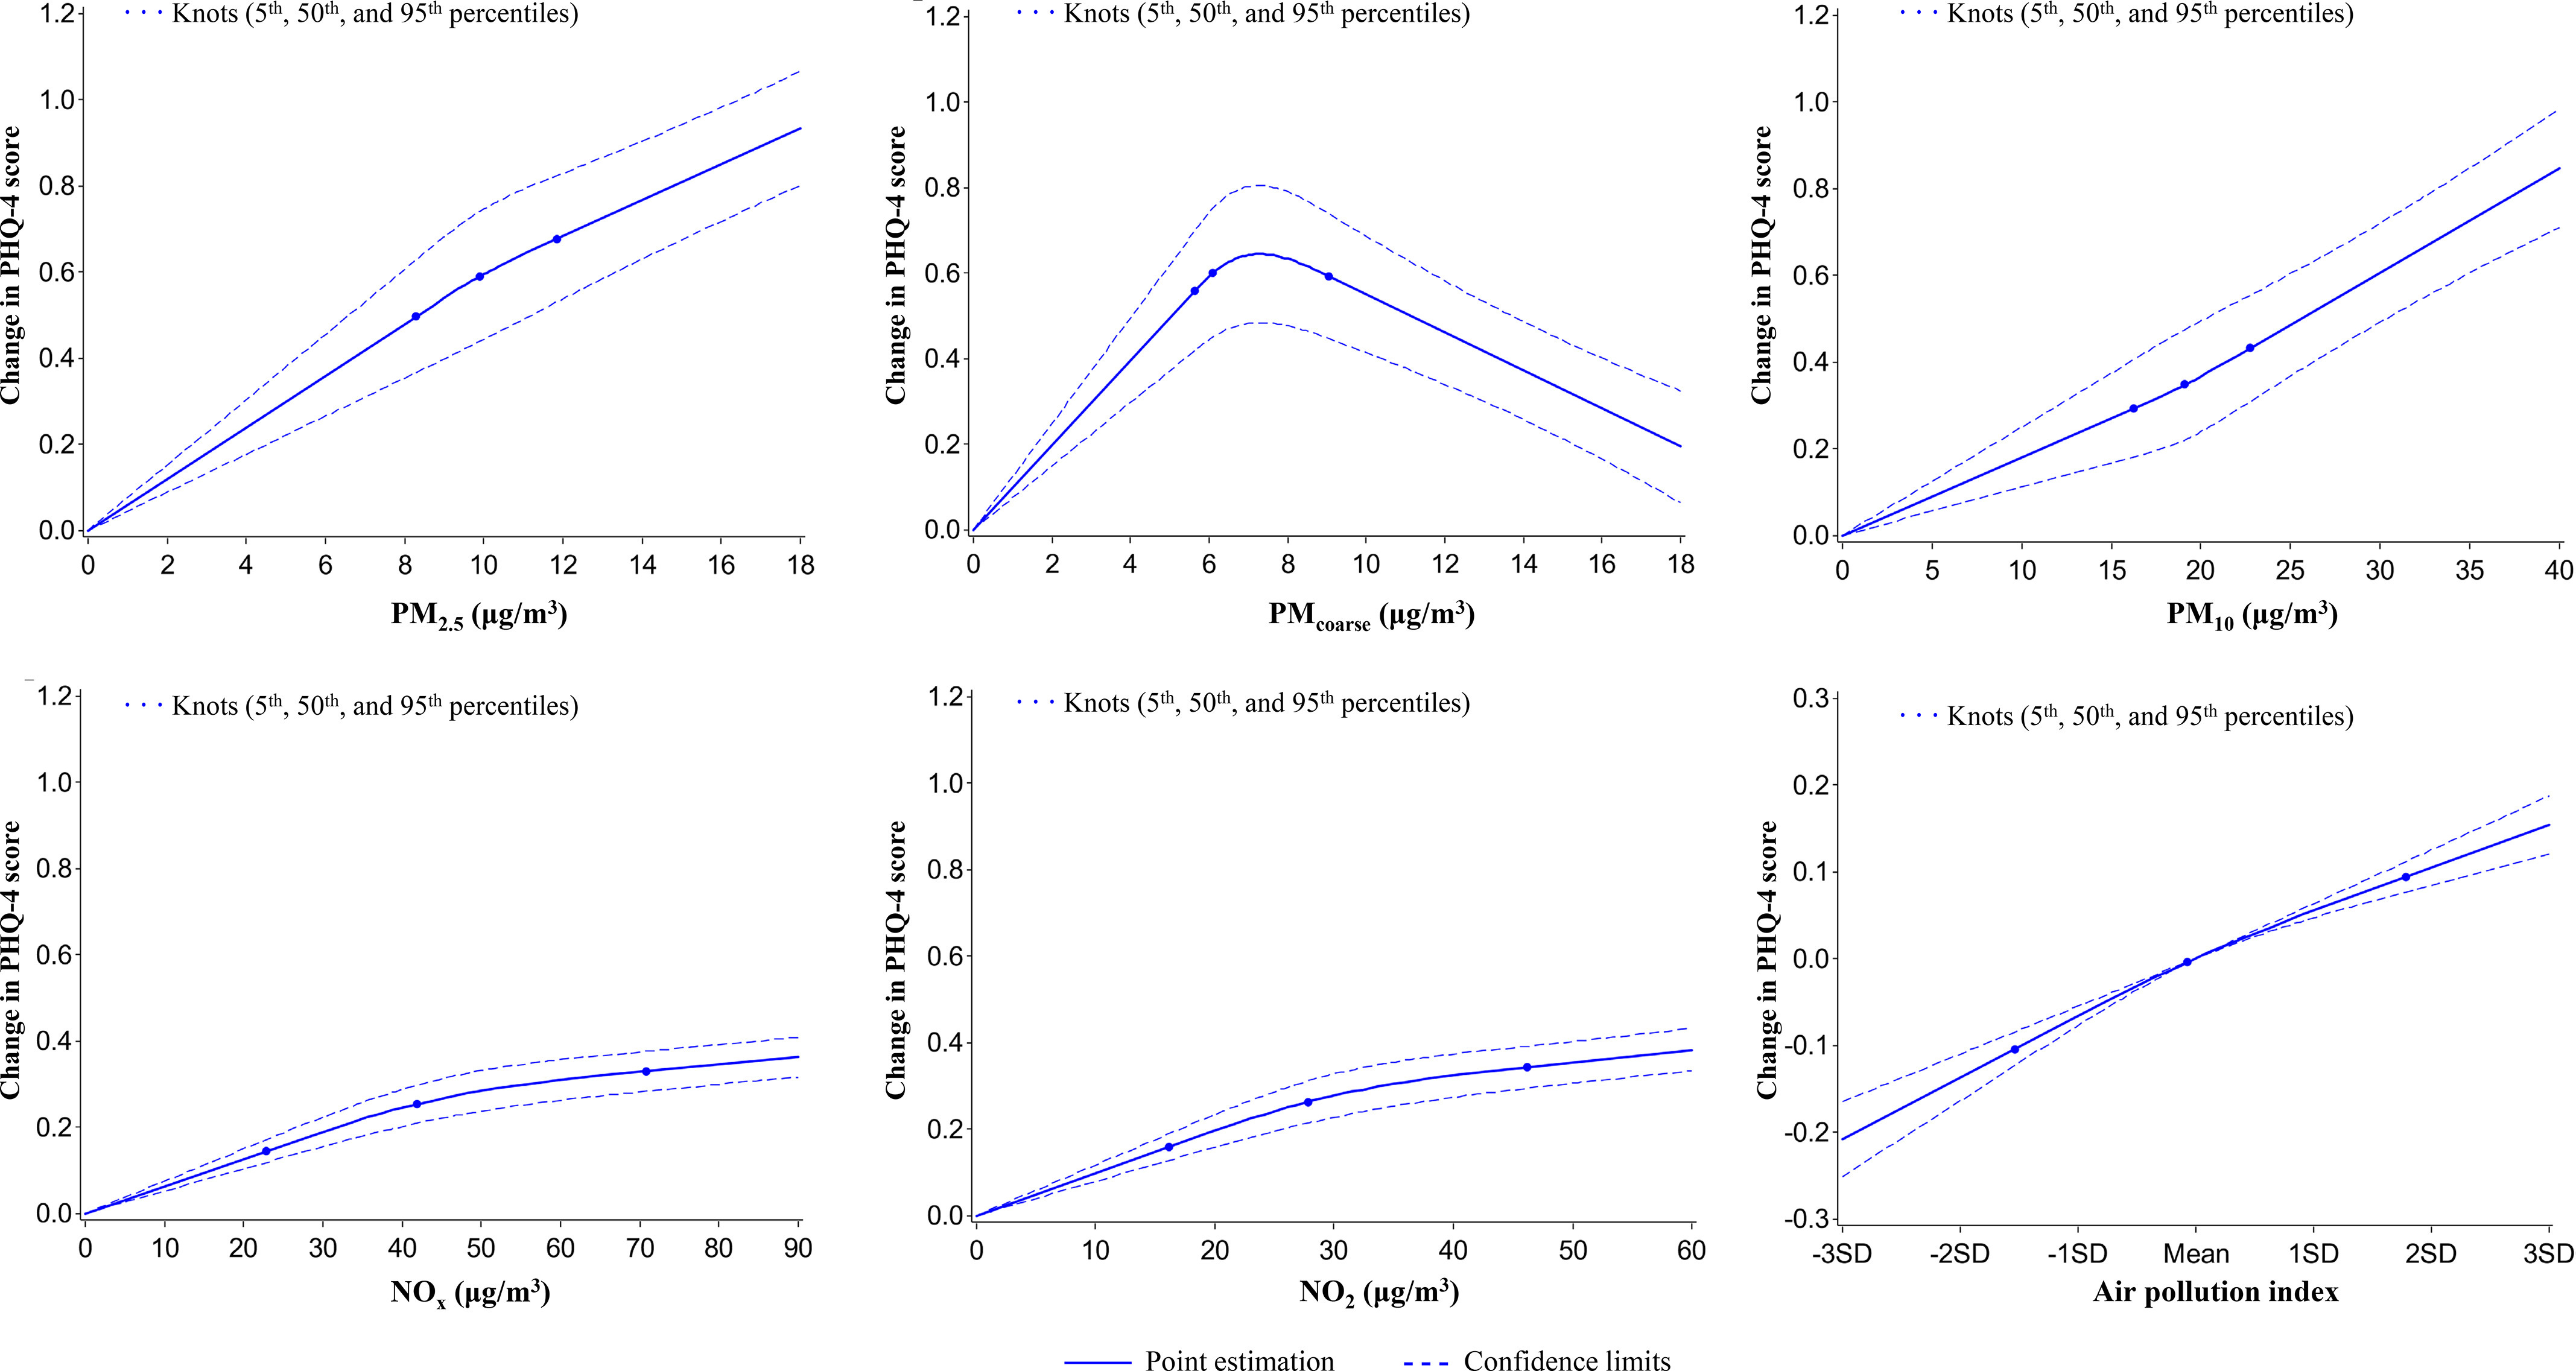
Graphs of the best fitting models for relationships of air pollutants and air pollution index with PHQ-4 score for 398,241 participants at baseline. Solid line: Point estimation; Dash line: Confidence limits; Dots: Knots (5th, 50th, and 95th percentiles). The restricted cubic spline regression model adjusted for age, sex, BMI, race (White, Black, Asian, and other), smoking status (current/former/never), healthy alcohol intake status (male: ; female: ), healthy physical activity status [ moderate or vigorous or 150 min/wk mixed () activity], years of education ( y), , FVC, Townsend deprivation index, live in urban area (yes/no), and prevalent hypertension, CHD, and diabetes (yes/no). Point estimates and corresponding confidence intervals were shown in Table S10. Note: BMI, body mass index; CHD, coronary heart disease; , forced expiratory volume in 1 second; FVC, forced vital capacity; min, minutes; ; ; ; ; ; .
A subset of 128,456 participants took the 7-y online mental health survey; therefore, we examined the prospective associations of ambient air pollution with the odds of mental disorders and symptoms of depression and anxiety at the 7-y survey. Figure 2 (Table S3) shows that baseline , , , and were positively associated with most depression and anxiety symptoms, odds of mental disorders, and the scores (total, PHQ-9, and GAD-7 scores) of mental health status at the 7-y survey. The baseline concentration of was not associated with any symptoms or scores. This finding suggests that long-term exposure to , , , and was associated with the prevalence of mental disorders.
Figure 2.
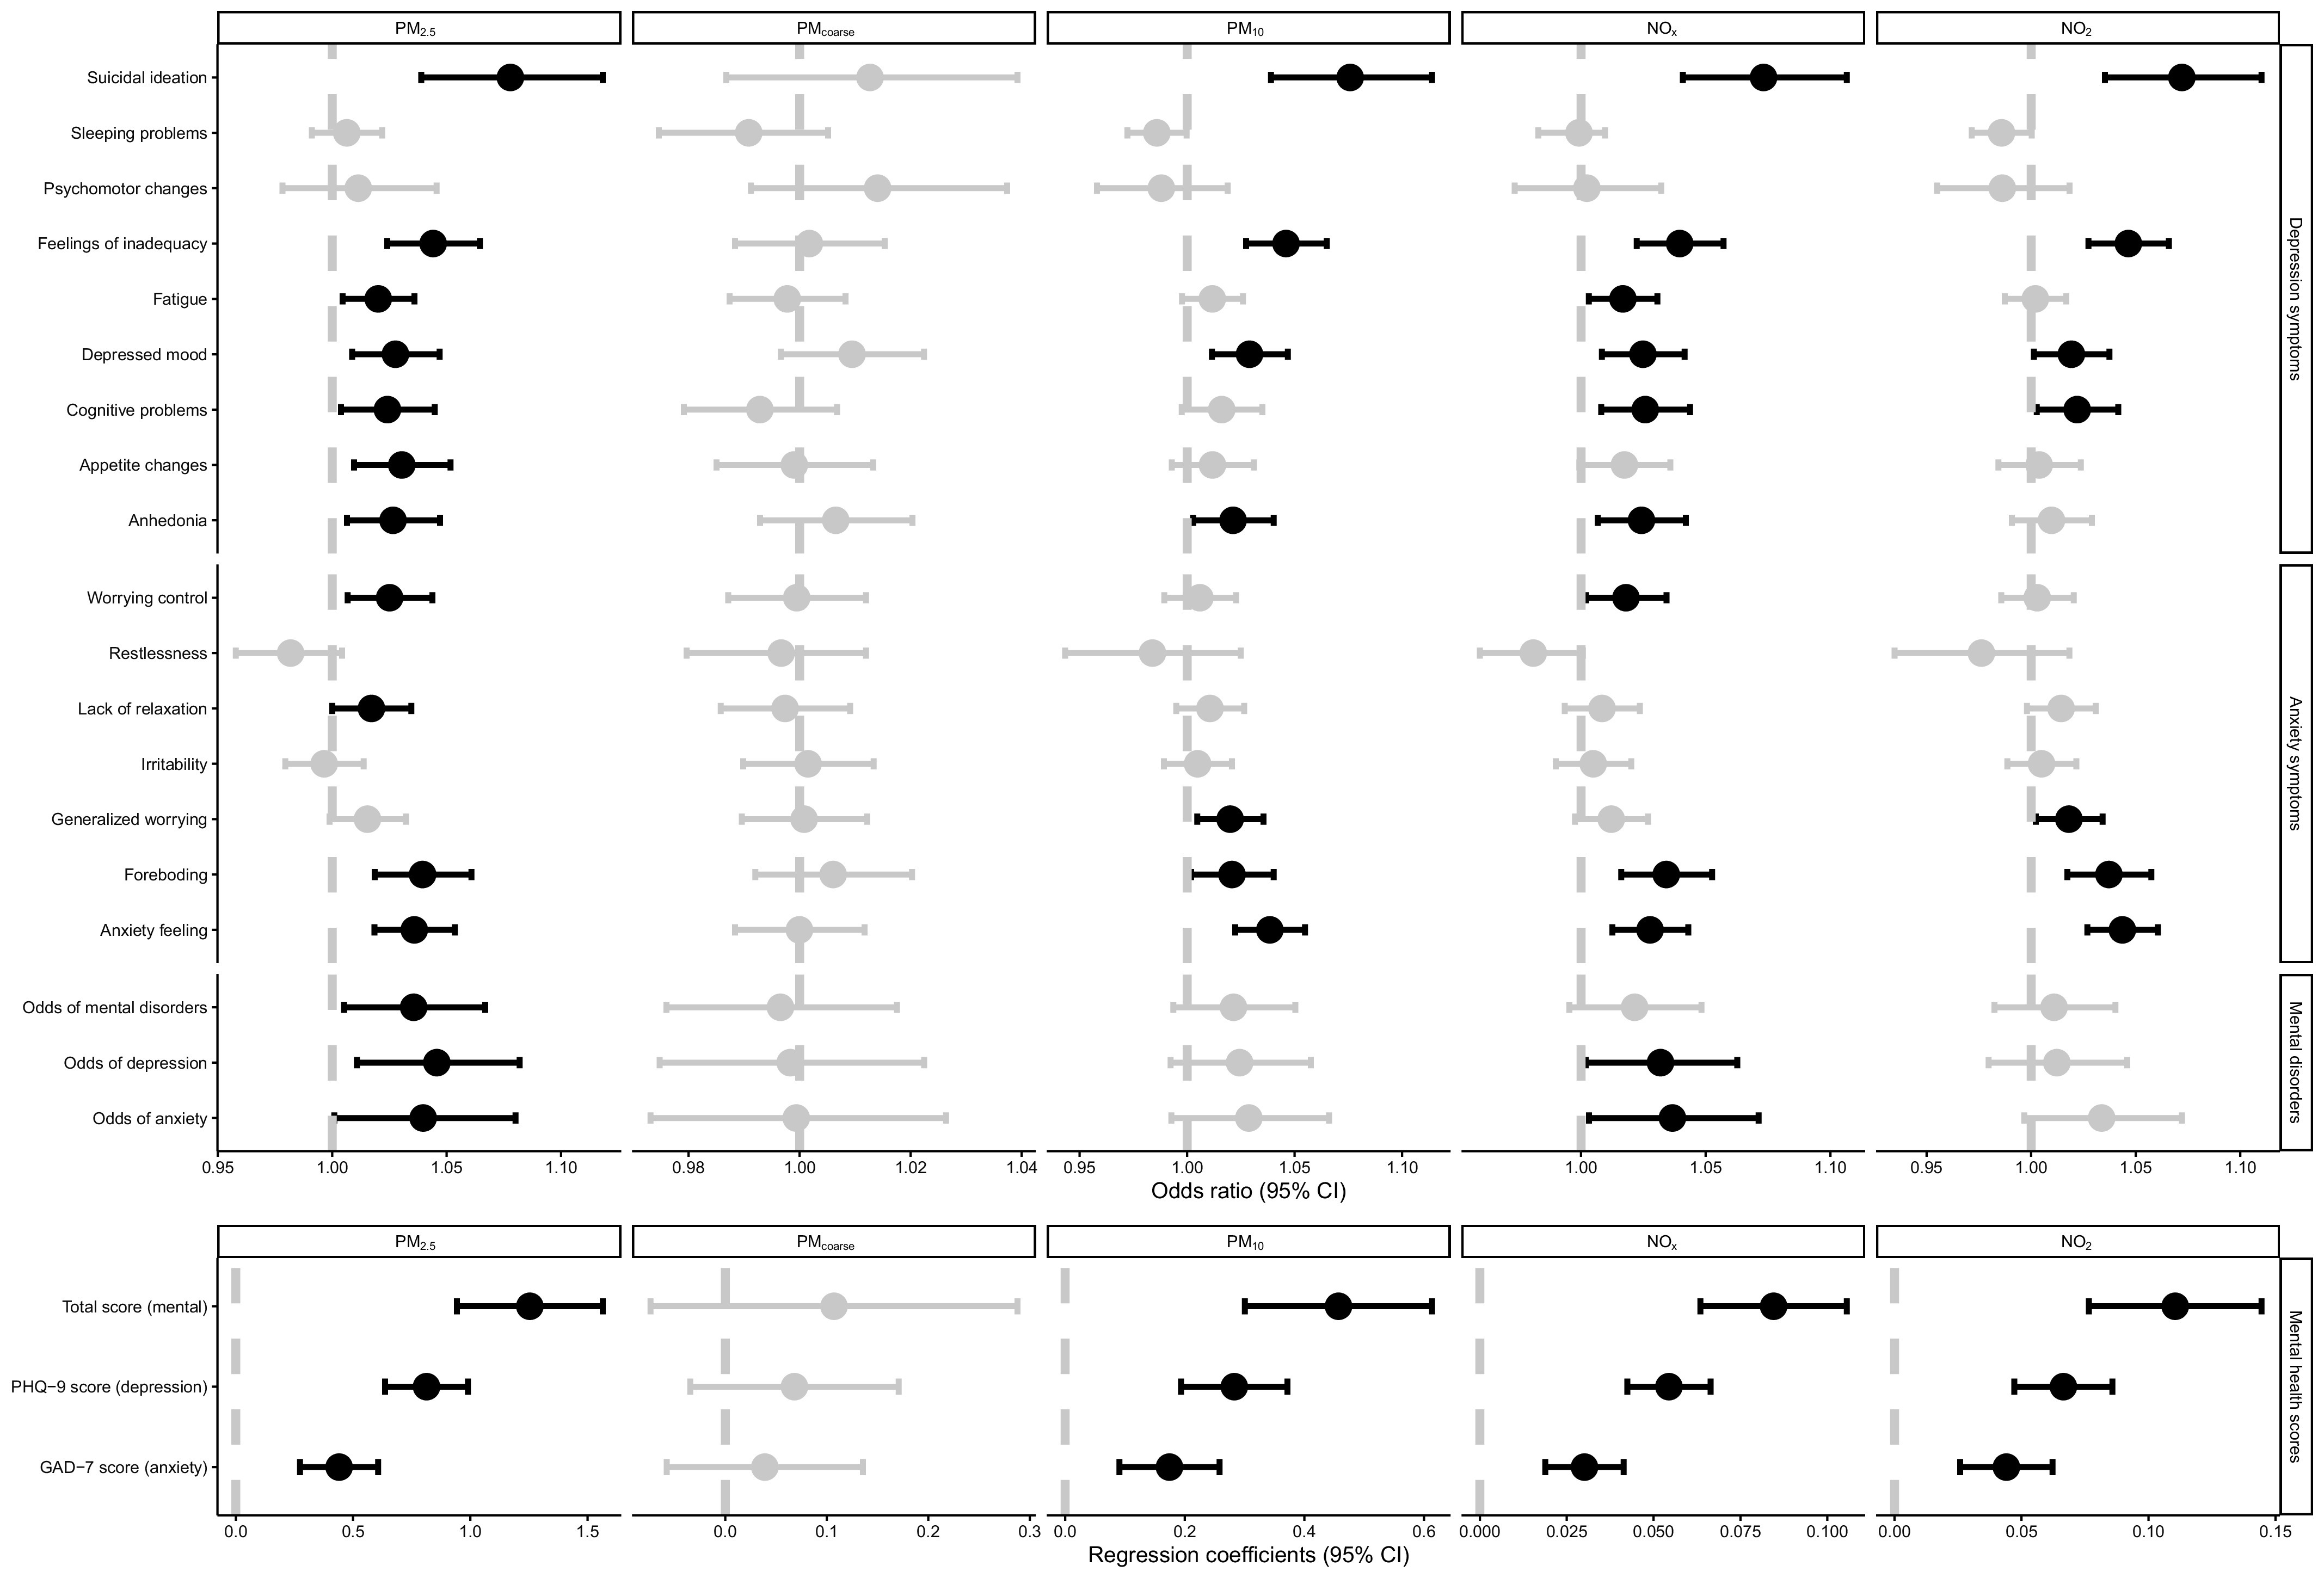
Prospective associations of baseline levels of air pollutants with odds of mental disorders and mental health scores at 7-y survey for the 128,456 participants with available data. Dots: Point estimate; Error bar: 95% confidence limits; Dash line: Reference line. Upper part is the odds ratios of logistic regression; lower part is the coefficients of linear regression. Dots and error bars colored in black are statistically significant, otherwise are colored in gray. Associations of air pollution with mental health scores were tested with mixed-effect linear regression models and associations with the odds of mental disorders, depression, and anxiety at 7-y survey were tested with logistic regression models. Point estimates and corresponding confidence intervals were shown in Table S3. Models adjusted for age, sex, BMI, race (White, Black, Asian, and other), smoking status (current/former/never), healthy alcohol intake status (male: ; female: ), healthy physical activity status ( moderate or vigorous or 150 min/wk mixed [() activity], years of education (), , FVC, Townsend deprivation index, live in urban area (yes/no), and prevalent hypertension, CHD, diabetes (yes/no), and PHQ-4 score at baseline. The examination center was controlled for as a random effect. Note: BMI, body mass index; CHD, coronary heart disease; CI, confidence interval; , forced expiratory volume in 1 second; FVC, forced vital capacity; min, minutes; GAD-7, General Anxiety Disorder-7; min, minutes; ; ; PHQ-4, Patient Health Questionnaire-4 questionnaire; PHQ-9, Patient Health Questionnaire-9 questionnaire; ; ; .
Associations of Air Pollution with the Incidence of Mental Disorders
The fully adjusted Cox regression model showed the associations of baseline air pollution levels with the incidence of mental disorders for the 345,876 participants free of mental disorders at baseline during a median follow-up of 8.7 y (Table 5). and showed strong associations with the risk of incident mental disorders. An IQR increment of level at baseline was associated with 6% higher risk of mental disorders (95% CI: 1.04, 1.08), 5% higher risk of depression (95% CI: 1.02, 1.07), 7% higher risk of anxiety (95% CI: 1.04, 1.10). An IQR increase in was associated with similar risks of mental disorders and each disorder but was associated with relatively lower risks with respect to and . level was not associated with any of the health outcomes. The air pollution index was positively associated with the risk of mental disorders. For instance, HRs (95% CI) of the risk of mental disorders were 1.06 (95% CI: 1.00, 1.12), 1.07 (95% CI: 1.01, 1.13), 1.10 (95% CI: 1.04, 1.16), and 1.11 (95% CI: 1.05, 1.18) for second–fifth quintiles, respectively, in comparison with the lowest quintile of the air pollution index (Table 5). Dose–response relationships between the air pollution index and the risk of mental disorders demonstrated monotonically increasing patterns (Figure 3).
Table 5.
Associations of baseline levels of air pollutants and air pollution index with incident mental disorders for 345,876 participants free of mental disorders over a median 8.7 y of follow-up.
| Incident mental disordersa | Incident depression | Incident anxiety | ||||||||||
|---|---|---|---|---|---|---|---|---|---|---|---|---|
| Air pollutants | Hazard ratio (95% CI) |
-Value | E-value (CI) | Hazard ratio (95% CI) |
-Value | E-Value (CI) |
Hazard ratio (95% CI) |
p-value | E-value (CI) |
|||
| 16,185/345,876 | 1.03 (1.01, 1.05) | 0.015 | 1.21 (1.11) | 10,854/345,876 | 1.01 (1.00, 1.04) | 0.047 | 1.11 (1.00) | 8,257/345,876 | 1.03 (1.00–1.06) | 0.031 | 1.21 (1.00) | |
| 16,185/345,876 | 0.99 (0.98, 1.01) | 0.53 | 1.11 (1.00) | 10,854/345,876 | 0.99 (0.98, 1.01) | 0.40 | 1.11 (1.00) | 8,257/345,876 | 1.00 (0.98–1.02) | 0.78 | 1.00 (1.00) | |
| 16,185/345,876 | 1.06 (1.04, 1.08) | 1.31 (1.24) | 10,854/345,876 | 1.05 (1.02, 1.07) | 0.0009 | 1.28 (1.17) | 8,257/345,876 | 1.07 (1.04–1.10) | 1.34 (1.24) | |||
| 16,185/345,876 | 1.03 (1.01, 1.05) | 0.0010 | 1.21 (1.11) | 10,854/345,876 | 1.03 (1.00, 1.05) | 0.031 | 1.21 (1.00) | 8,257/345,876 | 1.04 (1.01–1.06) | 0.0047 | 1.24 (1.11) | |
| 16,185/345,876 | 1.06 (1.04, 1.09) | 1.31 (1.24) | 10,854/345,876 | 1.05 (1.02, 1.08) | 0.0002 | 1.28 (1.16) | 8,257/345,876 | 1.07 (1.04–1.10) | 1.34 (1.24) | |||
| Air pollution indexb |
Hazard ratio (95% CI) |
-Value | E-value (CI) | Hazard ratio (95% CI) |
-Value | E-value (CI) |
Hazard ratio (95% CI) |
p-value | E-value (CI) |
|||
|---|---|---|---|---|---|---|---|---|---|---|---|---|
| Continuous | 16,185/345,876 | 1.04 (1.03, 1.06) | 1.24 (1.21) | 10,854/345,876 | 1.03 (1.01, 1.06) | 0.0030 | 1.21 (1.11) | 8,257/345,876 | 1.05 (1.03–1.08) | 1.28 (1.21) | ||
| Q1 | 2,868/69,175 | Ref | — | — | 1,900/69,175 | Ref | — | — | 1,477/69,175 | Ref | — | — |
| Q2 | 3,218/69,175 | 1.06 (1.00, 1.12) | 0.046 | 1.31 (1.00) | 2,134/69,175 | 1.05 (0.98, 1.12) | 0.14 | 1.28 (1.00) | 1,659/69,175 | 1.07 (0.99–1.16) | 0.07 | 1.34 (1.00) |
| Q3 | 3,243/69,176 | 1.07 (1.01, 1.13) | 0.016 | 1.34 (1.11) | 2,178/69,176 | 1.06 (1.00, 1.13) | 0.09 | 1.31 (1.00) | 1,651/69,176 | 1.08 (1.00–1.16) | 0.05 | 1.37 (1.00) |
| Q4 | 3,384/69,175 | 1.10 (1.04, 1.16) | 0.0005 | 1.43 (1.24) | 2,315/69,175 | 1.07 (1.00, 1.14) | 0.046 | 1.34 (1.00) | 1,707/69,175 | 1.12 (1.04–1.21) | 0.004 | 1.49 (1.24) |
| Q5 | 3,472/69,175 | 1.11 (1.05, 1.18) | 0.0002 | 1.46 (1.28) | 2,327/69,175 | 1.10 (1.03, 1.17) | 0.0067 | 1.43 (1.21) | 1,763/69,175 | 1.15 (1.06–1.24) | 0.0009 | 1.57 (1.31) |
Note: Associations of air pollution with the incident mental disorders, depression, and anxiety during the follow-up were tested with Cox proportional hazards models. Model adjusted for age, sex, BMI, race (White, Black, Asian, and other), smoking status (current/former/never), healthy alcohol intake status (male: ; female: ), healthy physical activity status [ min/wk moderate or min/wk vigorous or 150 min/wk mixed () activity], years of education (), , FVC, Townsend deprivation index, live in urban area (yes/no), and prevalent hypertension, CHD, and diabetes (yes/no). The examination center was controlled for as a random effect. Estimates were reported by one IQR increase in each air pollutant. IQRs of , , , , and . —, no data; BMI, body mass index; CHD, coronary heart disease; CI, confidence interval; IQR, interquartile range; , nitrogen dioxide; , nitrogen oxides; PHQ-4, Patient Health Questionnaire-4 questionnaire; , fine particles with diameters of ; , particulate matter with diameters of ; , particulate matter with diameters ; ; Ref, reference; SE, standard error.
Incident mental disorders, with incident depression and/or anxiety based on 7-y mental health survey and hospital records.
To estimate the joint effect of multiple air pollutants on each outcome, an air pollution index was estimated based on all the coefficients of , , , and for incident mental disorders retrieved from the crude Cox models adjusting for age and sex only.
Figure 3.
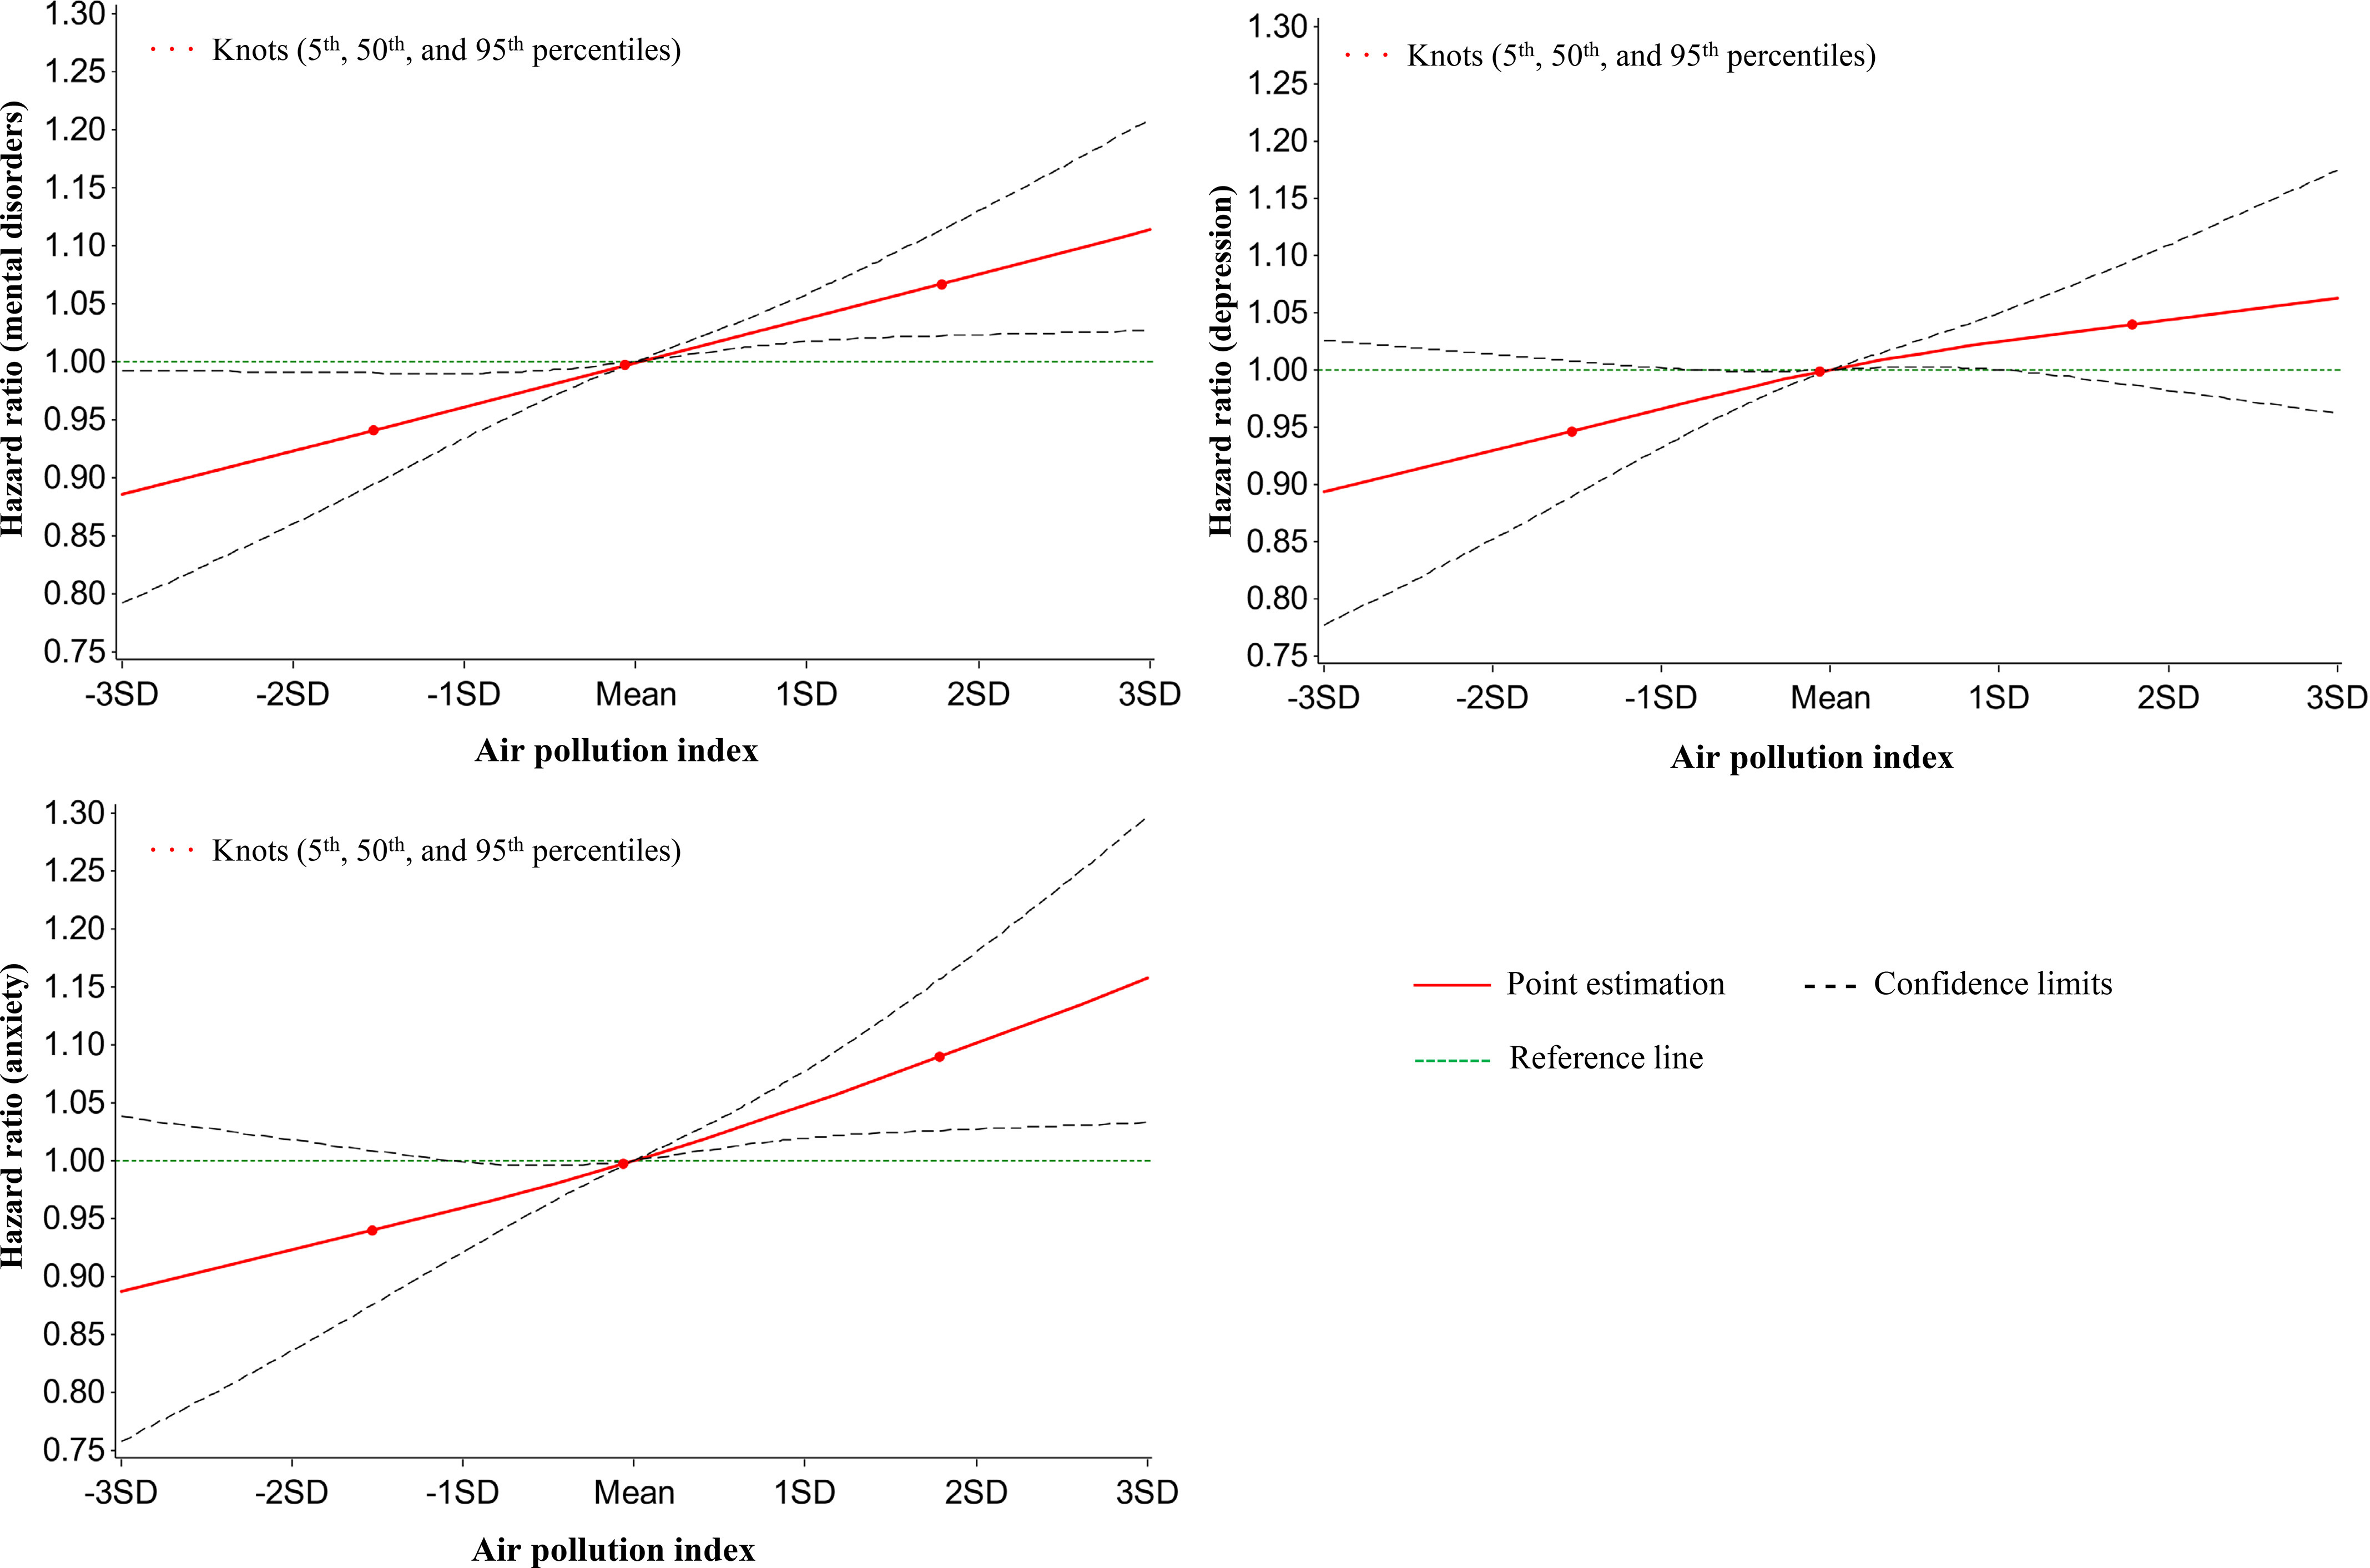
Graphs of the best fitting models for relationships between air pollution index at baseline and incident mental disorders at follow-up for 345,876 mental disorder-free participants. Solid line: Point estimation; Black dash line: Confidence limits; Green dash line: Reference line; Dots: Knots (5th, 50th, and 95th percentiles). The restricted cubic spline regression model adjusted for age, sex, BMI, race (White, Black, Asian, and other), smoking status (current/former/never), healthy alcohol intake status (male: ; female: ), healthy physical activity status [ moderate or vigorous or 150 min/wk mixed () activity], years of education (), , FVC, Townsend deprivation index, live in urban area (yes/no), and prevalent hypertension, CHD, and diabetes (yes/no). Point estimates and corresponding confidence intervals were shown in Table S11. Note: BMI, body mass index; CHD, coronary heart disease; CI, confidence interval; , forced expiratory volume in 1 second; FVC, forced vital capacity; min, minutes; ; ; ; ; ; SD, standard deviation.
Sensitivity Analyses
In the model that simultaneously included the four pollutants (except ), and remained associated with incident mental disorders, whereas became null () and demonstrated attenuated estimates (Table S4). Furthermore, considering that depression or anxiety may exacerbate mental health impairment and thus cause the other, we assessed the association of air pollution with concomitant depression and anxiety at follow-up. A total of 2,926 participants had both incident depression and anxiety during the follow-up. (; 95% CI: 1.00, 1.04, ), . (; 95% CI: 1.01, 1.09, ), (; 95% CI: 1.01, 1.07, ), and . (; 95% CI: 1.01, 1.10, ) were statistically associated with the concomitant incidence, and the highest quintile of the air pollution index was associated with a 13% higher risk of the concomitant incidence than the lowest but was not significant (Table S5, , 95% CI: 1.00, 1.28). Another sensitivity analysis of the 321,090 participants living at the address for more than 5 y also demonstrated robust associations of the air pollution index with prevalent mental disorders (; 95% CI: 1.04, 1.07, ) and the incidence of mental disorders (; 95% CI: 1.01, 1.06, ), which suggests that the mobility of participants may affect our main findings minimally (Table S6).
Impact of Genetic Susceptibility on the Associations between Air Pollution and Mental Disorders
We tested whether the genetic background could modify the associations between air pollution and mental disorders. The GRS we generated was associated with the PHQ-4 score (, ), odds of mental disorders at baseline (; 95% CI: 1.02, 1.04), and the incident mental disorders during the follow-up (; 95% CI: 1.02, 1.06) (Table S7). However, the interaction between GRS and the air pollution index was not significantly associated with prevalence of mental disorders at baseline (, , ) or their incidence (, , ) during the follow-up. We also noted that estimates of the air pollution index were essentially unchanged in mutual adjustment models (Table S8). These findings suggested that both the GRS and air pollution index could be independently associated with the prevalence and risk of mental disorders.
Given that no interaction was observed, we tested the joint effect of both air pollution and genetic susceptibility using the quintiles of air pollution index and the dichotomized GRS. We observed that participants with higher GRS and air pollution index had higher odds of mental disorders and risk of mental disorders (Figure 4; Table S9). Participants with higher GRS and the fifth quintile of air pollution index had higher odds of mental disorders at baseline (; 95% CI: 1.15, 1.26) and about 15% greater risk of incident mental disorders during the follow-up (; 95% CI: 1.06, 1.23) than participants with the low GRS and first quintile of the air pollution index.
Figure 4.
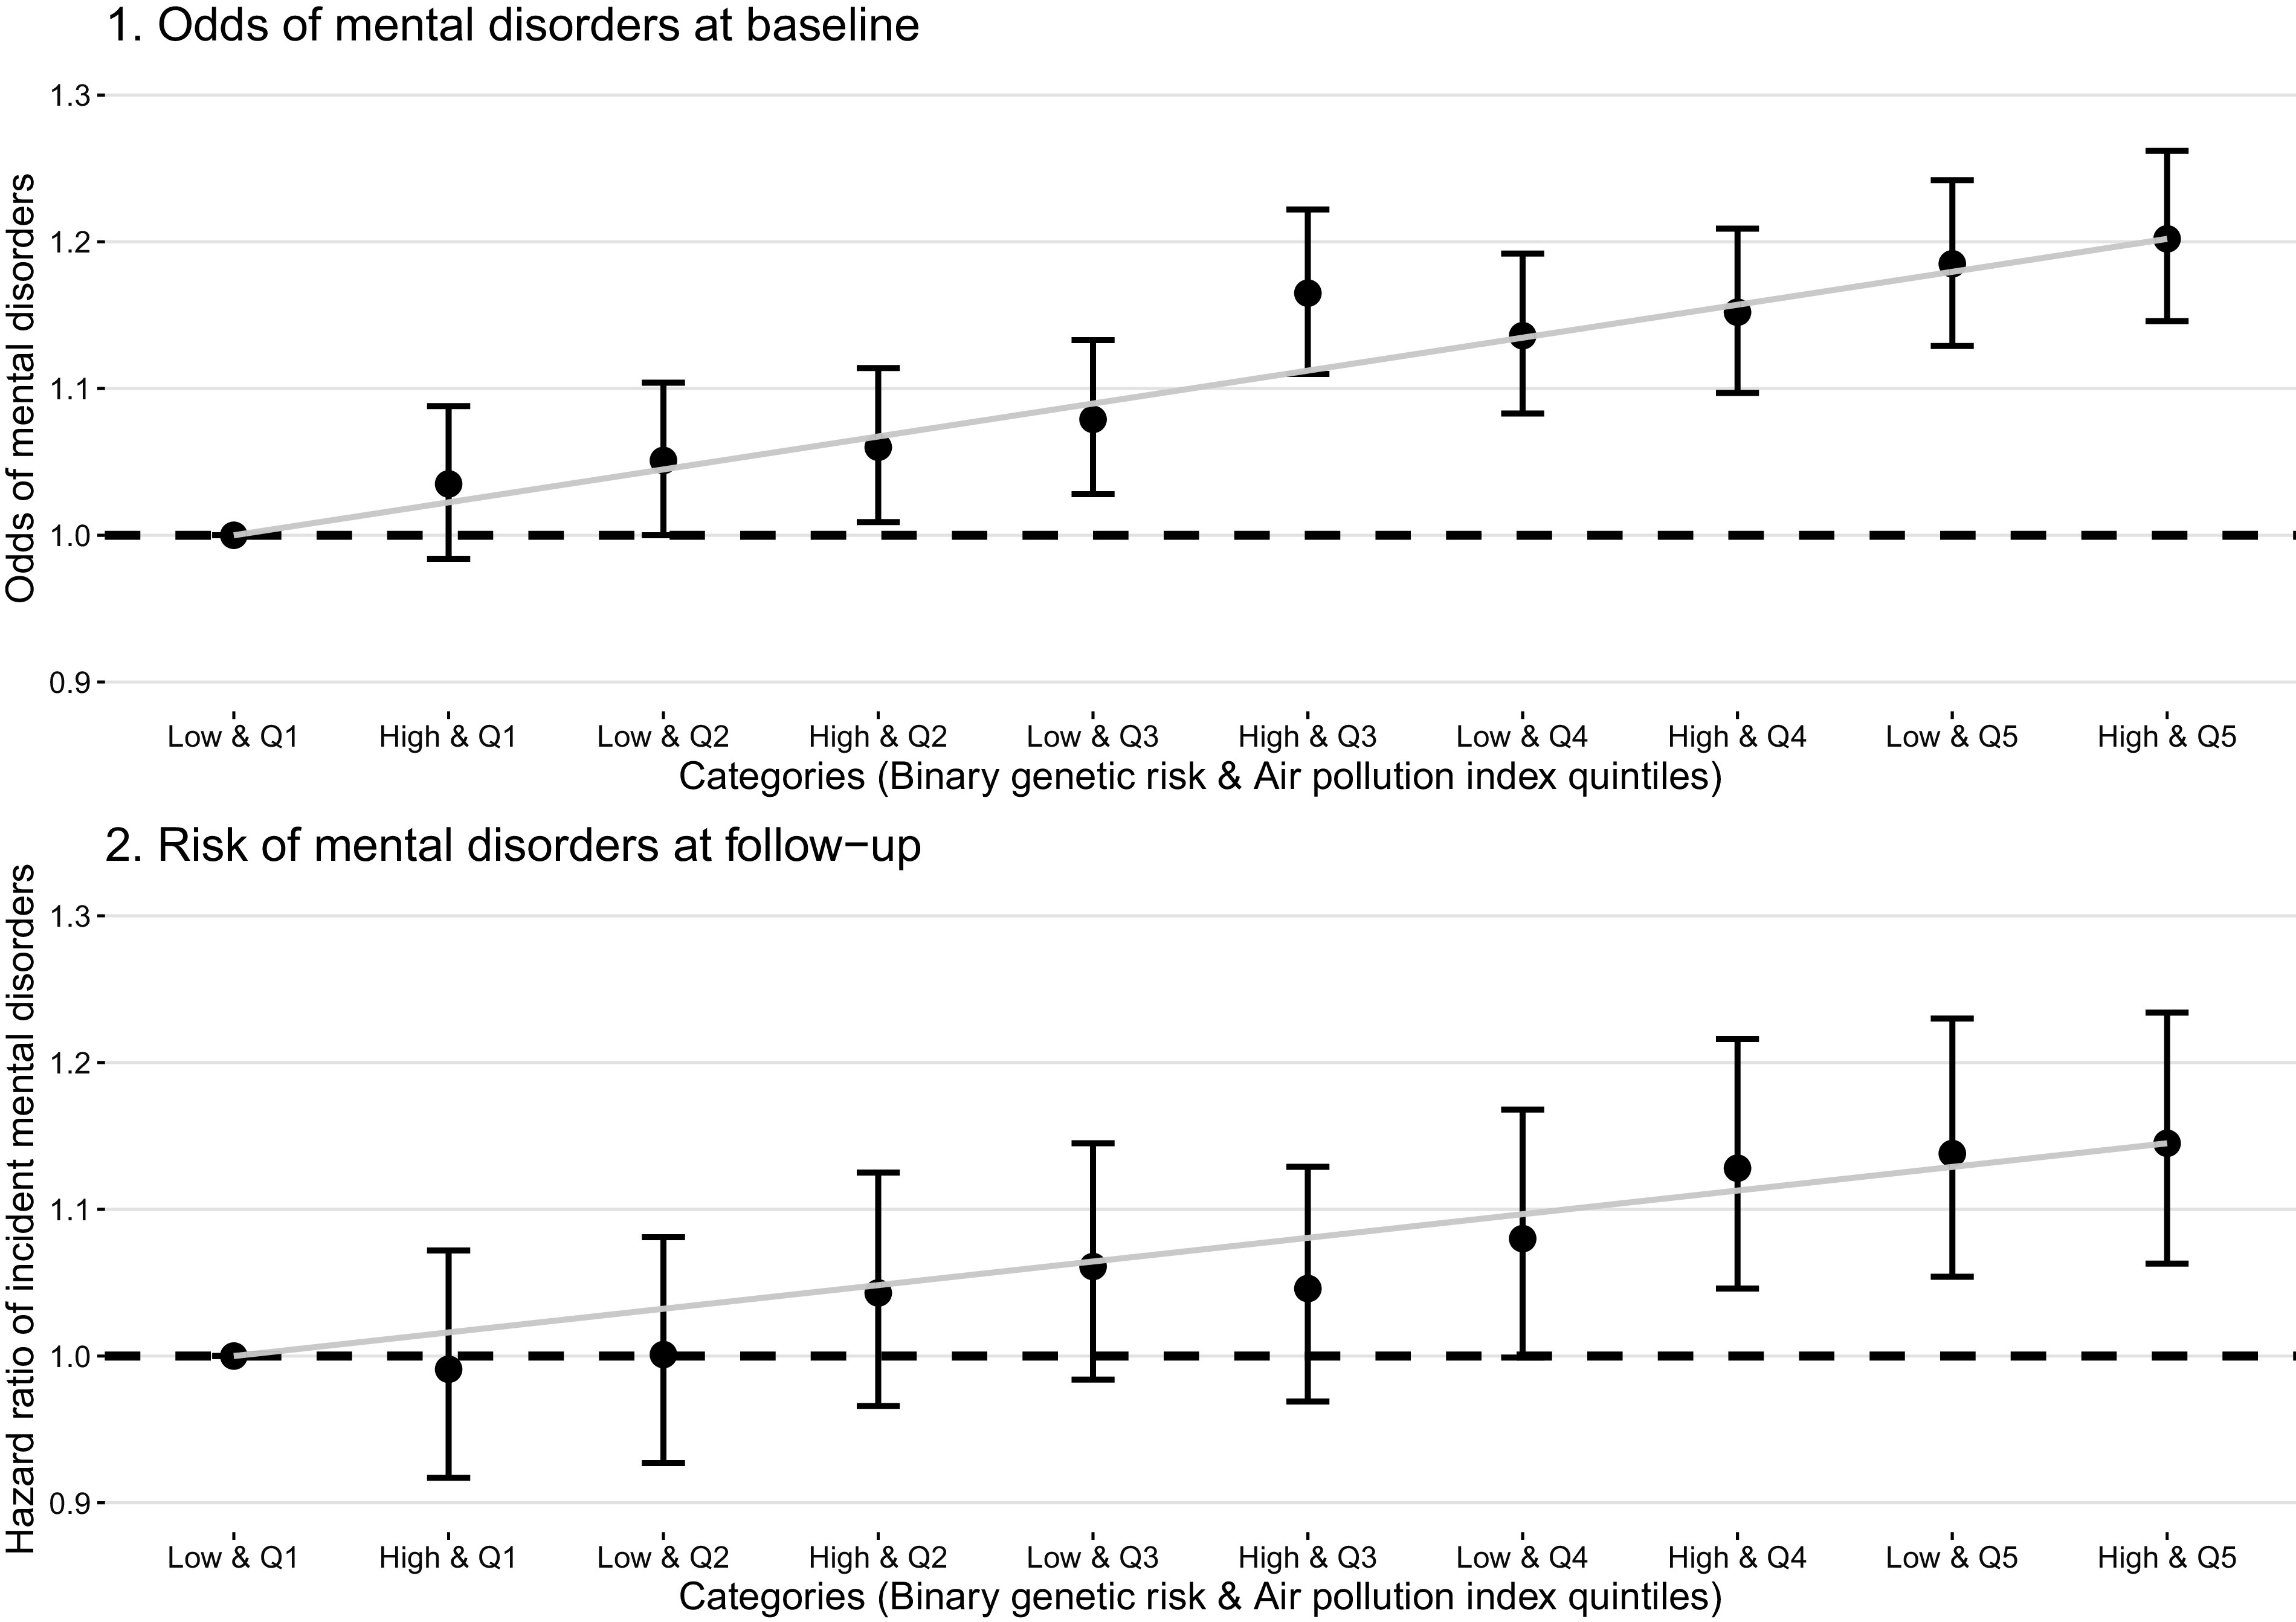
Joint associations of genetic risk and air pollution levels on the odds of mental disorders for total 398,241 participants and at baseline and incident mental disorders for 345,876 mental disorder-free participants at follow-up. Dots: Point estimate; Error bar: 95% confidence limits; Dash line: Reference line. Associations of air pollution with the odds of mental disorders, depression, and anxiety at baseline were tested with logistic regression models, and associations with the incident mental disorders, depression, and anxiety during the follow-up were tested with Cox proportional hazards models. Models adjusted age, sex, BMI, race (White, Black, Asian, and other), smoking status (current/former/never), healthy alcohol intake status (male: ; female: ), healthy physical activity status [ moderate or vigorous or 150 min/wk mixed () activity], years of education (), , FVC, Townsend deprivation index, live in urban area (yes/no), and prevalent hypertension, CHD, and diabetes (yes/no). The examination center was controlled for as a random effect. Point estimates and corresponding confidence intervals were shown in Table S9. Note: BMI, body mass index; CHD, coronary heart disease; , forced expiratory volume in 1 second; FVC, forced vital capacity; min, minutes; High, high genetic risk score; Low, low genetic risk score; Q1–Q5, air pollution index quintiles 1st–5th.
Discussion
In this prospective study using the UK Biobank cohort, we elucidated the individual and joint associations of five major air pollutants with depression and anxiety, the two most common mental disorders. We identified that baseline exposures to , , , and were not only associated with the prevalent mental disorders at baseline but were also associated with the risk of mental disorders during a median follow-up of 8.7 y. Combined exposure of the four pollutants represented by an air pollution index was robustly associated with elevated risks of incident mental disorders, depression, and anxiety during the follow-up separately. For the results of primary analyses demonstrated in Table 4 and Table 5, the relatively large E-values indicate that they were robust. We found that such adverse effects of air pollution could be enhanced by the genetic susceptibility to mental disorders despite the fact that no robust interaction between the air pollution index and the GRS was observed.
To the best of our knowledge, this work is the one of the largest population-based cohort studies that provides evidence on the association between air pollution and mental disorders, especially among older adults. Our study suggests that an IQR increase in long-term exposure to was associated with more than 8% increases in the odds of depression at baseline and 1% increases in its risks. The IQR of was in our study, which is higher than the findings of a systematic review and meta-analysis by Braithwaite et al. reporting 10% higher pooled odds of depression per .8 A potential explanation is the approaches to access depression of the selected publications in this review; we noted that the majority of studies used data of self-reported medical records and/or emergency visits, which only captured the information of severe or intense depression, because individuals with light or moderate depression syndromes may ignore their mental status and may not visit doctors. Moreover, the yielded risk of incident depression in our participants free of mental disorders at baseline could be ∼8% per increment in level, which was much lower than the findings of Liu et al.’s meta-analysis (18%).5 This difference could be explained by the characteristics of the population of the UK Biobank, which is a volunteer cohort, and participants are likely healthier with fewer self-reported health disorders and live in less socioeconomically deprived areas than the general population.36 Both may limit the effect of air pollution on incident mental disorders because healthier participants and a better community could provide better health resilience to mitigate health risks.37 Reported associations between and depression have been similar in previous studies,24 which is in line with our findings. Furthermore, our study found relatively stronger long-term positive associations of and with depression than , which was consistent with the study of Bakolis et al. showing that and had relatively stronger associations with common mental disorders than .10 In comparison with depression, the impact of air pollution on anxiety has been much less frequently reported. Our study also reported the associations of long-term exposure not only to but also to , , and with anxiety. Except the study of Power et al., in which the authors found a positive impact of on prevalent anxiety,38 most of the small number of existing studies only explored the associations of short-term exposure to air pollutants with anxiety and yielded null findings.7
In our study, estimates of the associations of . and with mental disorders were higher than that of even in the model controlling for all pollutants simultaneously (Table S4), which is in line with previous findings10,12 and suggests that may not be the largest contributors to the development of mental disorders, though shares some sources with . Such robust effects of long-term and . exposure were in agreement with the associations of short-term exposure of with depression in a recent meta-analysis.6 was the only pollutant that demonstrated a nonlinear association with the mental health PHQ-4 score at baseline. It was not associated with the incidence of mental disorders or most depression and anxiety symptoms during the follow-up, which agrees with the previous statement on the health effects of ,39 suggesting that the health implications of remain less characterized than those for . Due to such heterogeneities of the associations between various air pollutants and mental health, we attempted to depict the combined associations of relevant air pollutants by constructing the air pollution index. It was associated with the risk of mental disorders and the comorbidity of depression and anxiety and further suggested that it could be featured as a more comprehensive measure of the effects of multiple air pollutants on mental health. A similar algorithm has been implemented in previous epidemiological studies not only including environmental exposures,21,40 but also covering lifestyle and nutrition.41 Such a simple score may make the results of epidemiological studies much easier for nonprofessionals to interpret and understand.
Biological mechanisms underlying the association between ambient air pollution exposure and mental disorder remain inconclusive. Inflammation and oxidative stress are two commonly suggested biological pathways. Neuroinflammation caused by air pollution may deplete the brain serotonin, dysregulate the hypothalamus-pituitary-adrenal axis, and interfere with the production of neurons in the dentate gyrus of the hippocampus.42 Oxidative stress further contributes to the degradation of dopaminergic neurons, which is likely involved in the neuropathology of depression and additionally intimately impairs mitochondrial function, and enhances excitotoxicity and nitric oxide toxicity.43 Moreover, neuroimaging-based epidemiological studies revealed that long-term exposure to air pollution may be associated with changes in brain structures and functioning in white matter, cortical gray matter, and basal ganglia,25 which may intensify the progression of mental disorders. Additionally, the indirect impact of air pollution on human health status, including residential dissatisfaction,44,45 poor self-perceived health and life quality,46 frailty,47 as well as increased risk of major chronic diseases, such as cardiovascular diseases, respiratory diseases, dementia, and cancers,16,48,49 may be taken into account because they could trigger the incidence of depression and anxiety by bringing increasing psychological burden, especially for older adults. A more intriguing aspect is that we found that the combined associations of major air pollutants with mental health could be moderately enhanced by a GRS based on previous established SNPs of mental disorders. A plausible explanation of the observed lack of interaction between the air pollution index and GRS could be that parts of the SNPs we used to build the GRS were related to the development of neuro systems (e.g., RBFOX1 and PTPRT) or regulation of intercellular signaling in the brain (e.g., PDE4B),50–52 which may not directly interact with neuroinflammation or oxidative stress that may result from long-term exposure to air pollution. Nevertheless, given the risk that loci of mental health may soon be revealed by emerging genome analyses in the future, other genetic variants that play critical roles in modifying the risks of mental health resulting from air pollution may be found.
Our study has several strengths, including the large sample size, the detailed and repeated measurements of mental health status, and data available on a wide range of potential covariates and genetic variants. Several limitations are worthwhile to note when interpreting the findings. First, as a volunteer cohort, participants in the UK Biobank cohort were likely healthier than the general population, which may limit the impact of air pollution, because relatively healthier participants may suffer from less psychosocial pressure. Early-life experience of mental health problems may also alter a person’s tendency to live in bad neighborhoods, which often have worse air quality.53 Future studies with more detailed records of mental health status since childhood are warranted to explore this research question. Furthermore, the measurement bias of air pollution must be acknowledged. Our air pollution data were mostly only a single measurement of the annual average outdoor air pollution level in 2010 without any further measures during the follow-up. The baseline visit of the UK Biobank was conducted from 2006 to 2010, which prohibited our further exploration on the lag or short-term ( month) effects of air pollution on depression and anxiety. Also, because people, especially older adults, spent most of their time indoors,54 individual exposure to each air pollutant may differ from that indicated by the outdoor ambient concentrations we examined. Additionally, the impacts of the components of and other major air pollutants such as ozone and sulfur dioxide on depression and anxiety are worth investigation in future studies. For the air pollution index, although it was internally validated in our study as introduced in the “Methods” section, future studies are required to use this approach in other independent cohorts. Additionally, given only about one-third participants joined in the 7-y survey and we observed a larger proportion of people with mental disorders in this subset than the whole population without any form of mental disorders at baseline, the real-world burden of depression and anxiety during the follow-up could be worse than that based on the current information. Last, because the precise timing of the onset of mental disorders was lacking, both conditions together may weaken the observed associations of air pollutants with the risk of mental disorders in our study by causing potential underestimation of incident mental disorders and overestimation of censoring time.
In conclusion, our study is one of the largest cohort studies investigating the associations of long-term exposure to major air pollutants with the risk of depression and anxiety in people. Our findings established that air quality may be a modifiable factor that could be targeted to reduce the mental health burden in modern society. Beyond this, our study not only underpinned the combined associations of air pollutants with mental disorders using a novel air pollution index, but also highlighted a potential dose–response in the development of depression and anxiety under long-term air pollution exposure. More efforts are warranted to reveal the whole landscape of the impact of environmental exposures to additional air pollutants on mental health and to explore the underlying biological mechanisms in a multidisciplinary approach.
Supplementary Material
Acknowledgments
Data are available in a public, open-access repository per application (https://www.ukbiobank.ac.uk/). This research has been conducted using the UK Biobank Resource under Application Number 44430. The UK Biobank data are available on application to the UK Biobank.
X.G. was supported by grants from the National Key Research and Development Program of China (No. 2022YFC3702704), the China Center for Disease Control Key Laboratory of Environment and Population Health (2022-CKL-03), and Peking University (BMU2021YJ044). The authors thank C. Chen for the language assistance.
References
- 1.Verhoeven JE, Révész D, van Oppen P, Epel ES, Wolkowitz OM, Penninx BW. 2015. Anxiety disorders and accelerated cellular ageing. Br J Psychiatry 206(5):371–378, PMID: , 10.1192/bjp.bp.114.151027. [DOI] [PubMed] [Google Scholar]
- 2.Révész D, Verhoeven JE, Milaneschi Y, Penninx BW. 2016. Depressive and anxiety disorders and short leukocyte telomere length: mediating effects of metabolic stress and lifestyle factors. Psychol Med 46(11):2337–2349, PMID: , 10.1017/S0033291716000891. [DOI] [PubMed] [Google Scholar]
- 3.Cuijpers P, Beekman AT, Reynolds CF 3rd.. 2012. Preventing depression: a global priority. JAMA 307(10):1033–1034, PMID: , 10.1001/jama.2012.271. [DOI] [PMC free article] [PubMed] [Google Scholar]
- 4.Beaudreau SA, O’Hara R. 2008. Late-life anxiety and cognitive impairment: a review. Am J Geriatr Psychiatry 16(10):790–803, PMID: , 10.1097/JGP.0b013e31817945c3. [DOI] [PubMed] [Google Scholar]
- 5.Liu Q, Wang W, Gu X, Deng F, Wang X, Lin H, Guo X. 2021. Association between particulate matter air pollution and risk of depression and suicide: a systematic review and meta-analysis. Environ Sci Pollut Res Int 28(8):9029–9049, PMID: , 10.1007/s11356-021-12357-3. [DOI] [PubMed] [Google Scholar]
- 6.Fan SJ, Heinrich J, Bloom MS, Zhao TY, Shi TX, Feng WR, et al. 2020. Ambient air pollution and depression: a systematic review with meta-analysis up to 2019. Sci Total Environ 701:134721, PMID: , 10.1016/j.scitotenv.2019.134721. [DOI] [PubMed] [Google Scholar]
- 7.Dickerson AS, Wu AC, Liew Z, Weisskopf M. 2020. A scoping review of non-occupational exposures to environmental pollutants and adult depression, anxiety, and suicide. Curr Environ Health Rep 7(3):256–271, PMID: , 10.1007/s40572-020-00280-7. [DOI] [PMC free article] [PubMed] [Google Scholar]
- 8.Braithwaite I, Zhang S, Kirkbride JB, Osborn DPJ, Hayes JF. 2019. Air pollution (particulate matter) exposure and associations with depression, anxiety, bipolar, psychosis and suicide risk: a systematic review and meta-analysis. Environ Health Perspect 127(12):126002, PMID: , 10.1289/EHP4595. [DOI] [PMC free article] [PubMed] [Google Scholar]
- 9.Petrowski K, Bührer S, Strauß B, Decker O, Brähler E. 2021. Examining air pollution (PM10), mental health and well-being in a representative German sample. Scientific reports 11(1):18436, PMID: , 10.1038/s41598-021-93773-w. [DOI] [PMC free article] [PubMed] [Google Scholar]
- 10.Bakolis I, Hammoud R, Stewart R, Beevers S, Dajnak D, MacCrimmon S, Broadbent M. 2021. Mental health consequences of urban air pollution: prospective population-based longitudinal survey. Soc Psychiatry Psychiatr Epidemiol 56(9):1587–1599, PMID: , 10.1007/s00127-020-01966-x. [DOI] [PMC free article] [PubMed] [Google Scholar]
- 11.Khan A, Plana-Ripoll O, Antonsen S, Brandt J, Geels C, Landecker H, et al. 2019. Environmental pollution is associated with increased risk of psychiatric disorders in the US and Denmark. PLoS Biol 17(8):e3000353, PMID: , 10.1371/journal.pbio.3000353. [DOI] [PMC free article] [PubMed] [Google Scholar]
- 12.Newbury JB, Stewart R, Fisher HL, Beevers S, Dajnak D, Broadbent M, et al. 2021. Association between air pollution exposure and mental health service use among individuals with first presentations of psychotic and mood disorders: retrospective cohort study. Br J Psychiatry 219(6):678–685, PMID: , 10.1192/bjp.2021.119. [DOI] [PMC free article] [PubMed] [Google Scholar]
- 13.Kampa M, Castanas E. 2008. Human health effects of air pollution. Environ Pollut 151(2): 362–367, PMID: , 10.1016/j.envpol.2007.06.012. [DOI] [PubMed] [Google Scholar]
- 14.Tsuang MT, Bar JL, Stone WS, Faraone SV. 2004. Gene-environment interactions in mental disorders. World Psychiatry 3(2):73–83, PMID: . [PMC free article] [PubMed] [Google Scholar]
- 15.Robert Plomin, DeFries JC, Knopik VS, Neiderhiser JM. 2013. Behavioral Genetics (6th edition). New York, NY: Worth Publishers. 10.1007/s10519-013-9598-6. [DOI] [Google Scholar]
- 16.Peters A, Nawrot TS, Baccarelli AA. 2021. Hallmarks of environmental insults. Cell 184(6):1455–1468, PMID: , 10.1016/j.cell.2021.01.043. [DOI] [PMC free article] [PubMed] [Google Scholar]
- 17.Sudlow C, Gallacher J, Allen N, Beral V, Burton P, Danesh J, et al. 2015. UK Biobank: an open access resource for identifying the causes of a wide range of complex diseases of middle and old age. PLoS Med 12(3):e1001779, PMID: , 10.1371/journal.pmed.1001779. [DOI] [PMC free article] [PubMed] [Google Scholar]
- 18.Stanhope J. 2016. Patient Health Questionnaire-4. Occup Med (Lond) 66(9):760–761, PMID: , 10.1093/occmed/kqw165. [DOI] [PubMed] [Google Scholar]
- 19.Kroenke K, Spitzer RL, Williams JB. 2001. The PHQ-9: validity of a brief depression severity measure. J Gen Intern Med 16(9):606–613, PMID: , 10.1046/j.1525-1497.2001.016009606.x. [DOI] [PMC free article] [PubMed] [Google Scholar]
- 20.Spitzer RL, Kroenke K, Williams JB, Löwe B. 2006. A brief measure for assessing generalized anxiety disorder: the GAD-7. Arch Intern Med 166(10):1092–1097, PMID: , 10.1001/archinte.166.10.1092. [DOI] [PubMed] [Google Scholar]
- 21.Wang M, Zhou T, Song Y, Li X, Ma H, Hu Y, et al. 2021. Joint exposure to various ambient air pollutants and incident heart failure: a prospective analysis in UK Biobank. Eur Heart J 42(16):1582–1591, PMID: , 10.1093/eurheartj/ehaa1031. [DOI] [PMC free article] [PubMed] [Google Scholar]
- 22.Eeftens M, Beelen R, de Hoogh K, Bellander T, Cesaroni G, Cirach M, et al. 2012. Development of Land Use Regression models for PM2.5, PM2.5 absorbance, PM10 and PMcoarse in 20 European study areas; results of the ESCAPE project. Environ Sci Technol 46(20):11195–11205, PMID: , 10.1021/es301948k. [DOI] [PubMed] [Google Scholar]
- 23.Beelen R, Hoek G, Vienneau D, Eeftens M, Dimakopoulou K, Pedeli X, et al. 2013. Development of NO2 and NOx land use regression models for estimating air pollution exposure in 36 study areas in Europe–The ESCAPE project. Atmos Environ 72:10–23, 10.1016/j.atmosenv.2013.02.037. [DOI] [Google Scholar]
- 24.Vert C, Sánchez-Benavides G, Martínez D, Gotsens X, Gramunt N, Cirach M, et al. 2017. Effect of long-term exposure to air pollution on anxiety and depression in adults: a cross-sectional study. Int J Hyg Environ Health 220(6):1074–1080, PMID: , 10.1016/j.ijheh.2017.06.009. [DOI] [PubMed] [Google Scholar]
- 25.de Prado Bert P, Mercader EMH, Pujol J, Sunyer J, Mortamais M. 2018. The effects of air pollution on the brain: a review of studies interfacing environmental epidemiology and neuroimaging. Curr Environ Health Rep 5(3):351–364, PMID: , 10.1007/s40572-018-0209-9. [DOI] [PMC free article] [PubMed] [Google Scholar]
- 26.Craig CL, Marshall AL, Sjöström M, Bauman AE, Booth ML, Ainsworth BE, et al. 2003. International physical activity questionnaire: 12-country reliability and validity. Med Sci Sports Exerc 35(8):1381–1395, PMID: , 10.1249/01.MSS.0000078924.61453.FB. [DOI] [PubMed] [Google Scholar]
- 27.Townsend P, Phillimore P, Beattie A. 1988. Health and Deprivation: Inequality and the North: New York, NY: Routledge. [Google Scholar]
- 28.Cummings P. 2013. Missing data and multiple imputation. JAMA Pediatr 167(7):656–661, PMID: , 10.1001/jamapediatrics.2013.1329. [DOI] [PubMed] [Google Scholar]
- 29.Bycroft C, Freeman C, Petkova D, et al. 2017. Genome-wide genetic data on–500,000 UK Biobank participants. bioRxiv:166298. [Google Scholar]
- 30.Meier SM, Trontti K, Purves KL, Als TD, Grove J, Laine M, et al. 2019. Genetic variants associated with anxiety and stress-related disorders: a genome-wide association study and mouse-model study. JAMA Psychiatry 76(9):924–932, PMID: , 10.1001/jamapsychiatry.2019.1119. [DOI] [PMC free article] [PubMed] [Google Scholar]
- 31.Wray NR, Ripke S, Mattheisen M, Trzaskowski M, Byrne EM, Abdellaoui A, et al. 2018. Genome-wide association analyses identify 44 risk variants and refine the genetic architecture of major depression. Nat Genet 50(5):668–681, PMID: , 10.1038/s41588-018-0090-3. [DOI] [PMC free article] [PubMed] [Google Scholar]
- 32.Simon RM, Subramanian J, Li MC, Menezes S. 2011. Using cross-validation to evaluate predictive accuracy of survival risk classifiers based on high-dimensional data. Brief Bioinform 12(3):203–214, PMID: , 10.1093/bib/bbr001. [DOI] [PMC free article] [PubMed] [Google Scholar]
- 33.Fan M, Sun D, Zhou T, Heianza Y, Lv J, Li L, et al. 2020. Sleep patterns, genetic susceptibility, and incident cardiovascular disease: a prospective study of 385 292 UK biobank participants. Eur Heart J 41(11):1182–1189, PMID: , 10.1093/eurheartj/ehz849. [DOI] [PMC free article] [PubMed] [Google Scholar]
- 34.Nikolakopoulou A, Mavridis D, Salanti G. 2014. How to interpret meta-analysis models: fixed effect and random effects meta-analyses. Evid Based Ment Health 17(2):64, PMID: , 10.1136/eb-2014-101794. [DOI] [PubMed] [Google Scholar]
- 35.VanderWeele TJ, Ding P. 2017. Sensitivity analysis in observational research: introducing the E-value. Ann Intern Med 167(4):268–274, PMID: , 10.7326/M16-2607. [DOI] [PubMed] [Google Scholar]
- 36.Fry A, Littlejohns TJ, Sudlow C, Doherty N, Adamska L, Sprosen T, et al. 2017. Comparison of sociodemographic and health-related characteristics of UK Biobank participants with those of the general population. Am J Epidemiol 186(9):1026–1034, PMID: , 10.1093/aje/kwx246. [DOI] [PMC free article] [PubMed] [Google Scholar]
- 37.Wulff K, Donato D, Lurie N. 2015. What is health resilience and how can we build it? Annu Rev Public Health 36:361–374, PMID: , 10.1146/annurev-publhealth-031914-122829. [DOI] [PubMed] [Google Scholar]
- 38.Power MC, Kioumourtzoglou MA, Hart JE, Okereke OI, Laden F, Weisskopf MG. 2015. The relation between past exposure to fine particulate air pollution and prevalent anxiety: observational cohort study. BMJ 350:h1111, PMID: , 10.1136/bmj.h1111. [DOI] [PMC free article] [PubMed] [Google Scholar]
- 39.Adar SD, Filigrana PA, Clements N, Peel JL. 2014. Ambient coarse particulate matter and human health: a systematic review and meta-analysis. Curr Environ Health Rep 1(3):258–274, PMID: , 10.1007/s40572-014-0022-z. [DOI] [PMC free article] [PubMed] [Google Scholar]
- 40.Park SK, Tao Y, Meeker JD, Harlow SD, Mukherjee B. 2014. Environmental risk score as a new tool to examine multi-pollutants in epidemiologic research: an example from the NHANES study using serum lipid levels. PLoS One 9(6):e98632, PMID: , 10.1371/journal.pone.0098632. [DOI] [PMC free article] [PubMed] [Google Scholar]
- 41.Arouca A, Moreno LA, Gonzalez-Gil EM, Marcos A, Widhalm K, Molnár D, et al. 2019. Diet as moderator in the association of adiposity with inflammatory biomarkers among adolescents in the HELENA study. Eur J Nutr 58(5):1947–1960, PMID: , 10.1007/s00394-018-1749-3. [DOI] [PubMed] [Google Scholar]
- 42.Mithaiwala MN, Santana-Coelho D, Porter GA, O’Connor JC. 2021. Neuroinflammation and the kynurenine pathway in CNS disease: molecular mechanisms and therapeutic implications. Cells 10(6):1548, PMID: , 10.3390/cells10061548. [DOI] [PMC free article] [PubMed] [Google Scholar]
- 43.Bhatt S, Nagappa AN, Patil CR. 2020. Role of oxidative stress in depression. Drug Discov Today 25(7):1270–1276, PMID: , 10.1016/j.drudis.2020.05.001. [DOI] [PubMed] [Google Scholar]
- 44.Liu S, Ouyang Z, Chong AM, Wang H. 2018. Neighborhood environment, residential satisfaction, and depressive symptoms among older adults in residential care homes. Int J Aging Hum Dev 87(3):268–288, PMID: , 10.1177/0091415017730812. [DOI] [PubMed] [Google Scholar]
- 45.von Lindern E, Hartig T, Lercher P. 2016. Traffic-related exposures, constrained restoration, and health in the residential context. Health Place 39:92–100, PMID: , 10.1016/j.healthplace.2015.12.003. [DOI] [PubMed] [Google Scholar]
- 46.Nguyen HA, Anderson CAM, Miracle CM, Rifkin DE. 2017. The association between depression, perceived health status, and quality of life among individuals with chronic kidney disease: an analysis of the National Health and Nutrition Examination Survey 2011–2012. Nephron 136(2):127–135, PMID: , 10.1159/000455750. [DOI] [PubMed] [Google Scholar]
- 47.Vaughan L, Corbin AL, Goveas JS. 2015. Depression and frailty in later life: a systematic review. Clin Interv Aging 10:1947–1958, PMID: , 10.2147/CIA.S69632. [DOI] [PMC free article] [PubMed] [Google Scholar]
- 48.Dominski FH, Lorenzetti Branco JH, Buonanno G, Stabile L, Gameiro da Silva M, Andrade A. 2021. Effects of air pollution on health: a mapping review of systematic reviews and meta-analyses. Environ Res 201:111487, PMID: , 10.1016/j.envres.2021.111487. [DOI] [PubMed] [Google Scholar]
- 49.Gao X, Coull B, Lin X, Vokonas P, Spiro A, Hou L, Schwartz J. 2021. Short-term air pollution, cognitive performance, and nonsteroidal anti-inflammatory drug use in the Veterans Affairs Normative Aging Study. Nat Aging 1(5):430–437, PMID: , 10.1038/s43587-021-00060-4. [DOI] [PMC free article] [PubMed] [Google Scholar]
- 50.Tibbo AJ, Baillie GS. 2020. Phosphodiesterase 4B: master regulator of brain signaling. Cells 9(5):1254, PMID: , 10.3390/cells9051254. [DOI] [PMC free article] [PubMed] [Google Scholar]
- 51.Lee JR. 2015. Protein tyrosine phosphatase PTPRT as a regulator of synaptic formation and neuronal development. BMB Rep 48(5):249–255, PMID: , 10.5483/BMBRep.2015.48.5.037. [DOI] [PMC free article] [PubMed] [Google Scholar]
- 52.Wamsley B, Jaglin XH, Favuzzi E, Quattrocolo G, Nigro MJ, Yusuf N, et al. 2018. Rbfox1 mediates cell-type-specific splicing in cortical interneurons. Neuron 100(4):846–59.e7, PMID: , 10.1016/j.neuron.2018.09.026. [DOI] [PMC free article] [PubMed] [Google Scholar]
- 53.Fuller R, Landrigan PJ, Balakrishnan K, Bathan G, Bose-O’Reilly S, Brauer M, et al. 2022. Pollution and health: a progress update. Lancet Planet Health 6(6):e535–e547, PMID: , 10.1016/S2542-5196(22)00090-0. [DOI] [PubMed] [Google Scholar]
- 54.World Health Organization. 2010. WHO Guidelines for Indoor Air Quality: Selected Pollutants. Copenhagen, Denmark: Regional Office for Europe, World Health Organization. [PubMed] [Google Scholar]
Associated Data
This section collects any data citations, data availability statements, or supplementary materials included in this article.