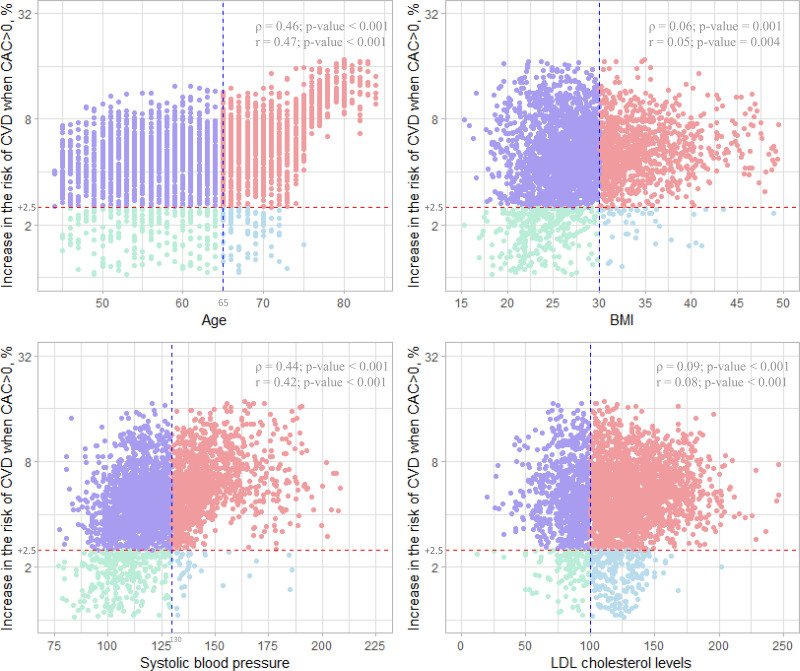
Figure 3.
Association between the traditional cardiovascular risk factors and the estimated increase in the risk of cardiovascular events when CAC>0 compared to CAC=0. X-axis shows 4 major traditional cardiovascular risk factors (age, BMI, systolic blood pressure, and LDL cholesterol levels). The vertical dashed line (blue) for each variable corresponds to age (65 years), BMI (30 kg/m2), systolic blood pressure (130 mmHg), and LDL cholesterol levels (100 mg/dL). Y-axis shows the estimated increase in the risk of cardiovascular events when CAC>0 compared to CAC=0 (calculated by the causal forest model). Spearman correlation coefficients (ρ) and Pearson correlation coefficient (r) between each traditional cardiovascular risk factor and the estimated increase in the risk of cardiovascular events when CAC>0 (vs CAC=0) and their P values are shown at the upper right of each plot. BMI indicates body mass index; CAC, coronary artery calcium; CVD, cardiovascular disease; and LDL, low-density lipoprotein.

