

A dietary intervention consisting of a plant-based diet, minimizing oils, and daily soybeans significantly reduced the frequency and severity of postmenopausal hot flashes and associated symptoms.
Key Words: Diet, Hot flashes, Isoflavones, Menopause, Nutrition, Plant-based, Soy, Vegan
Abstract
Objective
Postmenopausal vasomotor symptoms disrupt quality of life. This study tested the effects of a dietary intervention on vasomotor symptoms and menopause-related quality of life.
Methods
Postmenopausal women (n = 84) reporting at least two moderate-to-severe hot flashes daily were randomly assigned, in two successive cohorts, to an intervention including a low-fat, vegan diet and cooked soybeans (½ cup [86 g] daily) or to a control group making no dietary changes. During a 12-week period, a mobile application was used to record hot flashes (frequency and severity), and vasomotor, psychosocial, physical, and sexual symptoms were assessed with the Menopause-Specific Quality of Life questionnaire. Between-group differences were assessed for continuous (t tests) and binary (χ2/McNemar tests) outcomes. In a study subsample, urinary equol was measured after the consumption of ½ cup (86 g) of cooked whole soybeans twice daily for 3 days.
Results
In the intervention group, moderate-to-severe hot flashes decreased by 88% (P < 0.001) compared with 34% for the control group (P < 0.001; between-group P < 0.001). At 12 weeks, 50% of completers in the intervention group reported no moderate-to-severe hot flashes at all. Among controls, there was no change in this variable from baseline (χ2 test, P < 0.001). Neither seasonality nor equol production status was associated with the degree of improvement. The intervention group reported greater reductions in the Menopause-Specific Quality of Life questionnaire vasomotor (P = 0.004), physical (P = 0.01), and sexual (P = 0.03) domains.
Conclusions
A dietary intervention consisting of a plant-based diet, minimizing oils, and daily soybeans significantly reduced the frequency and severity of postmenopausal hot flashes and associated symptoms.
Postmenopausal vasomotor symptoms cause recurrent discomfort, disrupt sleep, and reduce quality of life.1 A role for nutritional factors in vasomotor symptoms was suggested by their low prevalence in areas (notably Japan, China, and rural Mexico) where traditional dietary staples included grains, legumes, vegetables, and other plant-derived foods.2-6 As the Japanese diet Westernized between the 1980s and the early 2000s,7 reports of hot flashes increased from approximately 15% to more than 40% of menopausal women.8
A dietary intervention increasing whole grains, fruits, and vegetables and reducing dietary fat proved modestly effective in a randomized trial including 17,473 Women's Health Initiative participants. The odds of becoming free of hot flashes at 1 year were increased by 14% (odds ratio, 1.14; 95% confidence interval, 1.01-1.28) for those adhering to the intervention regardless of any weight change and by 23% (odds ratio, 1.23; 95% confidence interval, 1.05-1.46) among those who lost ≥10% of body weight.9 In addition, soy isoflavones, particularly daidzein and genistein, have proven modestly effective in controlled trials.10-12 They have estrogen-agonist and estrogen-antagonist actions, with selective affinity for estrogen receptor-β.
The possibility that a low-fat, plant-based diet with daily soybeans might be more potent against vasomotor symptoms comes from the fact that such diets are typically high in fiber and low in fat, favor weight loss, and seem to foster the growth of gut bacteria capable of converting daidzein to equol. The ability to produce equol is detected more frequently in individuals following vegetarian diets than in omnivores and seems to have been more prevalent in Japan before Westernization of the diet.13,14 It has been proposed as a factor in soy's apparent health benefits.15
In an initial cohort of a controlled trial of a plant-based diet including soybeans, moderate-to-severe postmenopausal hot flashes fell by 84% in 12 weeks.16 For 59% of participants, moderate-to-severe hot flashes ended altogether. There were also improvements in body weight and in psychosocial, physical, and sexual domains.
The autumn timing of the study, however, raised the question as to whether this symptomatic improvement might have been attributable to cooler temperatures. Also, the study did not assess equol production. These questions were addressed in a replication. The results of the full study, including both cohorts, are reported here.
METHODS
Participants were recruited in two cohorts (fall and spring) for a parallel-design, 12-week study beginning in September 2020 and February 2021. The Advarra Institutional Review Board approved the study on September 2, 2020 (Pro00045315).
Postmenopausal women aged 40 to 65 years reporting at least two moderate-to-severe hot flashes per day were recruited via social media notices. Criteria for inclusion were cessation of menstruation >1 and <10 years prior and willingness to consume a low-fat, vegan diet with daily soybeans. Criteria for exclusion were any cause of vasomotor symptoms other than natural menopause; current use of a low-fat, vegan diet including daily soy products; soy allergy; use of hormonal medications in the preceding 2 months; smoking; substance abuse; eating disorder history; weight-reducing medication use during the last 6 months; a current effort at weight loss; and body mass index <18.5 kg/m2.
Within each cohort, volunteers meeting the aforementioned criteria who provided a practice dietary record and gave informed consent were assigned, using a random-number table, to an intervention or control group.
Outcome measures
Before and after the 12-week intervention period, the following outcomes were assessed, except as noted.
Health status
Participants were asked about any health issues and medications.
Height
Self-reported height was collected at baseline.
Body weight
Weight was measured with self-calibrating digital scales (Renpho Model ES-CS20M, Anaheim, CA).
Dietary intake
Dietary intake for two weekdays and one weekend day was recorded by participants and analyzed by the Nutrition Coordinating Center, University of Minnesota, using Nutrition Data System for Research software version 2020.
Recent physical activity
Using the International Physical Activity Questionnaire, metabolic equivalents for given activity levels were multiplied by the time (in minutes) and frequency (in days) of these activities.17
Hot flashes
For 7 days, the onset, cessation, and intensity of hot flashes were recorded upon occurrence with a mobile application (My Luna; Blue Trail Software Holding, San Francisco, CA). Nighttime hot flashes were to be registered the following morning. In cases where hot flash frequency changed markedly, participants were contacted by telephone for confirmation.
Quality of life
The effect of menopausal symptoms on quality of life was reported using the Menopause-Specific Quality of Life (MENQOL) questionnaire for four domains: vasomotor, psychosocial, physical, and sexual.18,19
Urinary S-equol and isoflavone analysis by tandem mass spectrometry (ultra-high performance liquid chromatography–tandem mass spectrometry)
Urinary isoflavone concentrations were measured in a subset of participants after the consumption of ½ cup (86 g) of cooked whole soybeans twice daily for 3 days. The total concentration of S-equol, daidzein, genistein, and glycitein in urine (50 μL) was determined by stable-isotope dilution–tandem mass spectrometry after the addition of [13C3]equol and [13C3]daidzein and [13C3]genistein as internal standards for quantification and enzymatic hydrolysis with a β-glucuronidase (Kura β-glucuronidase, BG100, Red Abalone). The isoflavone aglycones released were extracted on a solid-phase octadecylsilane-bonded silica cartridge (Strata C18-E, Phenomenex), the methanolic extracts were evaporated and reconstituted in mobile phase, and isoflavones were separated and analyzed by tandem mass spectrometry on a Waters Micro TQ-S instrument coupled to an Acquity UPLC H Class chromatograph. The analytical approach was based on previously published methods with minor modifications, and the assay was performed with quality controls. The intra-assay and interassay imprecisions (within 5%-15% coefficient of variation for all analytes) were monitored throughout the analysis.20-22 Equol-producer status was defined as a log10 urinary equol/daidzein concentration ratio greater than −1.75.
Dietary intervention
Intervention group participants were asked to avoid animal-derived foods, minimize the use of oils and fatty foods (eg, nuts and avocados), and consume daily ½ cup (86 g) of cooked whole nongenetically modified soybeans (Laura Soybeans, Corwith, IA), which were provided. No other foods were provided. All participants (in either group) who did not own pressure cookers were loaned them (Instant Pot, Instant Brands; Kanata, Ontario, Canada) to facilitate soybean preparation for the intervention group and maintain an equitable intervention in the control group. Control participants were free to use them or not as they saw fit.
Participants in the intervention group were invited to 1-hour group meetings each week, conducted via the Zoom Internet conference platform by a registered dietitian or research staff members for information on food preparation and managing common dietary challenges, and to discuss dietary adherence, although formal adherence assessment was done using 3-day dietary records.
Participants in the control group were asked to continue their usual diets, report body weight and symptoms weekly, and attend four 1-hour group sessions to maintain engagement. The sessions covered vasomotor symptoms, the study rationale, and study procedures and permitted free discussion of participant experiences. After study completion, they were offered optional instruction in the intervention diet. For all participants, alcoholic beverages were not to exceed one drink daily.
Participants in both groups were provided with a 100-μg vitamin B12 supplement and asked to take it daily. They were asked to avoid other new dietary supplements and to not change their exercise or medication regimens, except as requested by their personal physicians.
All data forms were identified with participant numbers only. Data were collected using Qualtrics Survey Software (Qualtrics, Provo, UT) and were stored using a secure Qualtrics account.
Statistical procedures
Because no prior study, to the investigators' knowledge, had examined the effects of a plant-based diet with soybeans on vasomotor symptoms, there was no sound basis for a power analysis. Planned enrollment was therefore set at ≤40 participants as an initial cohort, with one or more replications (up to 120 total participants) thereafter to compensate for seasonality.
Descriptive statistics for baseline variables were calculated. T tests (continuous variables) and χ2-type tests (categorical measures) assessed the significance of baseline differences between study groups.
Descriptive statistics were calculated for outcome measures. Because distributions did not substantially depart from approximate normality, treatment effects were assessed with parametric tests. Comparisons of treatment arms used t tests for two independent samples on the change scores over time. Key findings were also evaluated in the subgroup of participants reporting at least seven moderate/severe hot flashes per day at baseline. Linear regression models of outcomes including main effects of treatment and cohort, along with a treatment-cohort interaction, were used to assess evidence of a seasonality effect. Pearson correlations were used to quantify the magnitude of association between outcomes, with partial Pearson correlations quantifying associations adjusted for energy intake. Between-group differences for binary outcomes were assessed with χ2 or Fisher's exact tests. Within-group changes in such outcomes were assessed with the exact McNemar test.
RESULTS
Of 1,662 volunteers, 1,301 were excluded before individual interviews, and 361 proceeded to telephone interviews (Fig. 1). Of these, 84 were randomly assigned, in two cohorts, to the intervention and control groups (Table 1). Thirteen participants failed to complete the study, leaving 71 participants for the main data analysis.
FIG. 1.
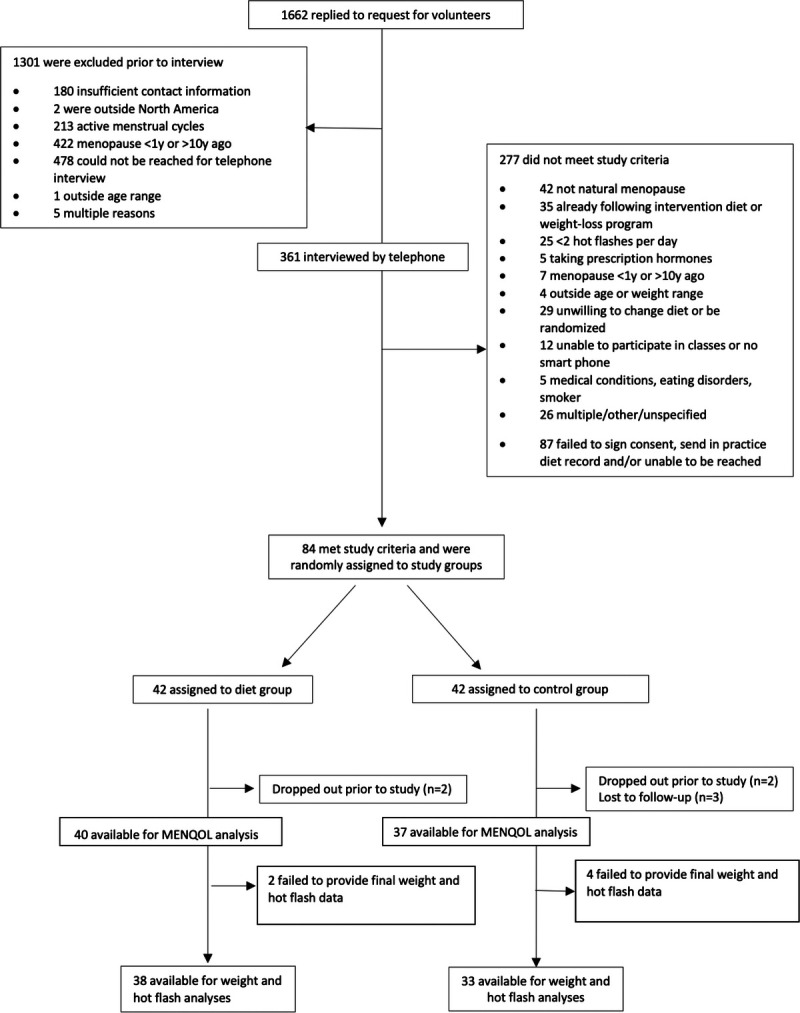
Participant flow through the trial. MENQOL, Menopause-Specific Quality of Life questionnaire.
TABLE 1.
Baseline demographics, nutrient intake, and clinical measures in a dietary intervention trial for vasomotor symptoms
| Intervention Group (n = 42) |
Control Group (n = 42) |
P | |
|---|---|---|---|
| Age (y), mean (SD) | 53.2 (3.8) | 55.2 (4.5) | 0.034 |
| Age range (y) | 42-60 | 49-67 | |
| Race and ethnicity | 0.56 | ||
| Black, non-Hispanic | 6 (14%) | 8 (19%) | |
| Asian, Pacific Islander | 1 (2%) | 1 (2%) | |
| White, non-Hispanic | 34 (81%) | 31 (74%) | |
| White, Hispanic | 0 (0%) | 2 (5%) | |
| Native American, non-Hispanic | 1 (2%) | 0 (0%) | |
| Marital status | 0.25 | ||
| Not married | 9 (21%) | 14 (33%) | |
| Married | 32 (76%) | 28 (67%) | |
| Unspecified | 1 (2%) | 0 (0%) | |
| Education | 0.83 | ||
| High school, partial or graduate | 1 (2%) | 0 (0%) | |
| College, partial or graduate | 24 (57%) | 26 (65%) | |
| Graduate degree | 17 (41%) | 14 (35%) | |
| Medication use | |||
| Antihypertensives | 7 (17%) | 3 (7%) | 0.18 |
| Cholesterol-lowering medications | 0 (0%) | 0 (0%) | 1.0 |
| Thyroid medications | 2 (5%) | 1 (2%) | 1.0 |
| BMI (kg/m2), mean (SD) | 27.2 (6.3) | 27.3 (5.3) | 0.96 |
| Years since menopause, mean (SD) | 4.0 (2.7) | 4.7 (2.6) | 0.23 |
| Dietary intake | (n = 39) | (n = 36) | |
| Energy (kcal/d) | 1,570.5 (427.6) | 1,597.9 (555.9) | 0.81 |
| Total fat (g/d) | 62.2 (26.1) | 60.8 (27.7) | 0.82 |
| Saturated fat (g/d) | 17.3 (11.1) | 15.9 (9.7) | 0.57 |
| Carbohydrates (g/d) | 197.8 (70.2) | 215.6 (82.6) | 0.32 |
| Protein (g/d) | 62.7 (20.8) | 59.8 (24.4) | 0.58 |
| Cholesterol (mg/d) | 178.6 (171.6) | 117.5 (138.1) | 0.095 |
| Fiber (g/d) | 29.5 (13.6) | 30.7 (14.3) | 0.69 |
| Physical activity (MET-min/wk) | 2,676 (2,293); n = 37 | 2,988 (2,998); n = 35 | 0.62 |
| Body weight | (n = 42) | (n = 41) | |
| Body weight (kg) | 74.3 (15.7) | 74.6 (15.4) | 0.95 |
| BMI (kg/m2) | 27.2 (6.3) | 27.3 (5.3) | 0.96 |
| Hot flashes application reports | (n = 42) | (n = 40) | |
| Hot flashes total | 5.8 (3.5) | 5.2 (3.8) | 0.40 |
| Hot flashes moderate-severe | 4.8 (3.5) | 4.1 (3.2) | 0.34 |
| Daytime hot flashes | 4.4 (2.9) | 3.6 (2.7) | 0.22 |
| Daytime hot flashes moderate-severe | 3.6 (2.8) | 2.9 (2.3) | 0.20 |
| Nighttime hot flashes | 1.5 (1.0) | 1.5 (1.4) | 0.78 |
| MENQOL | (n = 41) | (n = 38 except n = 37 sexual) | |
| Vasomotor | 4.5 (2.1) | 5.7 (1.3) | 0.002 |
| Psychosocial | 2.9 (1.9) | 3.3 (1.7) | 0.35 |
| Physical | 3.0 (1.3) | 3.5 (1.2) | 0.11 |
| Sexual | 3.3 (2.4) | 3.6 (2.5) | 0.63 |
BMI (kg/m2), body mass index as reported in kilograms of body weight per meter height squared; MENQOL, Menopause-Specific Quality of Life questionnaire; MET, metabolic equivalents; SD, standard deviation.
Within the intervention group, mean reported fat, saturated fat, and cholesterol intake diminished, whereas fiber intake increased (all P < 0.0001; Table 2). There were no significant nutrient changes in the control group. Mean body weight decreased by 3.6 kg in the intervention group and 0.2 kg in the control group (P < 0.001).
TABLE 2.
Clinical measures at baseline and 12 weeks
| Intervention group | Control group | Effect size | P | |||||
|---|---|---|---|---|---|---|---|---|
| Week 0 | Week 12 | Change | Week 0 | Week 12 | Change | |||
| Dietary intake | ||||||||
| Energy (kcal/d) | 1,564 (1,405-1,724) | 1,332 (1,188 to 1,476) | −232 (−383 to −81)a | 1,597 (1,417 to 1,778) | 1,709 (1,303 to 2,114) | 111 (−241 to 464) | −344 (−723 to 36) | 0.07 |
| Total fat (g/d) | 60.9 (51.7 to 70.1) | 30.8 (26.1 to 35.5) | −30.1 (−39.6 to −20.5)b | 59.7 (50.9 to 68.4) | 61.8 (47.6 to 76.0) | 2.1 (−7.0 to 11.2) | −32.2 (−45.4 to −19.0) | <0.001 |
| Saturated fat (g/d) | 17.3 (13.2 to 21.5) | 5.6 (4.7 to 6.6) | −11.7 (−16.0 to −7.5)b | 14.8 (11.6 to 17.9) | 17.7 (12.6 to 22.7) | 2.9 (−0.8 to 6.7) | −14.6 (−20.4 to −8.9) | <0.001 |
| Carbohydrates (g/d) | 204.4 (179.3 to 229.4) | 223 (194.8 to 251.2) | 18.6 (−4.9 to 42.2) | 222.8 (191.3 to 254.4) | 243.7 (171.2 to 316.3) | 20.9 (−48.7 to 90.5) | −2.3 (−75.1 to 70.6) | 0.95 |
| Protein (g/d) | 60.3 (53.3 to 67.2) | 59.0 (53.3 to 64.8) | −1.2 (−8.2 to 5.8) | 56.0 (48.6 to 63.4) | 57.2 (48.9 to 65.6) | 1.2 (−7.1 to 9.5) | −2.4 (−13.0 to 8.2) | 0.65 |
| Cholesterol (mg/d) | 162.2 (108.7 to 215.7) | 4.6 (1.1 to 8.2) | −157.6 (−210.6 to −104.5)b | 77.2 (38.7 to 115.6) | 101.4 (64.5 to 138.3) | 24.3 (−6.2 to 54.7) | −181.8 (−242.0 to −121.6) | <0.001 |
| Fiber (g/d) | 30.3 (25.5 to 35.2) | 42.1 (37.1 to 47.1) | 11.8 (7.5 to 16.1)b | 33.5 (27.3 to 39.7) | 30.8 (24.9 to 36.7) | −2.7 (−7.1 to 1.7) | 14.5 (8.4 to 20.6) | <0.001 |
| Physical activity (MET-min/wk) | 2,918 (2,037 to 3,798) | 2,842 (2,019 to 3,665) | −76 (−692 to 540) | 2,485 (1,414 to 3,555) | 2,840 (1,411 to 4,270) | 356 (−371 to 1,083) | −432 (−1,357 to 493) | 0.35 |
| Body weight | ||||||||
| Body weight (kg) | 74.8 (69.3 to 80.2) | 71.1 (66.0 to 76.3) | −3.6 (−4.5 to −2.7)b | 73.4 (68.2 to 78.7) | 73.2 (67.9 to 78.5) | −0.24 (−0.9 to 0.4) | −3.4 (−4.5 to −2.3) | <0.001 |
| BMI (kg/m2) | 27.2 (25.0 to 29.3) | 25.8 (23.8 to 27.9) | −1.3 (−1.7 to −1.0)b | 26.6 (24.7 to 28.5) | 26.6 (24.7 to 28.5) | −0.01 (−0.2 to 0.2) | −1.3 (−1.7 to −0.9) | <0.001 |
| Hot flashes app reports | ||||||||
| Hot flashes total | 6.0 (4.9 to 7.2) | 1.4 (0.7 to 2.0) | −4.7 (−6.0 to −3.4)b | 5.7 (4.3 to 7.1) | 3.4 (2.3 to 4.6) | −2.2 (−3.2 to −1.3)b | −2.4 (−4.0 to −0.8) | 0.003 |
| Hot flashes moderate-severe | 5.0 (3.8 to 6.2) | 0.6 (0.3 to 0.8) | −4.4 (−5.6 to −3.2)b | 4.4 (3.2 to 5.7) | 2.9 (1.8 to 4.0) | −1.5 (−2.4 to −0.7)b | −2.9 (−4.3 to −1.4) | <0.001 |
| Daytime hot flashes | 4.5 (3.5 to 5.5) | 1.1 (0.6 to 1.6) | −3.5 (−4.5 to −2.4)b | 3.9 (2.9 to 4.9) | 2.4 (1.5 to 3.2) | −1.6 (−2.2 to −0.9)b | −1.9 (−3.1 to −0.7) | 0.003 |
| Daytime hot flashes moderate-severe | 3.7 (2.7 to 4.6) | 0.4 (0.2 to 0.6) | −3.3 (−4.2 to −2.3)b | 3.1 (2.2 to 3.9) | 1.9 (1.1 to 2.8) | −1.1 (−1.7 to −0.5)b | −2.2 (−3.3 to −1.0) | <0.001 |
| Nighttime hot flashes | 1.5 (1.2 to 1.9) | 0.3 (0.1 to 0.5) | −1.2 (−1.6 to −0.8)b | 1.7 (1.2 to 2.3) | 1.1 (0.7 to 1.4) | −0.7 (−1.1 to −0.3)a | −0.5 (−1.0 to −0.0) | 0.04 |
| MENQOL | ||||||||
| Vasomotor | 5.7 (5.2 to 6.2) | 3.7 (3.0 to 4.5) | −2.0 (−2.7 to −1.2)b | 4.4 (3.8 to 5.1) | 3.7 (3.2 to 4.3) | −0.7 (−1.1 to −0.3)b | −1.2 (−2.1 to −0.4) | 0.004 |
| Psychosocial | 3.3 (2.7 to 4.0) | 2.5 (1.9 to 3.0) | −0.9 (−1.4 to −0.3)a | 2.8 (2.3 to 3.2) | 2.5 (2.0 to 2.9) | −0.3 (−0.6 to −0.0)c | −0.6 (−1.2 to 0.1) | 0.08 |
| Physical | 3.6 (3.1 to 4.0) | 2.6 (2.2 to 3.0) | −0.9 (−1.4 to −0.5)b | 2.9 (2.5 to 3.3) | 2.6 (2.3 to 2.9) | −0.3 (−0.5 to −0.0)c | −0.7 (−1.2 to −0.1) | 0.01 |
| Sexual | 4.1 (3.2 to 5.0) | 2.8 (2.1 to 3.5) | −1.3 (−2.0 to −0.5)a | 2.8 (2.1 to 3.4) | 2.4 (1.8 to 3.1) | −0.4 (−0.7 to −0.0)c | −0.9 (−1.7 to −0.1) | 0.03 |
BMI (kg/m2), body mass index as reported in kilograms of body weight per meter height squared; MENQOL, Menopause-Specific Quality of Life questionnaire; MET, metabolic equivalents.
For within-group P values: aP < 0.01; bP < 0.001; cP < 0.05.
Total hot flash frequency in the intervention group decreased by 78% (P < 0.001) and 39% (P < 0.001) for the control group (between-group P = 0.003). The decrease in moderate-to-severe hot flashes in the intervention group was 88% (from 5.0 to 0.6 per day, P < 0.001), compared with 34% (from 4.4 to 2.9 per day, P < 0.001) among controls (between-group P < 0.001; Fig. 2). Among participants with at least seven moderate-to-severe hot flashes per day at baseline (intervention, n = 8; control, n = 10), moderate-to-severe hot flashes decreased by 93% (from 10.6 to 0.7 per day) in the intervention group (P < 0.001) and 36% (from 9.0 to 5.8 per day) in the control group (P = 0.01, between-group P < 0.001).
FIG. 2.
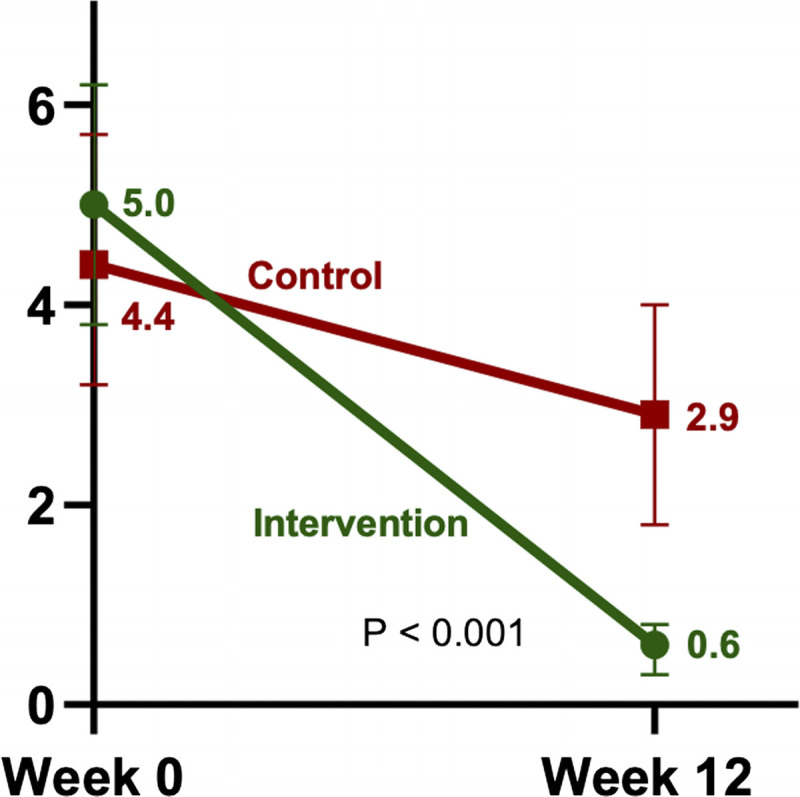
Moderate-to-severe hot flashes (per day, with 95% CI, completers). CI, confidence interval.
The number of intervention-group study completers who were free of moderate-to-severe hot flashes, based on mobile application reports, increased from 1 of 38 at week 1 to 19 of 38 (50%) at week 12. This variable remained unchanged among controls (1 of 33 [3%] at each time point, P < 0.0001 for χ2 test comparing the proportion free of moderate-to-severe hot flashes at week 12). These changes, reported with the mobile application, were paralleled by changes in MENQOL questionnaire findings (Table 2). Significant between-group differences were found in the vasomotor (P = 0.004), physical (P = 0.01), and sexual (P = 0.03) domains.
For both groups combined, after adjustment for energy intake, changes in frequency of severe hot flashes correlated directly with changes in fat intake (r = 0.33; P = 0.01) and inversely with changes in carbohydrate (r = −0.35; P = 0.006) and fiber intake (r = −0.29; P = 0.03). That is, the greater the reduction in fat intake and the greater the increases in carbohydrate and fiber consumption, the greater the reduction in severe hot flashes. Changes in frequency of moderate-to-severe hot flashes correlated inversely with daidzein (r = −0.29; P = 0.03) and genistein (r = −0.27; P = 0.04) intake.
Body weight changes correlated with changes in frequency of moderate-to-severe hot flashes (r = 0.36; P = 0.002). A similar association was found for the participants with a body mass index ≥25 kg/m2 at baseline (r = 0.36; P = 0.02). Seasonality had no apparent effect; the changes in moderate-to-severe hot flashes per day among intervention-group participants were −4.3 (SD, 3.1) and −4.5 (SD, 4.2) in the fall and spring cohorts, respectively (P = 0.34). Reductions in moderate-to-severe hot flashes did not differ by race (Black vs White: P = 0.99).
In the equol-production substudy, there was no apparent association between equol-producing ability and symptomatic changes. Of 15 intervention-group participants tested, 5 (33%) were equol producers at week 12. Moderate-to-severe hot flashes diminished strongly in both producers (from 8.0 to 0.7 per day) and nonproducers (from 4.3 to 0.6 per day; P = 0.16 for t test comparing changes by producer status). Similarly, among 12 control-group participants tested, equol-production status had no apparent effect on hot flashes
DISCUSSION
The dietary intervention led to clinically important reductions in menopausal symptoms. Of particular note was the 88% reduction in moderate-to-severe vasomotor events among intervention-group participants, accompanied by weight loss and improvements in physical, psychosocial, and sexual domains.
Biological plausibility for the role of diet in vasomotor symptoms comes from the fact that, in premenopausal women, increasing dietary fat increases circulating estradiol concentrations, whereas dietary fiber reduces these concentrations,23-25 suggesting the possibility that chronic elevations of estrogen levels during the reproductive years may increase vulnerability to vasomotor symptoms at menopause. In addition, soy isoflavones modestly reduce hot flashes, as noted earlier.
The correlations between the observed changes in vasomotor symptoms and both weight changes and nutrient-intake changes confirm and extend the more modest findings of the Women's Health Initiative. These correlations, however, were only moderate in magnitude. Thus, a single factor cannot be specified that would sufficiently explain the observed improvements.
The present study extends the findings from the initial study cohort16 by providing a larger sample, ruling out seasonality in the reduction in vasomotor symptoms, and providing initial data regarding equol. The ½ cup (86 g) servings of mature soybeans hold approximately 55 to 60 mg of isoflavones—slightly more than the amounts (approximately 30-40 mg/d) traditionally consumed in Japan or China.26,27 In the present study, the ability to convert daidzein to equol did not seem to influence the intervention's efficacy; both equol producers and nonproducers reported marked symptom reductions. Small sample size may have limited power to identify differences.
This study has several strengths. Because participants were not confined to a metabolic ward and used widely available foods, rather than commercial products, the findings readily translate to nonresearch settings. The mobile application permits more consistent registration of vasomotor events than occur with questionnaires or diaries and is less cumbersome than ambulatory skin conductance monitors.28-30 The use of the MENQOL questionnaire permitted the confirmation of symptom reductions reported using the mobile application. Because plant-based diets are associated with improvements in body weight, plasma lipids, blood pressure, and other health measures31 and have been shown to be highly acceptable in research studies,32-34 and because soy intake is associated with reduced breast cancer risk in some populations,35 health benefits may reinforce continued adherence.
The design also had limitations. It was limited to 12 weeks, and most participants had at least some college education. Participant blinding is not possible in trials of whole diets. Because the study tested a combination intervention, the efficacy of its individual components was not assessed. Placebo effects cannot be ruled out, although improvements were consistent between mobile application recording and questionnaire responses, and changes in these symptoms were paralleled by weight changes. Inaccuracies can occur in reporting of food intake and menopausal symptoms. The equol substudy merits repeating in a larger sample.
The inclusion criteria required at least two moderate-to-severe vasomotor events per day, fewer than the seven to eight such events recommended by the US Food and Drug Administration for therapeutic trials. The present study may therefore be more informative for women with less frequent events and less so for those with more frequent events. Nonetheless, a small subanalysis of women with ≥7 events/d suggested that effects may be similarly robust in this subpopulation.
CONCLUSIONS
A dietary intervention, combining a reduced-fat vegan diet and daily soybeans, was associated with a marked reduction in postmenopausal vasomotor events, significant weight loss, and reductions in physical and sexual symptoms.
Supplementary Material
Acknowledgments
The authors wish to thank the research participants, Blue Trail Software Holding (San Francisco, CA) for providing the My Luna app, and Instant Brands (Kanata, Ontario, Canada) for pressure cookers.
Footnotes
Findings from the first study cohort (n = 38) were published in Menopause and have been presented at scientific meetings.
Some of the findings from this clinical trial have been presented at the International Conference on Nutrition in Medicine; Washington, DC; August 19, 2022.
Funding/support: The study was funded by the Physicians Committee for Responsible Medicine.
Clinical trial registration: ClinicalTrials.gov, NCT04587154, registered on October 14, 2020.
Financial disclosure/conflicts of interest: N.D.B. is an adjunct professor of medicine at the George Washington University School of Medicine. He serves without compensation as president of the Physicians Committee for Responsible Medicine and Barnard Medical Center in Washington, DC, nonprofit organizations providing educational, research, and medical services related to nutrition. He writes books and articles and gives lectures related to nutrition and health and has received royalties and honoraria from these sources. H.K., D.N.H., T.Z.-M., M.S., and R.H. received compensation from the Physicians Committee for Responsible Medicine for their work on this study. R.H. currently receives funding from Pfizer for Data Safety and Monitoring Board service and DURECT Corporation for biostatistical consulting. He has received funding from Revance for Data Safety and Monitoring Board consulting in the past. K.D.R.S. holds equity in Aliveris s.r.l., Asklepion Pharmaceuticals, and Ausio Pharmaceuticals, and is a consultant to Travere and Mirum Pharmaceuticals.
Supplemental digital content is available for this article. Direct URL citations are provided in the HTML and PDF versions of this article on the journal’s Website (www.menopause.org).
Contributor Information
Hana Kahleova, Email: HKahleova@pcrm.org.
Danielle N. Holtz, Email: DHoltz@pcrm.org.
Tatiana Znayenko-Miller, Email: TZnayenkoMiller@pcrm.org.
Macy Sutton, Email: MSutton@pcrm.org.
Richard Holubkov, Email: richard.holubkov@hsc.utah.edu.
Xueheng Zhao, Email: Xueheng.Zhao@cchmc.org.
Stephanie Galandi, Email: stephanie.galandi@cchmc.org.
Kenneth D. R. Setchell, Email: Kenneth.Setchell@cchmc.org.
REFERENCES
- 1.Avis NE, Crawford SL, Green R. Vasomotor symptoms across the menopause transition: differences among women. Obstet Gynecol Clin North Am 2018;45:629–640. doi: 10.1016/j.ogc.2018.07.005 [DOI] [PMC free article] [PubMed] [Google Scholar]
- 2.Lock M. Menopause: lessons from anthropology. Psychosom Med 1998;60:410–409. doi: 10.1097/00006842-199807000-00005 [DOI] [PubMed] [Google Scholar]
- 3.Shea JL. Cross-cultural comparison of women's midlife symptom-reporting: a China study. Cult Med Psychiatry 2006;30:331–362. doi: 10.1007/s11013-006-9020-4 [DOI] [PubMed] [Google Scholar]
- 4.Beyenne Y, Martin MC. Menopausal experiences and bone density of Mayan women in Yucutan, Mexico. Am J Human Biol 2001;13:505–511. doi: 10.1002/ajhb.1082 [DOI] [PubMed] [Google Scholar]
- 5.Melby MK, Lock M, Kaufer P. Culture and symptom reporting at menopause. Hum Reprod Update 2005;11:495–512. doi: 10.1093/humupd/dmi018 [DOI] [PubMed] [Google Scholar]
- 6.Palacios S, Henderson VW, Siseles N, Tan D, Villaseca P. Age of menopause and impact of climacteric symptoms by geographical region. Climacteric 2010;13:419–428. doi: 10.3109/13697137.2010.507886 [DOI] [PubMed] [Google Scholar]
- 7.Tsugane S, Sawada N. The JPHC study: design and some findings on the typical Japanese diet. Jpn J Clin Oncol 2014;44:777–782. doi: 10.1093/jjco/hyu096 [DOI] [PubMed] [Google Scholar]
- 8.Melby MK. Vasomotor symptom prevalence and language of menopause in Japan. Menopause 2005;12:250–257. doi: 10.1097/01.gme.0000146108.27840.d9? [DOI] [PubMed] [Google Scholar]
- 9.Kroenke CH Caan BJ Stefanick ML, et al. Effects of a dietary intervention and weight change on vasomotor symptoms in the Women's Health Initiative. Menopause 2012;19:980–988. doi: 10.1097/gme.0b013e31824f606e [DOI] [PMC free article] [PubMed] [Google Scholar]
- 10.Franco OH Chowdhury R Troup J, et al. Use of plant-based therapies and menopausal symptoms: a systematic review and meta-analysis. JAMA 2016;315:2554–2563. doi: 10.1001/jama.2016.8012 [DOI] [PubMed] [Google Scholar]
- 11.Sarri G, Pedder H, Dias S, Guo Y, Lumsden MA. Vasomotor symptoms resulting from natural menopause: a systematic review and network meta-analysis of treatment effects from the National Institute for Health and Care Excellence guideline on menopause. BJOG 2017;124:1514–1523. doi: 10.1111/1471-0528.14619 [DOI] [PubMed] [Google Scholar]
- 12.Taku M, Melby MK, Kronenberg F, Kurzer MS, Messina M. Extracted or synthesized soybean isoflavones reduce menopausal hot flash frequency and severity: systematic review and meta-analysis of randomized controlled trials. Menopause 2012;19:776–790. doi: 10.1097/gme.0b013e3182410159 [DOI] [PubMed] [Google Scholar]
- 13.Setchell KDR, Cole SJ. Method of defining equol-producer status and its frequency among vegetarians. J Nutr 2006;136:2188–2193. doi: 10.1093/jn/136.8.2188 [DOI] [PubMed] [Google Scholar]
- 14.Wu GD Compher C Chen EZ, et al. Comparative metabolomics in vegans and omnivores reveal constraints on diet-dependent gut microbiota metabolite production. Gut 2016;65:63–72. doi: 10.1136/gutjnl-2014-308209 [DOI] [PMC free article] [PubMed] [Google Scholar]
- 15.Setchell KD, Brown NM, Lydeking-Olsen E. The clinical importance of the metabolite equol-a clue to the effectiveness of soy and its isoflavones. J Nutr 2002;132:3577–3584. doi: 10.1093/jn/132.12.3577 [DOI] [PubMed] [Google Scholar]
- 16.Barnard ND Kahleova H Holtz DN, et al. The Women's Study for the Alleviation of Vasomotor Symptoms (WAVS): a randomized, controlled trial of a plant-based diet and whole soybeans for postmenopausal women. Menopause 2021;28:1150–1156. doi: 10.1097/GME.0000000000001 [DOI] [PMC free article] [PubMed] [Google Scholar]
- 17.Hagströmer M, Oja P, Sjöström M. The International Physical Activity Questionnaire (IPAQ): a study of concurrent and construct validity. Public Health Nutr 2006;9:755–762. doi: 10.1079/phn2005898 [DOI] [PubMed] [Google Scholar]
- 18.Hilditch JR, Lewis J, Peter A. A Menopause-Specific Quality of Life questionnaire: development and psychometric properties. Maturitas 1996;24:161–175. doi: 10.1016/s0378-5122(96)82006-8 [DOI] [PubMed] [Google Scholar]
- 19.Lewis JE, Hilditch JR, Wong CJ. Further psychometric property development of the Menopause. Specific Quality of Life questionnaire and development of a modified version, MENQOL-Intervention questionnaire. Maturitas 2005;50:209–221. doi: 10.1016/j.maturitas.2004.06.015 [DOI] [PubMed] [Google Scholar]
- 20.Setchell KDR, Cole SJ. Variations in isoflavone levels in soy foods and soy protein isolates and issues related to isoflavone databases and food labeling. J Agric Food Chem 2003;51:4146–4155. doi: 10.1021/jf026199b [DOI] [PubMed] [Google Scholar]
- 21.Setchell KDR Clerici C Lephart ED, et al. S-equol, a potent ligand for estrogen receptor-beta, is the exclusive enantiomeric form of the soy isoflavone metabolite produced by intestinal bacterial flora. Am J Clin Nutr 2005;81:1072–1079. doi: 10.1093/ajcn/81.5.1072 [DOI] [PubMed] [Google Scholar]
- 22.Setchell KDR Brown NM Summer SS, et al. Dietary factors influence production of the soy isoflavone metabolite S-(−)equol in healthy adults. J Nutr 2013;143:1950–1958. doi: 10.3945/jn.113.179564 [DOI] [PMC free article] [PubMed] [Google Scholar]
- 23.Rose DP, Goldman M, Connolly JM, Strong LE. High-fiber diet reduces serum estrogen concentrations in premenopausal women. Am J Clin Nutr 1991;54:520–525. doi: 10.1093/ajcn/54.3.520 [DOI] [PubMed] [Google Scholar]
- 24.Goldin BR Woods MN Spiegelman DL, et al. The effect of dietary fat and fiber on serum estrogen concentrations in premenopausal women under controlled dietary conditions. Cancer 1994;74(3 Suppl):1125–1131. doi: 10.1002/1097-0142(19940801)74:3+<1125::aid-cncr2820741521>3.0.co;2-5 [DOI] [PubMed] [Google Scholar]
- 25.Bagga D Ashley JM Geffrey SP, et al. Effects of a very low fat, high fiber diet on serum hormones and menstrual function. Implications for breast cancer prevention. Cancer 1995;76:2491–2496. doi: 10.1002/1097-0142(19951215)76:12<2491::aid-cncr2820761213>3.0.co;2-r [DOI] [PubMed] [Google Scholar]
- 26.Wakai K Egami I Kato K, et al. Dietary intake and sources of isoflavones among Japanese. Nutr Cancer 1999;33:139–145. doi: 10.1207/S15327914NC330204 [DOI] [PubMed] [Google Scholar]
- 27.Chen Z Zheng W Custer LJ, et al. Usual dietary consumption of soy foods and its correlation with the excretion rate of isoflavonoids in overnight urine samples among Chinese women in Shanghai. Nutr Cancer 1999;33:82–87. doi: 10.1080/01635589909514752 [DOI] [PubMed] [Google Scholar]
- 28.Pachman DR Loprinzi CL Novotny PJ, et al. Sternal skin conductance: a reasonable surrogate for hot flash measurement? Menopause 2013;20:1164–1168. doi: 10.1097/GME.0b013e31828cec53 [DOI] [PMC free article] [PubMed] [Google Scholar]
- 29.Fu P, Matthews K, Thurston RC. How well do different measurement modalities estimate the number of vasomotor symptoms? Findings from the Study of Women's Health Across the Nation FLASHES Study. Menopause 2014;21:124–130. doi: 10.1097/GME.0b013e318295a3b9 [DOI] [PMC free article] [PubMed] [Google Scholar]
- 30.Carpenter JS, Andrykowski MA, Freedman RR, Munn R. Feasibility and psychometrics of an ambulatory hot flash monitoring device. Menopause 1999;6:209–215. doi: 10.1097/00042192-199906030-00006 [DOI] [PubMed] [Google Scholar]
- 31.Melina V, Craig W, Levin S. Position of the Academy of Nutrition and Dietetics: vegetarian diets. J Acad Nutr Diet 2016;116:1970–1980. doi: 10.1016/j.jand.2016.09.025 [DOI] [PubMed] [Google Scholar]
- 32.Barnard ND, Scialli AR, Bertron P, Hurlock D, Edmonds K. Acceptability of a therapeutic low-fat, vegan diet in premenopausal women. J Nutr Educ 2000;32:314–319. doi: 10.1016/S0022-3182(00)70590-5 [DOI] [Google Scholar]
- 33.Barnard ND, Scialli AR, Turner-McGrievy GM, Lanou AJ. Acceptability of a low-fat vegan diet compares favorably to a step II diet in a randomized, controlled trial. J Cardiopulm Rehabil 2004;24:229–235. doi: 10.1097/00008483-200407000-00004 [DOI] [PubMed] [Google Scholar]
- 34.Barnard ND Gloede L Cohen J, et al. A low-fat vegan diet elicits greater macronutrient changes, but is comparable in adherence and acceptability, compared with a more conventional diabetes diet among individuals with type 2 diabetes. J Am Diet Assoc 2009;109:263–272. doi: 10.1016/j.jada.2008.10.049 [DOI] [PMC free article] [PubMed] [Google Scholar]
- 35.Wu AH, Yu MC, Tseng CC, Pike MC. Epidemiology of soy exposures and breast cancer risk. Br J Cancer 2008;98:9–14. doi: 10.1038/sj.bjc.6604145 [DOI] [PMC free article] [PubMed] [Google Scholar]