Abstract
Sphingolipids are essential lipids in eukaryotic membranes. In humans, the first and rate-limiting step of sphingolipid synthesis is catalyzed by the serine palmitoyltransferase holocomplex, which consists of catalytic components (SPTLC1 and SPTLC2), and regulatory components (ssSPTa and ORMDL3). However, the assembly, substrate processing, and regulation of the complex are unclear. Here we present eight cryo-electron microscopy structures of the human serine palmitoyltransferase holocomplex in various functional states at 2.6–3.4 Å resolution. The structures reveal not only how catalytic components recognize the substrate, but also how regulatory components modulate the substrate binding tunnel to control enzyme activity: ssSPTa engages SPTLC2 and shapes the tunnel to determine substrate specificity. ORMDL3 blocks the tunnel and competes with substrate binding through its N-terminus. These findings provide mechanistic insights into sphingolipid biogenesis governed by the serine palmitoyltransferase complex.
Editor summary:
Cryo-EM structures of the enzyme complexes catalyzing the rate-limiting step in sphingolipid synthesis reveal mechanisms of substrate recognition and modulation by regulatory subunits.
Introduction
Sphingolipids are one of the major membrane lipids in mammalian cells. They are involved in a wide spectrum of cellular functions such as cell growth, adhesion, migration, and death1. Defects in sphingolipid metabolism are often associated with cancers and neurodegenerative diseases2–4. The production of sphingolipid in cells is a highly regulated process1. One key enzyme of the sphingolipid biogenesis is serine palmitoyltransferase. It catalyzes the first and the rate-limiting step of the synthesis pathway, converting serine and palmitoyl-CoA into a sphingolipid precursor 3-keto-sphinganine (Fig. 1a)5. In addition to palmitoyl-CoA, it can also use other acyl-CoAs as substrates. Serine palmitoyltransferase is an essential protein for the survival of mammals6. In humans, mutations in serine palmitoyltransferase are linked to hereditary sensory neuropathy type 1 (HSAN1) and early onset amyotrophic lateral sclerosis (ALS)7–17. Serine palmitoyltransferase is also considered as a target for cancer and diabetes therapy18–20.
Fig. 1.
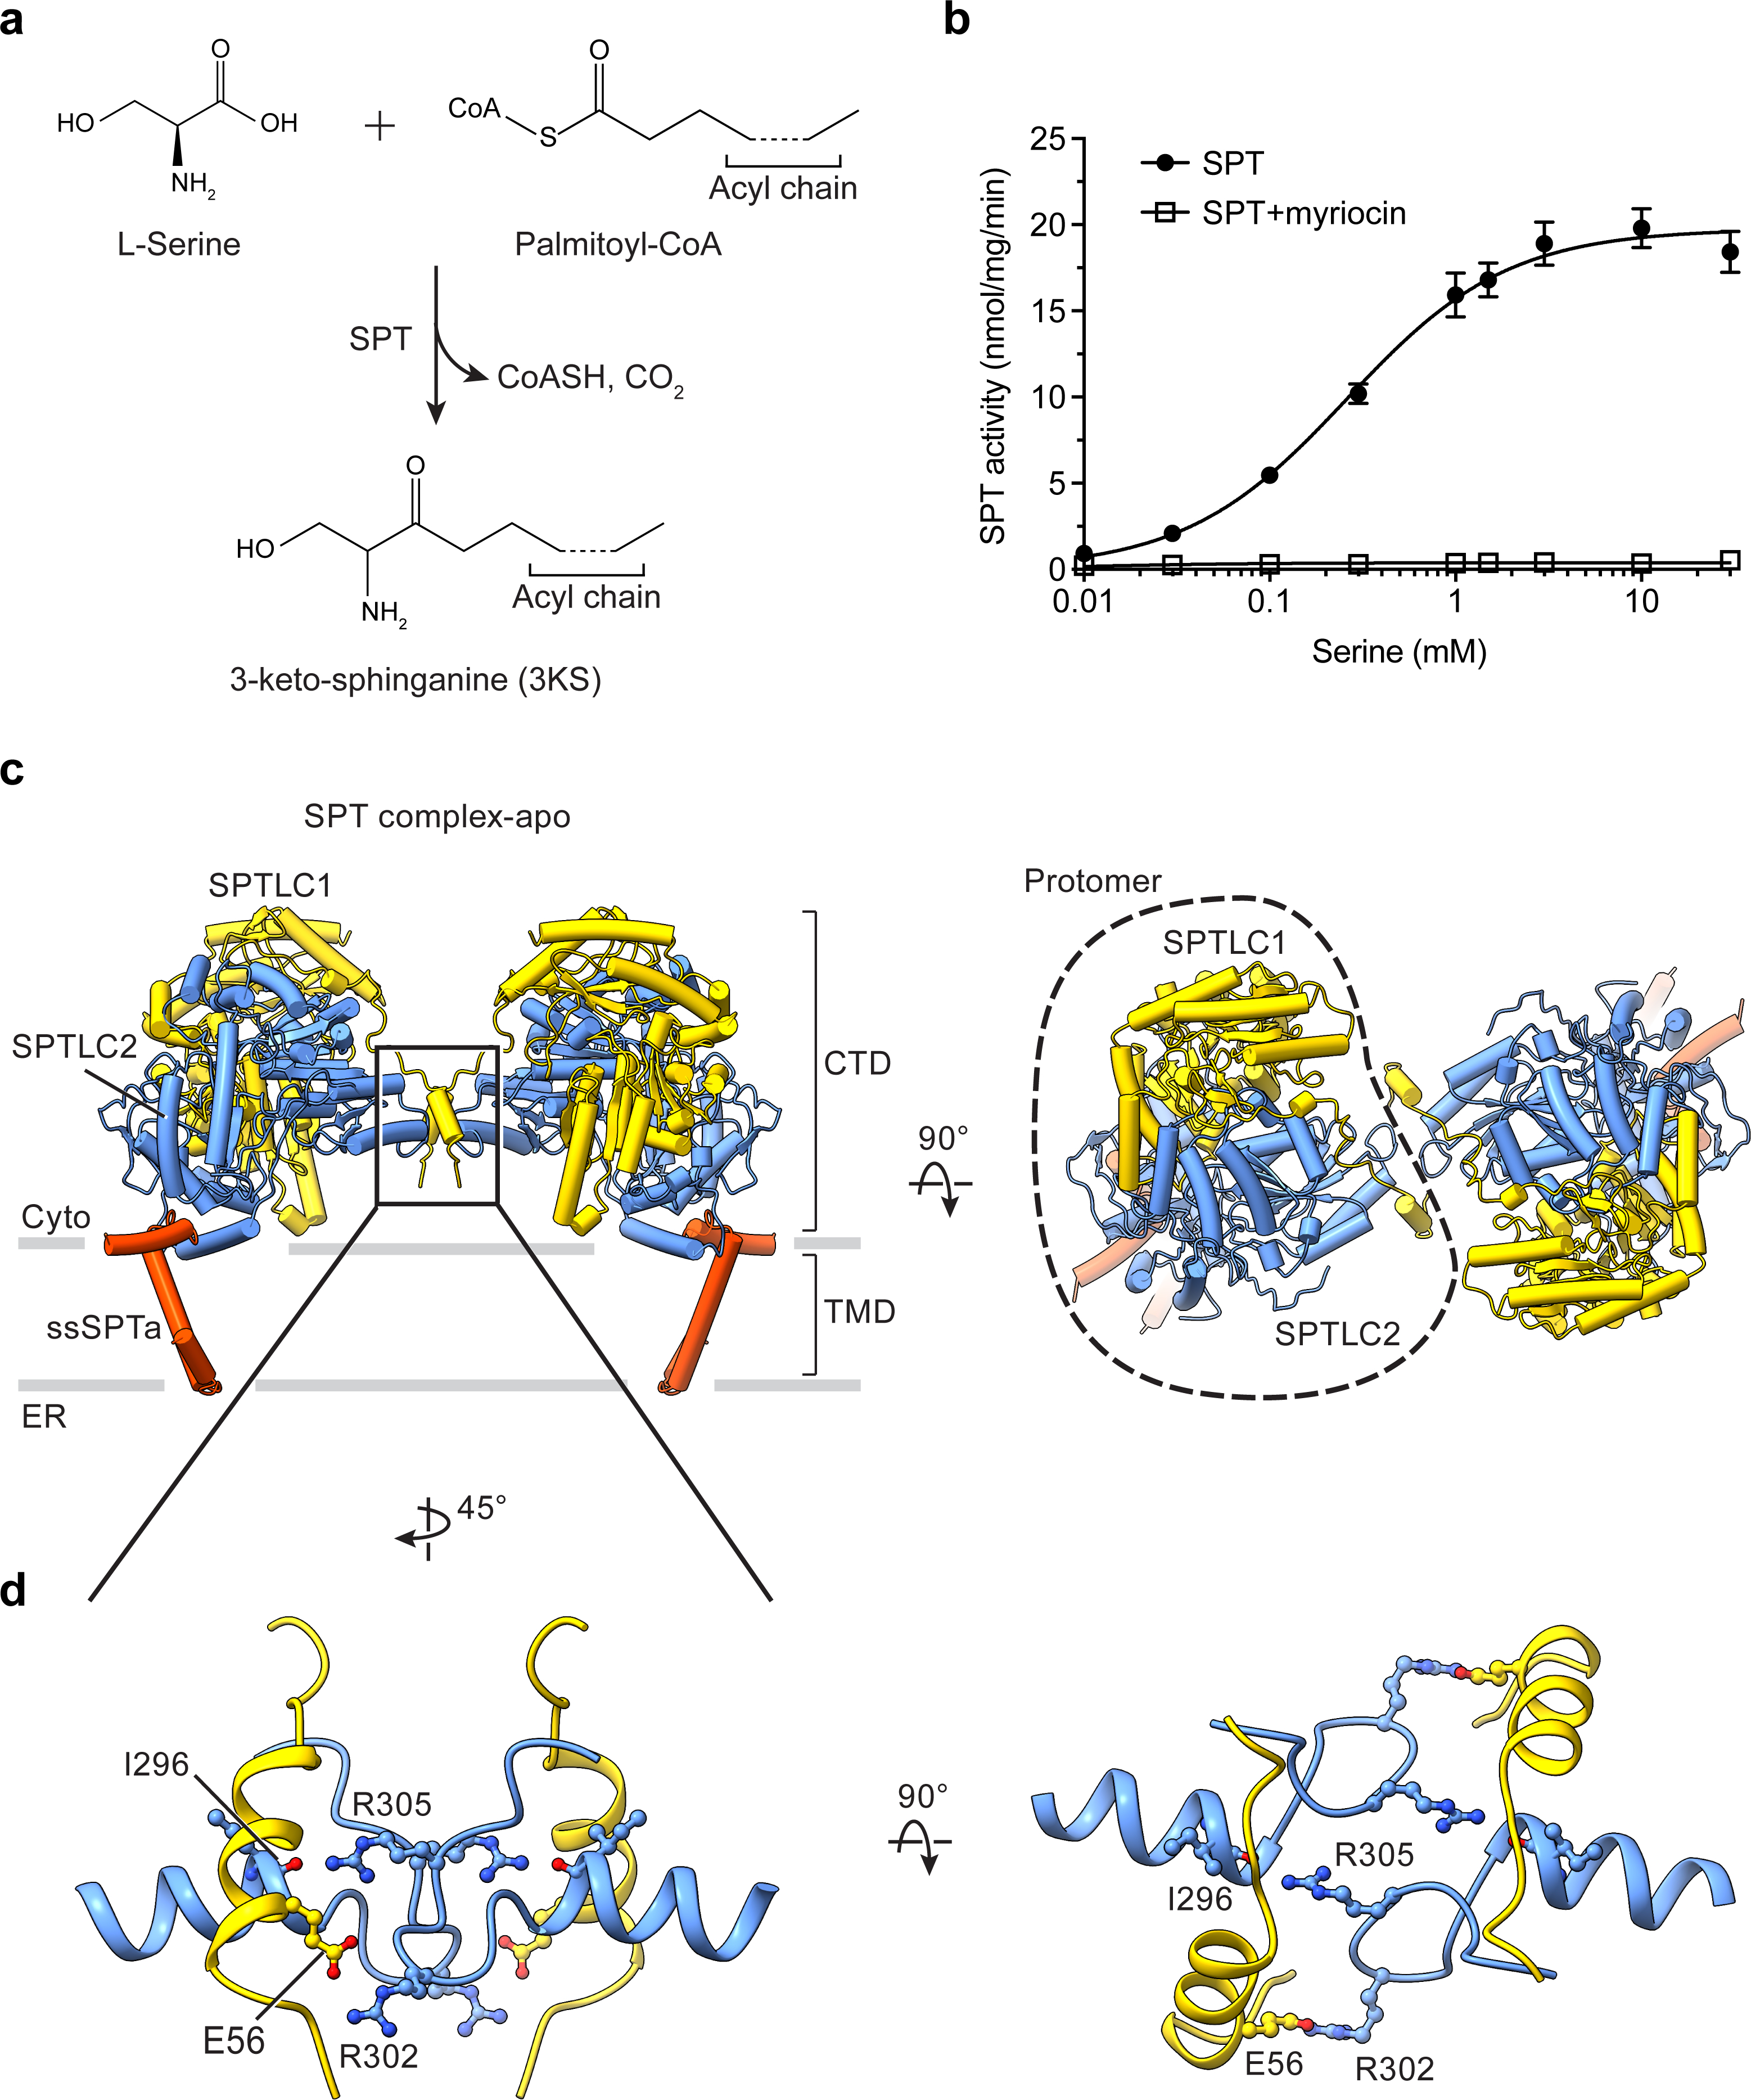
Function and architecture of the human SPT complex.
(a) Reaction catalyzed by human serine palmitoyltransferase (SPT). (b) Activity of the purified SPT complex determined using a fluorescence-based assay. The specific activity of the SPT complex is 19.8 nmol/mg/min at saturating conditions and the KM is 0.26 mM (mean ± SD; n = 3 to 6). The SPT activity is inhibited by myriocin. (c) Overall structure of the SPT complex, viewed parallel to the membrane (left) or from the cytosolic side (right). SPTLC1, SPTLC2, and ssSPTa are colored yellow, blue and red, respectively. CTD, cytosolic domain. TMD, transmembrane domain. Gray bars represent approximate boundaries of the ER membrane. (d) Dimeric interactions between SPTLC1 and SPTLC2.
Our knowledge of the structure of serine palmitoyltransferase largely comes from studies on bacterial homologs5. Crystal structures of bacterial serine palmitoyltransferases have revealed the enzyme architecture, the active site, and the binding site for serine21–23. However, how the enzyme recognizes the other substrate, palmitoyl-CoA, is still unknown. Moreover, bacterial serine palmitoyltransferases are soluble homo-dimeric proteins. By contrast, eukaryotic serine palmitoyltransferases (known as SPTs) are membrane proteins located in the endoplasmic reticulum and function as a heteromer5,24. The assembly and mechanism of eukaryotic SPTs remain obscure.
Another key difference between eukaryotic SPTs and their bacterial homologs is the observation that they are elaborately regulated by two other membrane protein families that have no homologs in bacteria: ssSPTs (small subunits of SPT) and ORMDLs (orosomucoid-like protein)25–30. SPTs, ssSPTs and ORMDLs are thought to coexist in a large, dynamic protein complex5. ssSPTs determine substrate selectivity and are positive regulators that enhance the SPT activity25,31, whereas ORMDLs are negative regulators that reduce the SPT activity29,30. ORMDLs also sense cellular sphingolipid levels and relieve their inhibition when sphingolipid production is low29,30, making ORMDLs a critical feedback regulator in maintaining sphingolipid homeostasis. Mutations in ssSPTs and ORMDLs alter sphingolipid synthesis and are associated with neurodegeneration32 and asthma33,34. Nevertheless, how ssSPTs and ORMDLs interact with SPTs and how they modulate the enzymatic activity are unclear.
To unveil the molecular basis of enzymatic function and regulation of the SPT–ssSPT–ORMDL complexes, we studied the complexes using single-particle cryo-electron microscopy (cryo-EM). We determined the structures of the human SPT complexes in distinct functional states and show that human SPT complexes have unique structural features that distinguish them from bacterial homologs. Most importantly, our work reveals that ssSPTs and ORMDLs exert their regulatory roles by directly interacting with the substrate binding tunnel, providing mechanistic insights into the regulation of the first and rate-limiting step in sphingolipid biogenesis.
Results
Architecture of the human SPT complex
In humans, there are three SPT isoforms (SPTLC1 to 3) and two ssSPT isoforms (ssSPTa and b)25,27,35–37. We focused on SPTLC1, SPTLC2 and ssSPTa because their functions and biological significance have been more extensively characterized5. We co-expressed these three proteins in mammalian cells and purified the complex (hereafter referred to as SPT). To examine the enzymatic activity of the purified SPT complex, we used a thiol-sensitive fluorescent dye to monitor the release of CoASH from the SPT reaction (Fig. 1a). In the presence of serine and palmitoyl-CoA, a fluorescence increase was observed, indicating productive acyl transfer reaction (Fig. 1b). The SPT complex exhibits a KM of ~0.3 mM for serine, consistent with a previous report38. The activity of the complex (~5.5 nmol/mg/min with 0.1 mM serine, Fig. 1b) is considerably lower than a previously reported value for the hamster SPT complex under similar conditions (136 nmol/mg/min)39, likely due to differences in orthologs or purification procedures, such as the use of different detergents or the addition of exogenous phospholipids in the previous study39. Nevertheless, the purified complex is active and can be repressed by the inhibitor myriocin (Fig. 1b)40,41.
We determined the SPT complex structure in the detergent GDN to 3.1 Å resolution (Fig. 1c and Extended Data Fig. 1). Human SPT forms a dimeric complex, and each protomer resembles the shape of a chicken leg quarter, with the cytosolic region and the membrane region similar to a thigh and a drumstick, respectively (Fig. 1c). One protomer consists of SPTLC1, SPTLC2 and ssSPTa at a 1:1:1 ratio. In the cytosolic region, SPTLC1 and SPTLC2 interact extensively and form a local heterodimer (Fig. 1c) whose arrangement is roughly similar to that of the bacterial serine palmitoyltransferases (Extended Data Fig. 2)21,22. But, unlike the bacterial homologs, SPTLC1 and SPTLC2 further assemble into a dimer-of-dimers (Fig. 1c). The dimeric interface is stabilized by hydrogen bonds between the carbonyl oxygen of SPTLC1 Ile296 and SPTLC2 Arg305, and salt bridges between SPTLC1 Glu56 and SPTLC2 Arg302 (Fig. 1d). Consistently, SPTLC2 Arg302Ala or SPTLC2 Arg305Ala mutations reduce the dimerization propensity (Extended Data Fig. 3a). However, the SPTLC2 Arg302Ala-Arg304Ala-Arg305Ala triple mutant does not impair enzyme activity (Extended Data Fig. 3b, c), suggesting that dimerization may be not required for the catalytic activity. In the transmembrane region we could not observe any transmembrane segments from SPTLC1 or SPTLC2 that were proposed in previous studies5,42,43. These helices appear to be highly flexible and cannot be resolved in the structure. Underneath SPTLC1 and SPTLC2 resides ssSPTa, a small endoplasmic-reticulum-embedded peptide (Fig. 1c). ssSPTa contains one transmembrane helix flanked by two interfacial helices (Extended Data Fig. 1f). Through its interfacial helix on the cytosolic side, ssSPTa interacts exclusively with SPTLC2 but not SPTLC1 (Fig. 1c).
Active site and ligand recognition in the SPT complex
The active sites revealed in the structure highlight the functional differences between SPTLC1 and SPTLC2, and demonstrate that SPTLC2, rather than SPTLC1, is the catalytic subunit of the enzyme complex. This becomes clear when we look at the occupancy of the cofactor pyridoxal 5′-phosphate (PLP) across the SPTLC1–SPTLC2 heteromer. PLP is essential in catalyzing the condensation reaction between serine and an acyl-CoA substrate5. In sharp contrast to bacterial serine palmitoyltransferases which contain two PLPs in a symmetrical homodimer, we found that only one PLP binds to an SPTLC1–SPTLC2 local heteromer (Fig. 2a). PLP resides in a polar pocket through an aldimine linkage to the ε-amino group of SPTLC2 Lys379, and it interacts predominately with residues from SPTLC2 (Fig. 2b). The coordination of the active site is conserved from bacteria to human SPTLC2 (Extended Data Fig. 2d). However, the equivalent residue of SPTLC2 Lys379 in SPTLC1 is mutated into Asn36,44, which likely justifies why SPTLC1 is not able to bind PLP in a similar fashion as SPTLC2. Additionally, the phosphate group of PLP is further stabilized through hydrogen bonding with Ser338 and Ala339 of SPTLC1 (Fig. 2b), suggesting a supportive role of SPTLC1 in PLP binding to SPTLC2. Consistently, it has been reported that phosphorylation on SPTLC1 Tyr164, which is near the PLP site, reduces the enzyme activity45. Modification on this residue may allosterically change the packing of the active site.
Fig. 2.
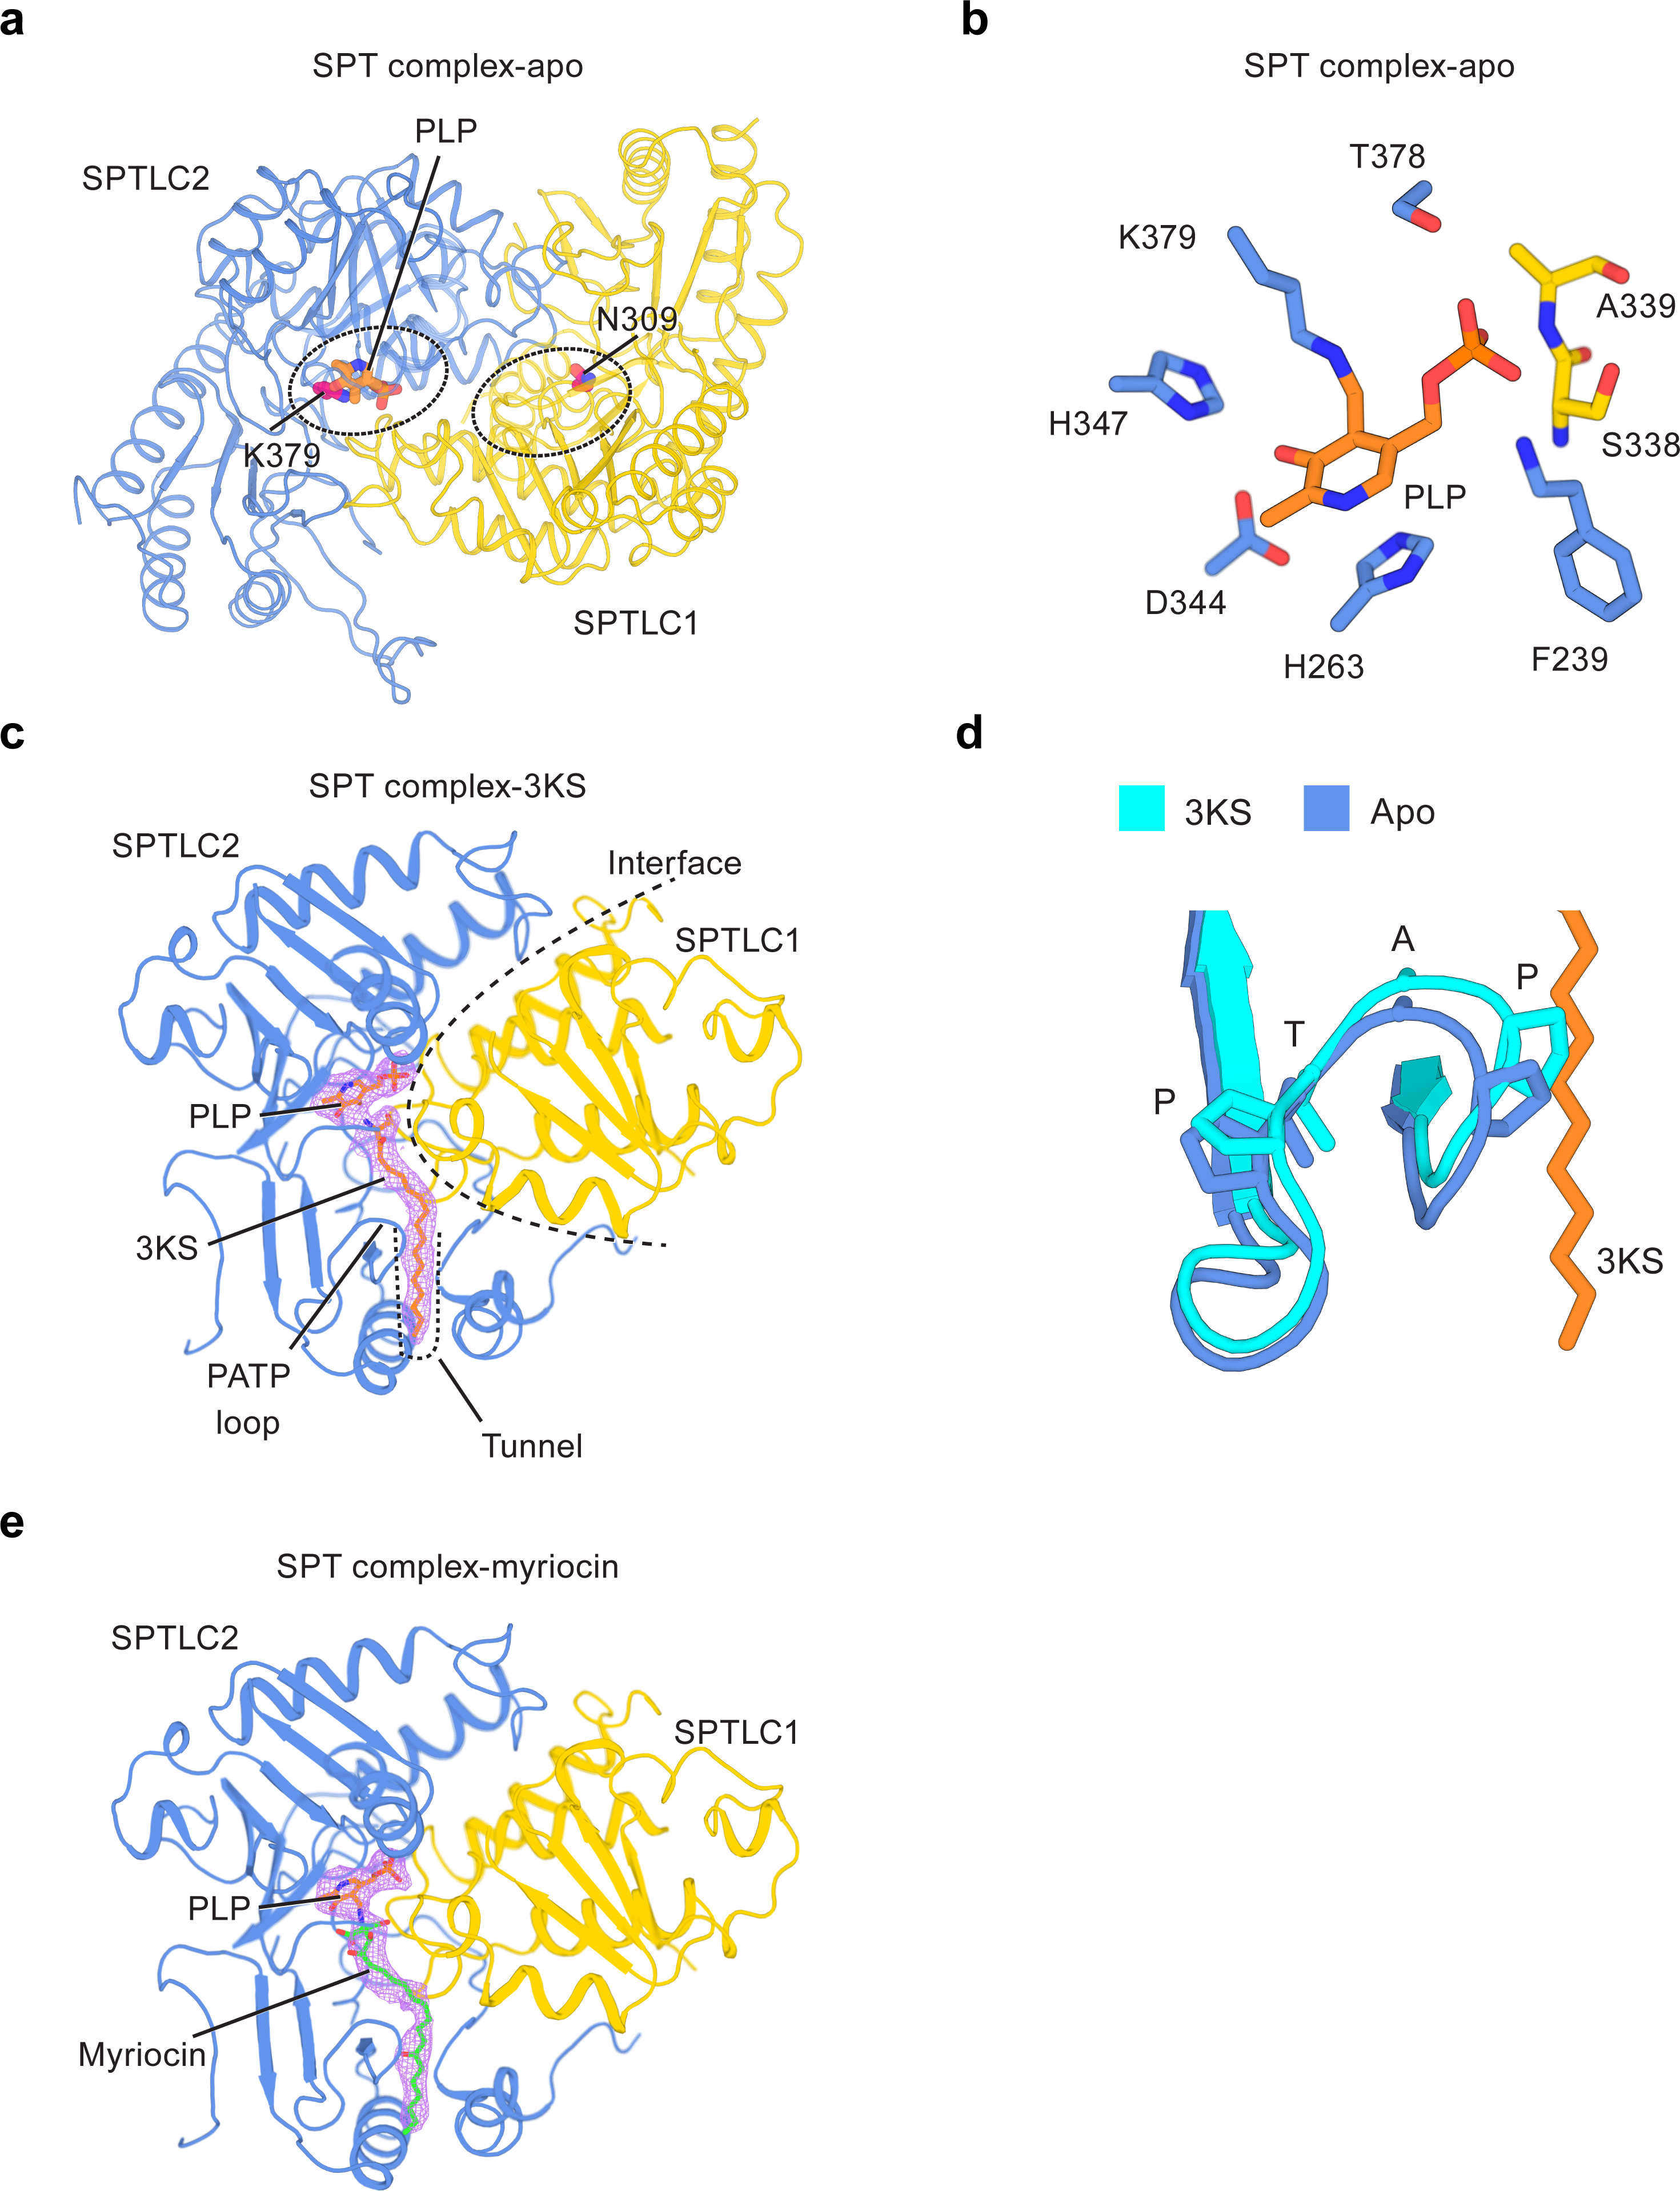
Active site and ligand recognition in the SPT complex.
(a) Active site in the SPTLC1–SPTLC2 heteromer. Lys379 in SPTLC2 and the equivalent residue in SPTLC1, Asn309, are shown as purple sticks. PLP is shown as orange sticks. (b) Coordination of the cofactor PLP. Residues of SPTLC1 (yellow) and SPTLC2 (blue) that interact with PLP are shown as sticks. (c) 3KS binding site. The density of 3KS is shown as light pink mesh. (d) Conformational changes in the PATP loop induced by 3KS binding (orange stick). (e) Myriocin binding site. The density of myriocin is shown as light pink mesh.
SPTs accommodate serine and palmitoyl-CoA, and then condense them into 3-keto-sphinganine (3KS) (Fig. 1a). Studies on bacterial homologs have suggested the binding site for the serine head group of 3KS. However, little is known about how SPTs engage the lipid tail of palmitoyl-CoA or 3KS. To further dissect the ligand recognition mechanism of SPTLCs, we determined an SPT complex structure with 3KS at 2.6 Å resolution (Extended Data Fig. 3a–c). The structure represents a post-catalytic state of the SPT-complex that occurs after acyl transfer reaction. In the presence of 3KS, we observed an unambiguous, elongated density for 3KS that sits close to PLP (Fig. 2c). The serine head group of 3KS is sandwiched between SPTLC1 and SPTLC2, whereas the long acyl chain of 3KS, derived from palmitoyl-CoA, lies in a tunnel formed mainly by SPTLC2 (Fig. 2c and Extended Data Fig. 4g, i). Since 3KS and palmitoyl-CoA share the identical acyl chain, palmitoyl-CoA very likely also binds to this tunnel. Part of the tunnel is surrounded by a loop, which contains a PATP motif (Pro-Ala-Thr-Pro) (Fig. 2c). This motif is highly conserved from bacteria to human SPTLC2, but it is lost in catalytically deficient SPTLC1, suggesting that this region may be crucial to enzyme function. Consistent with this hypothesis, in the presence of 3KS, the PATP loop swings toward 3KS and tightens up the binding site (Fig. 2d).
We also determined an SPT complex structure in the presence of the inhibitor myriocin at 3.4 Å resolution (Fig. 2e and Extended Data Fig. 3d–f). Myriocin is a fungal metabolite with potent antitumor and immunosuppressant activity46,47, and it inhibits the SPT complex by acting as an intermediate mimic to compete with both substrates — serine and palmitoyl-CoA40. Our structure shows that myriocin reacts with PLP to form an external aldimine at the active site (Fig. 2e and Extended Data Fig. 4h, j). The head group of myriocin occupies the region where the serine headgroup of 3KS belongs, and the hydrophobic tail of myriocin inserts into the same tunnel in SPTLC2 that accommodates 3KS (Fig. 2c and 2e). All these features are consistent with the competitive nature of myriocin and support the hypothesis that myriocin mimics an intermediate state of the SPT reaction40,41,48. The structure of SPT-myriocin complex illustrates how the inhibitor lodges into the active site to attack PLP and prevent substrate binding. The overlap between 3KS and myriocin binding site also reinforces our confidence in the accuracy of locating the ligand binding sites in the SPT complex.
Regulation by ssSPT
Dunn and colleagues identified ssSPTs as regulatory components of the SPT complex25,31. ssSPTs not only greatly stimulate the enzymatic activity of SPT, but also regulate its acyl-CoA substrate specificity25,31,49. An SPT complex containing ssSPTa is highly selective for palmitoyl-CoA, whereas a complex containing ssSPTb also uses longer acyl-CoA substrates such as stearoyl-CoA. The use of stearoyl-CoA as substrate generates sphingolipids with a 20-carbon backbone, which have been implicated in neurodegeneration if produced in excess32. It is thus not surprising that the SPT complex needs to be selective for the lengths of acyl-CoA substrates. Nevertheless, although the functional significance of ssSPTs is appreciated, how ssSPTs achieve these functions is unknown.
Our structure suggests that ssSPTa promotes the catalytic activity by stabilizing SPTLC2 (Fig. 3a). In the structure, ssSPTa appears like an L-shaped architectural support bracket: its transmembrane helix is a vertical arm mounted to the membrane, and its N-terminus interfacial helix, which runs parallel to the membrane, serves as a horizontal arm for anchoring SPTLC2. Although SPTLC2 may bind to the membrane via its amphipathic helix (Fig. 1c), the interactions from ssSPTa further affix SPTLC2 to the endoplasmic reticulum (Fig. 3a). Otherwise SPTLC2 may be more likely to diffuse away as it appears to lack transmembrane regions. The membrane localization of SPTLC2 in turn increases its chance of interacting with membrane-integrated SPTLC1, both of which are necessary for the formation of the active site. ssSPTa also shields the hydrophobic surfaces of SPTLC2 from the aqueous environment and thus energetically stabilizes the complex. In line with this observation, when SPTLC1 and SPTLC2 were expressed without ssSPTa, the proteins were not stable and prone to aggregate.
Fig. 3.

Regulation by ssSPTa.
(a) Structure of the SPT complex bound to 3KS, viewed parallel to the membrane. For clarity, only one protomer is shown. The interface between SPTLC2 and ssSPTa is highlighted by a black box. (b and c) Enlarged views of the box area in (a), showing the interactions between ssSPTa and SPTLC2. Met28 (red) of ssSPTa extends into the substrate tunnel to lie near the acyl chain of 3KS (orange stick). (c) is viewed from a different angle and SPTLC2 is shown as a cross-section.
Our structure also elucidates the mechanism for the preference to shorter acyl-chain substrates provided by ssSPTa. We found that the side chain of ssSPTa Met28 protrudes into and seals the substrate binding tunnel in SPTLC2 (Fig. 3b). In the 3KS-bound structure, the Cε methyl group of Met28 is in close proximity to the acyl tail of 3KS (~4 Å) (Fig. 3c). It is clear that binding of any longer substrates, such as stearoyl-CoA, would be energetically disfavored due to steric clashes with Met28. The direct contact between this residue and the substrate explain mechanistically how mutations on ssSPTa Met28 change the substrate preference to longer stearoyl-CoA31. In ssSPTb, this Met is replaced by Val, which has a much smaller side chain and thus allows ssSPTb to accommodate the longer acyl chain of stearoyl-CoA.
Architecture and dynamics of the SPT-ORM complex
We next investigated the role of ORMDLs in modulating SPTLCs. ORMDLs have been reported to reduce the enzymatic activity of SPTLCs26,30. Consistently, knocking out ORMDLs increases the level of sphingolipids in the mouse brain50. In yeast, phosphorylation of ORMDL homologs relieves their inhibitory effect29. These phosphorylation sites, however, are not conserved and human ORMDLs must work in a different manner.
To understand how human ORMDLs regulate the SPT activity, we coexpressed the SPT-complex with human ORMDL3, an isoform whose mutations contribute to asthma and autoimmune diseases33,34,51, and then determined the structure of SPT-ORMDL3 complex (hereafter referred to as SPT-ORM) to 2.9 Å resolution (Fig. 4a and Extended Data Figs. 5a–e, 6). ORMDL3 has four transmembrane helices with both the N- and C- termini in the cytosol (Fig. 4a and Extended Data Fig. 5f, g)52. In the complex, ORMDL3 wedges between ssSPTa and the first transmembrane helix (S1) of SPTLC1 (Fig. 4a). Interestingly, the S1 helix that interacts with ORMDL3 comes from the neighboring protomer. In other words, the SPTLC1 S1 helix is swapped to the opposite side of the complex (Fig. 4a). Interactions from ORMDL3 appear to stabilize the S1 helix (Fig. 4b), as this helix only becomes visible in the SPT-ORM complex, but not in the SPT complex. This ORMDL3–SPTLC S1 interaction is important for the incorporation of ORMDL3 into the complex. When the S1 helix is deleted, the binding of ORMDL3 is largely reduced53, and ORMDL3 regulation is impaired (Extended Data Fig. 7).
Fig. 4.
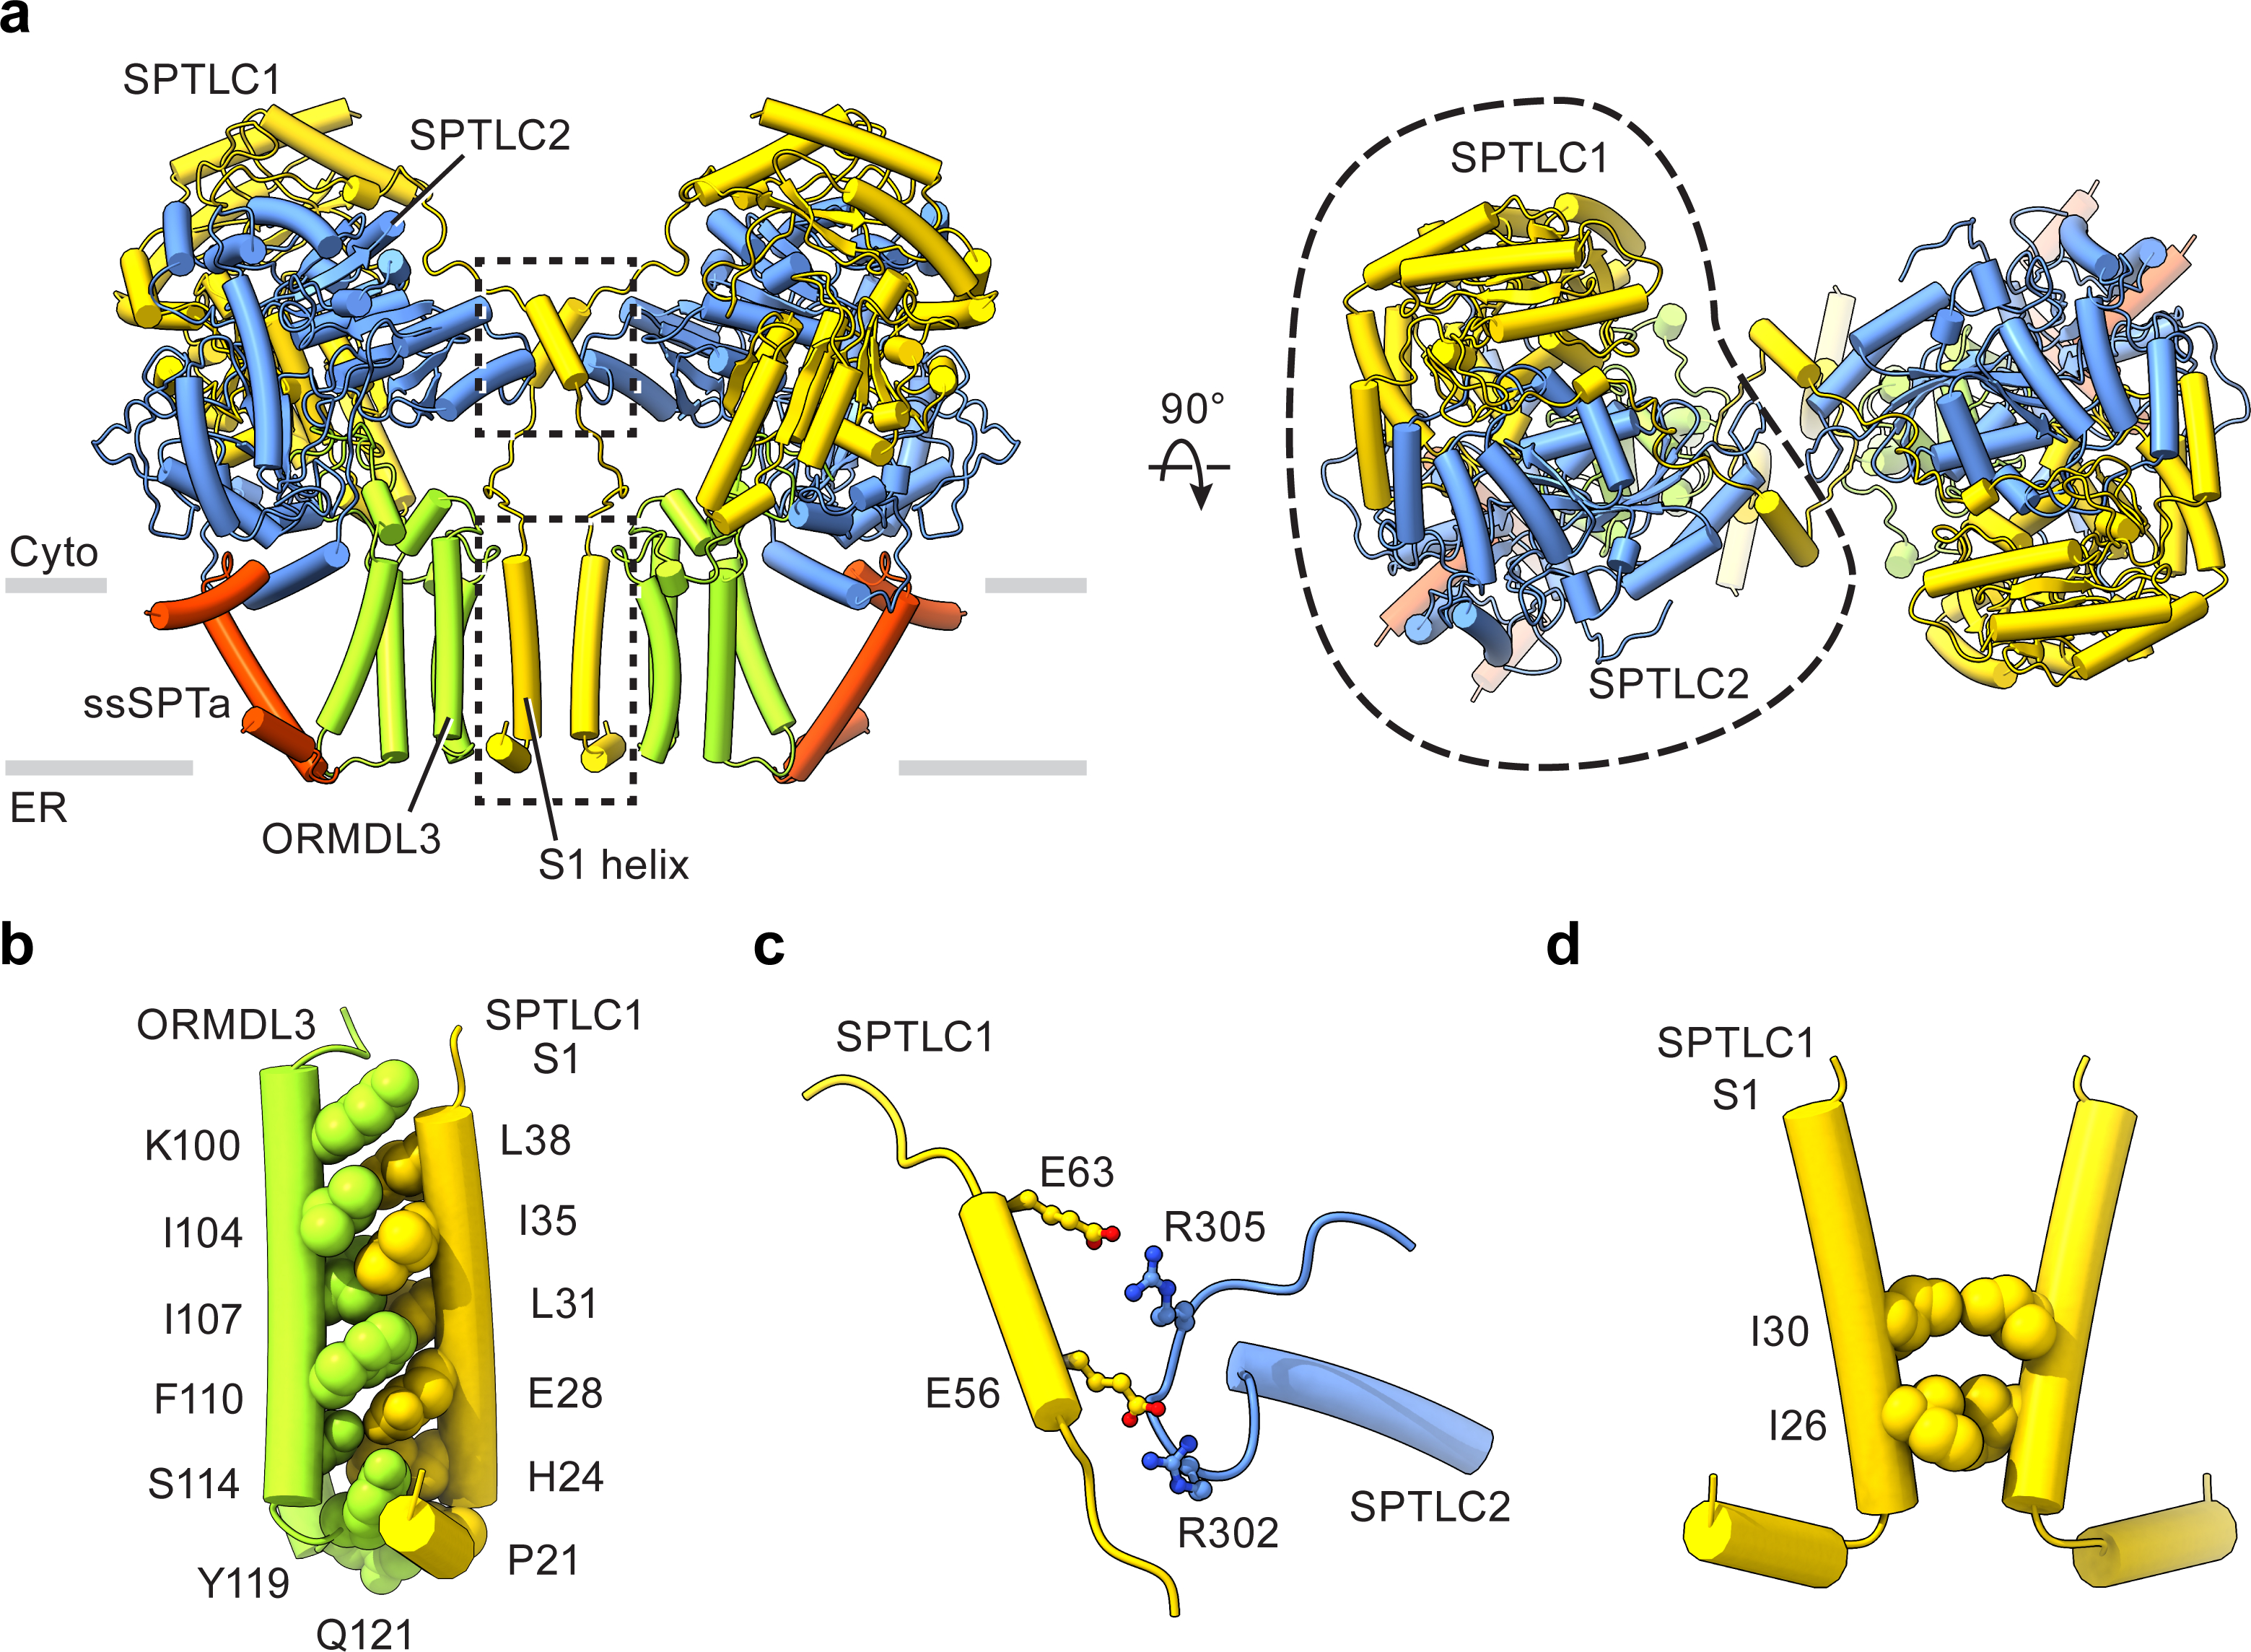
Structure of the human SPT-ORM complex.
(a) Structure of the SPT-ORM complex, viewed parallel to the membrane (left) or from the cytosolic side (right). Gray bars represent approximate boundaries of the ER membrane. The dimeric interfaces are highlighted by two dashed boxes. (b) Interactions between ORMDL3 and the SPTLC1 S1 helix. (c) Enlarged view of the top dashed box area in (a), showing the dimeric interactions between SPTLC1 and SPTLC2 in the cytosol. For clarity, only one SPTLC1 and SPTLC2 are shown. (d) Enlarged view of the bottom dashed box area in (a), showing the dimeric interactions between two SPTLC1 in the membrane.
ORMDL3 also induces new interactions between protomers. In addition to the dimeric interactions between SPTLC1 and SPTLC2 in the cytosol (top dashed box in Fig. 4a, and Fig. 4c), hydrophobic interactions between Ile26 and Ile30 of SPTLC1 S1 helices in the membrane now contribute to the dimerization of the SPT-ORM complex (bottom dashed box in Fig. 4a, and Fig. 4d). However, these dimeric interactions appear to be highly dynamic, as we further observed three other distinct conformations of the SPT-ORM complex through three-dimensional classification (Extended Data Figs. 8, 9). The structures reveal large movements between protomers and subsequent rearrangements of the dimeric interfaces. For example, in one of the conformations SPTLC1 Ile30 moves apart by over 5 Å (Extended Data Fig. 9d, class 3). As a result, the dimeric interactions in the membrane become minimal. The functional consequence of this molecular plasticity remains to be addressed by future experiments. Although we cannot exclude the possibility that the use of detergents increases the protein flexibility, it is tempting to hypothesize that changes in the membrane environment could modulate the complex through perturbing the dimeric interface and thus the stability and catalytic activity of the complex.
Regulation by ORMDL
To address how ORMDL3 regulates the enzyme complex, we compared the SPT and SPT-ORM complex. In the SPT complex, PLP and the substrate-binding site are connected to the cytosol through an opening between SPTLC1 and SPTLC2 (Fig. 5a), suggesting that this opening may serve as an entrance for substrates. When 3KS binds, the opening becomes occluded due to the rearrangement of the PATP loop (Fig. 5b). In the SPT-ORM complex, we found that the N-terminus of ORMDL3 inserts into this opening and blocks this potential substrate entry pathway (Fig. 5c). Furthermore, Met1 of ORMDL3 occupies the same substrate binding tunnel that interacts with the hydrophobic tail of 3KS (Fig. 5b, c). These observations suggest that ORMDL3 suppresses the SPT activity by physically restricting the accessibility of the substrates to their binding sites.
Fig. 5.
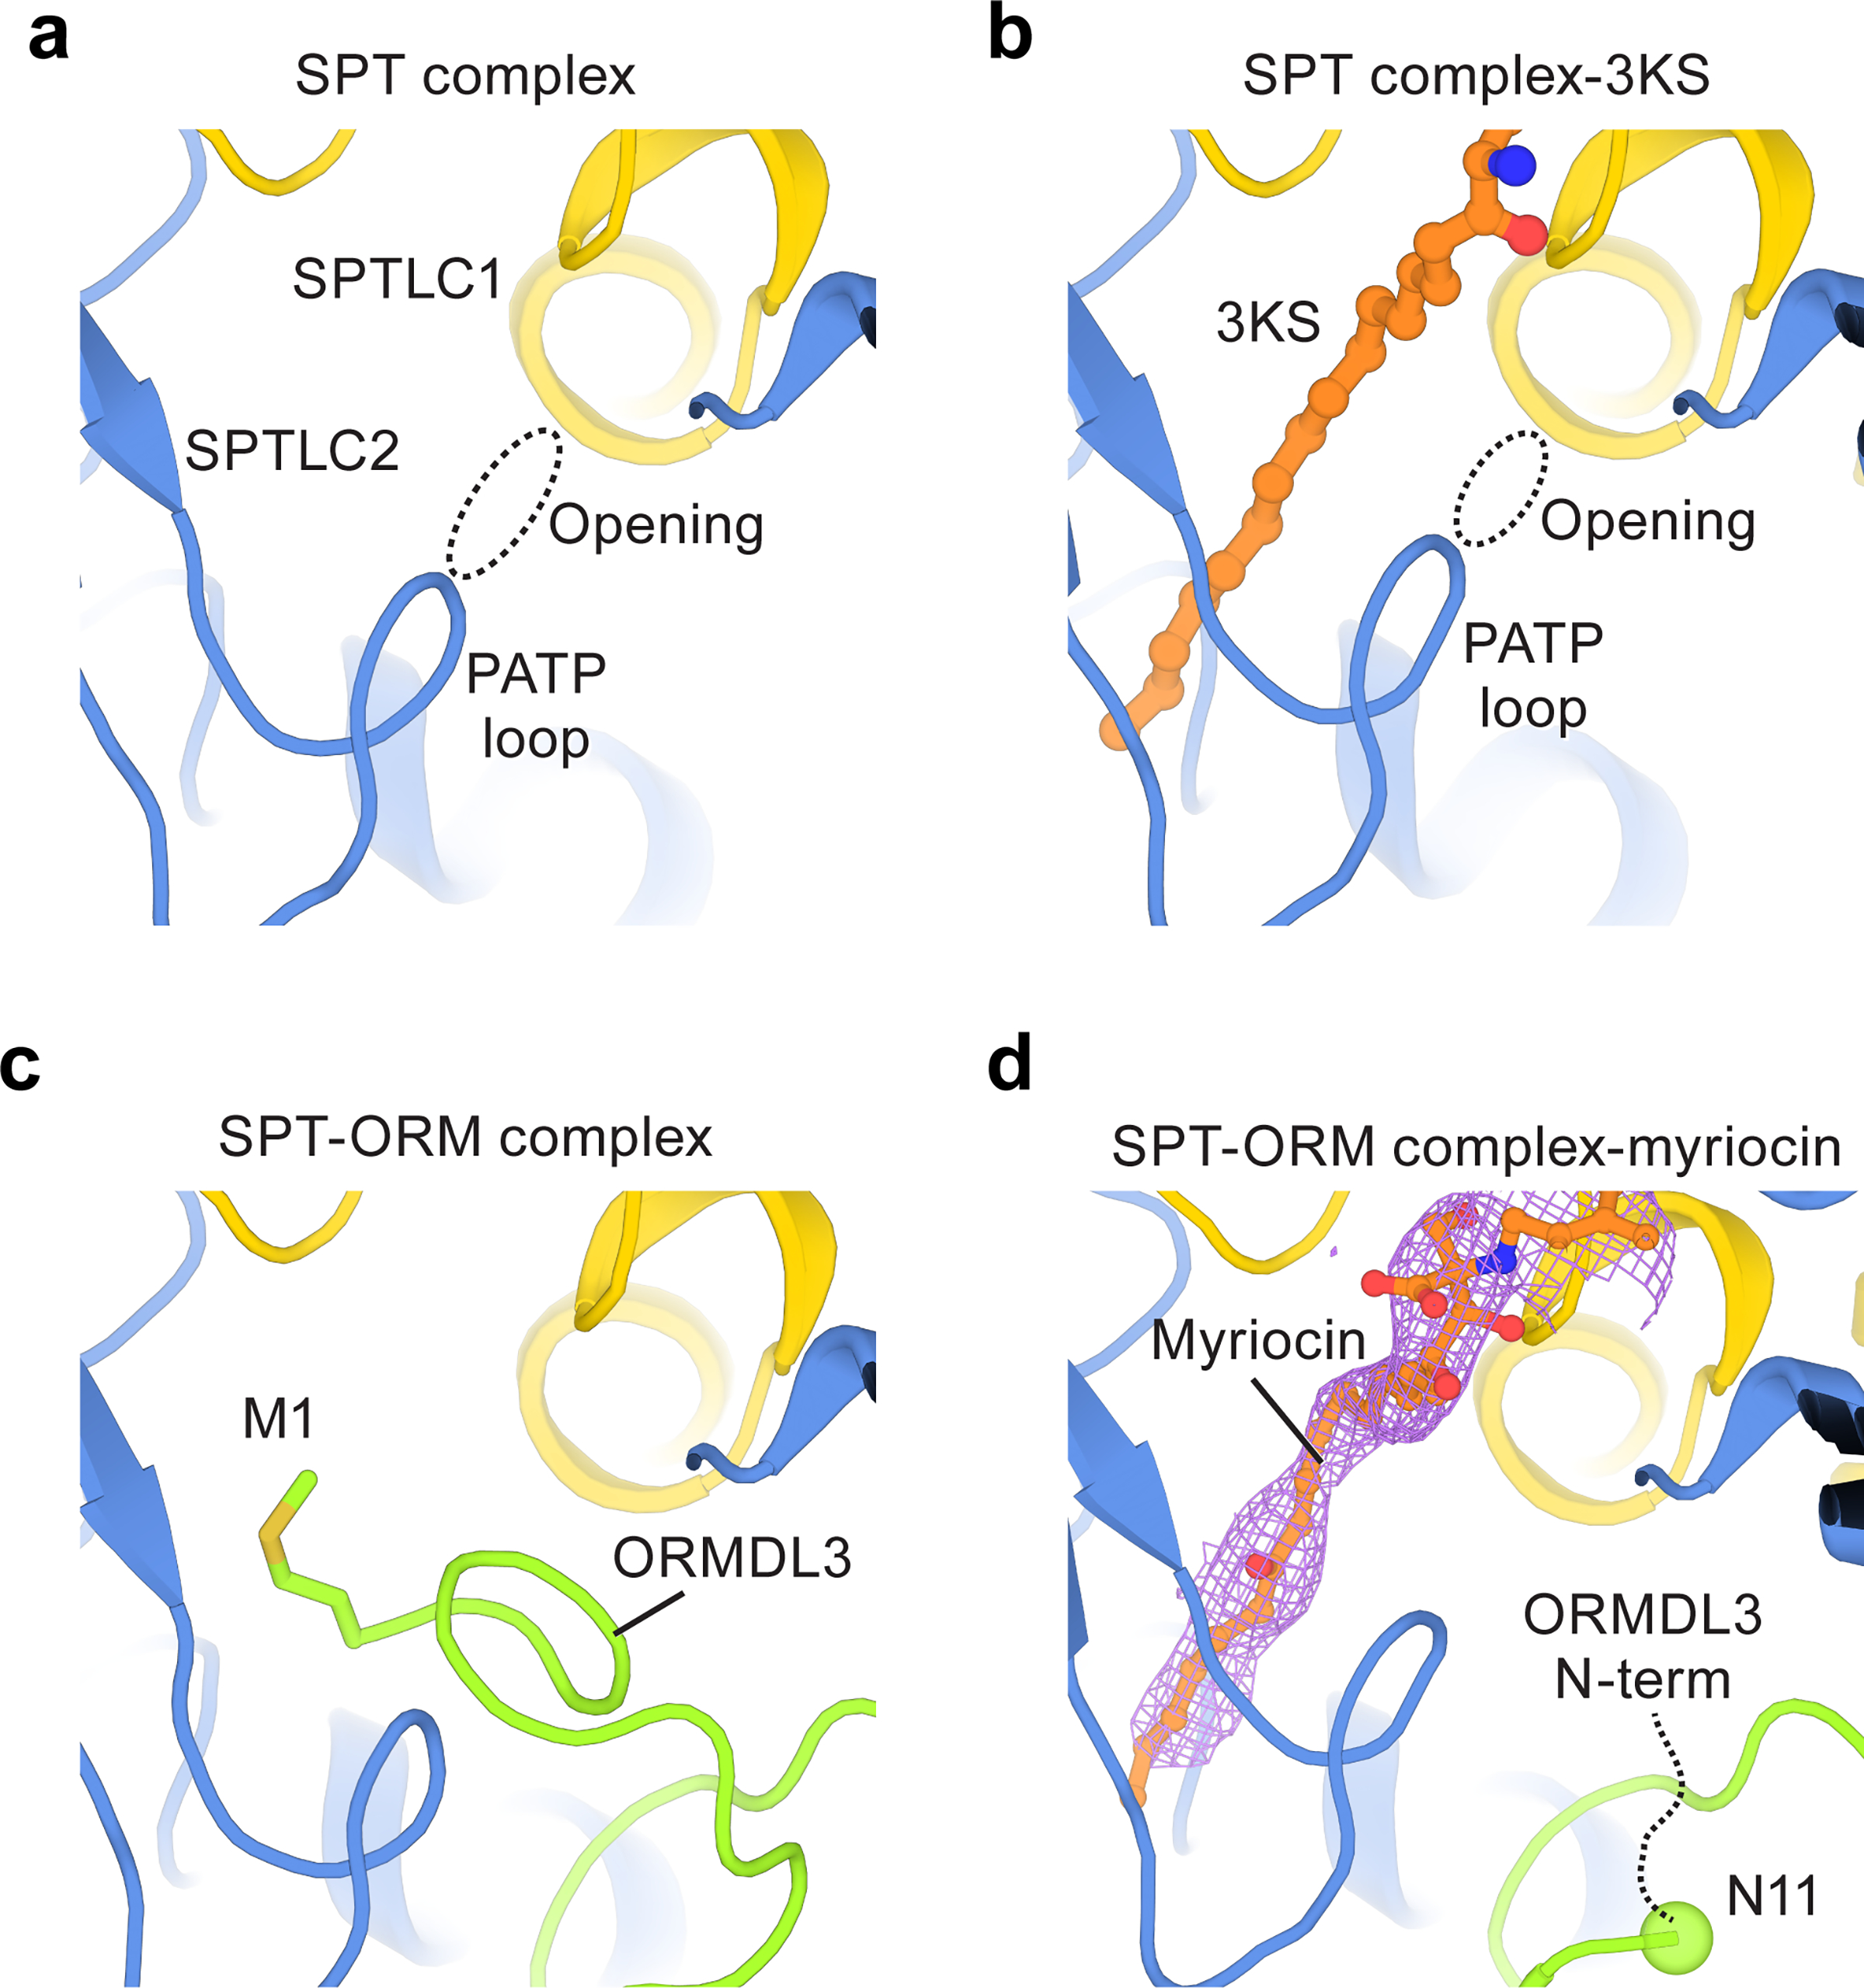
Regulation by ORMDL3.
(a) An opening that potentially allows substrate entry into the active site of the SPT complex. (b) The opening becomes narrower upon 3KS binding. (c) In the SPT-ORM complex, the N-terminus of ORMDL3 blocks the opening and occupies the substrate binding tunnel. Met1 of ORMDL3 binds to the same region as 3KS. (d) When myriocin binds to the substrate tunnel, the N-terminus of ORMDL3 rearranges. The flexible fragment (residues 1–10) of ORMDL3 is represented by a black dashed curve and Asn11 of ORMDL3 is highlighted by a sphere. The density of myriocin is shown as light pink mesh.
It is reported that SPT-ORM could still, although to a lesser extent, condense serine and palmitoyl-CoA, indicating that ORMDL3 does not completely eliminate enzyme activity54,30. This implies that ORMDL3 may adopt different conformations that permit substrate binding. To test this hypothesis, we first tried to capture a 3KS-bound state of the SPT-ORM complex. Nevertheless, we did not observe the 3KS density in the SPT-ORM structure under the same 3KS concentration used for the 3KS-bound SPT structure. It is possible that 3KS could not easily diffuse into the binding pocket in the presence of ORMDL3, or that after binding, 3KS is rapidly displaced by the N-terminus of ORMDL3. We therefore focused on conditions that are more likely to maximize the occupancy of the substrate site, such as in the presence of the higher affinity ligand, myriocin. We were able to capture a myriocin-bound state of the SPT-ORM complex (Extended Data Fig. 10) and found that upon myriocin binding, the N-terminus of ORMDL3 indeed reorients (Fig. 5d). Specifically, the first ten residues of ORMDL3 become too flexible to allow us to build the atomic model, but they obviously no longer plug into the opening between SPTLC1 and SPTLC2. This finding demonstrates that the N-terminus of ORMDL3 is a mobile element, capable of moving away from the opening and allowing substrates to diffuse into the catalytic center.
Discussion
Molecular interpretation of disease mutations
The structures of human SPT and SPT-ORM provide a molecular foundation to interpret mutations related to diseases including HSAN1 and ALS7–17. We mapped missense mutations onto 13 positions of the structure and found that most of the mutations can be categorized into three groups. The first group of mutations clusters around the SPTLC1–SPTLC2 interface and is near the PLP binding site (Fig. 6a). These mutations could likely interrupt the interactions between SPTLC1 and SPTLC2 and they may also interfere with the integrity of the active site. The second group of mutations is located sporadically on SPTLC1 (Fig. 6b). How those mutations allosterically alter the catalytic function requires further study, but they emphasize that SPTLC1, although being catalytically deficient, has profound effects on the enzyme activity. The third group of mutations is particularly interesting. These mutations are on the surface of the protein, far from the catalytic active site (Fig. 6c). Inspection of the SPT-ORM structures shows that all these residues (Ser331Phe, Ser331Tyr, Ile504Phe are HSAN1-assciated, whereas Ala20Ser is ALS-associated) are involved in the packing between SPTLCs and ORMDL3 (Fig. 6c). Therefore, these mutations are likely to disturb the interactions of ORMDL3 and impair its regulation.
Fig. 6.
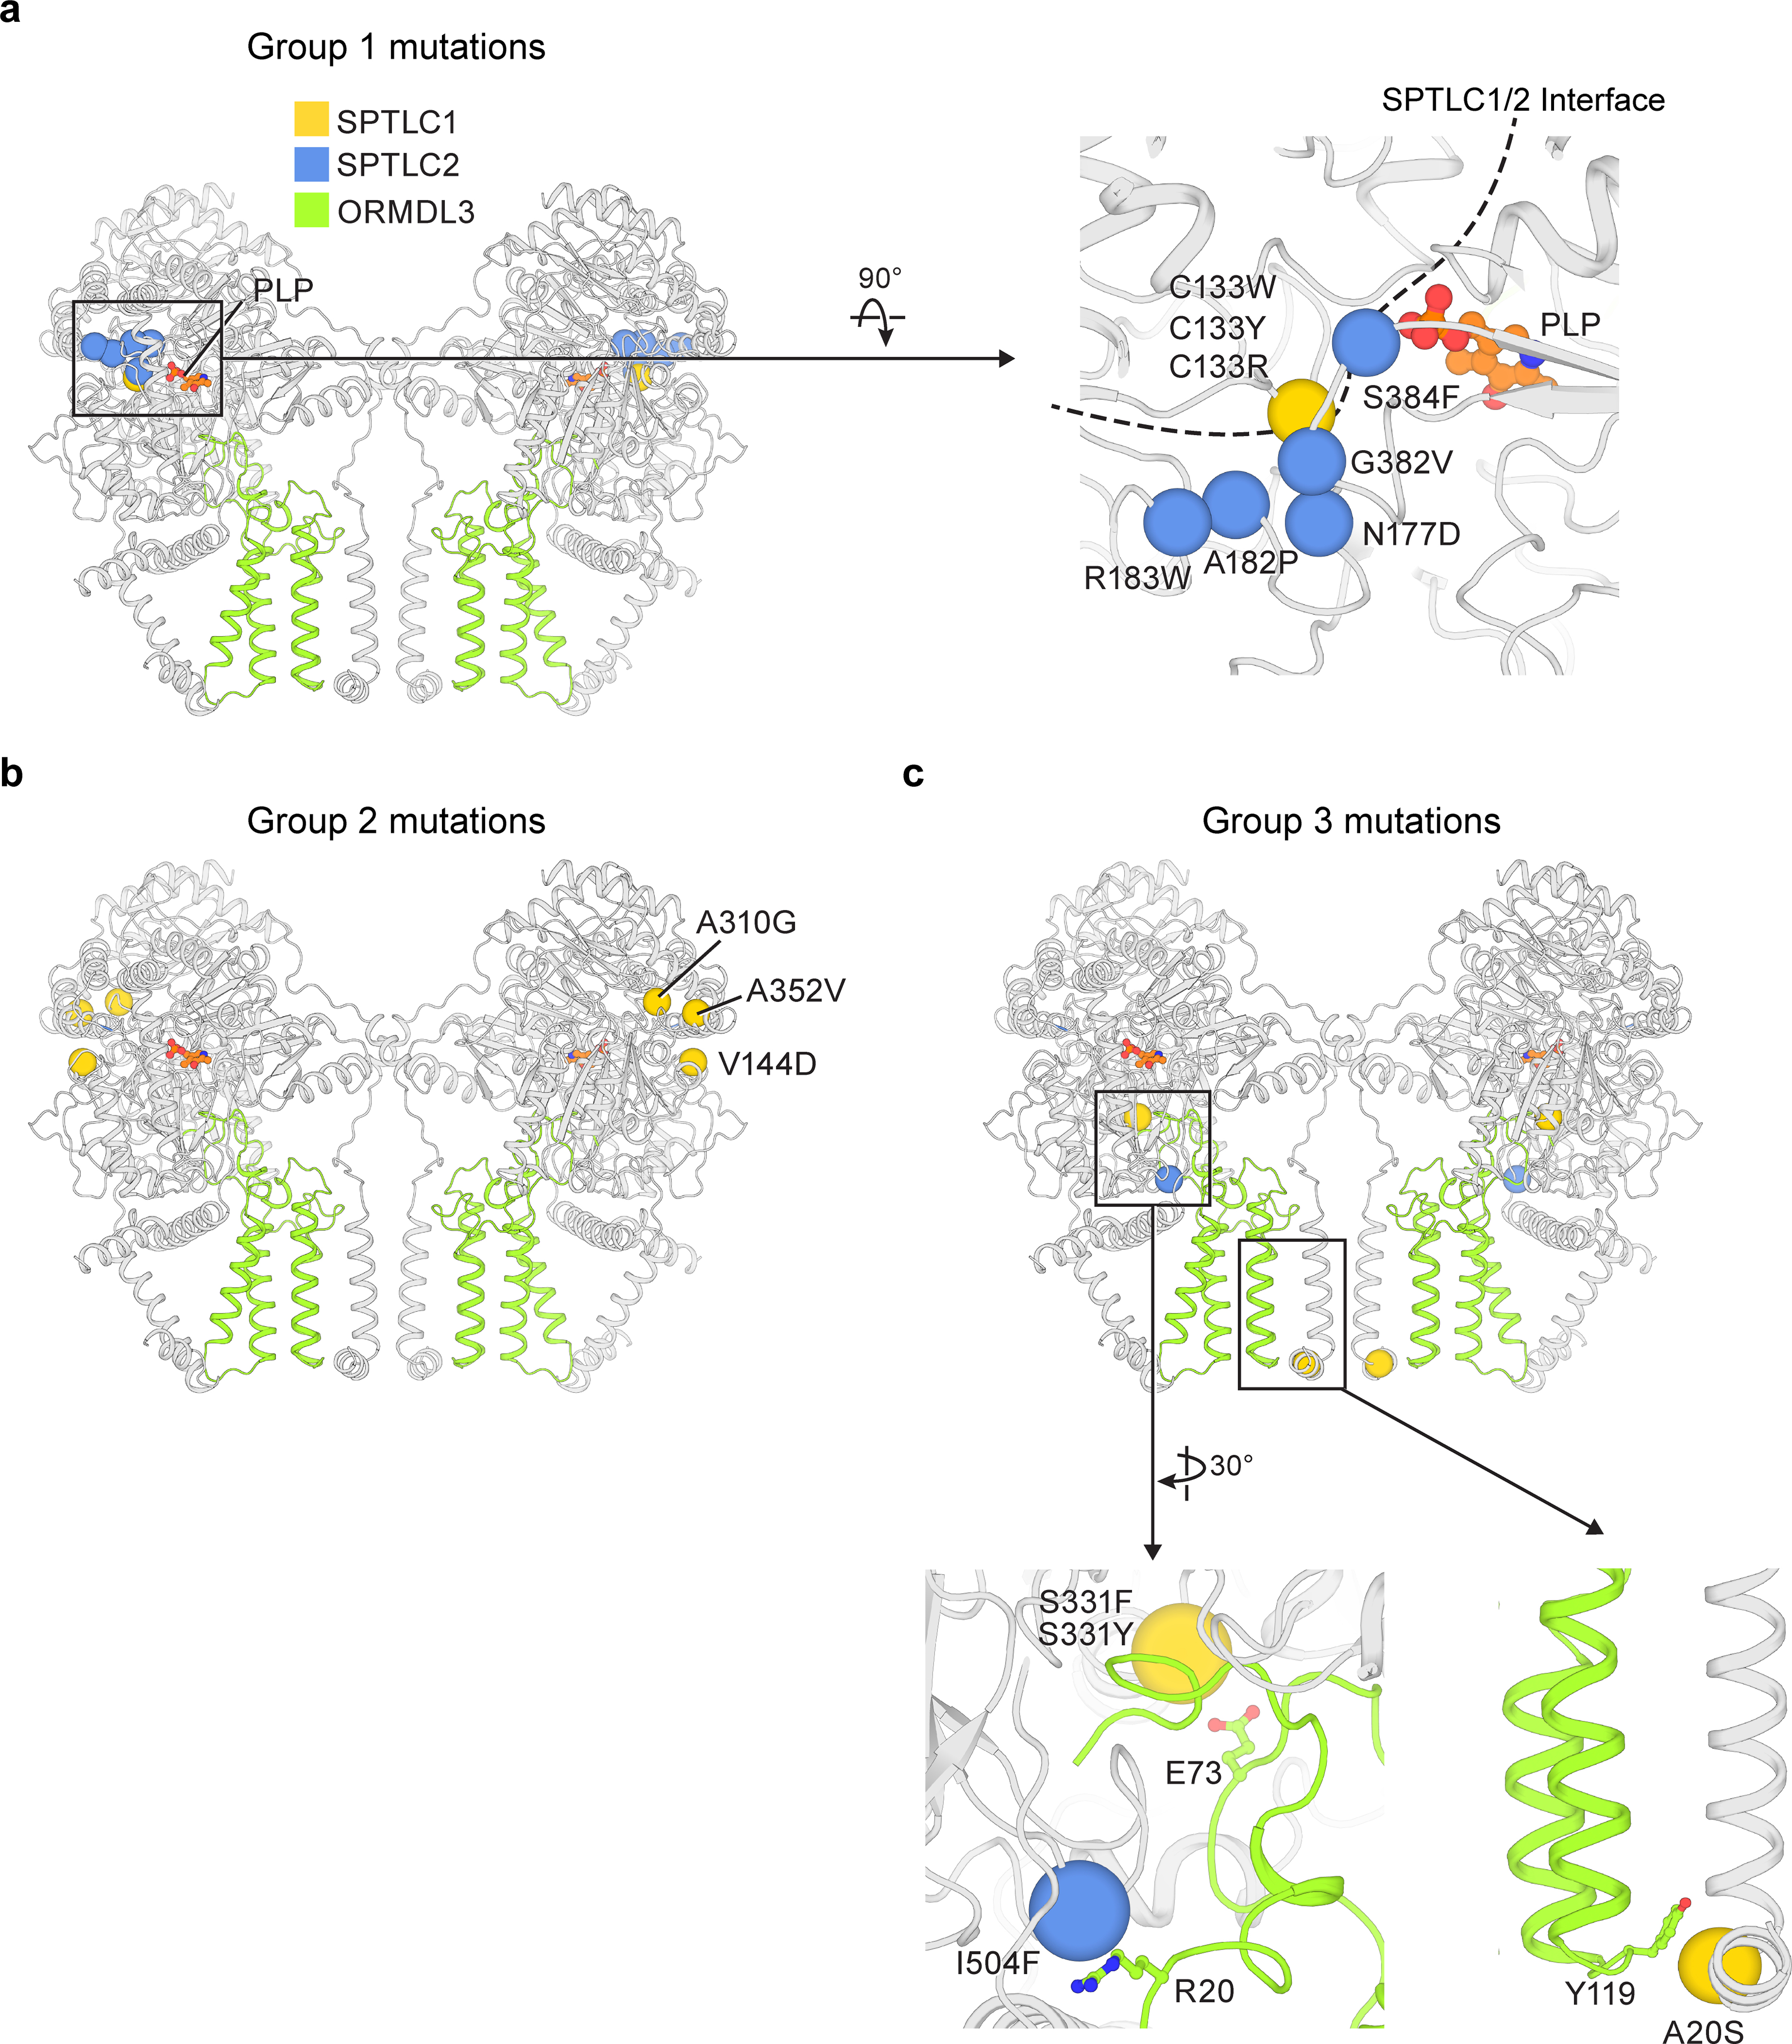
Disease mutations on the SPT-ORM complex
(a) Mutations near the PLP binding site. The Cα locations of disease-causing residues are highlighted as spheres. The structure of SPT-ORM (class 1) is shown. (b) Mutations distributed sporadically on SPTLC1. (c) Mutations located on the interface between SPT and ORM. In the enlarged views, ORMDL3 residues (R20, E73, Y119) that may interact with disease-causing residues are shown as sticks.
Conclusions
This study reveals subunit arrangements and the basis of substrate binding and inhibition in the serine palmitoyltransferase holocomplex. A previous study suggested that the complex is composed of four SPTLC1 subunits and four SPTLC2 and SPTLC3 subunits24. Instead, we showed that there are only two SPTLC1 and two SPTLC2 subunits in the complex. Our structures further explain how ssSPTa and ORMDL3 modulate the enzyme activity (Fig. 7). Both mechanisms are straightforward: (1) ssSPTa physically supports the catalytic subunit SPTLC2. At the same time ssSPTa Met28 crams into the substrate tunnel to select the substrate with different lengths of acyl-chains. (2) ORMDL3 uses its N-terminus to gate the accessibility and occupancy of the substrate tunnel. The structures are supported by a wealth of functional studies and they also open new possibilities for future investigations. For example, it has been proposed that ORMDLs monitor the cellular sphingolipid level by directly binding to ceramide, and adjust their inhibition accordingly to maintain sphingolipid homeostasis26,30,55. We visualized several lipid molecules around ORMDL3 (Extended Data Fig. 5f, g) and these lipid-binding surfaces might contribute to its ceramide sensing ability. Since the SPT-ORM complex is very dynamic (Extended Data Fig. 9), it is possible that ceramide binding could change the mobility of the N-terminus of ORMDL3 to control the substrate accessibility.
Fig. 7.
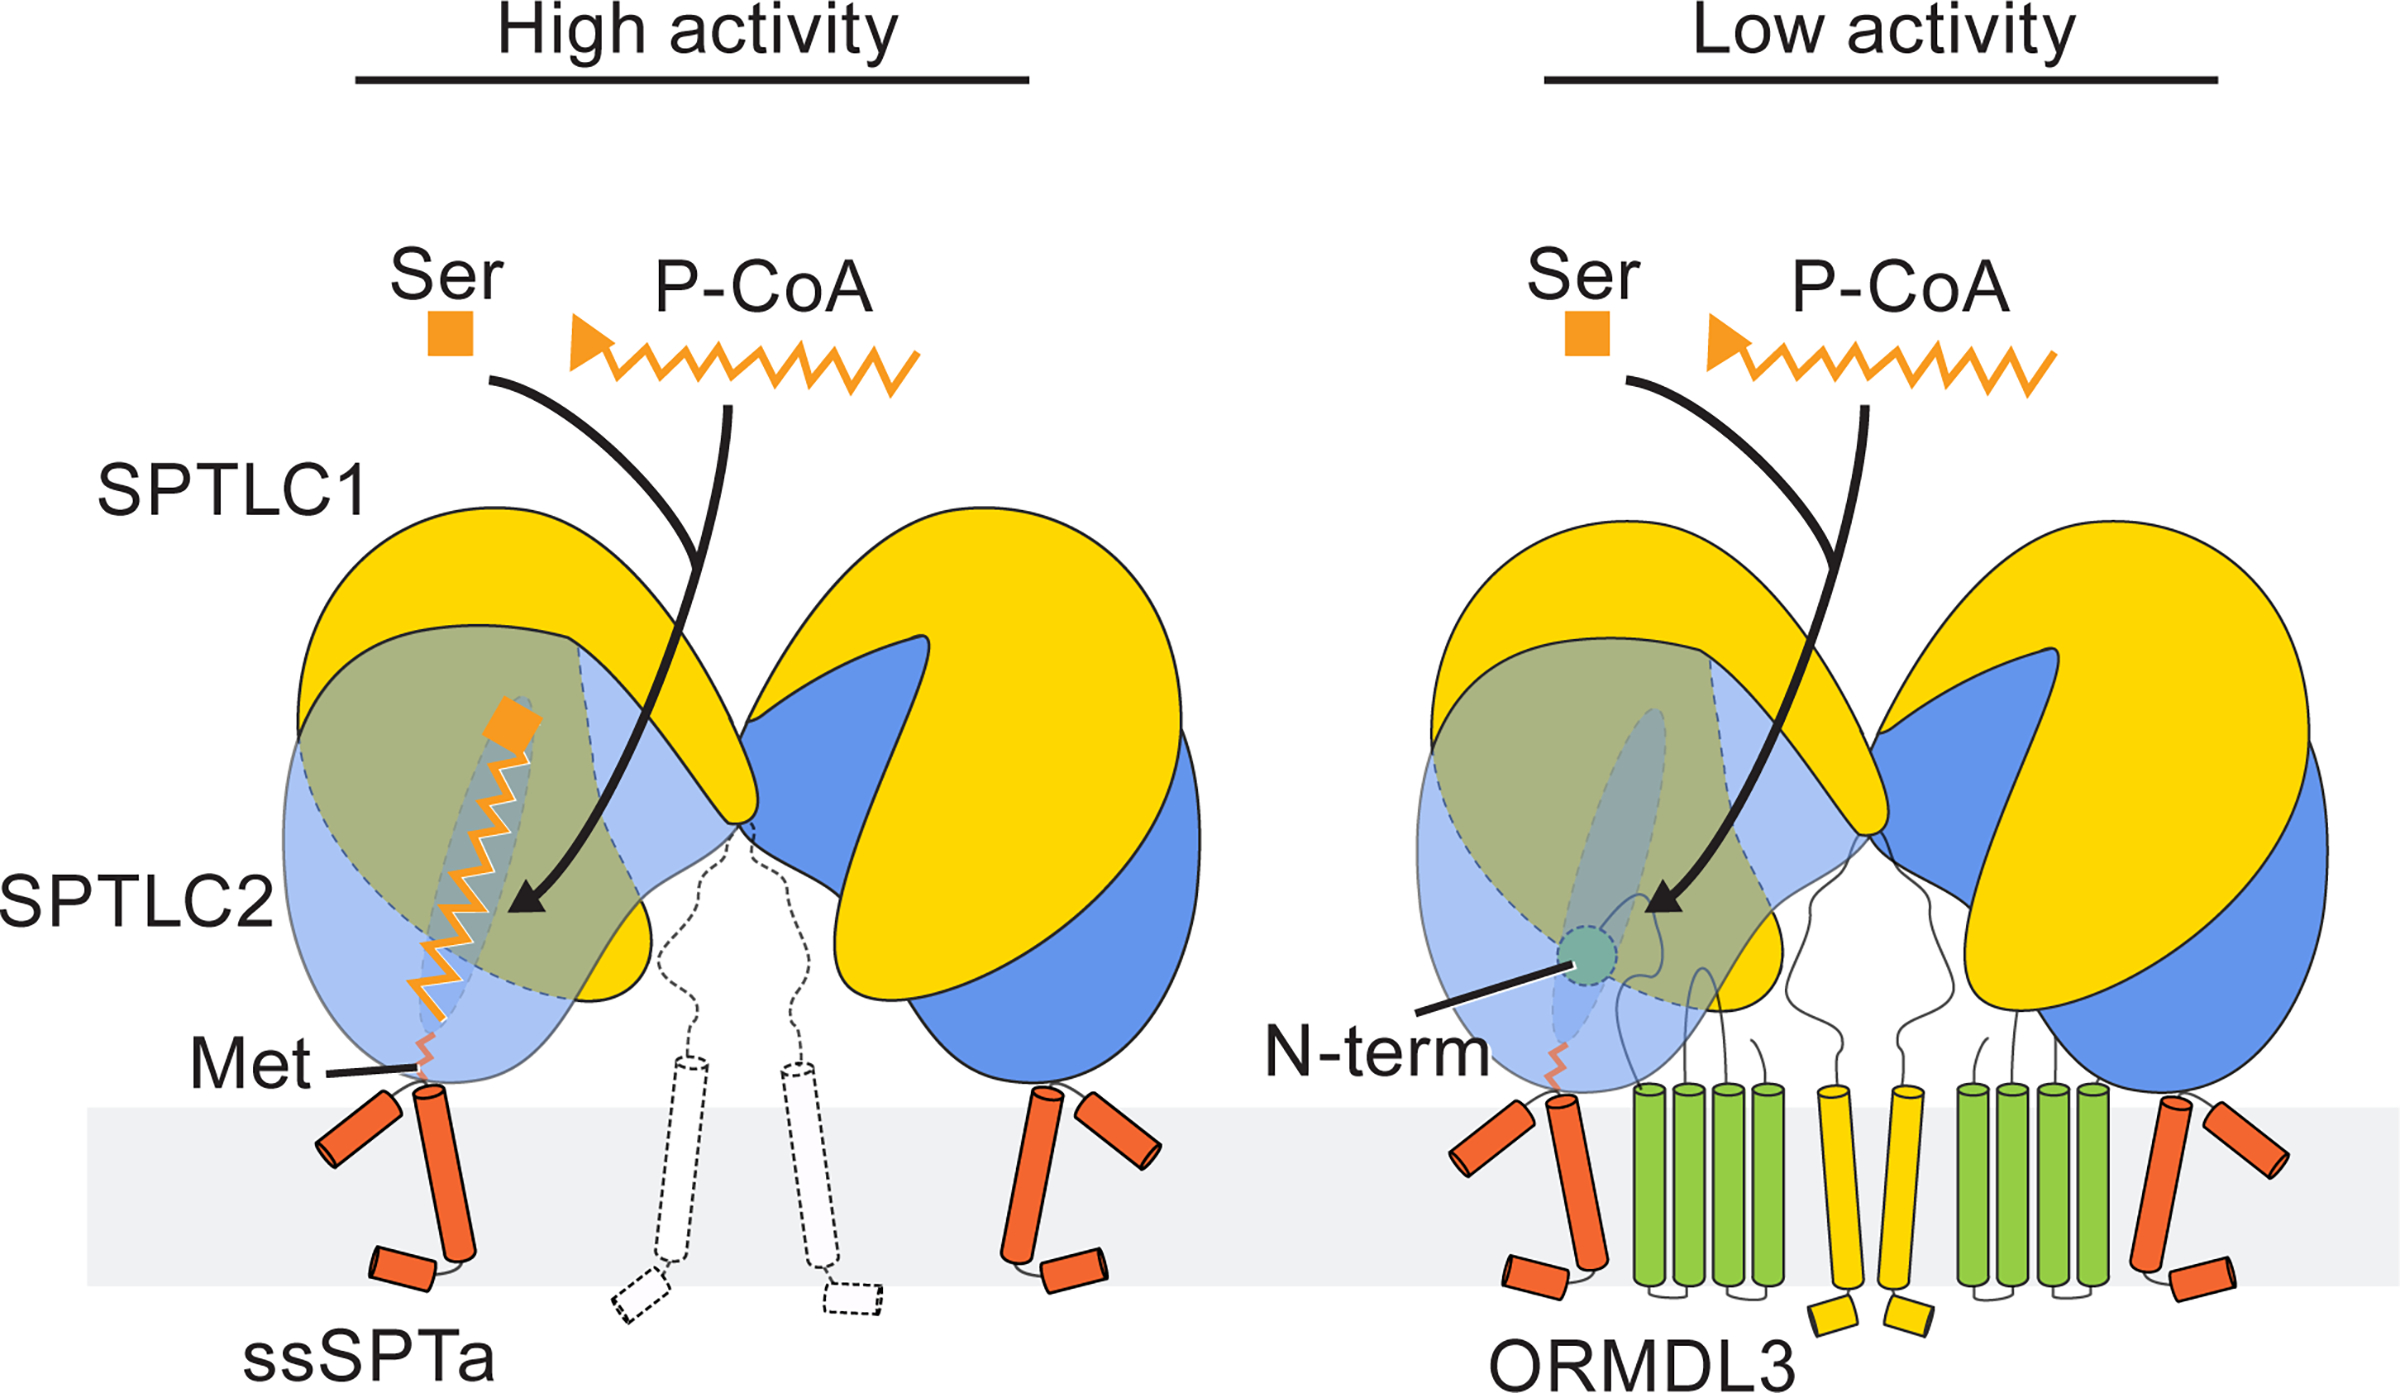
Regulation mechanism of the serine palmitoyltransferase complexes.
Left panel, serine and palmitoyl-CoA (P-CoA) bind to the active site composed of SPTLC1 and SPTLC2. ssSPTa engages with SPTLC2 to promote the activity of the complex. ssSPTa Met28 maneuvers into the substrate tunnel to determine the specificity of acyl-CoA substrates. Right panel, in the presence of ORMDL3, its N-terminus competes with substrates for the binding site and therefore reduces the activity of the complex.
Methods
Construct design
The cDNA encoding human SPTLC1, SPTLC2, ssSPTa or ORMDL3 was cloned into the pEG BacMam vector56. For SPTLC2, the coding sequence is followed by a 3C protease cleavage site and a C-terminal yellow fluorescent protein (mVenus) tag. The expression cassette containing each gene was then amplified and assembled into the pBIG1a vector using biGBac method57. The multigene expression construct containing SPTLC1–SPTLC2–ssSPTa (SPT complex) or SPTLC1–SPTLC2–ssSPTa–ORMDL3 (SPT-ORM complex) was used for large-scale protein expression.
Protein Expression and purification
The SPT complex or SPT-ORM complex was expressed in HEK293S GnTI− cells using the BacMam method56. Baculoviruses were produced by transfecting Sf9 cells with the bacmids using TransIT (Mirus). After two rounds of amplification, viruses were used for cell transduction. When HEK293S GnTI− suspension cultures grown at 37 °C reached a density of ~3.5 × 10⁶ cells/ml, baculoviruses (10 % v/v) were added to initiate transduction. After 10–12 hr, 10 mM sodium butyrate was supplemented to the cultures and the culture temperature was shifted to 30 °C. Cells were harvested at 60 hr post-transduction.
The cell pellet was resuspended using hypotonic buffer (10 mM NaCl, 1 mM MgCl2, 20 mM Tris pH 8, benzonase, and protease inhibitors) for 25 min. The cell lysate was then spun at 39800 × g for 30 min to sediment crude membranes. The membrane pellet was mechanically homogenized and solubilized in extraction buffer (2 % GDN, 150 mM NaCl, 20 mM Tris pH 8, and protease inhibitors) for 1.5 hr. Solubilized membranes were clarified by centrifugation at 39800 × g for 45 min. The supernatant was applied to the GFP nanobody-coupled Sepharose resin 58, which was subsequently washed with 10 column volumes of wash buffer (0.005 % GDN, 150 mM NaCl, and 20 mM Tris pH 8). The washed resin was incubated with 3C protease for 2 hr at a target protein to protease ratio of 40:1 (w/w) to cleave off mVenus and release the protein from the resin. The protein was eluted with wash buffer, concentrated, and further purified by gel-filtration chromatography using a Superose 6 increase column equilibrated with SEC buffer (0.005 % GDN, 150 mM NaCl, and 20 mM Tris pH 8). Peak fractions were pooled and concentrated to desired concentrations for the activity assay or cryo-EM experiments.
Fluorescence-based enzymatic assay
The SPT activity was measured by monitoring CoASH generated from the enzyme reaction. The sulfhydryl group of CoASH was detected using fluorescent dyes. Briefly, 1 μl protein (0.7 mg/ml) was diluted in 47 μl assay buffer (0.005 % GDN, 150 mM NaCl, and 20 mM Tris pH 8). The reaction was initiated by adding 1 μl palmitoyl-CoA (5 mM) and 1 μl serine of different concentrations to the sample. After incubation at room temperature for 40 min, the sample was mixed with 50 μl Measure-iT reagent buffer (ThermoFisher, M30550) and the mixture was transferred to a 96-well plate. Fluorescence was recorded (λEX = 490 nm, λEM = 520 nm) using a plate reader (BioTek Synergy H1). Relative fluorescence intensity was obtained by subtracting the fluorescence intensity of the serine-free samples from the intensity of the serine-containing samples. To examine the myriocin inhibition, 100 μM myriocin was added to the assay buffer. Nonlinear regression of the Michaelis–Menten equation and statistical analyses were performed using GraphPad Prism.
EM data acquisition
Prior to EM grid preparation, protein samples were concentrated to ~7 mg/ml. 600 μM 3KS or myriocin was added to the protein sample when required. Aliquots of 3.5 μl protein samples were applied to plasma-cleaned UltrAuFoil R1.2/1.3 300 mesh grids. After 15 s, the grids were blotted for 4 s and plunged into liquid ethane using a Vitrobot Mark IV (FEI) operated at 10 °C and 100 % humidity. The grids were loaded onto a 200 kV Talos Arctica or 300 kV Titan Krios transmission electron microscope with a K3 detector. Micrographs were recorded in super-resolution mode using SerialEM59 with a physical pixel size of 1.34 Å (Arctica) or 1.06 Å (Krios) per pixel and a nominal defocus range of 1–2 μm. The exposure time for each micrograph was 4.9–6 s, dose-fractionated into 50–75 frames with a dose rate of 0.97–1.2 e−/pixel/s. Image acquisition parameters are summarized in Table 1.
Table 1.
Cryo-EM data collection, refinement and validation statistics.
| SPT (EMD-22598, PDB 7K0I) |
SPT (protomer) (EMD-22599, PDB 7K0J) |
SPT-3KS (protomer) (EMD-22600, PDB 7K0K) |
SPT-myriocin (protomer) (EMD-22601, PDB 7K0L) |
SPT-ORM (class 1) (EMD-22602, PDB 7K0M) |
SPT-ORM (class 2) (EMD-22604, PDB 7K0N) |
SPT-ORM (class 3) (EMD-22605, PDB 7K0O) |
SPT-ORM (class 4) (EMD-22606, PDB 7K0P) |
SPT-ORM-myriocin (protomer) (EMD-22608, PDB 7K0Q) |
|
|---|---|---|---|---|---|---|---|---|---|
|
| |||||||||
| Data collection and processing | |||||||||
| Magnification | 63,000 | 63,000 | 81,000 | 63,000 | 63,000 | 63,000 | 63,000 | 63,000 | 63,000 |
| Voltage (kV) | 200 | 200 | 300 | 200 | 200 | 200 | 200 | 200 | 200 |
| Electron exposure (e−/Å2) | 60.35 | 60.35 | 80.50 | 70.67 | 72.53 | 72.53 | 72.53 | 72.53 | 70.67 |
| Defocus range (μm) | 1–2 | 1–2 | 1–2 | 1–2 | 1–2 | 1–2 | 1–2 | 1–2 | 1–2 |
| Pixel size (Å) | 1.00 | 1.00 | 1.06 | 1.00 | 1.00 | 1.00 | 1.00 | 1.00 | 1.00 |
| Symmetry imposed | C2 | C1 | C1 | C1 | C2 | C2 | C2 | C1 | C1 |
| Initial particle images (no.) | ~1,200,000 | ~1,200,000 | ~4,900,000 | ~3,900,000 | ~4,200,000 | ~4,200,000 | ~4,200,000 | ~4,200,000 | ~3,900,000 |
| Final particle images (no.) | 238,610 | 157,895 | 133,308 | 118,539 | 169,428 | 195,572 | 221,541 | 198,543 | 191,726 |
| Map resolution (Å) | 3.3 | 3.1 | 2.6 | 3.4 | 2.9 | 3.1 | 3.1 | 3.1 | 3.3 |
| FSC threshold | 0.143 | 0.143 | 0.143 | 0.143 | 0.143 | 0.143 | 0.143 | 0.143 | 0.143 |
| Map resolution range (Å) | 3.3–200 | 3.1–200 | 2.6–200 | 3.4–200 | 2.9–200 | 3.1–200 | 3.1–200 | 3.1–200 | 3.3–200 |
| Refinement | |||||||||
| Initial model used (PDB code) | de novo | de novo | de novo | de novo | de novo | de novo | de novo | de novo | de novo |
| Model resolution (Å) | 3.3 | 3.1 | 2.6 | 3.4 | 2.9 | 3.1 | 3.1 | 3.1 | 3.3 |
| FSC threshold | 0.143 | 0.143 | 0.143 | 0.143 | 0.143 | 0.143 | 0.143 | 0.143 | 0.143 |
| Model resolution range (Å) | 3.3–200 | 3.1–200 | 2.6–200 | 3.4–200 | 2.9–200 | 3.1–200 | 3.1–200 | 3.1–200 | 3.3–200 |
| Map sharpening B factor (Å2) | −96.3 | −75.4 | −39.0 | −81.3 | −86.2 | −88.9 | −87.7 | −82.3 | −56.6 |
| Model composition | |||||||||
| Nonhydrogen atoms | 15,366 | 7,683 | 7,615 | 7,619 | 18,578 | 18,470 | 18,558 | 18,572 | 8,778 |
| Protein residues | 1,954 | 977 | 964 | 964 | 2,342 | 2,340 | 2,342 | 2,342 | 1,107 |
| Ligands | 6 | 3 | 2 | 2 | 16 | 18 | 14 | 15 | 2 |
| B factors (Å2) | |||||||||
| Protein | 43.36 | 79.69 | 50.34 | 63.13 | 83.66 | 37.62 | 54.71 | 64.06 | 73.58 |
| Ligand | 44.31 | 91.90 | 50.38 | 66.84 | 88.59 | 33.77 | 54.70 | 66.12 | 74.48 |
| R.m.s. deviations | |||||||||
| Bond lengths (Å) | 0.005 | 0.006 | 0.006 | 0.004 | 0.003 | 0.003 | 0.005 | 0.004 | 0.006 |
| Bond angles (°) | 0.617 | 0.688 | 0.656 | 0.575 | 0.524 | 0.572 | 0.647 | 0.610 | 0.678 |
| Validation | |||||||||
| MolProbity score | 1.62 | 1.49 | 1.45 | 1.21 | 1.30 | 1.44 | 1.44 | 1.37 | 1.48 |
| Clashscore | 6.19 | 5.48 | 7.43 | 4.27 | 4.67 | 6.22 | 5.84 | 5.21 | 5.12 |
| Poor rotamers (%) | 0.25 | 0 | 0 | 0 | 0 | 0.32 | 0 | 0 | 0 |
| Ramachandran plot | |||||||||
| Favored (%) | 95.98 | 96.81 | 97.81 | 98.12 | 97.72 | 97.5 | 97.38 | 97.55 | 96.72 |
| Allowed (%) | 4.02 | 3.19 | 2.79 | 1.88 | 2.28 | 2.5 | 2.62 | 2.45 | 3.28 |
| Disallowed (%) | 0 | 0 | 0 | 0 | 0 | 0 | 0 | 0 | 0 |
EM data processing
The image stacks were gain-normalized, binned by 1.5 (Arctica) or 2 (Krios), and corrected for beam-induced motion using MotionCor260. Defocus parameters were estimated from motion-corrected images without dose-weighting using GCTF61. All subsequent processing was performed on motion-corrected images with dose-weighting. Micrographs not suitable for further analysis were removed by manual inspection. Particles were then picked and 2D classifications were performed using cryoSPARC262. The initial 3D models of SPT and SPT-ORM were generated by cryoSPARC2 ab-initio reconstruction. 3D classifications were performed in RELION 3.063. The selected classes of particles were then refined in RELION with SIDESPLITTER64. The refined particles were subjected to CTF refinements and Bayesian polishing in RELION. For SPT, SPT-ORM datasets, the polished particles were imported into cryoSPARC2 where additional 2D classifications, heterogeneous refinements and non-uniform refinements were performed65. To improve the resolutions of SPT, SPT-3KS, SPT-myriocin, SPT-ORM-myriocin datasets, the polished particles from these datasets were expanded according to the C2 point group. Soft masks covering one protomer and detergent micelles were applied to the reconstructions and signals outside the masks were subtracted from the particles. The subtracted particles were imported into cryoSPARC2 where additional 2D classifications, heterogeneous refinements, and non-uniform refinements were performed. The mask-corrected FSC curves were calculated in cryoSPARC2 and reported resolutions were based on the 0.143 criterion. Local resolutions of density maps were estimated by Blocres66. A summary of reconstructions is shown in Table 1.
Model building
For SPTLC1 and SPTLC2, homology models of cytosolic domains were generated by SWISS- MODEL server67 using a bacterial homolog (PDB 2JG2) as the reference. These models were docked into the density maps using Chimera68. For the transmembrane helix of SPTLC1, ssSPTa and ORMDL3, de novo models were built manually in Coot69. All models were then refined iteratively using Coot and Phenix70. The SPT structure model includes human SPTLC1 residues 51–473, SPTLC2 residues 53–544 and ssSPTa residues 8–69. The SPT-ORM structure includes human SPTLC1 residues 10–473, SPTLC2 residues 53–544, ssSPTa residues 8–69, and ORMDL3 residues 1–153. Structural model validation was done using Phenix and MolProbity71. A summary of model refinement and validation is shown in Table 1. The protein-ligand interactions were analyzed using LigPlot72. Figures were prepared using PyMOL and ChimeraX 73.
Fluorescence-detection size-exclusion chromatography
HEK293 cells (1 × 10⁶) were plated in 12-well plates at 37 °C and transfected in optiMEM using Lipofectamine 3000 (ThermoFisher) with 1 mg each of plasmids expressing SPTLC1, ssSPTa, and either SPTLC2 WT (C-terminal mVenus tagged) or SPTLC2 mutants. After 12 hr, sodium butyrate was added to each well to a final concentration of 10 mM and the plates were moved to 30 °C. Cells were harvested at 48 hr post-transfection. Cell pellets were solubilized in extraction buffer for1.5 hr and samples were then centrifuged at 17100 g for 30 min at 4 °C. The supernatant from each sample was injected into a Superose 6 increase column equilibrated with SEC buffer for high-performance liquid chromatography74 and the fluorescence intensity of mVenus was measured (excitation 515 nm and emission 527 nm).
Cell transfections for functional assays
For the functional analyses of the SPTLC2 Arg302Ala-Arg304Ala-Arg305Ala triple mutant, HEK293 cells (1.7 × 10⁶) were plated in 100 mm dishes and transfected in optiMEM using Lipofectamine 2000 (ThermoFisher) with 1.75 mg each of plasmids expressing SPTLC1, ssSPTa, and either SPTLC2 WT or SPTLC2 mutant. Fifteen hr later, deuterium-labeled serine (3,3-D2 L-serine, DLM-161, Cambridge Isotope Laboratories) was added to a final concentration of 3 mM and cells were incubated for an additional 18 hr. Cells were harvested by scraping in cold PBS, washed with PBS and the D2 L-serine labeled cells were split into glass tubes for lipid extraction (as described below) or Eppendorf tubes for determination of protein concentration using the Bio-Rad reagent. For the analysis of the SPTLC1 ΔS1 (deletion of residues 23–41) mutant, HEK cells were transfected with 0.75 mg each of plasmids expressing SPTLC1 WT or SPTLC1 ΔS1, SPTLC2 and ssSPTa and either 0.375 mg ORMDL3 or pcDNA. After 30 hr, cells were harvested and processed for mass spectrometry75.
Mass spectrometry analysis
Pelleted cells (0.2–0.3 mg of cell lysate) were mixed with 1 ml methanol containing 62.5 pmol of internal standards (Avanti Polar Lipids, LM6002), bath sonicated, 0.5 ml chloroform was added and the mixture was incubated overnight at 48 °C. After a brief spin to pellet and remove insoluble material, the sample was dried under nitrogen. The dried sample was dissolved in 0.2 ml of mobile phase A and B at 80:20 (v/v), dispersed by bath sonication, clarified by centrifugation and transferred to an HPLC vial for analysis. 5–20 μl of the sample was injected for each assay. The HPLC mobile phase consisted of two solvents: (A) CH3OH : H2O : CH2O2 (74:25:1, v/v/v with 10 mM ammonium formate) and (B) CH3OH : CH2O2 (99:1,v/v with 10 mM ammonium formate). The samples were analyzed using an Agilent 1200 Series HPLC coupled to an ABSciex QTRAP 4000 MS. The column (150 mm × 4.6 mm × 5 μm Supelco Discovery BIO Wide Pore C18 HPLC column) was pre-equilibrated with A–B (80:20 v/v) and held for 2 min after injection at 1 ml/min. The flow was ramped to 100% B at 7 min, held for 20 min, and ramped back to 80:20 and held for 2 min before the next injection. The mass spectrometer was set to detect compounds in MRM mode in triplicate runs The MRM parameters are as described previously (Merrill). Compounds were quantified based on the ratio of the peak to the known concentration of the representative internal standard using the ABSciex Analyst program. Each sample was normalized to protein lysate concentration.
Microsomal membrane preparation
Cells were transfected and harvested as described above, resuspended in TEGM buffer (50 mM Tris pH 7.5, 1 mM EGTA, 1 mM PMSF, 1 μg/ml leupetin, 1 μg/ml pepstatin A, 1 μg/ml aprotinin), and disrupted by sonication at 3.0 power using 3 × 15s bursts. Cell debris was pelleted at 5000 × g and the resulting supernatant was pelleted at 100000 × g for 35 minutes. The cell pellet was washed with TEGM buffer and repelleted at 100000 × g. The final membrane pellet was resuspended in TEGM Buffer containing 33% glycerol and stored at −80° C. Protein concentration was determined using Bio-Rad dye reagent with IgG as standard.
Microsomal SPT assay
The microsomal SPT assay was performed as previously described32. The reaction was started by adding 100 μg of microsomal membrane to a reaction cocktail (final volume 300 μl) containing 50 mM Hepes pH 8.1, 50 μM pyridoxal phosphate, 2.5 mM serine, 20 μCi 3H serine and 10 μM palmitoyl-CoA. After a 10 min reaction time, NH4OH to a final 0.25 M was added, followed by the addition of 1.5 ml of CHCl3 : methanol (1:2), and vortexed. Long chain bases were extracted by adding 1 ml CHCl3 and 2 ml of 0.5 M NH4OH, vortexing and centrifuging briefly. The upper aqueous layer was aspirated off and the lower layer was washed with 2 ml of 30 mM KCl and centrifuged. The washing was carried out three times and 1 ml of the sample was dried and counted.
Extended Data
Extended Data Fig. 1. Cryo-EM reconstructions of the SPT complex.
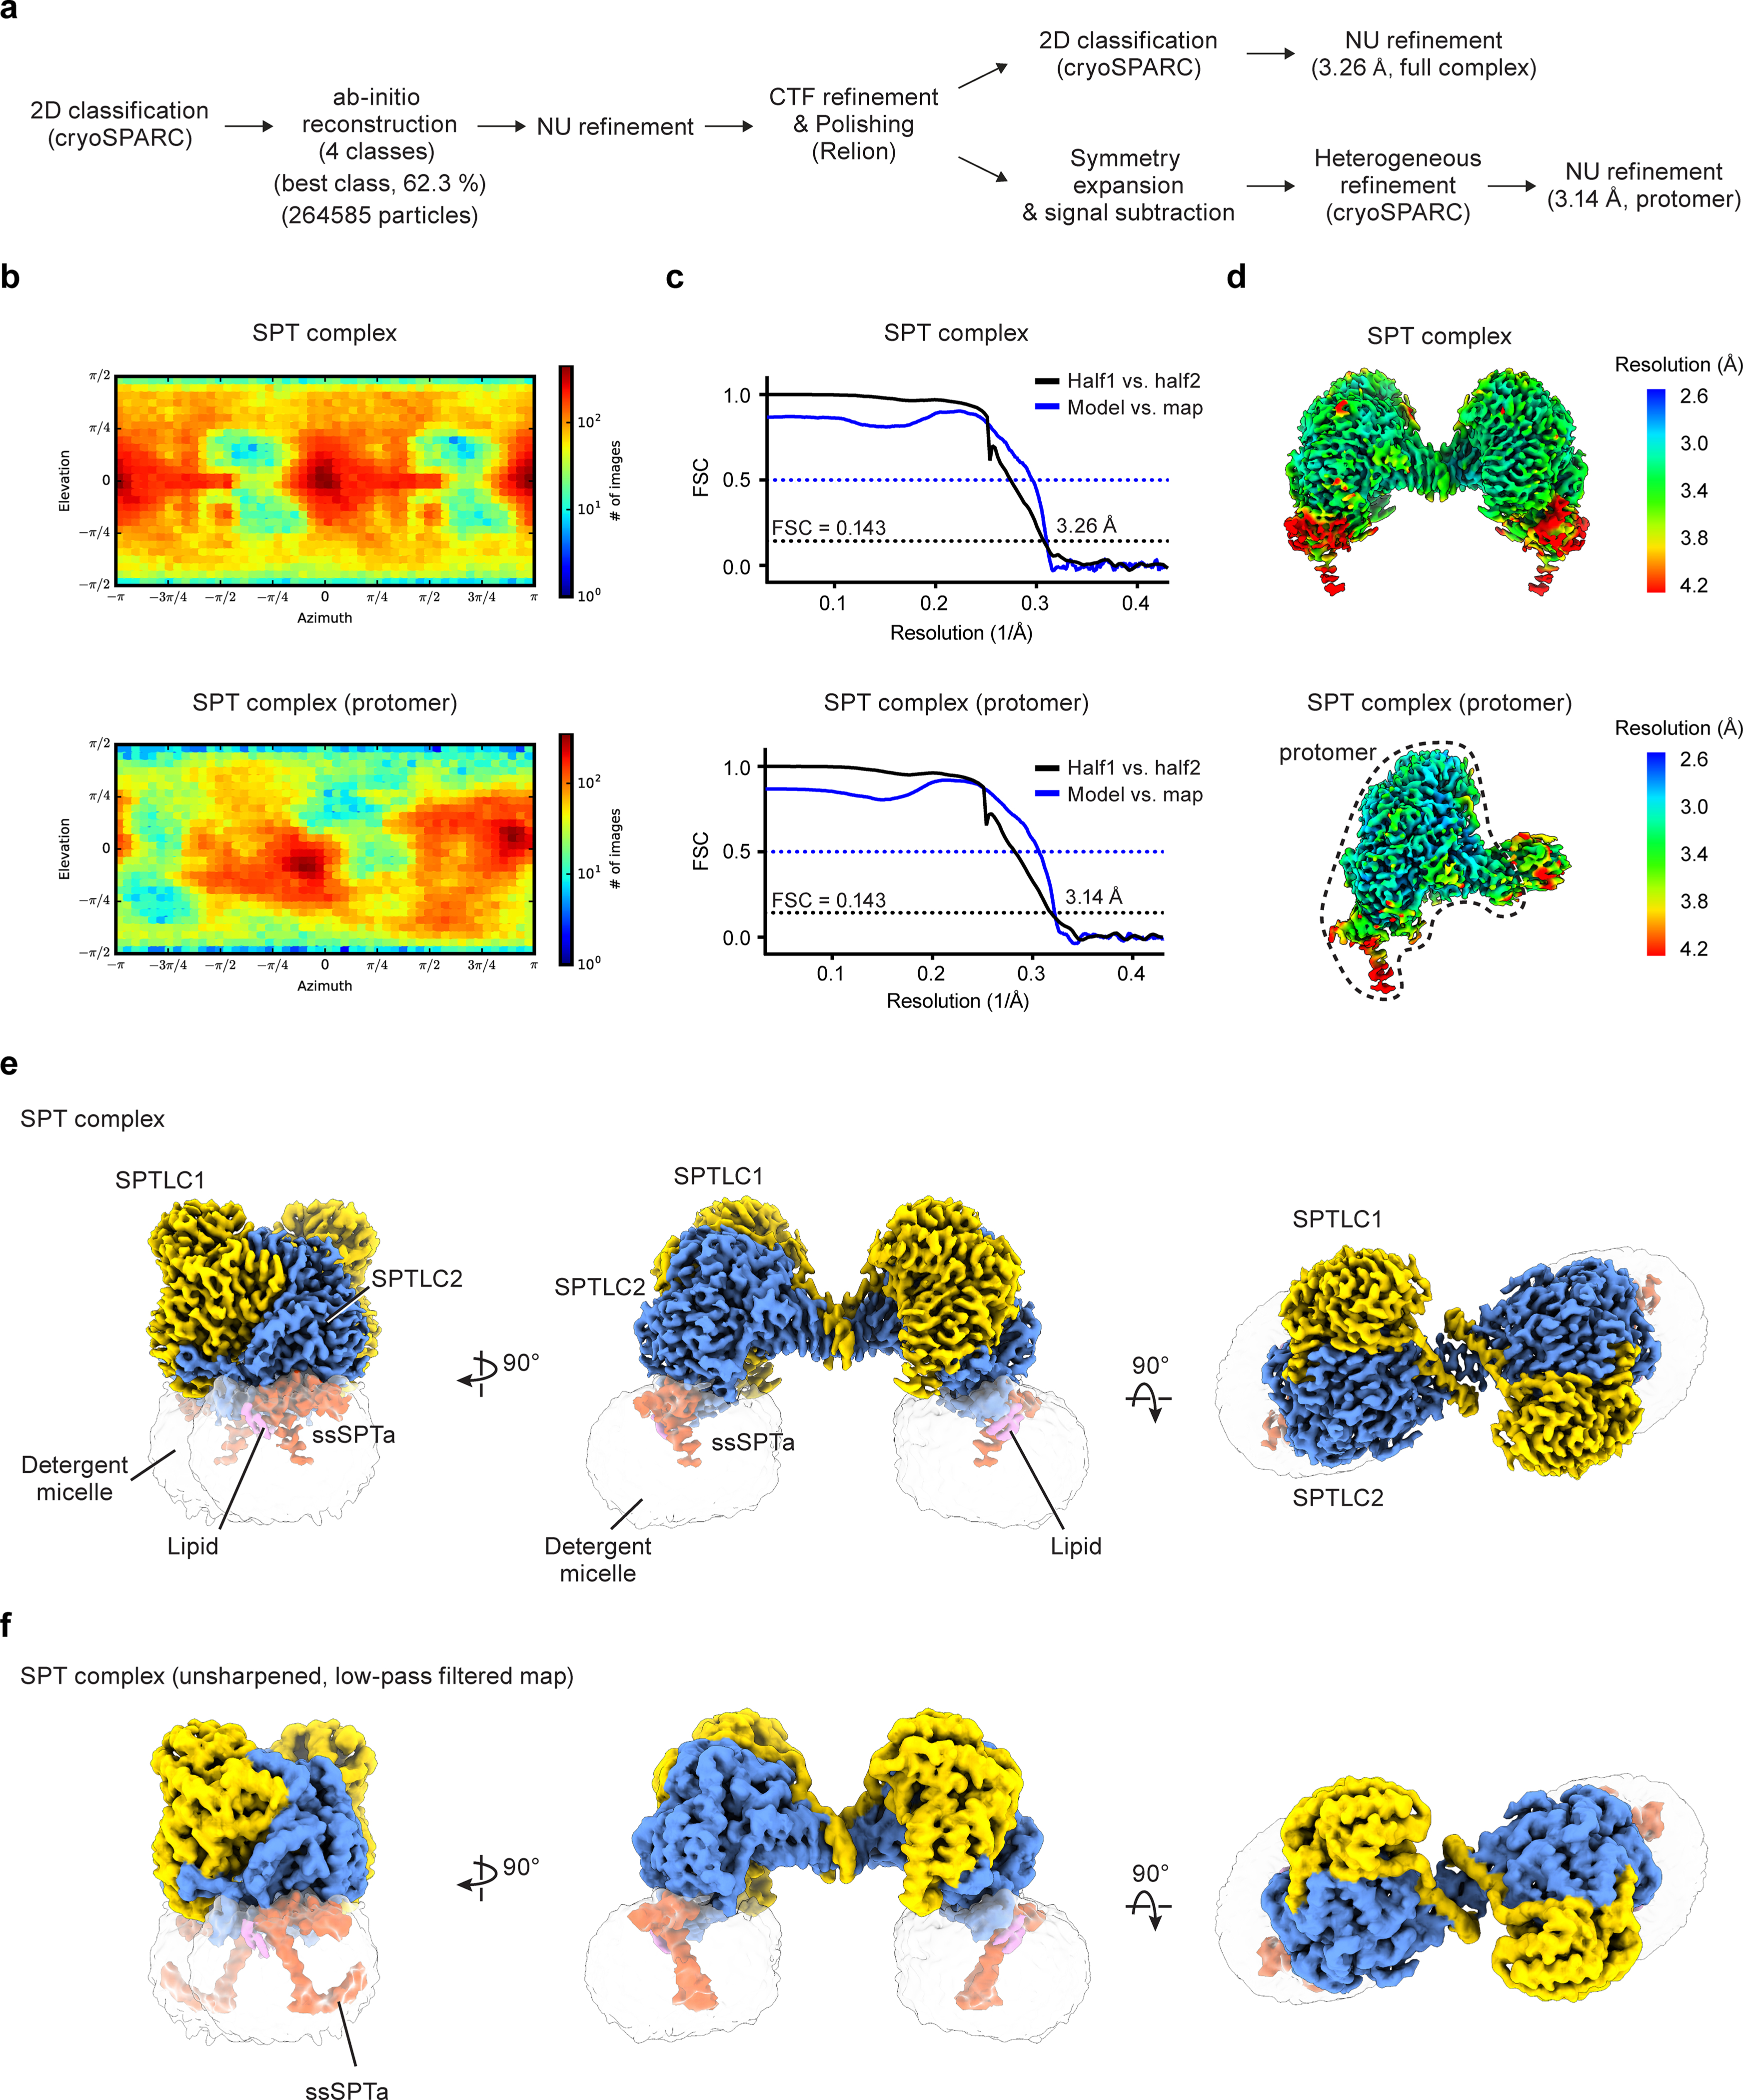
(a) Summary of image processing procedures of the SPT complex dataset. (b) Angular distribution of particles for the final 3D reconstructions. (c) Fourier shell correlation (FSC) curves: half map 1 versus half map 2 (black) and model versus summed map (blue). (d) Local resolution of cryo-EM maps. In (b), (c), and (d), top panels show the reconstruction of the whole complex and bottom panels show the reconstruction after symmetry expansion and signal subtraction (single protomer). (e and f) Cryo-EM map of the SPT complex. In (f), the map is unsharpened and low-pass filtered to show the weaker density of the C-terminal helix of ssSPTa. The identity of the lipids (purple) can not be determined at this resolution.
Extended Data Fig. 2. Comparison of human SPTLCs and their bacterial homolog.
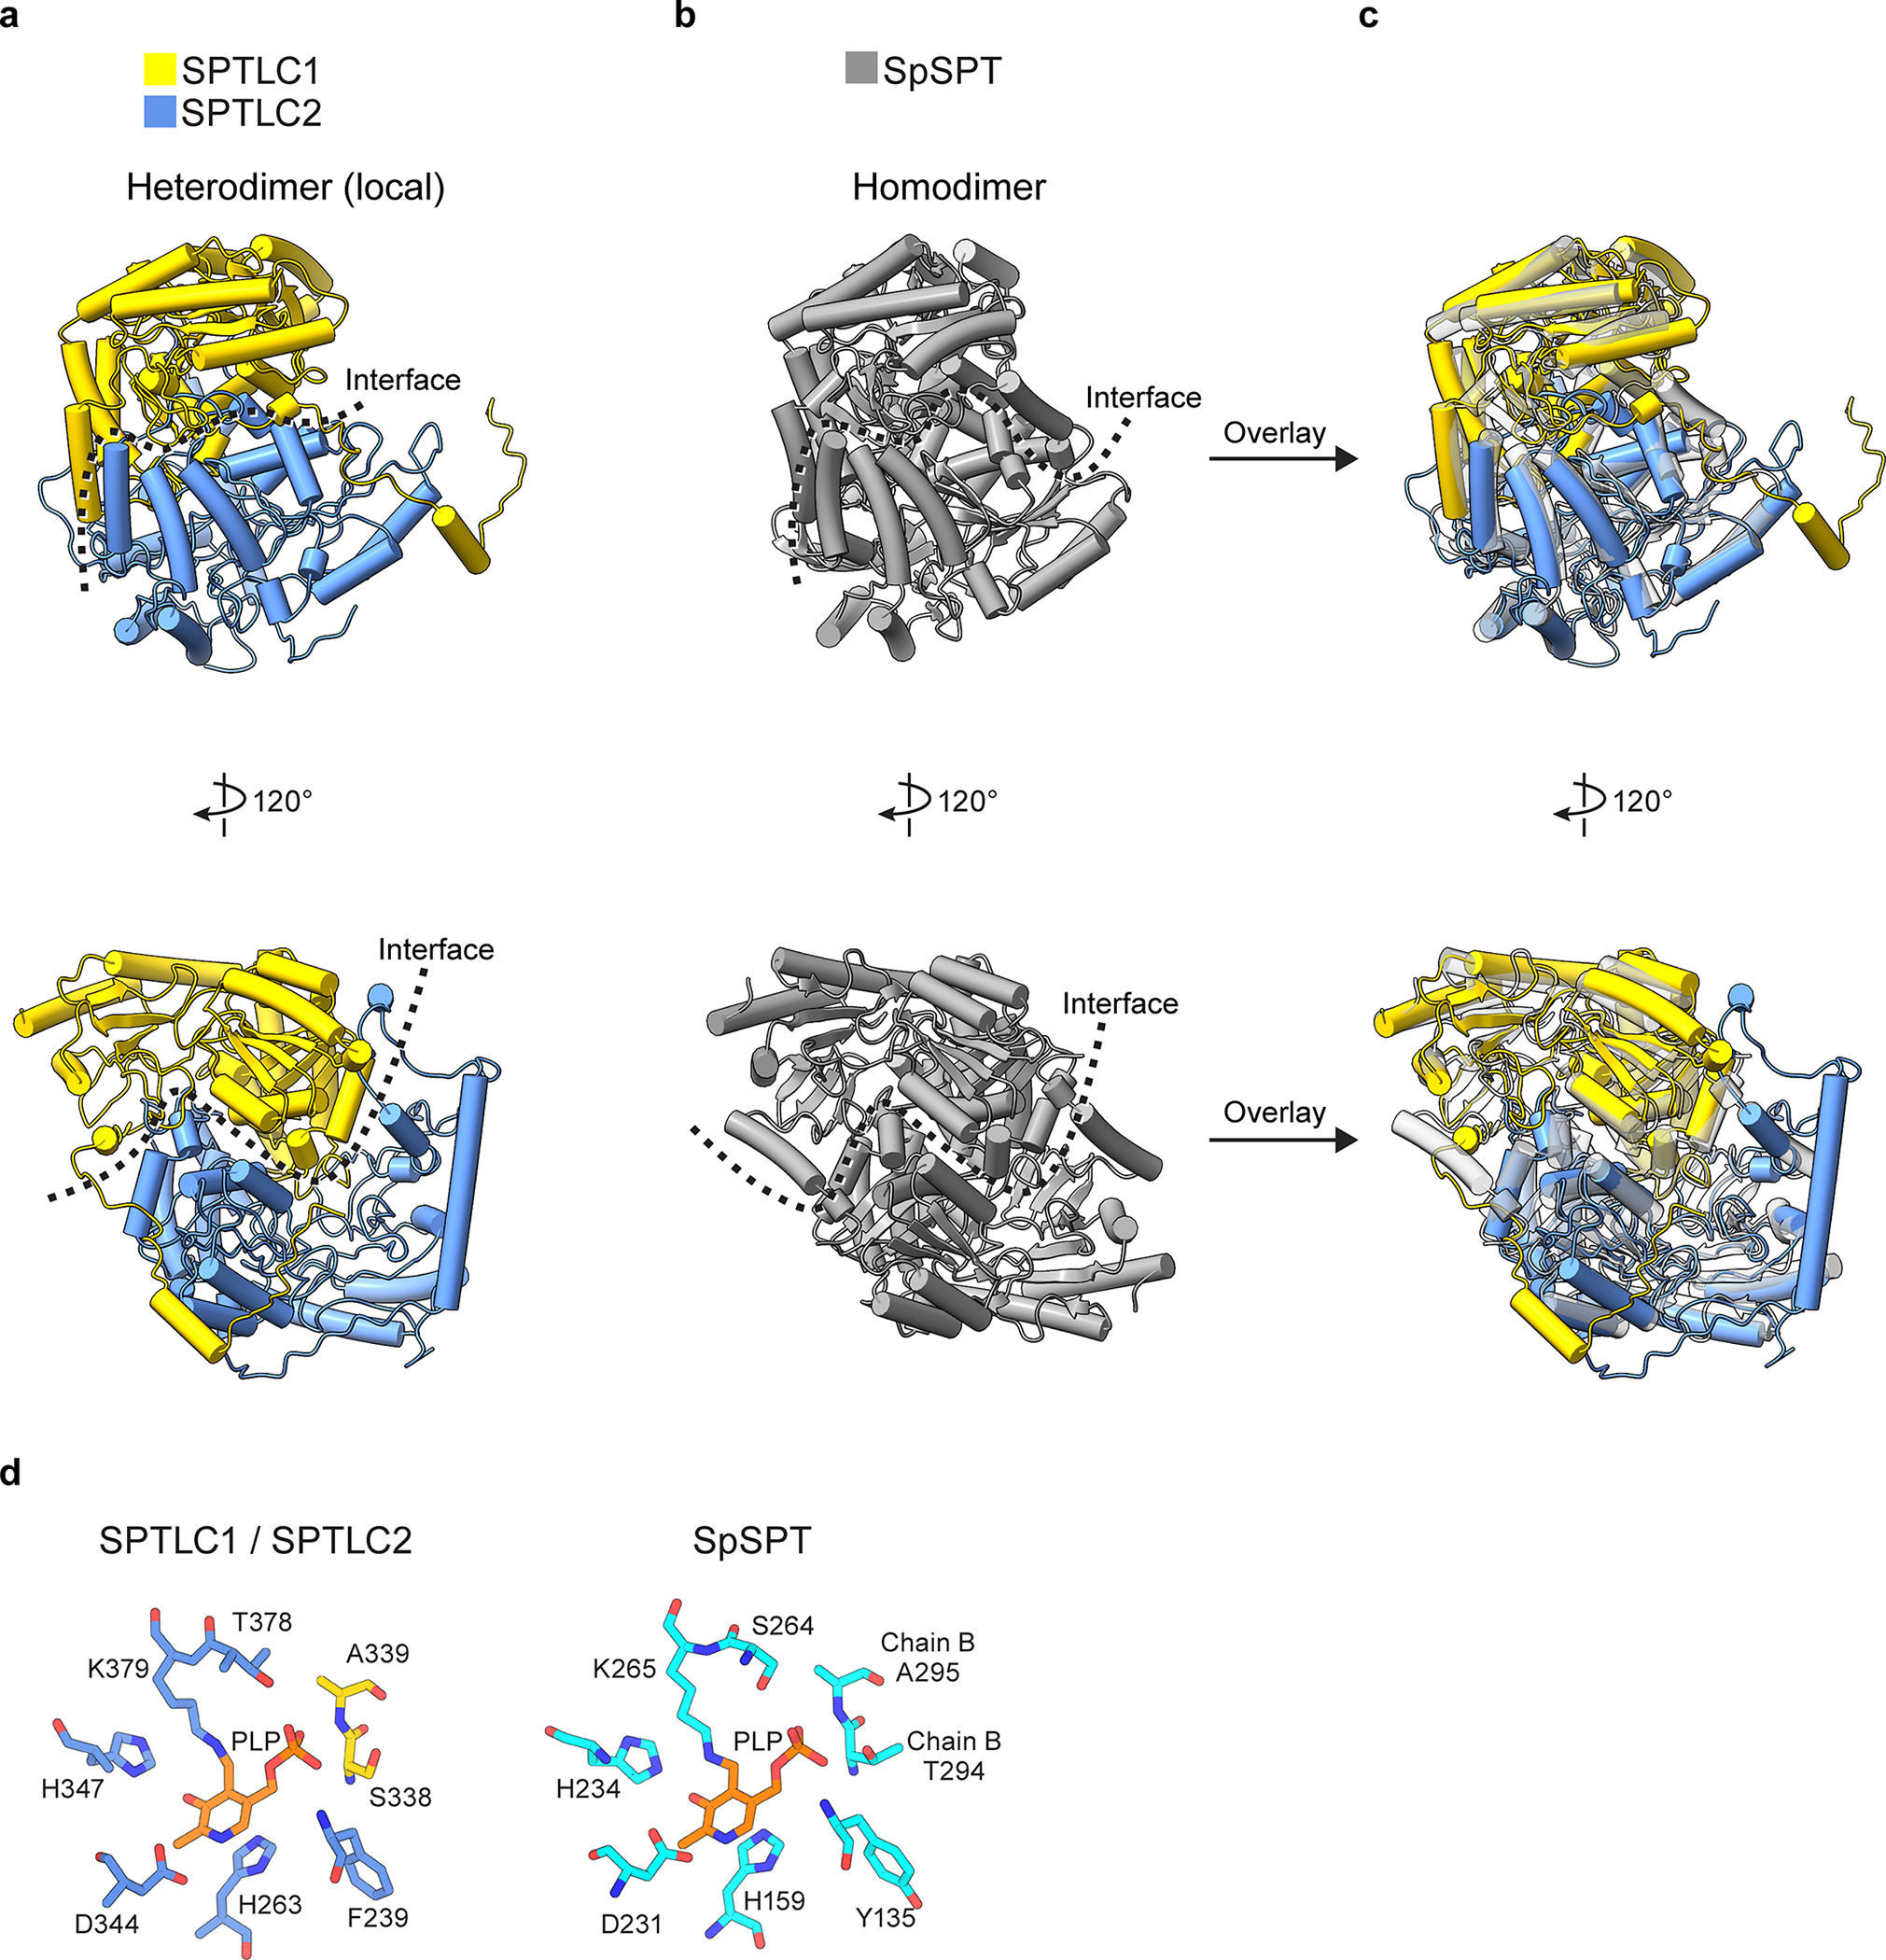
(a) Structure of the cytosolic domains of human SPTLC1 and SPTLC2. For clarity, only one local dimer is shown. (b) Structure of the serine palmitoyltransferase from Sphingomonas paucimobilis (SpSPT, PDB 2JG2). (c) Overlay of the human SPTLCs and their bacterial homolog. (d) Structural comparison of human SPTLCs and their bacterial homolog in the active site.
Extended Data Fig. 3. Analysis of SPTLC2 mutations on key residues involved in the dimeric interface.

(a) Representative fluorescence-detection size-exclusion chromatography profiles showing that SPTLC2 Arg302Ala, Arg302Ala-Arg305Ala or Arg302Ala-Arg304Ala-Arg305Ala considerably decreased the dimer population. (b) SPT activity measured from cells. d18:0, sphinganine. d18:0 P, sphinganine phosphate. d18:1, sphingosine. Newly synthesized sphingolipids were indicated by deuterium-labeled serine (d2) (mean ± SD; n = 3). (c) SPT activity measured from microsomes. (mean ± SD; n = 3). Data for graphs in b and c are available as source data.
Extended Data Fig. 4. Cryo-EM reconstructions and ligand-protein interactions of the SPT complex bound to 3KS or myriocin.
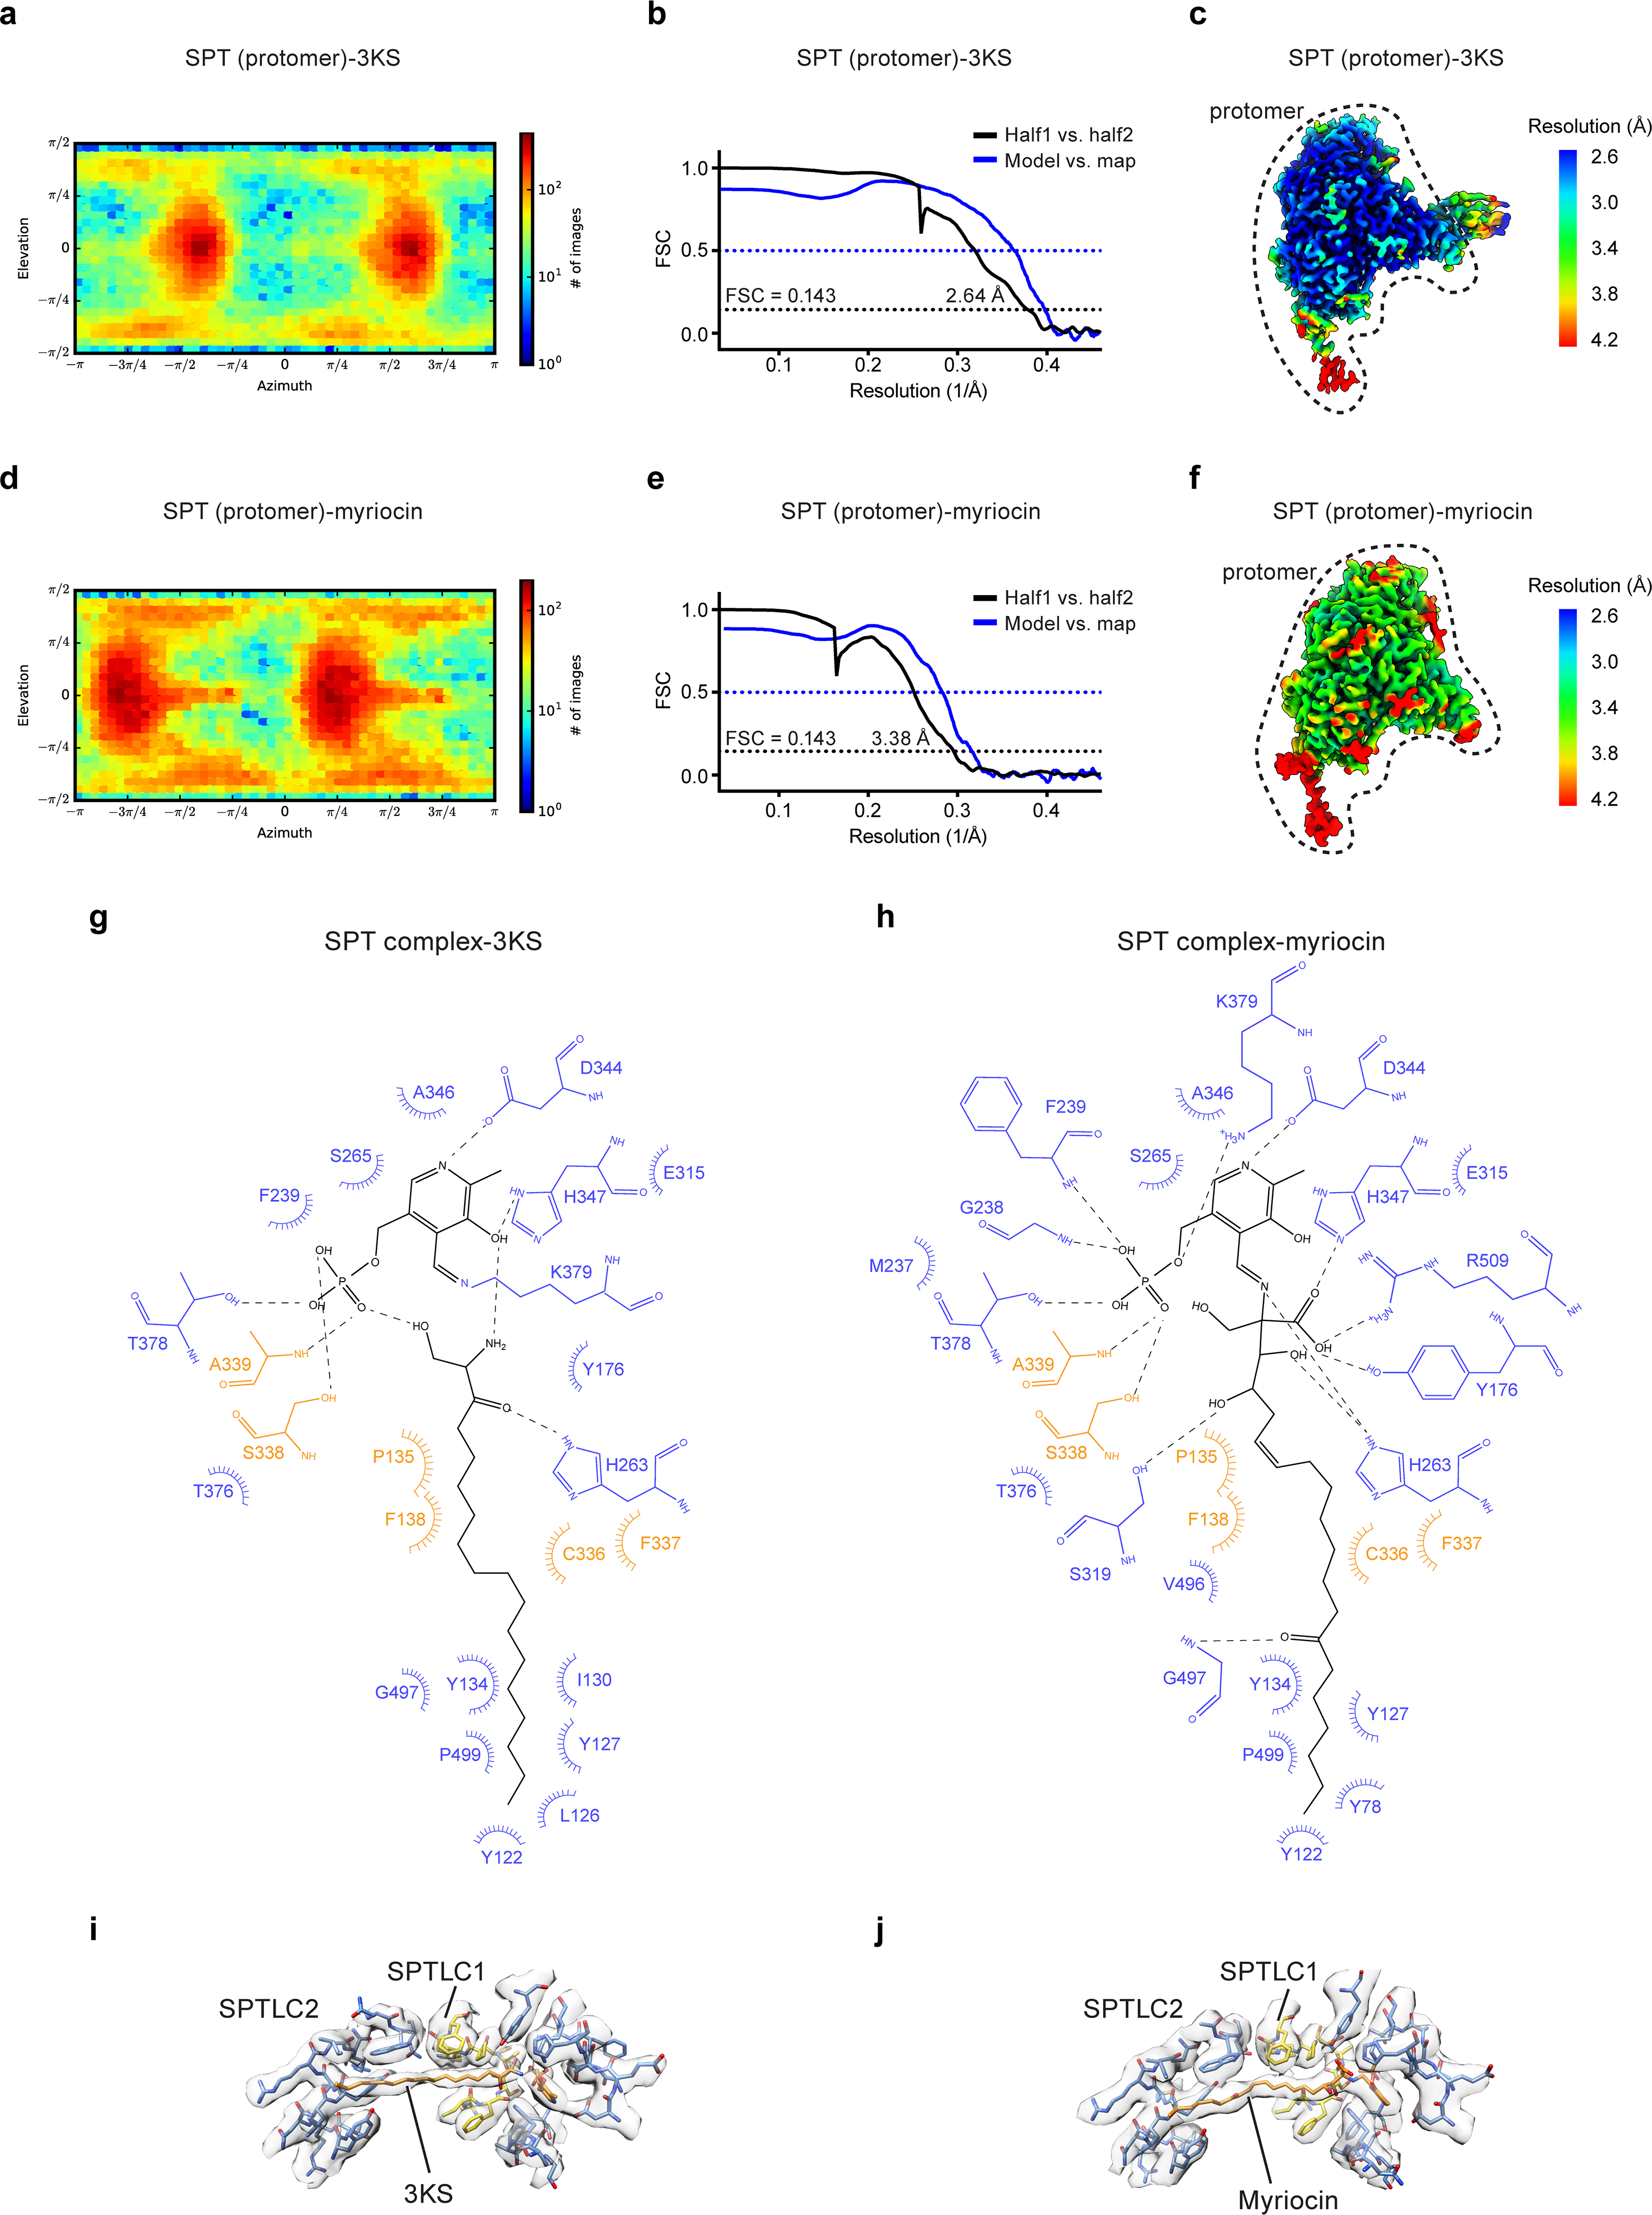
(a to c) SPT-complex bound to 3KS. (d to f) SPT-complex bound to myriocin. (a and d) Angular distribution of particles for the final 3D reconstructions. (b and e) Fourier shell correlation (FSC) curves: half map 1 versus half map 2 (black) and model versus summed map (blue). (c and f) Local resolution of cryo-EM maps. (g) Scheme of interactions between 3KS, SPTLC1 (orange), and SPTLC2 (blue). 3KS and PLP are colored black. Dashed lines represent hydrogen bonds and spokes represent hydrophobic interactions. (h) Scheme of interactions between myriocin, SPTLC1 (orange), and SPTLC2 (blue). Myriocin and PLP are colored black. (i) Densities of 3KS and surrounding residues. (j) Densities of myriocin and surrounding residues.
Extended Data Fig. 5. Cryo-EM reconstructions of the SPT-ORM complex.
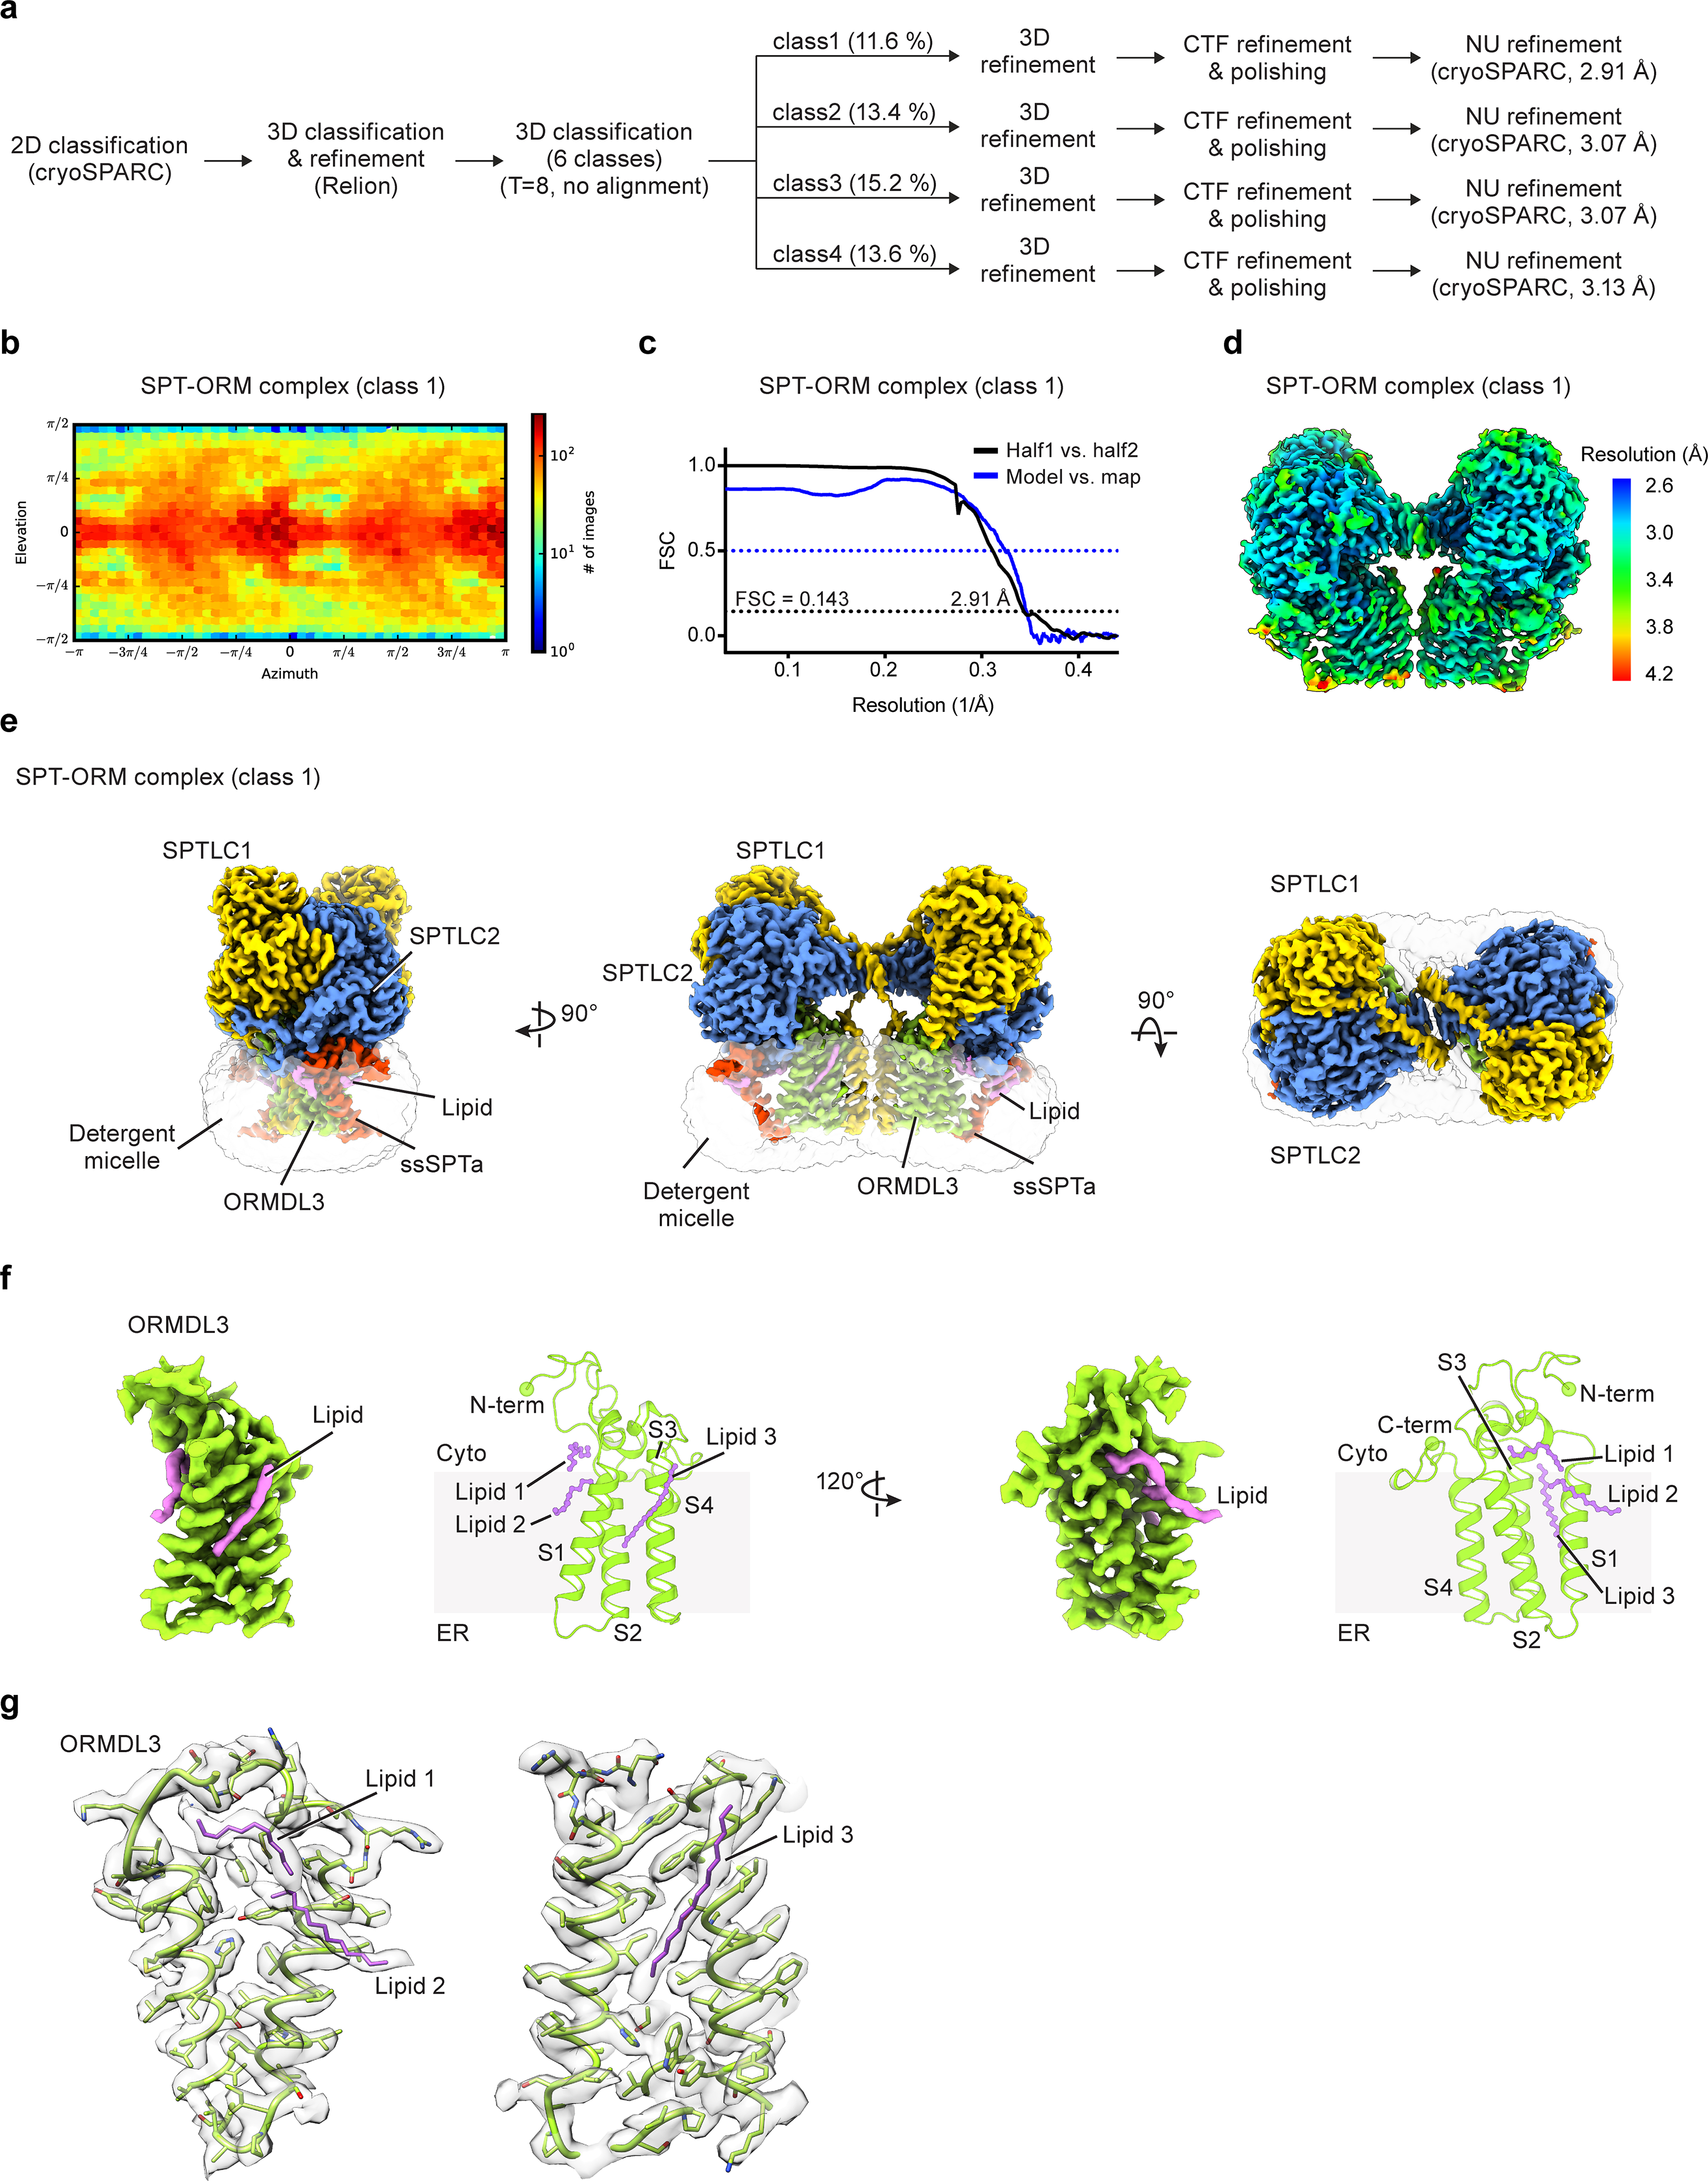
(a) Summary of image processing procedures of the SPT-ORM complex dataset. (b) Angular distribution of particles for the final 3D reconstruction (class 1). (c) Fourier shell correlation (FSC) curves (class 1): half map 1 versus half map 2 (black) and model versus summed map (blue). (d) Local resolution of the cryo-EM map (class 1). (e) Cryo-EM map of the SPT-ORM complex. (f) Cryo-EM structure of ORMDL3. Four transmembrane helices of ORMDL3 are labeled as S1 to S4. The N- and C- terminus of the ORMDL3 are highlighted by spheres. Lipid-like densities were observed around S1 and S2 (lipid 1 and 2), and between S1 and S3 (lipid 3). The identity of the lipids cannot be determined at this resolution. (g) Zoomed-in views of densities of lipids and surrounding residues.
Extended Data Fig. 6. Representative densities of the SPT-ORM complex.
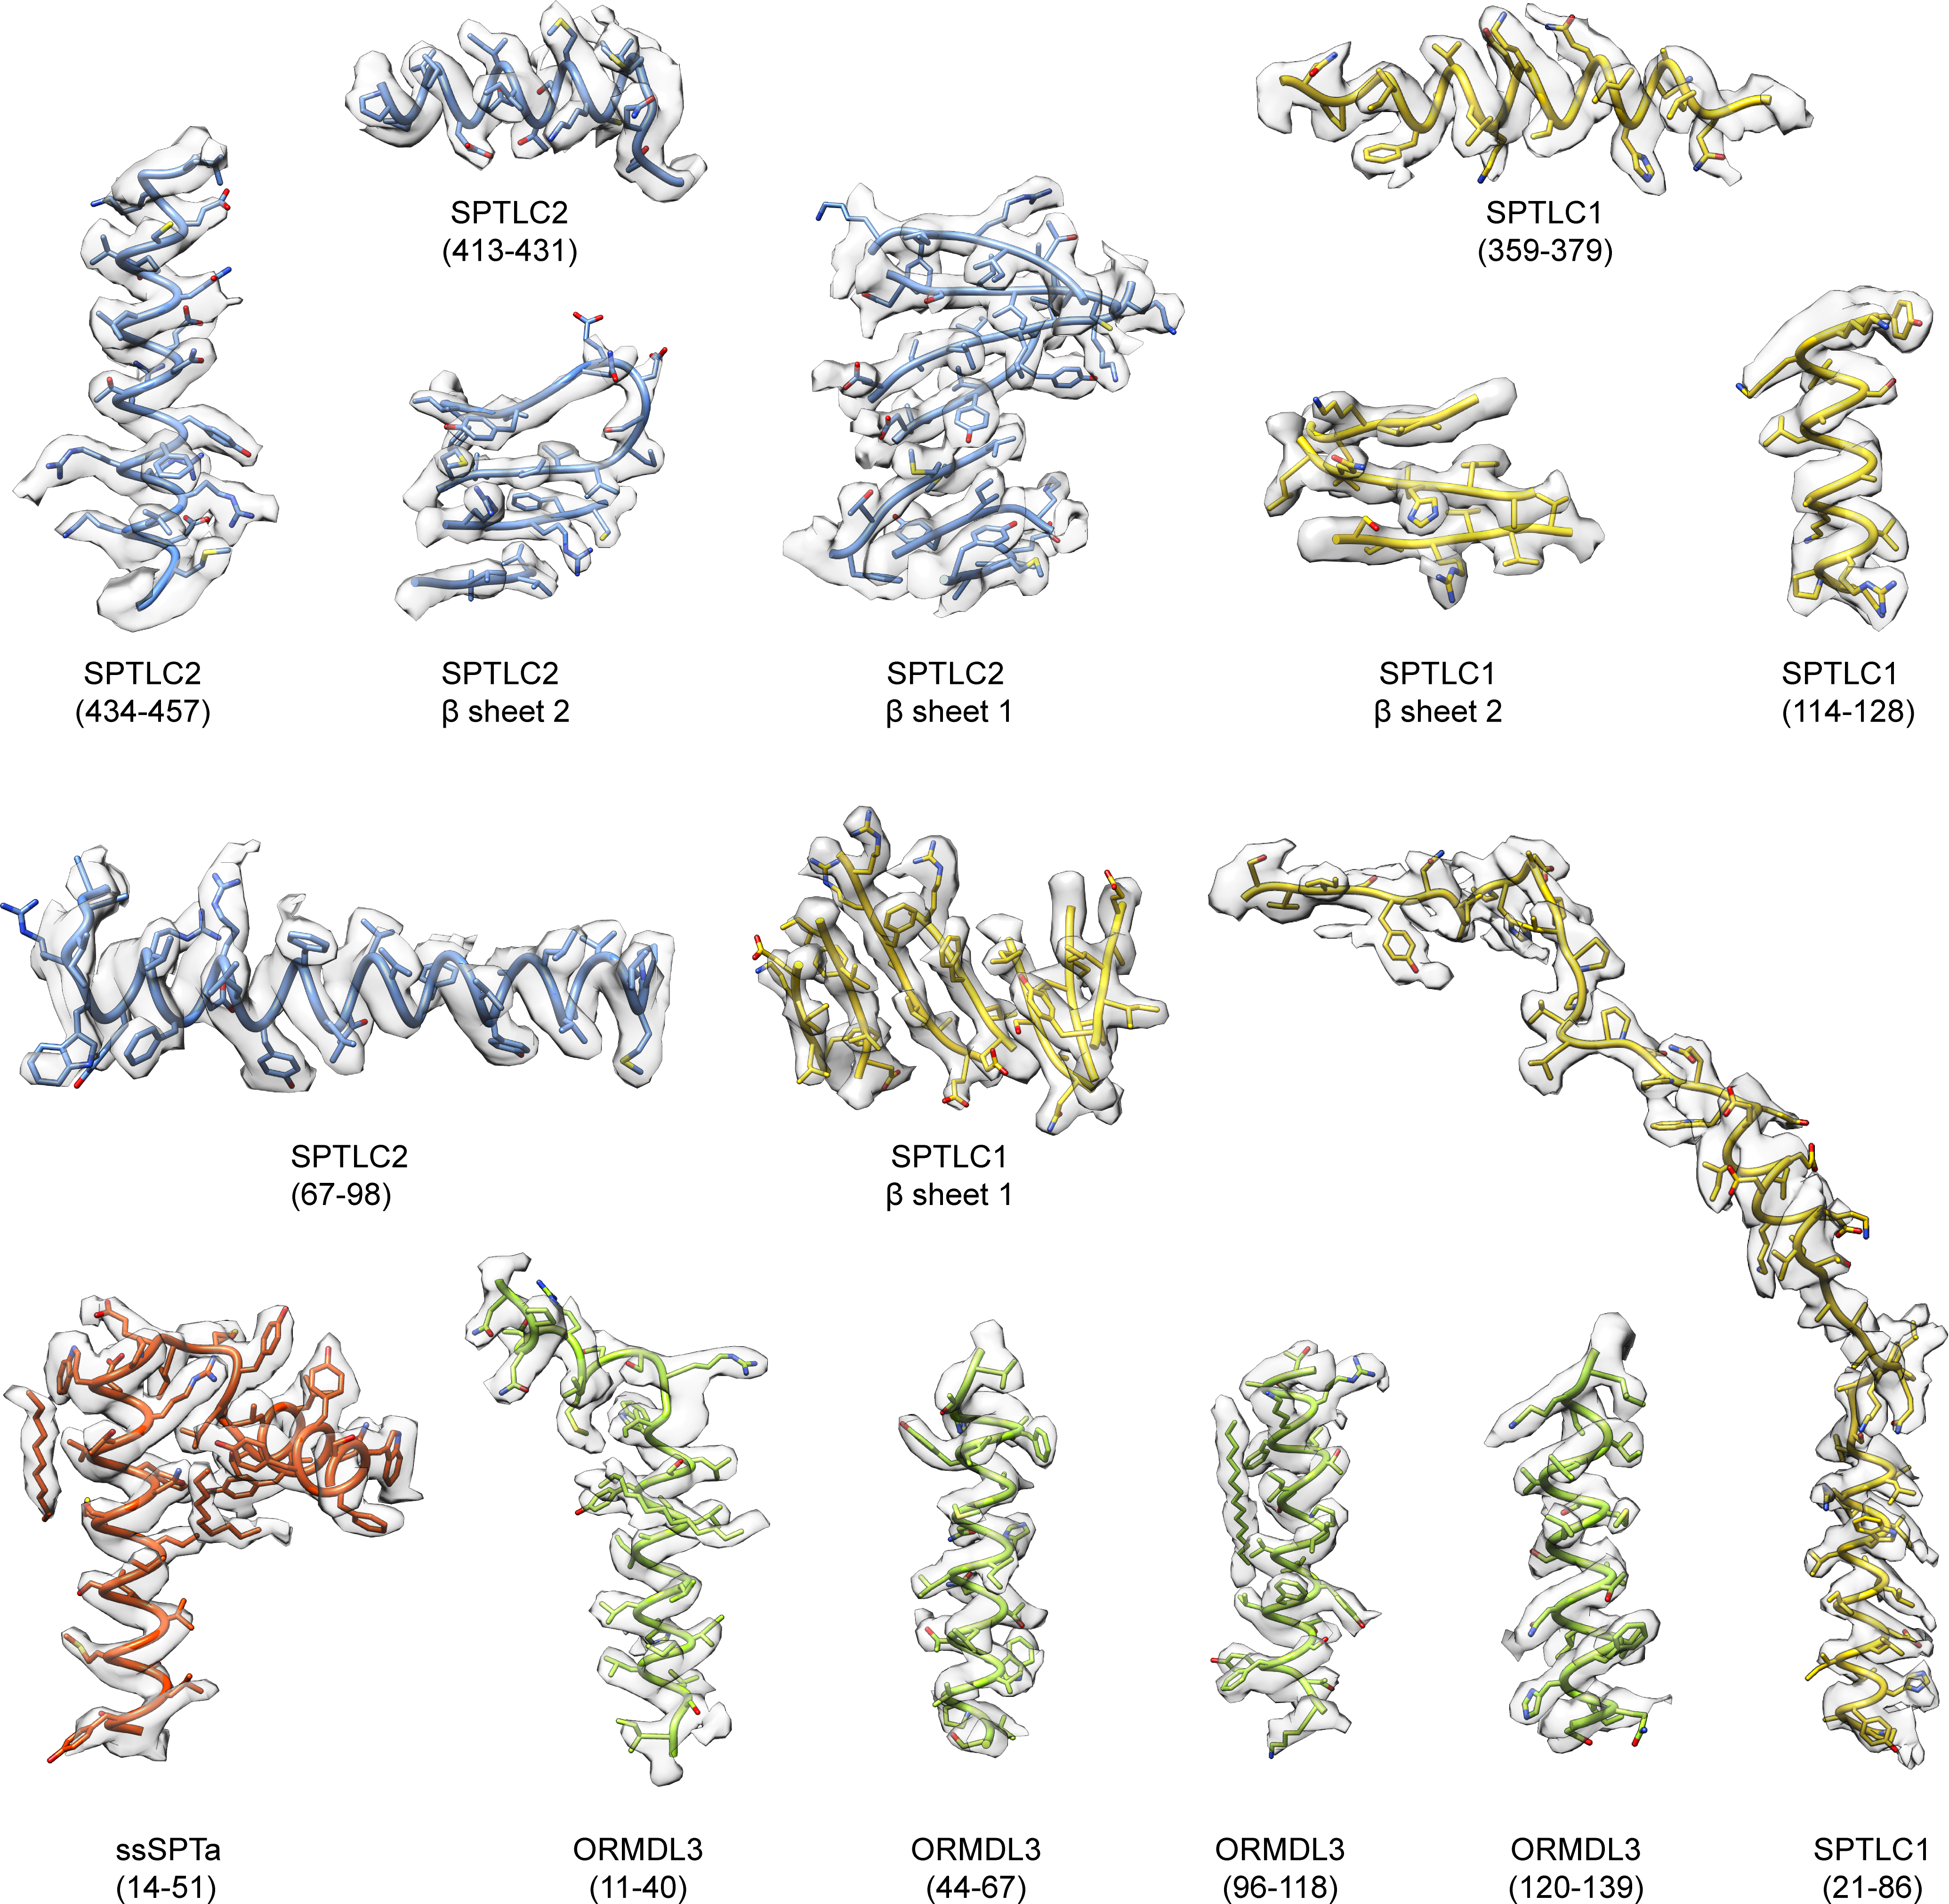
SPTLC1 β sheet 1: residues 382–387, 393–398, 443–448. SPTLC1 β sheet 2: 205–209, 184–188, 239–245, 270–274, 302–306, 316–320, 160–164. SPTLC2 β sheet 1: 458–472, 507–511, 493–497. SPTLC2 β sheet 2: 275–281, 253–259, 308–315, 339–344, 372–377, 386–391, 230–235.
Extended Data Fig. 7. Functional analysis of the SPTLC1 mutation disrupting the interface between the SPTLC S1 helix and ORMDL3.
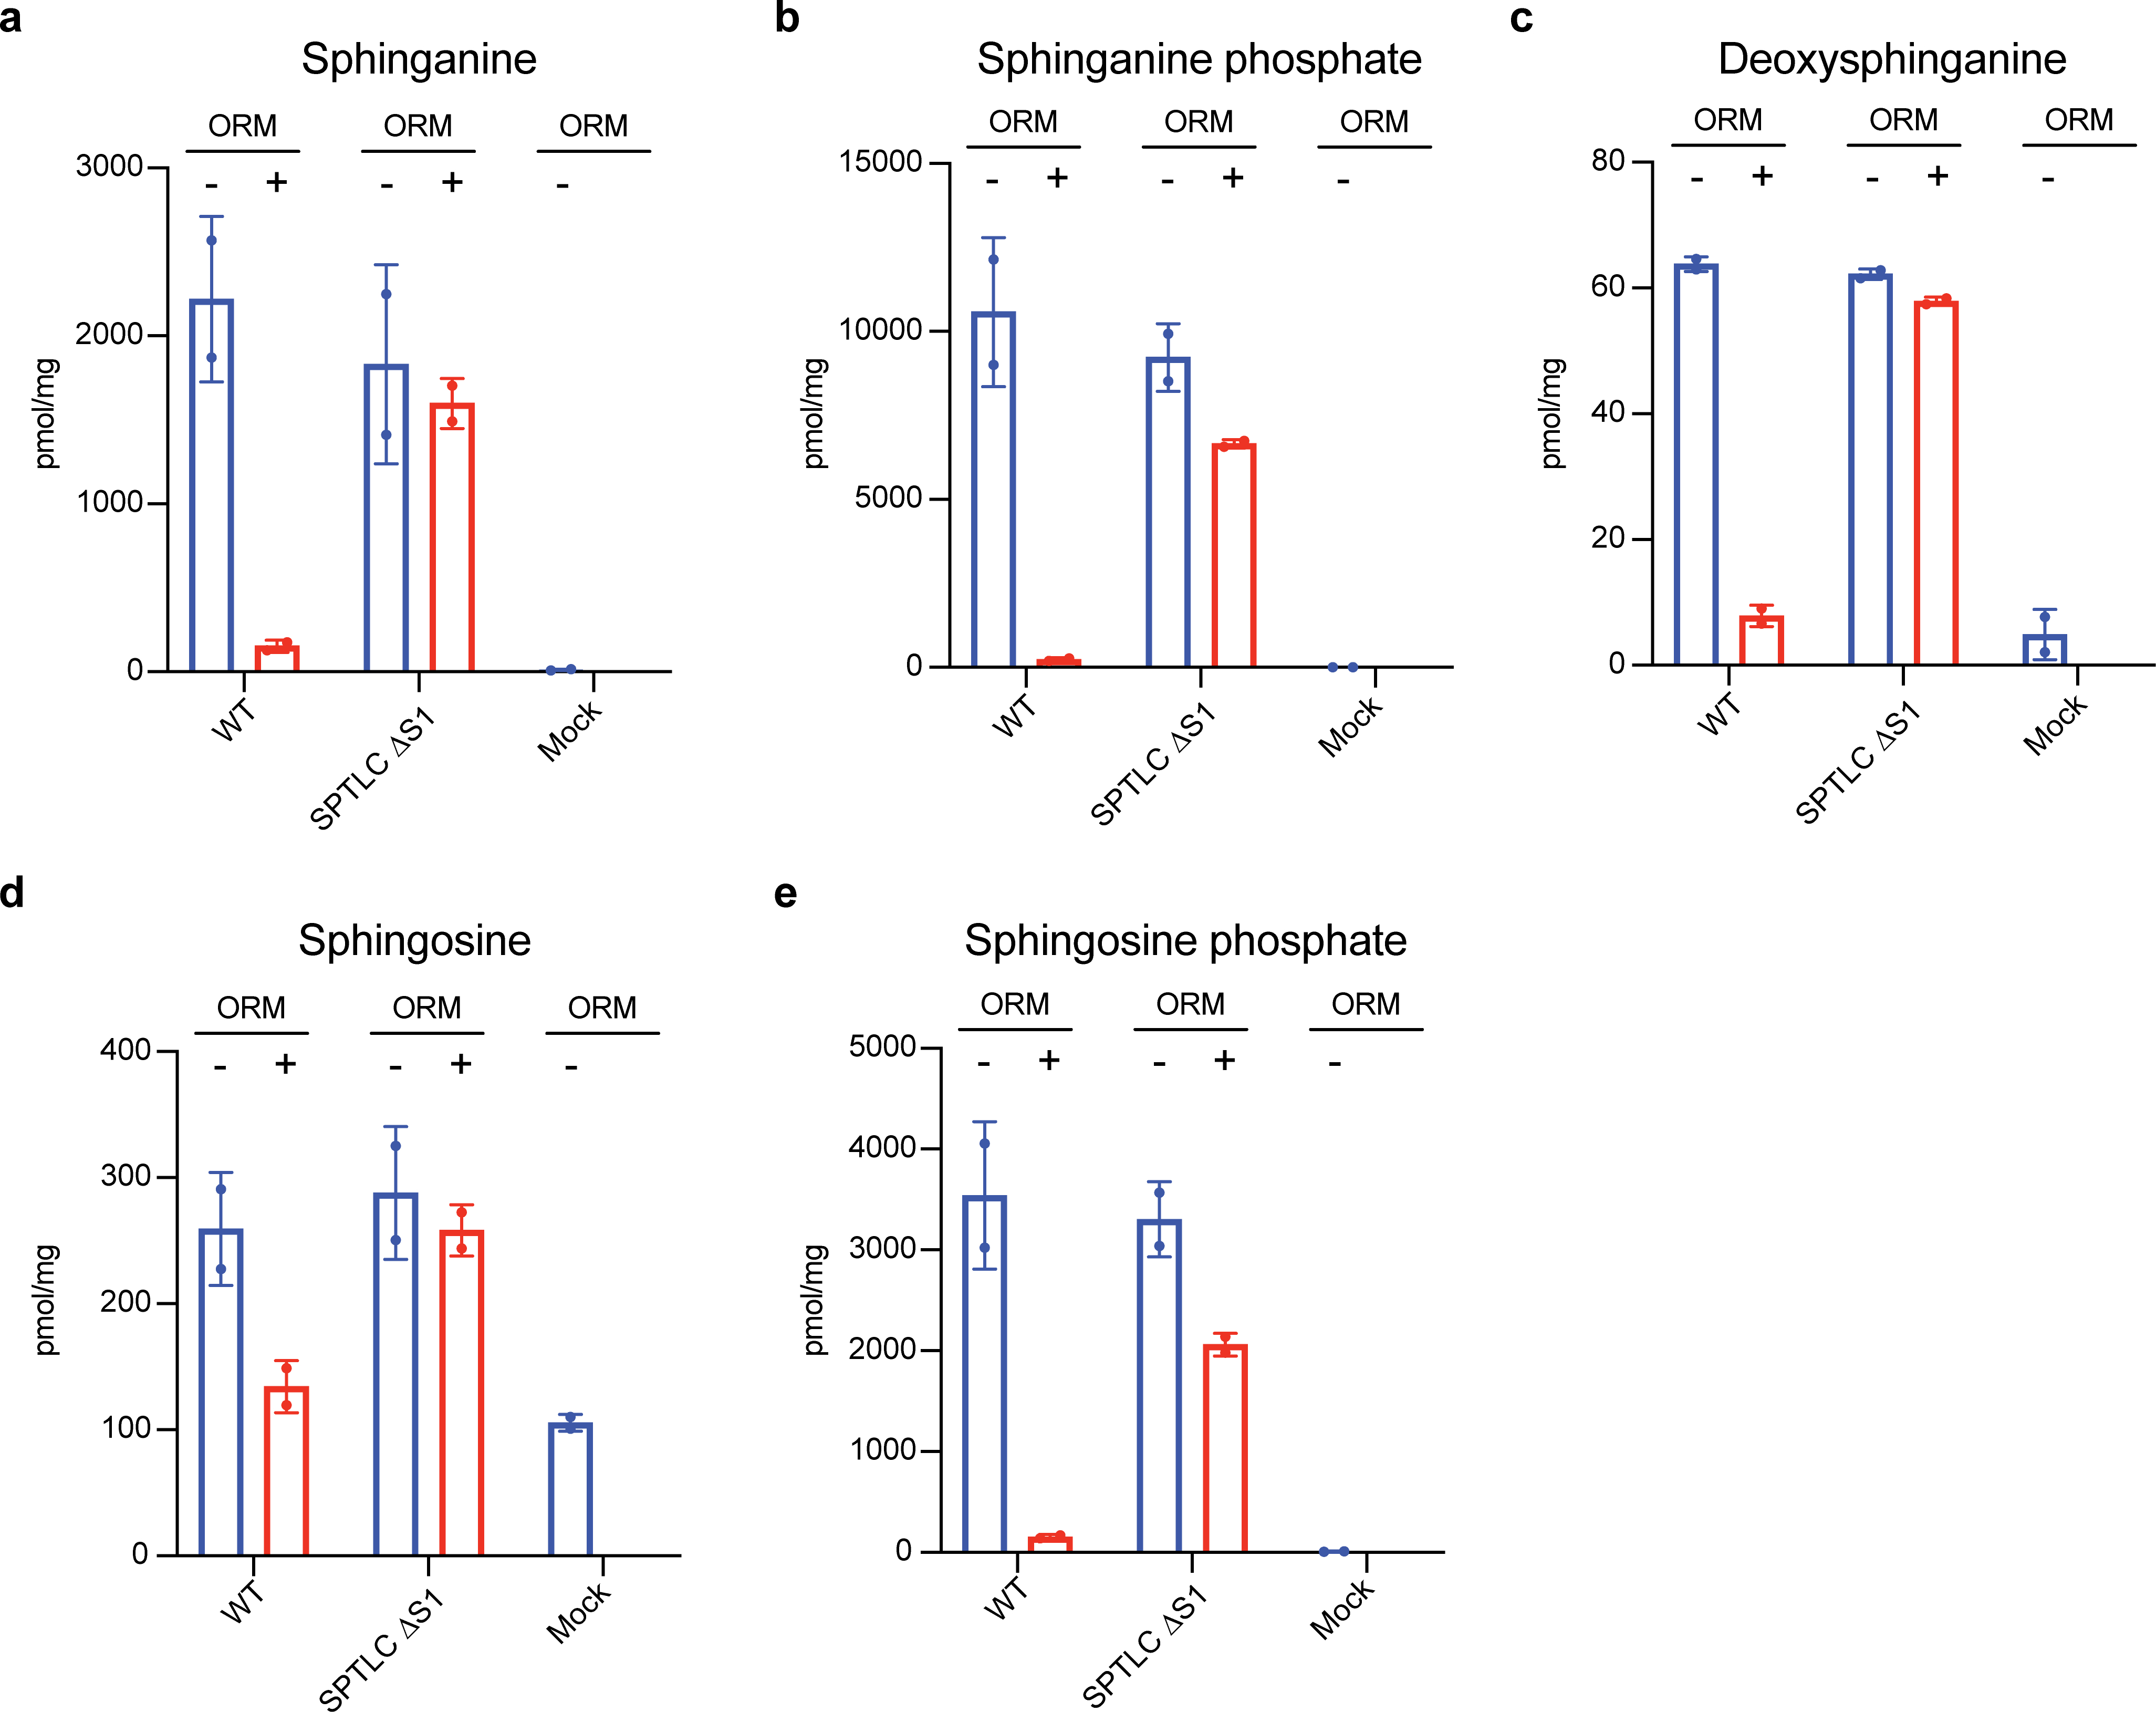
(a to e) Sphingolipid contents from cells were measured as an indication of the SPT activity. SPTLC1 ΔS1 mutant is as active as wild type, but the regulation from ORMDL3 is considerably impaired. Representative results are shown (mean ± SD; n = 2). The experiment was repeated multiple times yielding similar results. Data are available as source data.
Extended Data Fig. 8. Cryo-EM reconstructions of the SPT-ORM complex in different conformations.
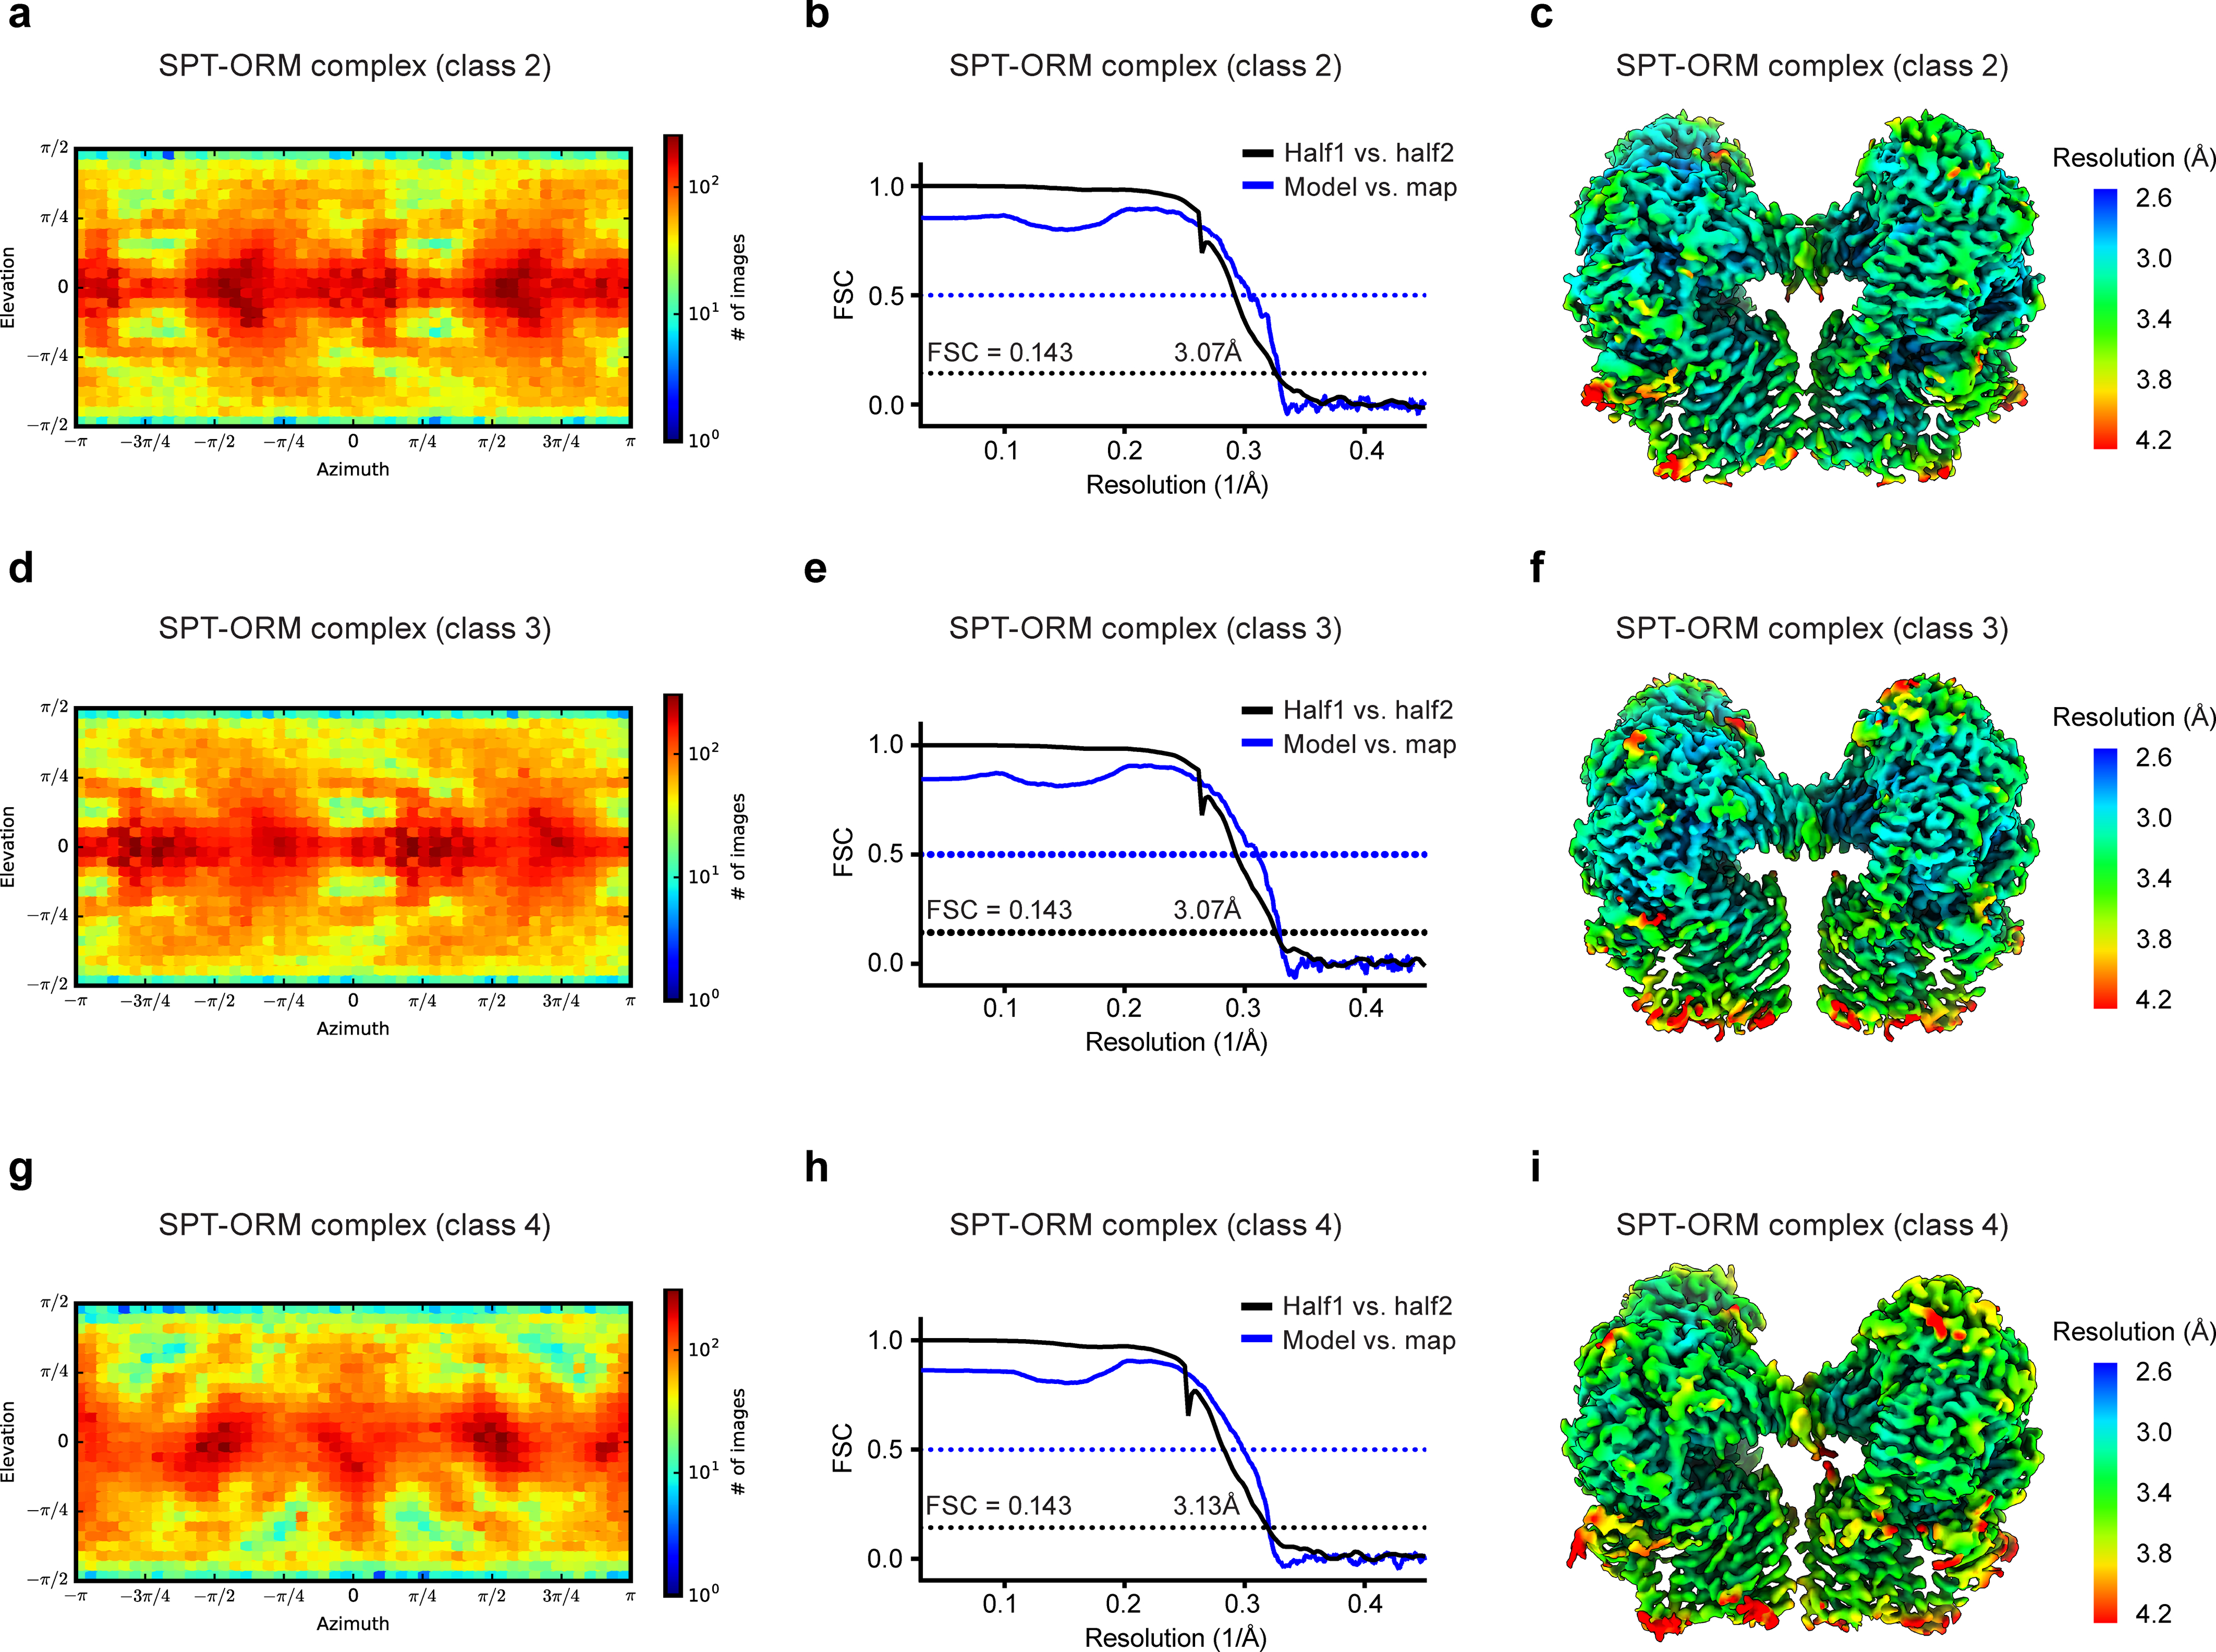
(a to c) SPT-ORM complex (class 2). (d to e) SPT-ORM complex (class 3). (g to i) SPT-ORM complex (class 4). (a, d, and g) Angular distribution of particles for the final 3D reconstructions. (b, e, and h) Fourier shell correlation (FSC) curves: half map 1 versus half map 2 (black) and model versus summed map (blue). (c, f, and i) Local resolution of cryo-EM maps.
Extended Data Fig. 9. SPT-ORM complex in different conformations.
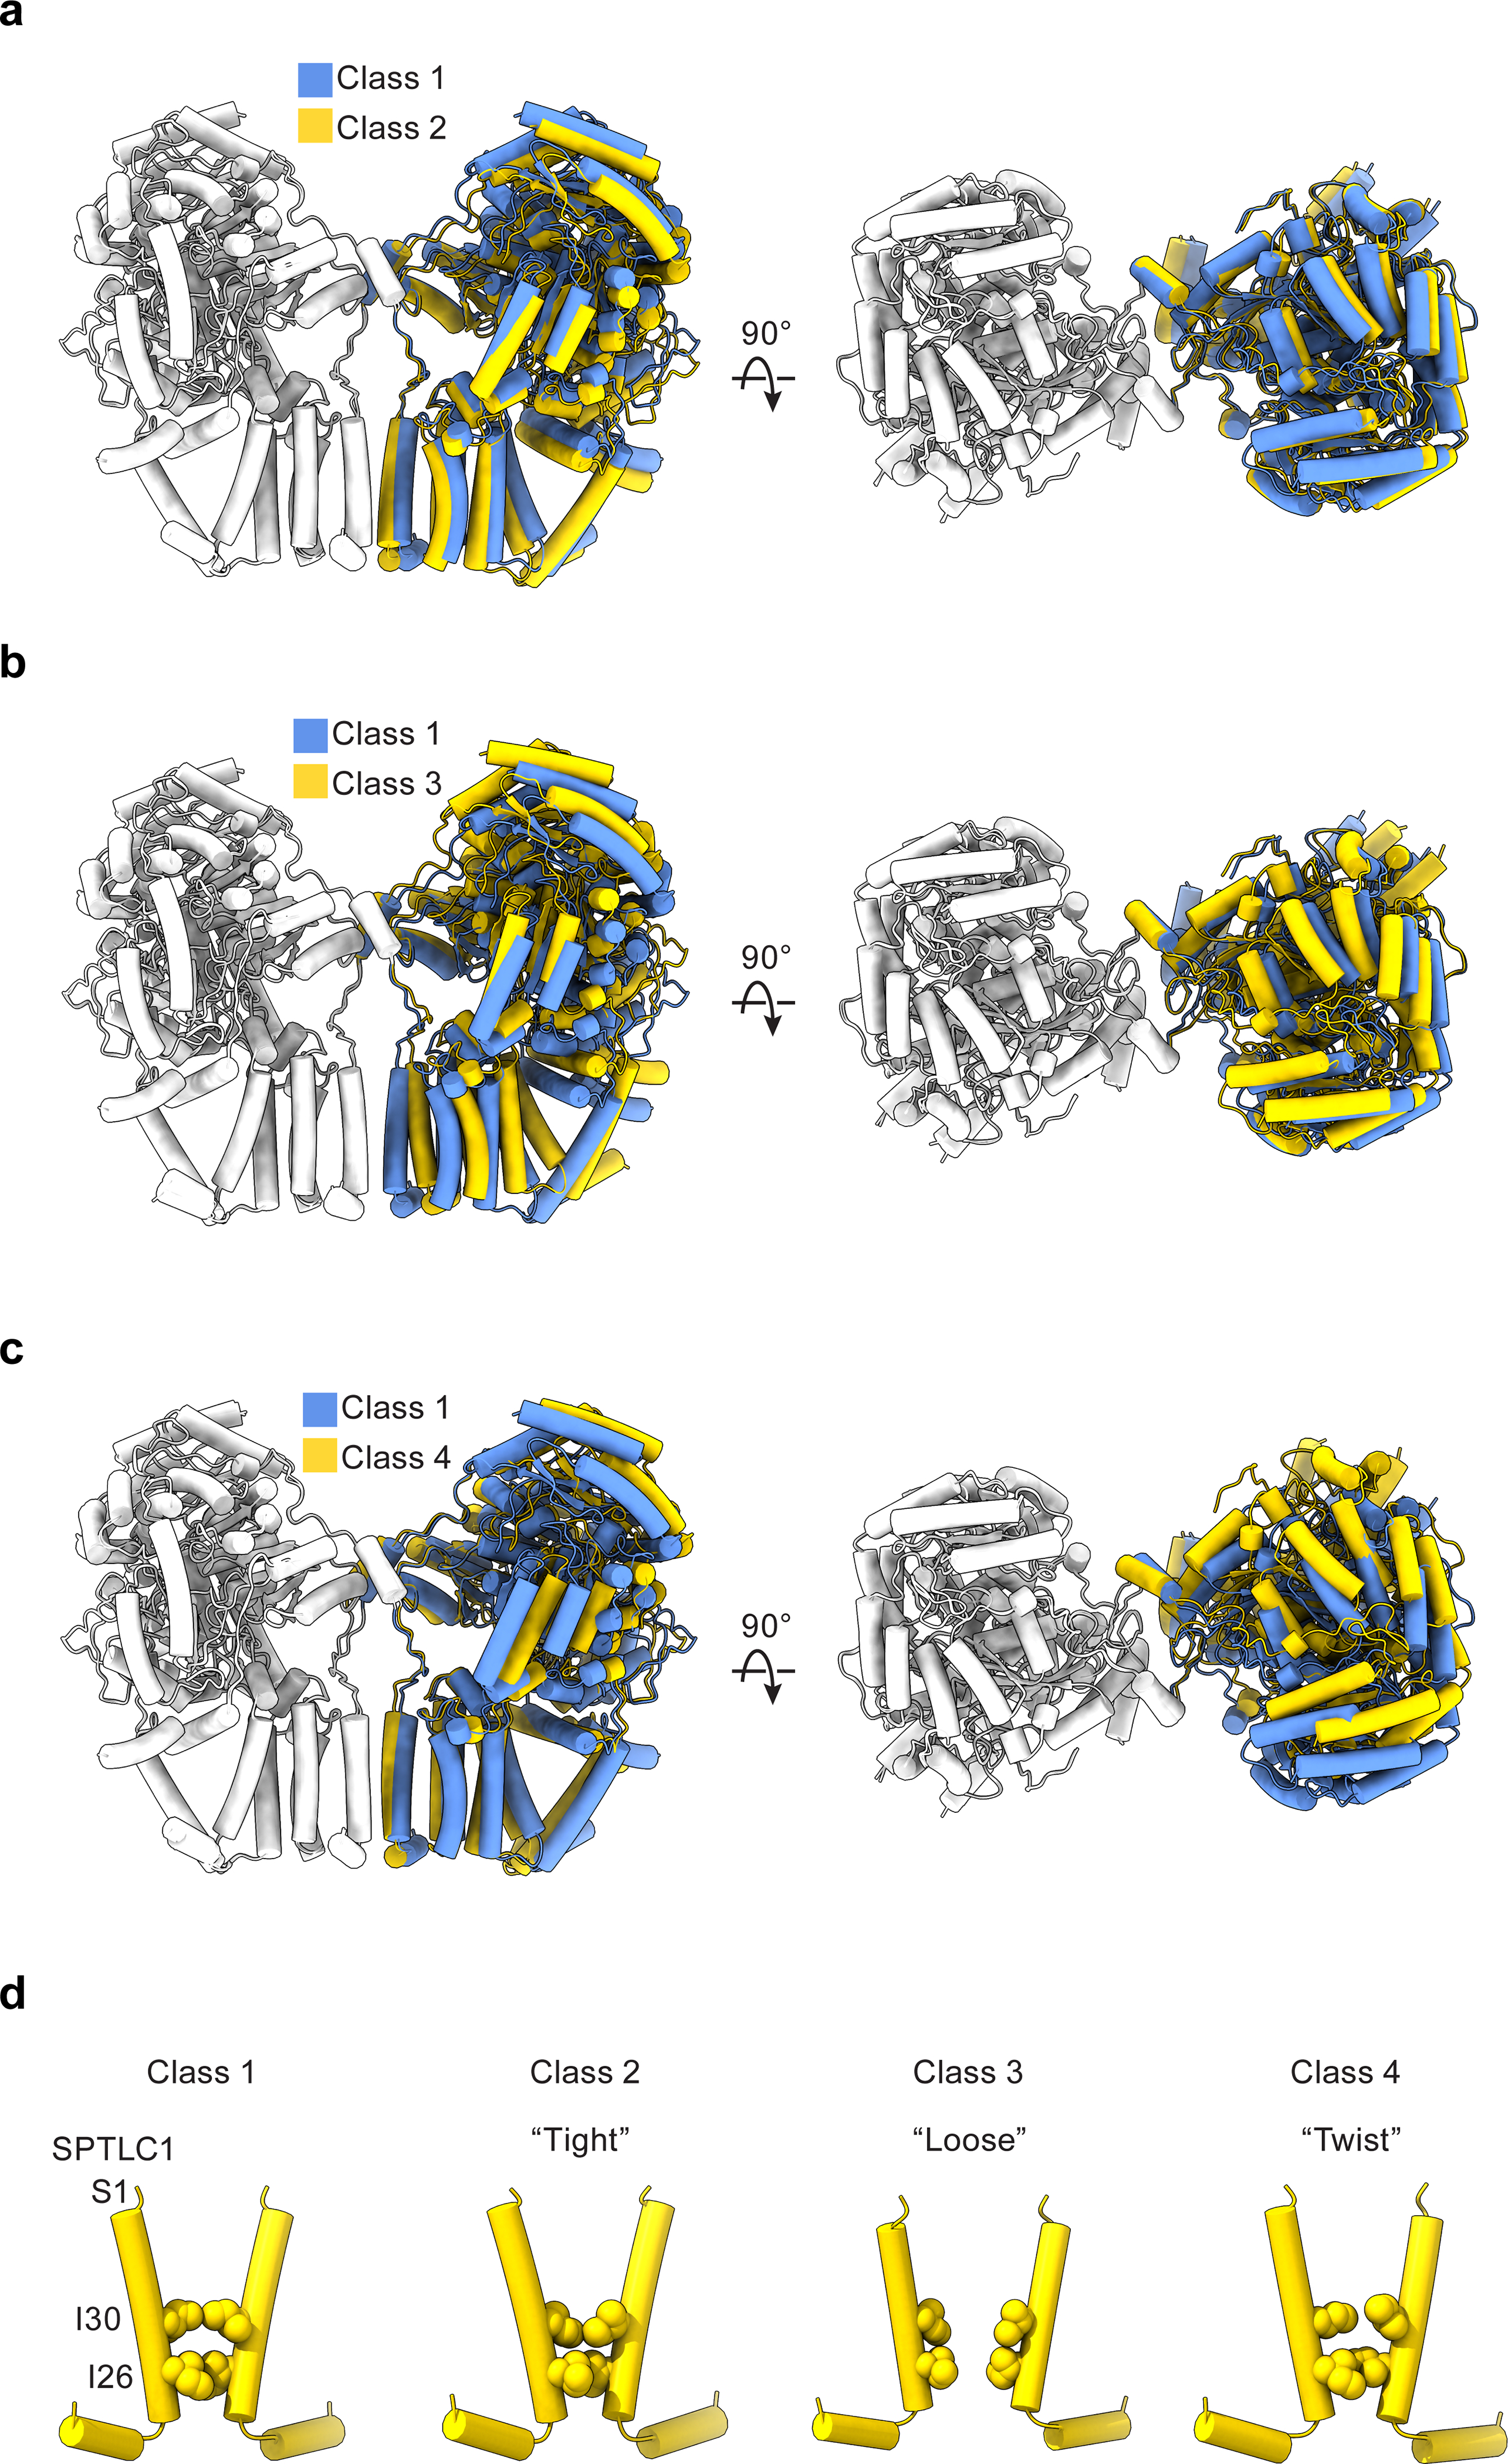
(a to c) Two structures of SPT-ORM are overlaid on the left protomer (white) to demonstrate the structural differences of the other protomer (blue or yellow). (a) class 1 versus class 2. (b) class 1 versus class 3. (c) class 1 versus class 3. (d) Conformational changes of the membrane dimeric interface among the four structures.
Extended Data Fig. 10. Cryo-EM reconstructions of the SPT-ORM complex bound to myriocin.

(a) Angular distribution of particles for the final 3D reconstruction. (b) Fourier shell correlation (FSC) curves: half map 1 versus half map 2 (black) and model versus summed map (blue). (c) Local resolution of the cryo-EM map.
Supplementary Material
Acknowledgments
We thank Dr. Liang Tang and Wei Guo at the cryo-EM Center of St. Jude Children’s Research Hospital for support with data collection and computer infrastructure. We thank Drs. Charalampos Kalodimos, Scott Blanchard, Mario Halic, Ji Sun, Xiaochun Li, Motoyuki Hattori, Wei Lü, Chen Zhao, James Lee, and Fangyu Liu for helpful discussions. We thank Zhaowen Luo for assistance with the cartoons. This work was supported by ALSAC.
Footnotes
Competing interests
The authors declare no competing interests.
Editor recognition statement (if applicable to your journal):
Florian Ullrich and Anke Sparmann were the primary editors on this article and managed its editorial process and peer review in collaboration with the rest of the editorial team.
Peer review Information:
Nature Structural and Molecular Biology thanks Binks Wattenberg, Ming Zhou, and the other, anonymous, reviewer(s) for their contribution to the peer review of this work.
Reporting Summary
Further information on experimental design is available in the Nature Research Reporting Summary linked to this article.
Data availability
The cryo-EM density maps have been deposited in the Electron Microscopy Data Bank under accession codes EMD-22598, EMD-22599, EMD-22600, EMD-22601, EMD-22602, EMD-22604, EMD-22605, EMD-22606 and EMD-22608. The corresponding atomic models have been deposited in the Protein Data Bank under accession codes PDB 7K0I, PDB 7K0J, PDB 7K0K, PDB 7K0L, PDB 7K0M, PDB 7K0N, PDB 7K0O, PDB 7K0P and PDB 7K0Q. Source data are available with the paper online.
References
- 1.Hannun YA & Obeid LM Sphingolipids and their metabolism in physiology and disease. Nature Reviews Molecular Cell Biology 19, 175–191 (2018). [DOI] [PMC free article] [PubMed] [Google Scholar]
- 2.Ogretmen B Sphingolipid metabolism in cancer signalling and therapy. Nature Reviews Cancer 18, 33–50 (2018). [DOI] [PMC free article] [PubMed] [Google Scholar]
- 3.Dunn TM, Tifft CJ & Proia RL A perilous path: the inborn errors of sphingolipid metabolism. J Lipid Res 60, 475–483 (2019). [DOI] [PMC free article] [PubMed] [Google Scholar]
- 4.Alaamery M et al. Role of Sphingolipid Metabolism in Neurodegeneration. J. Neurochem. (2020) doi: 10.1111/jnc.15044. [DOI] [PMC free article] [PubMed] [Google Scholar]
- 5.Harrison J, P., M. Dunn T & J. Campopiano D Sphingolipid biosynthesis in man and microbes. Natural Product Reports 35, 921–954 (2018). [DOI] [PMC free article] [PubMed] [Google Scholar]
- 6.Hojjati MR, Li Z & Jiang X-C Serine palmitoyl-CoA transferase (SPT) deficiency and sphingolipid levels in mice. Biochimica et Biophysica Acta (BBA) - Molecular and Cell Biology of Lipids 1737, 44–51 (2005). [DOI] [PubMed] [Google Scholar]
- 7.Bejaoui K et al. SPTLC1 is mutated in hereditary sensory neuropathy, type 1. Nature Genetics 27, 261–262 (2001). [DOI] [PubMed] [Google Scholar]
- 8.Dawkins JL, Hulme DJ, Brahmbhatt SB, Auer-Grumbach M & Nicholson GA Mutations in SPTLC1, encoding serine palmitoyltransferase, long chain base subunit-1, cause hereditary sensory neuropathy type I. Nature Genetics 27, 309–312 (2001). [DOI] [PubMed] [Google Scholar]
- 9.Dunn-Giroux T et al. SPTLC1 Mutations Associated with Early Onset Amyotrophic Lateral Sclerosis. The FASEB Journal 34, 1–1 (2020). [Google Scholar]
- 10.Johnson JO et al. Mutations in the SPTLC1 gene are a cause of juvenile amyotrophic lateral sclerosis that may be amenable to serine supplementation. bioRxiv 770339 (2020) doi: 10.1101/770339. [DOI] [Google Scholar]
- 11.Auer-Grumbach M et al. Mutations at Ser331 in the HSN type I gene SPTLC1 are associated with a distinct syndromic phenotype. Eur J Med Genet 56, 266–269 (2013). [DOI] [PMC free article] [PubMed] [Google Scholar]
- 12.Rotthier A et al. Mutations in the SPTLC2 Subunit of Serine Palmitoyltransferase Cause Hereditary Sensory and Autonomic Neuropathy Type I. Am J Hum Genet 87, 513–522 (2010). [DOI] [PMC free article] [PubMed] [Google Scholar]
- 13.Suriyanarayanan S et al. The Variant p.(Arg183Trp) in SPTLC2 Causes Late-Onset Hereditary Sensory Neuropathy. Neuromol Med 18, 81–90 (2016). [DOI] [PubMed] [Google Scholar]
- 14.Ernst D et al. Novel HSAN1 Mutation in Serine Palmitoyltransferase Resides at a Putative Phosphorylation Site That Is Involved in Regulating Substrate Specificity. Neuromol Med 17, 47–57 (2015). [DOI] [PMC free article] [PubMed] [Google Scholar]
- 15.Murphy SM et al. Hereditary sensory and autonomic neuropathy type 1 (HSANI) caused by a novel mutation in SPTLC2. Neurology 80, 2106–2111 (2013). [DOI] [PMC free article] [PubMed] [Google Scholar]
- 16.Suriyanarayanan S et al. A Novel Variant (Asn177Asp) in SPTLC2 Causing Hereditary Sensory Autonomic Neuropathy Type 1C. Neuromolecular Med. 21, 182–191 (2019). [DOI] [PubMed] [Google Scholar]
- 17.Bode H et al. HSAN1 mutations in serine palmitoyltransferase reveal a close structure–function–phenotype relationship. Hum Mol Genet 25, 853–865 (2016). [DOI] [PubMed] [Google Scholar]
- 18.Genin MJ et al. Imidazopyridine and Pyrazolopiperidine Derivatives as Novel Inhibitors of Serine Palmitoyl Transferase. J. Med. Chem. 59, 5904–5910 (2016). [DOI] [PubMed] [Google Scholar]
- 19.Kojima T et al. Discovery of novel serine palmitoyltransferase inhibitors as cancer therapeutic agents. Bioorganic & Medicinal Chemistry 26, 2452–2465 (2018). [DOI] [PubMed] [Google Scholar]
- 20.Muthusamy T et al. Serine restriction alters sphingolipid diversity to constrain tumour growth. Nature (2020) doi: 10.1038/s41586-020-2609-x. [DOI] [PMC free article] [PubMed] [Google Scholar]
- 21.Yard BA et al. The Structure of Serine Palmitoyltransferase; Gateway to Sphingolipid Biosynthesis. Journal of Molecular Biology 370, 870–886 (2007). [DOI] [PubMed] [Google Scholar]
- 22.Raman MCC et al. The External Aldimine Form of Serine Palmitoyltransferase. J Biol Chem 284, 17328–17339 (2009). [DOI] [PMC free article] [PubMed] [Google Scholar]
- 23.Ikushiro H et al. Structural Insights into the Enzymatic Mechanism of Serine Palmitoyltransferase from Sphingobacterium multivorum. J Biochem 146, 549–562 (2009). [DOI] [PubMed] [Google Scholar]
- 24.Hornemann T, Wei Y & von Eckardstein A Is the mammalian serine palmitoyltransferase a high-molecular-mass complex? Biochem. J. 405, 157–164 (2007). [DOI] [PMC free article] [PubMed] [Google Scholar]
- 25.Han G et al. Identification of small subunits of mammalian serine palmitoyltransferase that confer distinct acyl-CoA substrate specificities. PNAS 106, 8186–8191 (2009). [DOI] [PMC free article] [PubMed] [Google Scholar]
- 26.Siow DL & Wattenberg BW Mammalian ORMDL Proteins Mediate the Feedback Response in Ceramide Biosynthesis. J. Biol. Chem. 287, 40198–40204 (2012). [DOI] [PMC free article] [PubMed] [Google Scholar]
- 27.Hjelmqvist L et al. ORMDL proteins are a conserved new family of endoplasmic reticulum membrane proteins. Genome Biol. 3, RESEARCH0027 (2002). [DOI] [PMC free article] [PubMed] [Google Scholar]
- 28.Han S, Lone MA, Schneiter R & Chang A Orm1 and Orm2 are conserved endoplasmic reticulum membrane proteins regulating lipid homeostasis and protein quality control. Proc. Natl. Acad. Sci. U.S.A. 107, 5851–5856 (2010). [DOI] [PMC free article] [PubMed] [Google Scholar]
- 29.Breslow DK et al. Orm family proteins mediate sphingolipid homeostasis. Nature 463, 1048–1053 (2010). [DOI] [PMC free article] [PubMed] [Google Scholar]
- 30.Davis DL, Gable K, Suemitsu J, Dunn TM & Wattenberg BW The ORMDL/Orm–serine palmitoyltransferase (SPT) complex is directly regulated by ceramide: Reconstitution of SPT regulation in isolated membranes. J. Biol. Chem. 294, 5146–5156 (2019). [DOI] [PMC free article] [PubMed] [Google Scholar]
- 31.Harmon JM et al. Topological and Functional Characterization of the ssSPTs, Small Activating Subunits of Serine Palmitoyltransferase. J. Biol. Chem. 288, 10144–10153 (2013). [DOI] [PMC free article] [PubMed] [Google Scholar]
- 32.Zhao L et al. Elevation of 20-carbon long chain bases due to a mutation in serine palmitoyltransferase small subunit b results in neurodegeneration. Proc Natl Acad Sci U S A 112, 12962–12967 (2015). [DOI] [PMC free article] [PubMed] [Google Scholar]
- 33.Moffatt MF et al. Genetic variants regulating ORMDL3 expression contribute to the risk of childhood asthma. Nature 448, 470–473 (2007). [DOI] [PubMed] [Google Scholar]
- 34.Ono JG et al. Decreased sphingolipid synthesis in children with 17q21 asthma–risk genotypes. J Clin Invest 130, 921–926 (2020). [DOI] [PMC free article] [PubMed] [Google Scholar]
- 35.Nagiec MM, Lester RL & Dickson RC Sphingolipid synthesis: Identification and characterization of mammalian cDNAs encoding the Lcb2 subunit of serine palmitoyltransferase. Gene 177, 237–241 (1996). [DOI] [PubMed] [Google Scholar]
- 36.Weiss B & Stoffel W Human and murine serine-palmitoyl-CoA transferase--cloning, expression and characterization of the key enzyme in sphingolipid synthesis. Eur. J. Biochem. 249, 239–247 (1997). [DOI] [PubMed] [Google Scholar]
- 37.Hornemann T, Richard S, Rütti MF, Wei Y & Eckardstein A von. Cloning and Initial Characterization of a New Subunit for Mammalian Serine-palmitoyltransferase. J. Biol. Chem. 281, 37275–37281 (2006). [DOI] [PubMed] [Google Scholar]
- 38.Rütti MF, Richard S, Penno A, Eckardstein A. von & Hornemann T An improved method to determine serine palmitoyltransferase activity. J. Lipid Res. 50, 1237–1244 (2009). [DOI] [PMC free article] [PubMed] [Google Scholar]
- 39.Hanada K, Hara T & Nishijima M Purification of the serine palmitoyltransferase complex responsible for sphingoid base synthesis by using affinity peptide chromatography techniques. J. Biol. Chem. 275, 8409–8415 (2000). [DOI] [PubMed] [Google Scholar]
- 40.Wadsworth JM et al. The Chemical Basis of Serine Palmitoyltransferase Inhibition by Myriocin. J. Am. Chem. Soc. 135, 14276–14285 (2013). [DOI] [PubMed] [Google Scholar]
- 41.Ikushiro H, Hayashi H & Kagamiyama H Reactions of serine palmitoyltransferase with serine and molecular mechanisms of the actions of serine derivatives as inhibitors. Biochemistry 43, 1082–1092 (2004). [DOI] [PubMed] [Google Scholar]
- 42.Yasuda S, Nishijima M & Hanada K Localization, Topology, and Function of the LCB1 Subunit of Serine Palmitoyltransferase in Mammalian Cells. J. Biol. Chem. 278, 4176–4183 (2003). [DOI] [PubMed] [Google Scholar]
- 43.Han G et al. The Topology of the Lcb1p Subunit of Yeast Serine Palmitoyltransferase. J. Biol. Chem. 279, 53707–53716 (2004). [DOI] [PubMed] [Google Scholar]
- 44.Hanada K et al. A mammalian homolog of the yeast LCB1 encodes a component of serine palmitoyltransferase, the enzyme catalyzing the first step in sphingolipid synthesis. J Biol Chem 272, 32108–32114 (1997). [DOI] [PubMed] [Google Scholar]
- 45.Taouji S et al. Phosphorylation of Serine Palmitoyltransferase Long Chain-1 (SPTLC1) on Tyrosine 164 Inhibits Its Activity and Promotes Cell Survival. J Biol Chem 288, 17190–17201 (2013). [DOI] [PMC free article] [PubMed] [Google Scholar]
- 46.Miyake Y, Kozutsumi Y, Nakamura S, Fujita T & Kawasaki T Serine Palmitoyltransferase Is the Primary Target of a Sphingosine-like Immunosuppressant, ISP-1/Myriocin. Biochemical and Biophysical Research Communications 211, 396–403 (1995). [DOI] [PubMed] [Google Scholar]
- 47.Lee Y-S et al. Myriocin, a serine palmitoyltransferase inhibitor, suppresses tumor growth in a murine melanoma model by inhibiting de novo sphingolipid synthesis. Cancer Biology & Therapy 13, 92–100 (2012). [DOI] [PubMed] [Google Scholar]
- 48.Hanada K Serine palmitoyltransferase, a key enzyme of sphingolipid metabolism. Biochim Biophys Acta 1632, 16–30 (2003). [DOI] [PubMed] [Google Scholar]
- 49.Lone MA et al. Subunit composition of the mammalian serine-palmitoyltransferase defines the spectrum of straight and methyl-branched long-chain bases. PNAS 117, 15591–15598 (2020). [DOI] [PMC free article] [PubMed] [Google Scholar]
- 50.Clarke BA et al. The Ormdl genes regulate the sphingolipid synthesis pathway to ensure proper myelination and neurologic function in mice. eLife 8, e51067 (2019). [DOI] [PMC free article] [PubMed] [Google Scholar]
- 51.Paulenda T & Draber P The role of ORMDL proteins, guardians of cellular sphingolipids, in asthma. Allergy 71, 918–930 (2016). [DOI] [PubMed] [Google Scholar]
- 52.Davis D, Suemitsu J & Wattenberg B Transmembrane topology of mammalian ORMDL proteins in the endoplasmic reticulum as revealed by the substituted cysteine accessibility method (SCAMTM). Biochimica et Biophysica Acta (BBA) - Proteins and Proteomics 1867, 382–395 (2019). [DOI] [PMC free article] [PubMed] [Google Scholar]
- 53.Han G et al. The ORMs interact with transmembrane domain 1 of Lcb1 and regulate serine palmitoyltransferase oligomerization, activity and localization. Biochimica et Biophysica Acta (BBA) - Molecular and Cell Biology of Lipids 1864, 245–259 (2019). [DOI] [PMC free article] [PubMed] [Google Scholar]
- 54.Gupta SD et al. Expression of the ORMDLS, Modulators of Serine Palmitoyltransferase, Is Regulated by Sphingolipids in Mammalian Cells. J. Biol. Chem. 290, 90–98 (2015). [DOI] [PMC free article] [PubMed] [Google Scholar]
- 55.Siow D, Sunkara M, Dunn TM, Morris AJ & Wattenberg B ORMDL/serine palmitoyltransferase stoichiometry determines effects of ORMDL3 expression on sphingolipid biosynthesis. J Lipid Res 56, 898–908 (2015). [DOI] [PMC free article] [PubMed] [Google Scholar]
Methods-only References
- 56.Goehring A et al. Screening and large-scale expression of membrane proteins in mammalian cells for structural studies. Nat Protoc 9, 2574–2585 (2014). [DOI] [PMC free article] [PubMed] [Google Scholar]
- 57.Weissmann F et al. biGBac enables rapid gene assembly for the expression of large multisubunit protein complexes. Proc Natl Acad Sci U S A 113, E2564–E2569 (2016). [DOI] [PMC free article] [PubMed] [Google Scholar]
- 58.Kirchhofer A et al. Modulation of protein properties in living cells using nanobodies. Nat. Struct. Mol. Biol. 17, 133–138 (2010). [DOI] [PubMed] [Google Scholar]
- 59.Mastronarde DN Automated electron microscope tomography using robust prediction of specimen movements. J. Struct. Biol. 152, 36–51 (2005). [DOI] [PubMed] [Google Scholar]
- 60.Zheng SQ et al. MotionCor2 - anisotropic correction of beam-induced motion for improved cryo-electron microscopy. Nat Methods 14, 331–332 (2017). [DOI] [PMC free article] [PubMed] [Google Scholar]
- 61.Zhang K Gctf: Real-time CTF determination and correction. J Struct Biol 193, 1–12 (2016). [DOI] [PMC free article] [PubMed] [Google Scholar]
- 62.Punjani A, Rubinstein JL, Fleet DJ & Brubaker MA cryoSPARC: algorithms for rapid unsupervised cryo-EM structure determination. Nature Methods 14, 290–296 (2017). [DOI] [PubMed] [Google Scholar]
- 63.Zivanov J et al. New tools for automated high-resolution cryo-EM structure determination in RELION-3. eLife 7, e42166 (2018). [DOI] [PMC free article] [PubMed] [Google Scholar]
- 64.Ramlaul K, Palmer CM, Nakane T & Aylett CHS Mitigating local over-fitting during single particle reconstruction with SIDESPLITTER. Journal of Structural Biology 211, 107545 (2020). [DOI] [PMC free article] [PubMed] [Google Scholar]
- 65.Punjani A, Zhang H & Fleet DJ Non-uniform refinement: Adaptive regularization improves single particle cryo-EM reconstruction. bioRxiv 2019.12.15.877092 (2019) doi: 10.1101/2019.12.15.877092. [DOI] [PubMed] [Google Scholar]
- 66.Cardone G, Heymann JB & Steven AC One number does not fit all: mapping local variations in resolution in cryo-EM reconstructions. J. Struct. Biol. 184, 226–236 (2013). [DOI] [PMC free article] [PubMed] [Google Scholar]
- 67.Biasini M et al. SWISS-MODEL: modelling protein tertiary and quaternary structure using evolutionary information. Nucleic Acids Res 42, W252–W258 (2014). [DOI] [PMC free article] [PubMed] [Google Scholar]
- 68.Pettersen EF et al. UCSF Chimera--a visualization system for exploratory research and analysis. J Comput Chem 25, 1605–1612 (2004). [DOI] [PubMed] [Google Scholar]
- 69.Emsley P, Lohkamp B, Scott WG & Cowtan K Features and development of Coot. Acta Crystallogr. D Biol. Crystallogr 66, 486–501 (2010). [DOI] [PMC free article] [PubMed] [Google Scholar]
- 70.Afonine PV et al. Real-space refinement in PHENIX for cryo-EM and crystallography. Acta Crystallogr D Struct Biol 74, 531–544 (2018). [DOI] [PMC free article] [PubMed] [Google Scholar]
- 71.Chen VB et al. MolProbity: all-atom structure validation for macromolecular crystallography. Acta Crystallogr D Biol Crystallogr 66, 12–21 (2010). [DOI] [PMC free article] [PubMed] [Google Scholar]
- 72.Laskowski RA & Swindells MB LigPlot+: Multiple Ligand–Protein Interaction Diagrams for Drug Discovery. J. Chem. Inf. Model. 51, 2778–2786 (2011). [DOI] [PubMed] [Google Scholar]
- 73.Goddard TD et al. UCSF ChimeraX: Meeting modern challenges in visualization and analysis. Protein Sci. 27, 14–25 (2018). [DOI] [PMC free article] [PubMed] [Google Scholar]
- 74.Kawate T & Gouaux E Fluorescence-detection size-exclusion chromatography for precrystallization screening of integral membrane proteins. Structure 14, 673–681 (2006). [DOI] [PubMed] [Google Scholar]
- 75.Merrill AH, Sullards MC, Allegood JC, Kelly S & Wang E Sphingolipidomics: high-throughput, structure-specific, and quantitative analysis of sphingolipids by liquid chromatography tandem mass spectrometry. Methods 36, 207–224 (2005). [DOI] [PubMed] [Google Scholar]
Associated Data
This section collects any data citations, data availability statements, or supplementary materials included in this article.
Supplementary Materials
Data Availability Statement
The cryo-EM density maps have been deposited in the Electron Microscopy Data Bank under accession codes EMD-22598, EMD-22599, EMD-22600, EMD-22601, EMD-22602, EMD-22604, EMD-22605, EMD-22606 and EMD-22608. The corresponding atomic models have been deposited in the Protein Data Bank under accession codes PDB 7K0I, PDB 7K0J, PDB 7K0K, PDB 7K0L, PDB 7K0M, PDB 7K0N, PDB 7K0O, PDB 7K0P and PDB 7K0Q. Source data are available with the paper online.


