Due to a production error, the legends of Figures 2–8 were not implemented correctly.
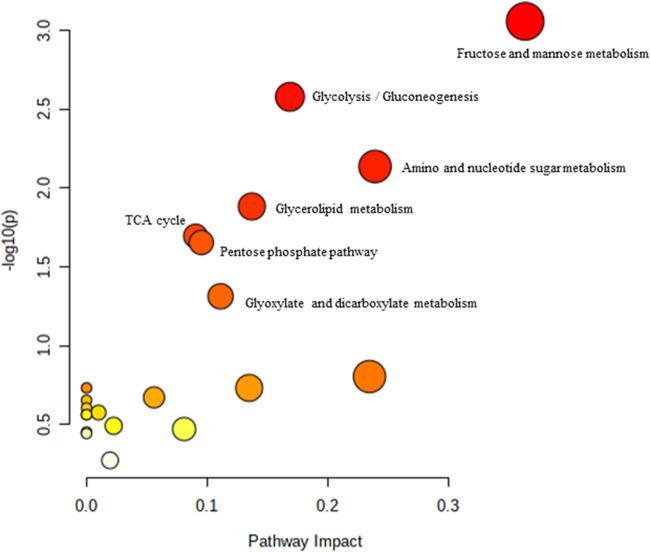
FIGURE 2.
Biochemical pathway analysis of metabolites profiled for YC vs. AC.
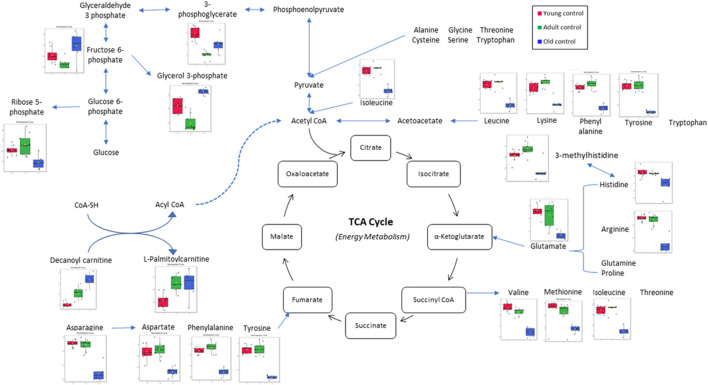
FIGURE 8.
Muscle metabolomes changes in ageing rats. Metabolite concentrations in muscle specimens are depicted graphically and subjected to quantitative analysis. Box and whiskers plots with 95% confidence intervals are presented for quantified amino acids. Analysis was performed using one-way Anova with Tukey’s post hoc analysis. *p < 0.05.
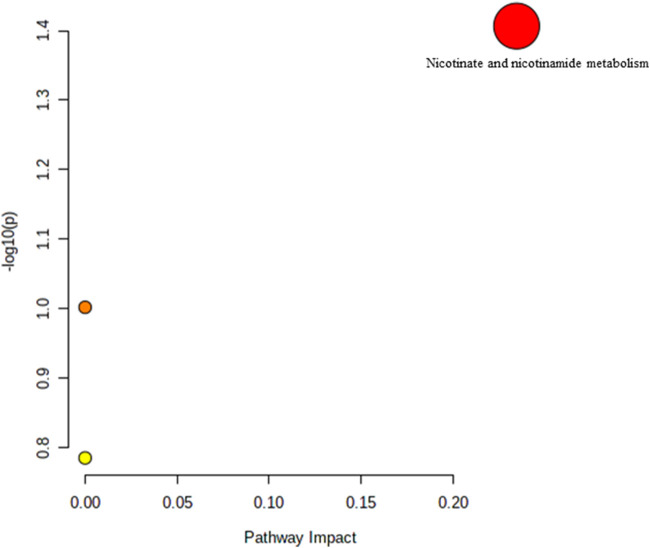
Figure 2 Legend reads as “Biochemical pathway analysis of metabolites profiled for YC vs. OC. (A) Purine metabolism; (B) Pentose and glucuronate interconversions (C) Arginine and proline metabolism.” The correct legend for Figure 2 is “'Biochemical pathway analysis of metabolites profiled for YC vs. AC.”
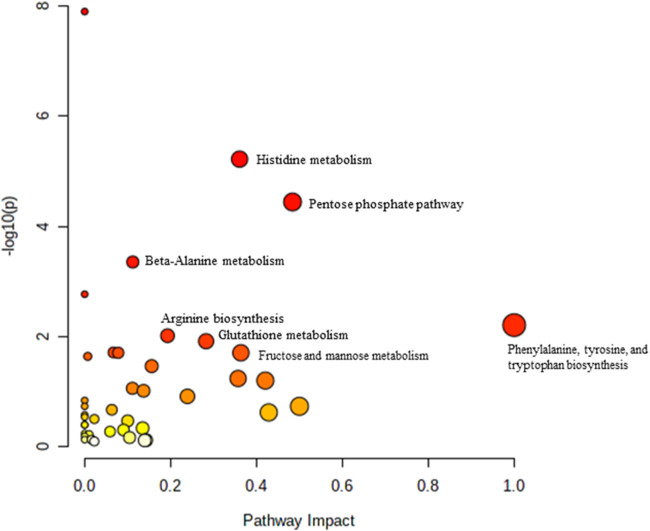
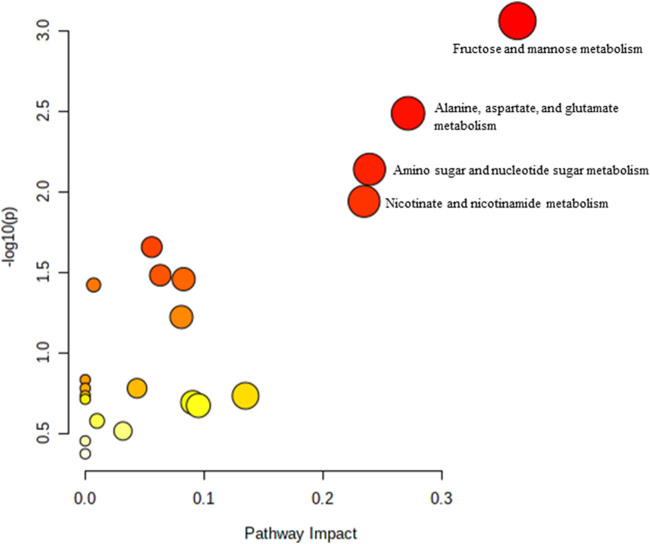
Figure 3 Legend reads as “Biochemical pathway analysis of metabolites profiled for AC vs. OC. a: Fructose and mannose metabolism.” The correct legend for Figure 3 is “Biochemical pathway analysis of metabolites profiled for YC vs. OC”.
FIGURE 3.
Biochemical pathway analysis of metabolites profiled for YC vs. OC.
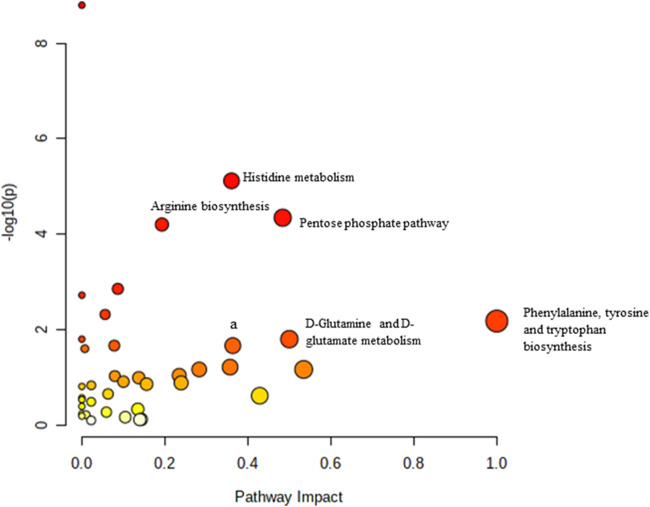
Figure 4 Legend reads as “Biochemical pathway analysis of metabolites profiled for YC vs. YT.” The correct legend for Figure 4 is “Biochemical pathway analysis of metabolites profiled for AC vs. OC. a: Fructose and mannose metabolism”.
FIGURE 4.
Biochemical pathway analysis of metabolites profiled for AC vs. OC. a: Fructose and mannose metabolism.
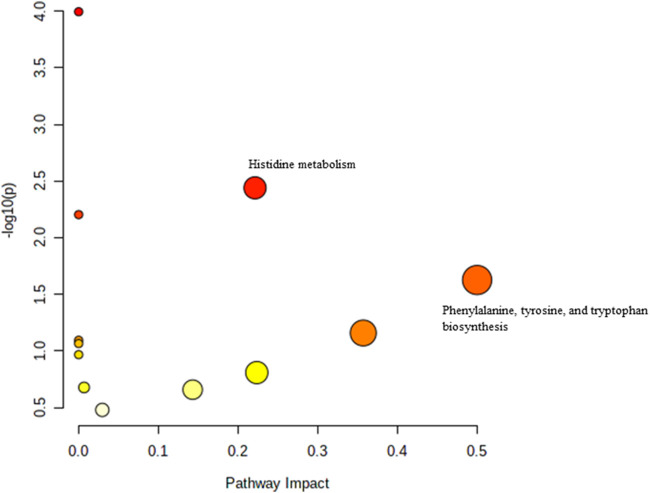
Figure 5 Legend reads as “Biochemical pathway analysis of metabolites profiled for AC vs. AT.” The correct legend for Figure 5 is “Biochemical pathway analysis of metabolites profiled for YC vs. YT”.
FIGURE 5.
Biochemical pathway analysis of metabolites profiled for YC vs. YT.
Figure 6 Legend reads as “Biochemical pathway analysis of metabolites profiled for OC vs. OT.” The correct legend for Figure 6 is “Biochemical pathway analysis of metabolites profiled for AC vs. AT”.
FIGURE 6.
Biochemical pathway analysis of metabolites profiled for AC vs. AT.
Figure 7 Legend reads as “Muscle metabolomes changes in ageing rats. Metabolite concentrations in muscle specimens are depicted graphically and subjected to quantitative analysis. Box and whiskers plots with 95% confidence intervals are presented for quantified amino acids. Analysis was performed using one-way Anova with Tukey’s post hoc analysis. *p < 0.05.” The correct legend for Figure 7 is “Biochemical pathway analysis of metabolites profiled for OC vs. OT”.
FIGURE 7.
Biochemical pathway analysis of metabolites profiled for OC vs. OT.
Figure 8 Legend reads as “Significant metabolic changes after tocotrienol-rich fraction treatment.” The correct legend for Figure 8 is “Muscle metabolomes changes in ageing rats. Metabolite concentrations in muscle specimens are depicted graphically and subjected to quantitative analysis. Box and whiskers plots with 95% confidence intervals are presented for quantified amino acids. Analysis was performed using one-way Anova with Tukey’s post hoc analysis. *p < 0.05”.
The publisher apologizes for the mistake. The original article has been updated.


