Abstract
A hydrometallurgical process is developed to lower the costs of copper production and thereby sustain the use of copper throughout the global transition to renewable energy technologies. The unique feature of the hydrometallurgical process is the reductive treatment of chalcopyrite, which is in contrast to the oxidative treatment more commonly pursued in the literature. Chalcopyrite reduction by chromium(II) ion is described for the first time and superior kinetics are shown. At high concentrate loadings of 39, 78, and 117 g L−1, chalcopyrite reacted completely within minutes at room temperature and pressure. The XRD, SEM‐EDS, and XPS measurements indicate that chalcopyrite reacts to form copper(I) chloride (CuCl). After the reductive treatment, the mineral products are leached by iron(III) sulfate to demonstrate the complete extraction of copper. The chromium(II) ion may be regenerated by an electrolysis unit inspired by an iron chromium flow battery in a practical industrial process.
Keywords: chalcopyrite, copper, electrochemistry, hydrometallurgy, leaching
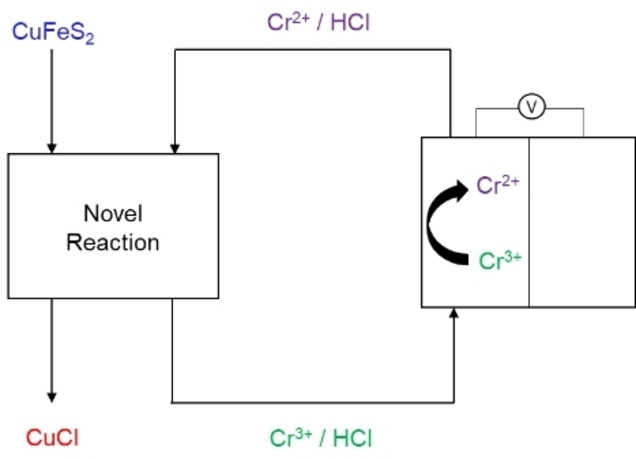
The Cr2+ ion is electrochemically generated by leveraging advances in iron chromium flow battery technologies. The Cr2+ ion reduces chalcopyrite (CuFeS2) to copper(I) chloride (CuCl) for the sustainable production of copper.
Introduction
The increasing demand for copper coincides with declining grades of copper reserves, and consequently, a global peak in copper production is expected to arise in the coming decades. [1] Alternative processing routes for chalcopyrite (CuFeS2), which accounts for approximately 70 % of the world's copper reserves, may extend the availability of copper throughout the 21st century. The pyrometallurgical process is generally used in industry to convert CuFeS2 to metallic Cu despite relatively high investment and operating costs. [2] The smelting step is generally considered to be environmentally deleterious due to the release of sulfur dioxide, carbon dioxide as well as the potential release of arsenic and other toxic elements. Industry and academia have sought to replace the pyrometallurgical process with a hydrometallurgical alternative for economic and environmental sustainability. [2]
Hydrometallurgical processes include bioleaching,[ 3 , 4 , 5 , 6 , 7 , 8 , 9 , 10 ] high temperature and pressure leaching,[ 11 , 12 ] the Galvanox process[ 13 , 14 , 15 , 16 ] and many other variants thereof, the majority of them using ferric ion and sulfuric acid. The kinetics of CuFeS2 bioleaching, and leaching in general, from ores or concentrates in a sulfate (or sulfuric acid) medium are hindered by a passivating sulfur‐like or metal‐deficient layer; consequently, leaching efficiency is poor. High temperature pressure leaching overcomes the passivation, but such conditions are often uneconomical in many plants. The galvanox process is a promising alternative to enhance copper recovery at atmospheric pressure and relatively low temperature but has not seen widespread adoption by industry. It should be noted that there are other processes in various phases of development that may become promising alternatives.[ 17 , 18 ]
The electrolytic conversion of CuFeS2 to copper may be a more promising route for its hydrometallurgical processing. [19] CuFeS2 can be electrochemically reduced to less refractory mineral phases for copper extraction.[ 20 , 21 , 22 , 23 , 24 ] Equations (1) and (2) show that CuFeS2 can be electrochemically reduced to Cu2S and, subsequently, to Cu. These reactions have undergone a number of optimizations by modifying the electrolyte, separator, electrode materials, and reactor design. [25]
| (1) |
| (2) |
Reactions 1 and 2 [Eqs. (1) and (2)] are in direct competition with the hydrogen evolution reaction, and therefore typically operate at Faradaic efficiencies below 40 %. These slurry reactions also present potential engineering challenges such as reactor plugging and electrode fouling. [25]
The chemical reduction of CuFeS2 may be advantageous because it obviates the hydrogen evolution reaction and circumvents engineering challenges associated with slurry electrodes. The chemical reduction of CuFeS2 has been tested with Fe, [26] Cu, [27] Al, [28] and SO2 [29] as reductants. These reducing agents generally require high temperatures or small particle sizes, and therefore, have not been adopted by industry. In this work, Cr2+ was tested as a reductant for the first time and superior kinetics are demonstrated. Although the cost of chromium is high relative to copper, an electrolysis unit inspired by an iron chromium flow battery (ICFB)[ 30 , 31 , 32 , 33 , 34 , 35 ] may be leveraged to efficiently regenerate the Cr2+ at high current densities.
Results and Discussion
A violent reaction was observed upon adding the CuFeS2 concentrate to the solution of 1 m CrCl2 and 4 m HCl. Reaction 3 [Eqs. (3)] is postulated to be taking place and is discussed throughout this section.
| (3) |
Figure 1 shows the pictures of the reaction between 1 m CrCl2, 4 m HCl, and 78 g L−1 CuFeS2 concentrate after 0, 2, 3, 5, and 60 s of reaction time. The pictures show the rapid release of H2S gas, which was qualitatively measured with a Sensorcon detector. The release of gas ensued immediately upon the addition of the concentrate and concluded within a minute of reaction time. The liquid phase samples were measured with gas chromatography–mass spectroscopy (GC‐MS) to confirm the presence of dissolved H2S for similar experiments.
Figure 1.
Pictures of the reaction between 1 m CrCl2, 4 m HCl and 78 g L−1 of the CuFeS2 concentrate at a) 0 s, b) 2 s, c) 3 s, d) 5 s, and e) 1 min.
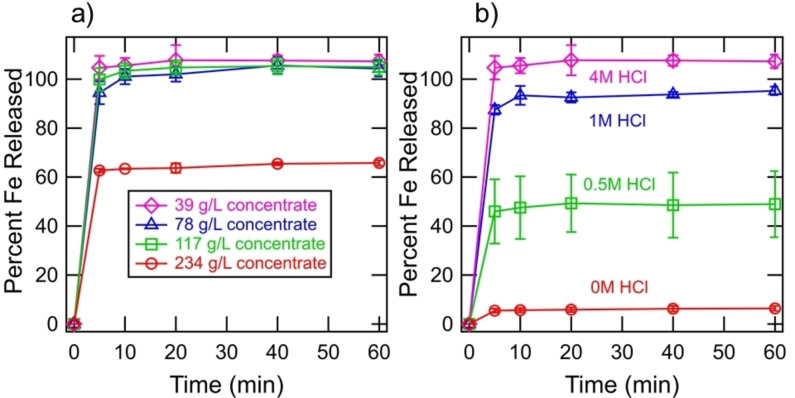
The evolution of gaseous H2S coincided with the release of Fe2+ ions to solution, which is consistent with Reaction 3 [Eqs. (3)]. Figure 2a shows the percent of Fe2+ released as a function of time for a slurry comprising 1 m CrCl2, 4 m HCl, and CuFeS2 concentrate loadings of 39, 78, 117, and 234 g L−1. The reaction kinetics were rapid considering that approximately 100 % of Fe2+ was released from CuFeS2 within 5 min for the CuFeS2 concentrate loadings of 39, 78 and 117 g L−1. The release of Fe2+, however, was limited for the CuFeS2 concentrate loading of 234 g L−1 suggesting the complete utilization of Cr2+. Measurements of Fe2+ release exceeding 100 % may indicate a minor error in the estimation of composition shown in Table 1, due to both the error in XRD quantification and the sieving of the concentrate to be within 53–106 μm. The experiments were conducted while purging the headspace of the reactor with argon and similar results were observed, indicating that small amount of oxygen present in the system did not oxidize Cr2+ to any significant level. The release of copper ions to solution during the progression of the reaction was measured, but the quantitative results were inconsistent due to the precipitation of the ions out of solution, which is discussed below. The copper ions are thought to be released in the form of Cu+, rather than Cu2+, due to the reductive conditions of the electrolyte and presence of the chloride ion for stability. The pH of the solutions after the reduction experiments were below zero, ensuring that these reactions were not pH limited. The Cu2+ ion is not thought to be present due to the reductive conditions in the electrolyte.
Figure 2.
(a) Release of Fe2+ ions to solution during the progression of the reaction between 1 m CrCl2, 4 m HCl, and various loadings of CuFeS2 concentrate. (b) Release of Fe2+ ions to solution during the progression of the reaction between 1 m CrCl2, 39 g L−1 CuFeS2 concentrate, and various initial concentrations of HCl. Error bars show the standard deviations of replicates in triplicate.
Table 1.
Mineralogy of concentrate supplied by Freeport‐McMoRan.
|
Mineral |
Chemical Formula |
Percent |
|---|---|---|
|
Chalcopyrite |
CuFeS2 |
78.3 |
|
Pyrite |
FeS2 |
12.9 |
|
K‐feldspar |
KAlSi3O8 |
2.9 |
|
Plagioclase |
NaAlSi3O8 |
2.9 |
|
Quartz |
SiO2 |
2.2 |
|
Molybdenite |
MoS2 |
0.85 |
Figure 2b shows the percent of Fe2+ released as a function of time for slurries comprising 1 m CrCl2, 39 g L−1 of CuFeS2 concentrate, and initial HCl concentrations of 0 m, 0.5 m, 1 m, and 4 m. The pH of the solution after the reduction step was approximately 2.5 for the slurries with initial HCl concentrations of 0 m, 0.5 m, 1 m, indicating that these reactions were pH limited. The pH of the solution after the reduction step may be leveraged to facilitate a separation between Fe2+ and Cr3+, which may be desirable prior to the reduction of Cr3+ to Cr2+ by an electrolysis unit. These results suggest that the proton has a greater stoichiometric number than CuFeS2, which is consistent with Reaction 3 [Eqs. (3)]. The experiments conducted with initial HCl concentrations of 2 m and 3 m were found not to be pH limited.
Figure 3 shows images of the mineral products after 60 min of reduction with the Cr2+ ion obtained with a Keyence VHX‐5000 microscope. The results indicate that the mineral product is affected by the CuFeS2 concentrate loading. The 39 g L−1 CuFeS2 loading yielded a green product, which is consistent with the appearance of CuCl as well as other potential Cu−Cl complexes. The various mineral products were characterized and shown to yield different amounts of copper recovery, which is discussed below. The mineral products post reaction with various HCl concentrations yielded the same trend in appearance.
Figure 3.
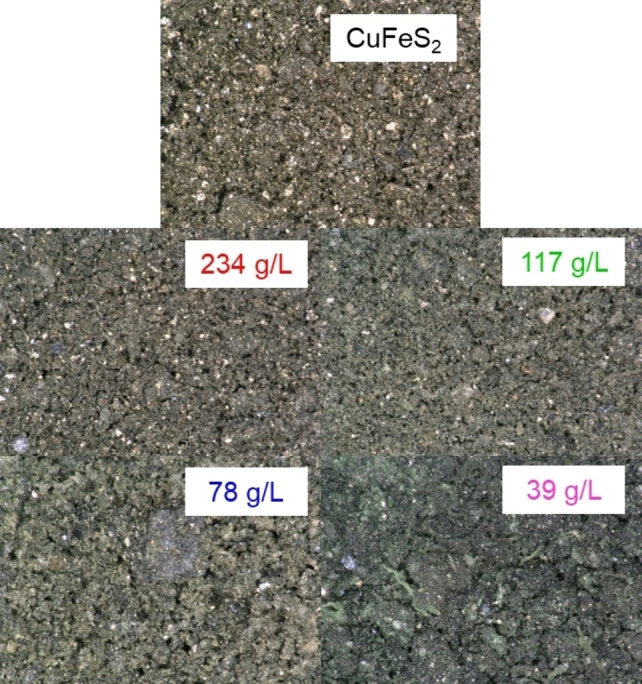
Optical microscopy images of the mineral products after reaction between various chalcopyrite concentrate loadings, 1 m CrCl2 and 4 m HCl for 60 min.
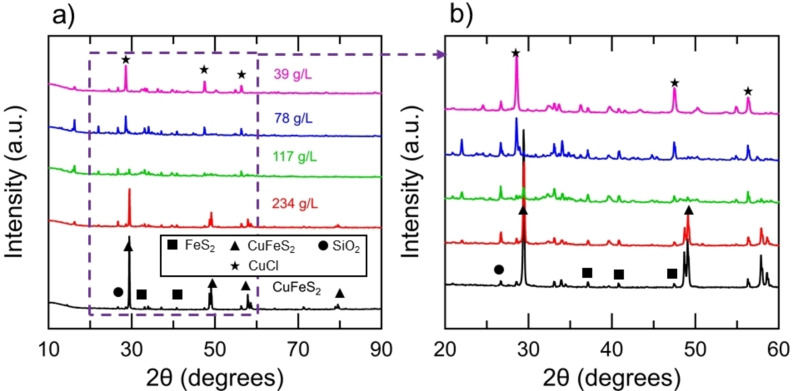
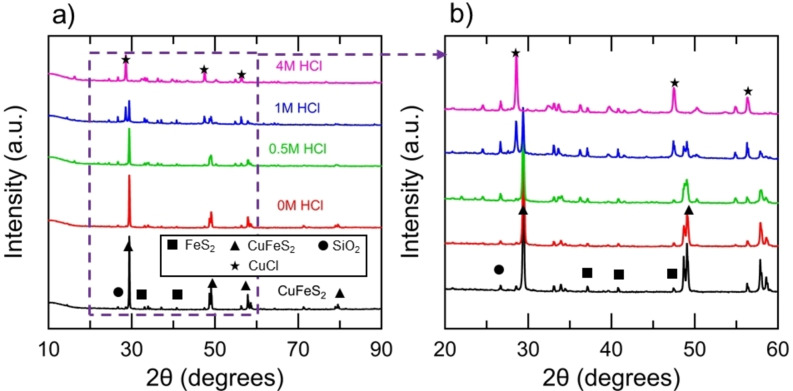
Figure 4 shows the XRD spectra for the various chalcopyrite concentrate loadings subsequent to reaction with the Cr2+ ion, and Figure 5 shows the XRD spectra for the mineral samples subsequent to reaction with the Cr2+ ion and various initial HCl concentrations. The predominant peaks of the unreacted CuFeS2 concentrate were consistent with CuFeS2, FeS2, and SiO2, as shown in Table 1. The relative intensity of the peaks associated with CuFeS2 diminished for the reacted mineral products, consistent with the Fe2+ release measured by AAS. The peaks associated with the reaction products emerged for the mineral products with high conversion of CuFeS2. The predominant mineral product was determined to be copper chloride (CuCl) from the spectra. Secondary products, such as Cu2(OH)3Cl, were consistent with the spectra. Reaction 4 [Eqs. (4)] shows the precipitation of CuCl out of solution, which is the primary product formed. Reaction 4 is shown for simplicity whereas the chemistry taking place is more complicated and a variety of Cu−Cl complexes precipitate. The precipitation of CuCl out of the solution containing 4 m HCl was unexpected considering that the molar ratio of Cl/Cu was 36 in the system. However, the molar ratio of Cl/Cr was 6, and therefore, complexes formed between Cl− and Cr3+ may lower the number of Cl− ions available to stabilize Cu+. The concentration of Cu+ in solution after 60 min of reduction was approximately 0.07 m, which is close to the solubility limit of 0.233 m reported at 2 m HCl in the literature. [36] It is estimated that 40 % of copper in the system remained in the bulk solution as Cu+ and 60 % precipitated out of solution for the experiments conducted with a concentrate loading of 39 g L−1 and an acid concentration of 4 m HCl.
| (4) |
Figure 4.
XRD results for the mineral products after reaction between various chalcopyrite concentrate loadings, 1 m CrCl2 and 4 m HCl for 60 min. (b) Close‐up of region used to identify mineral products.
Figure 5.
(a) XRD results for the mineral products after reaction between 39 g L−1 of the chalcopyrite concentrate with 1 m CrCl2 and various initial concentrations of HCl for 60 min. (b) Close‐up of region used to identify mineral products.
The XRD data, in conjunction with the AAS data, indicate that the FeS2 and silicates were inert during the reductive treatment. Experiments were conducted between 39 g L−1 CuFeS2 concentrate, 1 m CrCl2, 4 m HCl and initial ferrous chloride (FeCl2) concentrations of 0, 0.5 m, 1 m, and 2 m. It was determined that the reduction process can tolerate initial FeCl2 concentrations of 1 m and below. The Fe2+ precipitated out of solution for the experiment conducted with an initial FeCl2 concentration of 2 m.
Figure 6 shows SEM results for the mineral products after reaction with 1 m CrCl2 and 4 m HCl for 60 min. The mineral products develop some mossy features, which may be related to the growth of CuCl. Figure 7 shows EDS results for the mineral samples post reduction with the Cr2+ ion. The unreacted CuFeS2 concentrate samples show peaks corresponding to Cu, Fe, S, Si, and O. The reacted samples show the diminishment in the Fe and S peaks, which is consistent with the release of Fe2+ to solution and the release of H2S as a gas. The minor S peak present in the 39 g L−1 sample may be related to the presence of unreacted FeS2 in the mineral products. The reacted samples also show the emergence of the Cl peak, which is consistent with the formation of CuCl. The Cu peak elongates for the reacted samples due to the increasing mass fraction of Cu within the samples. No peak corresponding to Cr was observed in the spectra, indicating that the presence of Cr within the samples is minor. The samples were digested in aqua regia and the mass fraction of Cr within the samples was estimated to be 1–3 %. The presence of chromium is thought to be an artifact of the procedure used to filter and dry the mineral products.
Figure 6.
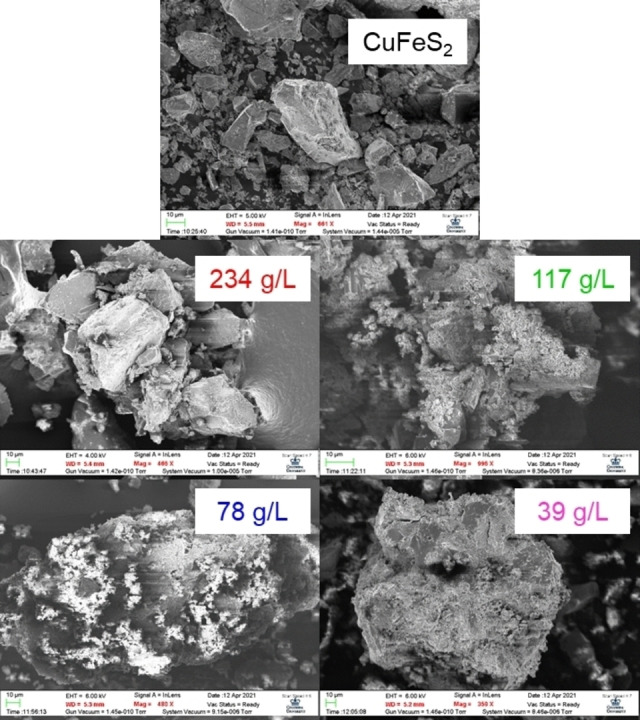
SEM images of mineral products after reaction with 1 m CrCl2 and 4 m HCl for 60 min.
Figure 7.
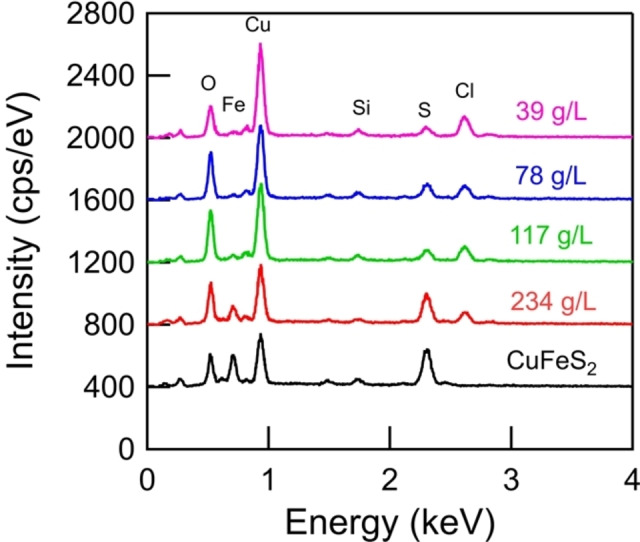
EDS results for the mineral products after reaction with 1 m CrCl2 and 4 m HCl for 60 min.
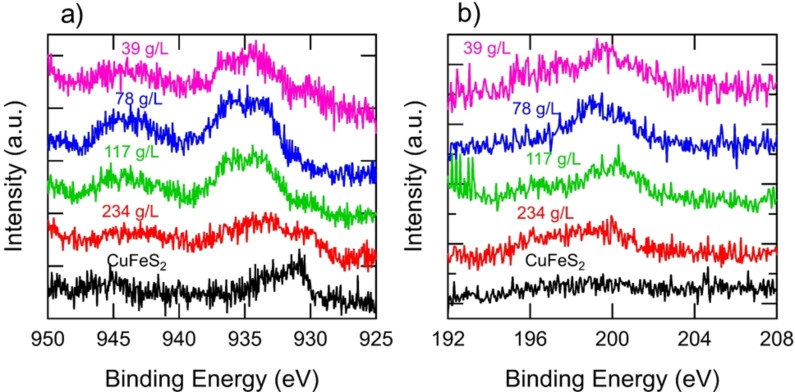
Figure 8 shows the XPS spectra of Cu and Cl for the mineral samples post reduction with the Cr2+ ion. The Cr element was not observed on the mineral products, which further indicates that the samples were not comprised of chromium. Similarly, Fe and S were not observed on the surface of the mineral reaction products, which is consistent with the release of Fe2+ and H2S from the surface of the particles into the solution phase. The XPS data indicate the absence of a sulfur passivation layer, which may account for the rapid kinetics of the reduction reaction. The various copper peaks indicate the presence of several copper‐containing products leading to convoluted spectra. For instance, the peaks at the binding energies of 944 and 935 eV are assigned to Cu2(OH)3Cl and CuCl, respectively. The Cu scans also show an observable shift in binding energy from the CuFeS2 concentrate standard. The emergence of a Cl peak for the reacted samples is consistent with the formation of Cu−Cl complexes.
Figure 8.
XPS results for mineral products after reaction with 1 m CrCl2 and 4 m HCl for 60 min for (a) Cu and (b) Cl.
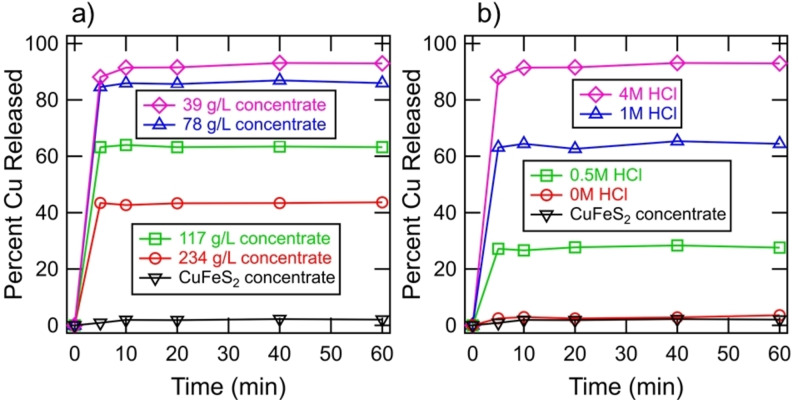
Figure 9 shows the extraction of Cu2+ from the mineral products by 0.5 m Fe2(SO4)3. Reaction 5 [Eqs. (5)] shows the leaching reaction of CuCl by the Fe3+ oxidant, which goes to completion within minutes.
Figure 9.
(a) Extraction of Cu2+ from mineral products by 0.5 m Fe2(SO4)3 subsequent to the reaction between 1 m CrCl2, 4 m HCl, and various loadings of CuFeS2 concentrate. (b) Extraction of Cu2+ from mineral products by 0.5 m Fe2(SO4)3 subsequent to reaction between 1 m CrCl2, 39 g L−1 CuFeS2 concentrate, and various initial concentrations of HCl.
The results show that virtually all of the Cu2+ can be extracted from the 39 g L−1 mineral product. The aqueous solution may subsequently undergo solvent extraction and electrowinning for the production of metallic copper. In experiments, not shown, the 39 g L−1 sample was solubilized to the same extent in 1 m H2SO4, and therefore, the ferric ion may not be required for the extraction of copper. The incomplete copper extraction for higher pulp densities is partly related to the incomplete conversion of CuFeS2 shown in Figure 2. Also, potential intermediates formed, such as Cu2(OH)3Cl, may be refractory for copper leaching and undesirable. It is shown that virtually no Cu2+ is extracted from the CuFeS2 concentrate, and therefore, the reductive treatment directly leads to the extraction of copper.
Conclusions
Chalcopyrite concentrate was reduced by CrCl2 in acid solution for the first time and superior kinetics were shown at room temperature and ambient pressure. AAS was used to measure the complete release of Fe2+ from CuFeS2 within minutes during its reduction. XRD and SEM‐EDS were used to characterize the predominant mineral product to be CuCl. The measurements also indicate that pyrite and silicates were inert during the reductive treatment. XPS was used to measure the surface of the mineral products and the results suggest that the rapid kinetics may be related to the lack of a passivation layer during the reduction step. The mineral products were leached by the ferric ion to demonstrate complete copper recovery.
Experimental Section
Reduction of CuFeS2
Chalcopyrite mineral concentrate was kindly provided by Freeport‐McMoRan. It was analyzed by the supplier with energy dispersion X‐ray diffraction to have the following composition as shown in Table 1.
The CuFeS2 concentrate was sieved (−140+270 mesh) to confine the particle size to be within 53–106 μm. An amount of 50 g of the concentrate was subsequently rinsed with 1 L of DI water and 1 L of 1 m H2SO4 to remove any soluble iron and copper ions generated during natural concentrate oxidation occurring in transport and storage. CuFeS2 concentrate pulp densities of 39, 78, 117, or 234 g L−1 were added to a 250 mL Erlenmeyer flask containing 25 mL of a solution comprising of 1 m CrCl2 and 4 m HCl. For other experiments, a CuFeS2 concentrate pulp density of 39 g L−1 was added to a solution comprising 1 m CrCl2 and various HCl concentrations. Thirdly, for other experiments, a CuFeS2 concentrate pulp density of 39 g L−1 was added to a solution comprising of 1 m CrCl2, 4 m HCl, and various concentrations of FeCl2. It was imperative for the reaction to be conducted in a fume hood due to the rapid release of H2S gas, as shown in Figure 1. Liquid phase 100 μL samples were taken at time points of 0, 5, 10, 20, 40, and 60 min, which were subsequently diluted for the measurements of Fe2+ and Cu+ contents. After the reduction, the mineral particles were filtered from solution and allowed to air dry prior to characterization.
Atomic Absorption Spectroscopy (AAS)
An iCE 3300 AAS was used to measure the release of Fe2+ and Cu+ ions into solution from CuFeS2 during its reduction. The characteristic wavelengths for the iron and copper measurements were 248.3 nm and 324.8 nm, respectively. Standards ranging from 0–4 ppm were measured immediately before the samples to construct linear (R2>0.995) calibration curves.
X‐ray Diffraction (XRD)
A PANalytical XPert3 Powder XRD was used to measure the bulk mineral phase of the reaction products. The XRD was operated with filtered Empyrean Cu Ka radiation (k=0.15418 nm), a tube voltage of 45 kV, and a current of 40 mA. The mineral products were placed on a silicon crystal zero‐diffraction plate (MTI Corporation) and were adhered in place with Apiezon grease. The samples were scanned continuously in the range of 10–100° with a step size of 0.0065° on a spinning plate with a revolution time of 2.0 s. A PIXcel1D detector was used to record the peak intensity for the subsequent analysis of the mineral composition.
X‐ray Photoelectron Spectroscopy (XPS)
A PHI 5500 XPS equipped with an Al X‐ray source was used to measure the elemental composition of the reaction product surfaces. The base pressure of the chamber was approximately 1×10⁻⁸ torr. Samples were supported on carbon tape.
Scanning Electron Microscopy – Energy Dispersion X‐ray Spectroscopy (SEM‐EDS)
A Zeiss Sigma VP SEM was used to capture images of the mineral products after reaction. The SEM‐EDS analysis was operated at an accelerating potential of 6 kV and base pressure of approximately 1×10⁻⁵ torr. Samples were supported on carbon tape and were coated with gold using a Cressington 108 Auto Sputter Coater. The sputtering was conducted under argon gas flow with 0.1 mbar of pressure for 20 s. A Bruker XFlash Detector was used for EDS analysis to analyze elemental composition.
Subsequent Leaching of Mineral Products
A sample of the mineral products was digested in aqua regia for complete copper extraction, and an equivalent sample of the mineral products was leached in a solution comprising 0.5 m Fe2(SO4)3 in 1 m H2SO4. The percent of copper released was determined by the ratio of copper extracted by the two leachants.
Conflict of interest
The authors declare no conflict of interest.
1.
Acknowledgments
This material is based upon work supported by the National Science Foundation Graduate Research Fellowship under grant No. (DGE – 1644869). Any opinion, findings, and conclusions or recommendations expressed in this material are those of the authors and do not necessarily reflect the views of the National Science Foundation. This work was also supported by ARPA–E grant DE‐AR0001340 from the US Department of Energy. The authors gratefully acknowledge Freeport‐McMoRan for providing the chalcopyrite mineral concentrate.
Vardner J. T., Inaba Y., Jung H., Farinato R. S., Nagaraj D. R., Banta S., West A. C., ChemistryOpen 2023, 12, e202200196.
Data Availability Statement
Research data are not shared.
References
- 1. Kerr R. A., Science 2014, 343, 722–724. [DOI] [PubMed] [Google Scholar]
- 2. Schlesinger M. E., King M. J., Sole K. C., Davenport W. G., Extractive Metallurgy of Copper, 5 th edition, Elsevier, Oxford: 2011. [Google Scholar]
- 3. Gu G., Hu K., Zhang X., Xiong X., Yang H., Electrochim. Acta 2013, 103, 50–57. [Google Scholar]
- 4. Khoshkhoo M., Dopson M., Shchukarev A., Sandström Å., Hydrometallurgy 2014, 149, 220–227. [Google Scholar]
- 5. Liu H., Xia J., Nie Z., Hydrometallurgy 2015, 156, 40–46. [Google Scholar]
- 6. Yuehua H., Guanzhou Q., Jun W., Dianzuo W., Hydrometallurgy 2002, 64, 81–88. [Google Scholar]
- 7. Zhang L., Wu J., Wang Y., Wan L., Mao F., Zhang W., Chen X., Zhou H., Hydrometallurgy 2014, 146, 15–23. [Google Scholar]
- 8. Zhao H., Zhang Y., Zhang X., Qian L., Sun M., Yang Y., Zhang Y., Wang J., Kim H., Qiu G., Miner. Eng. 2019, 136, 140–154. [Google Scholar]
- 9. Zhou H.-B., Zeng W.-M., Yang Z.-F., Xie Y.-J., Qiu G.-Z., Bioresour. Technol. 2009, 100, 515–520. [DOI] [PubMed] [Google Scholar]
- 10. Zhu W., Xia J., Yang Y., Nie Z., Zheng L., Ma C., Zhang R., Peng A., Tang L., Qiu G., Bioresour. Technol. 2011, 102, 3877–3882. [DOI] [PubMed] [Google Scholar]
- 11. McDonald R. G., Muir D. M., Hydrometallurgy 2007, 86, 206–220. [Google Scholar]
- 12. McDonald R. G., Muir D. M., Hydrometallurgy 2007, 86, 191–205. [Google Scholar]
- 13. Nazari G., Dixon D. G., Dreisinger D. B., Hydrometallurgy 2011, 105, 251–258. [Google Scholar]
- 14. Nazari G., Dixon D. G., Dreisinger D. B., Hydrometallurgy 2012, 111–112, 35–45. [Google Scholar]
- 15. Nazari G., Dixon D. G., Dreisinger D. B., Hydrometallurgy 2012, 113–114, 122–130. [Google Scholar]
- 16. Nazari G., Dixon D. G., Dreisinger D. B., Hydrometallurgy 2012, 113–114, 177–184. [Google Scholar]
- 17. Ge X., Wang X., Seetharaman S., Electrochim. Acta 2009, 54, 4397–4402. [Google Scholar]
- 18. Granata G., Miura A., Liu W., Pagnanelli F., Tokoro C., Hydrometallurgy 2019, 186, 244–251. [Google Scholar]
- 19. Daehn K., Allanore A., Curr. Opin. Electrochem. 2020, 22, 110–119. [Google Scholar]
- 20. Biegler T., Constable D. C., J. Appl. Electrochem. 1977, 7, 175–179. [Google Scholar]
- 21. Biegler T., Swift D. A., J. Appl. Electrochem. 1976, 6, 229–235. [Google Scholar]
- 22. Fuentes-Aceituno J. C., Lapidus G. T., Doyle F. M., Hydrometallurgy 2008, 92, 26–33. [Google Scholar]
- 23. Martínez-Gómez V. J., Fuentes-Aceituno J. C., Pérez-Garibay R., Lee J., Hydrometallurgy 2016, 164, 54–63. [Google Scholar]
- 24. Martínez-Gómez V. J., Fuentes-Aceituno J. C., Pérez-Garibay R., Lee J., Hydrometallurgy 2018, 181, 195–205. [Google Scholar]
- 25. Donnelly C. A., Vardner J. T., Zhang Z., Banta S., West A. C., JOM 2020, 72, 3818–3825. [Google Scholar]
- 26. Dreisinger D., Abed N., Hydrometallurgy 2002, 66, 37–57. [Google Scholar]
- 27. Hiskey J. B., Wadsworth M. E., Metall. Mater. Trans. B 1975, 6, 183–190. [Google Scholar]
- 28. Doyle F., Lapidus G., ECS Trans. 2006, 2, 189. [Google Scholar]
- 29. Sohn H.-J., Wadsworth M. E., JOM 1980, 32, 18–22. [Google Scholar]
- 30. Zeng Y. K., Zhao T. S., An L., Zhou X. L., Wei L., J. Power Sources 2015, 300, 438–443. [Google Scholar]
- 31. Zeng Y. K., Zhou X. L., An L., Wei L., Zhao T. S., J. Power Sources 2016, 324, 738–744. [Google Scholar]
- 32. Wang S., Xu Z., Wu X., Zhao H., Zhao J., Liu J., Yan C., Fan X., Appl. Energy 2020, 271, 115252. [Google Scholar]
- 33. Sun C.-Y., Zhang H., Int. J. Energy Res. 2019, 43, 8739–8752. [Google Scholar]
- 34. Zeng Y. K., Zhou X. L., Zeng L., Yan X. H., Zhao T. S., J. Power Sources 2016, 327, 258–264. [Google Scholar]
- 35. Zeng Y. K., Zhao T. S., Zhou X. L., Zeng L., Wei L., Appl. Energy 2016, 182, 204–209. [Google Scholar]
- 36. Fritz J. J., J. Chem. Eng. Data 1982, 27, 188–193. [Google Scholar]
Associated Data
This section collects any data citations, data availability statements, or supplementary materials included in this article.
Data Availability Statement
Research data are not shared.


