Abstract
Epigenome‐wide gene–gene (G × G) interactions associated with non‐small‐cell lung cancer (NSCLC) survival may provide insights into molecular mechanisms and therapeutic targets. Hence, we proposed a three‐step analytic strategy to identify significant and robust G × G interactions that are relevant to NSCLC survival. In the first step, among 49 billion pairs of DNA methylation probes, we identified 175 775 G × G interactions with P Bonferroni ≤ 0.05 in the discovery phase of epigenomic analysis; among them, 15 534 were confirmed with P ≤ 0.05 in the validation phase. In the second step, we further performed a functional validation for these G × G interactions at the gene expression level by way of a two‐phase (discovery and validation) transcriptomic analysis, and confirmed 25 significant G × G interactions enriched in the 6p21.33 and 6p22.1 regions. In the third step, we identified two G × G interactions using the trans‐omics analysis, which had significant (P ≤ 0.05) epigenetic cis‐regulation of transcription and robust G × G interactions at both the epigenetic and transcriptional levels. These interactions were cg14391855 × cg23937960 (β interaction = 0.018, P = 1.87 × 10⁻¹²), which mapped to RELA × HLA‐G (β interaction = 0.218, P = 8.82 × 10⁻¹¹) and cg08872738 × cg27077312 (β interaction = −0.010, P = 1.16 × 10⁻¹¹), which mapped to TUBA1B × TOMM40 (β interaction =−0.250, P = 3.83 × 10⁻¹⁰). A trans‐omics mediation analysis revealed that 20.3% of epigenetic effects on NSCLC survival were significantly (P = 0.034) mediated through transcriptional expression. These statistically significant trans‐omics G × G interactions can also discriminate patients with high risk of mortality. In summary, we identified two G × G interactions at both the epigenetic and transcriptional levels, and our findings may provide potential clues for precision treatment of NSCLC.
Keywords: G × G interactions, NSCLC, overall survival, prognosis, trans‐omics
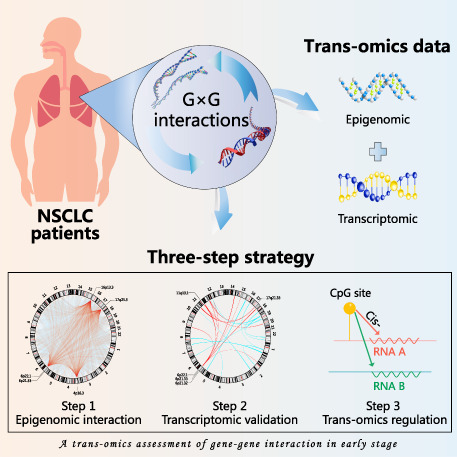
A three‐step, trans‐omics study identified two gene–gene interactions, cg14391855 × cg23937960 (mapped to RELA × HLA‐G) as well as cg08872738 × cg27077312 (mapped to TUBA1B × TOMM40), which were significantly and robustly associated with NSCLC survival at both the epigenetic and transcriptional levels. Our findings have implications of precision treatment by providing therapeutic targets for early‐stage NSCLC patients.
Abbreviations
- G × G interaction
gene–gene interaction
- GEO
Gene Expression Omnibus
- GO
Gene Ontology
- KEGG
Kyoto Encyclopedia of Genes and Genomes
- LCSERG
Lung Cancer Survival Epigenome Research Group
- LUAD
lung adenocarcinoma
- LUSC
lung squamous cell carcinoma
- MHC
major histocompatibility complex
- NF‐κB
nuclear factor‐κB
- NSCLC
non‐small‐cell lung cancer
- QC
quality control
- ROS
reactive oxygen species.
- SD
standard deviation
- TCGA
The Cancer Genome Atlas
1. Introduction
Lung cancer is widely prevalent and is the most lethal disease among all malignant cancers; in year 2020 alone, more than 2.2 million patients were diagnosed with lung cancer and nearly 1.8 million patients succumbed to the disease [1]. About 85% of lung cancer cases are non‐small‐cell lung cancer (NSCLC). Compared to those diagnosed with advanced‐stage NSCLC, early‐stage patients tend to have a more favourable prognosis. However, wide clinical variation is observed among early‐stage NSCLC patients, even among those with similar clinical characteristics [2], indicating possible heterogenous molecular characteristics of the disease [3].
DNA methylation, a heritable, reversible, and epigenetic modification involving the DNA spatial conformation [4], plays an essential role in prognosis and therapeutic target of cancers [5], including NSCLC [6]. Moreover, gene–gene (G × G) interactions may provide pivotal clues regarding the biologic mechanisms of complex diseases [7] and enhance the accuracy of prediction models [8, 9]. G × G interactions, as an essential element of personalized medicine, reflect that the effects of one gene on the disease outcome may vary across patients with different characteristics on another gene. Our previous studies have identified several epigenetic G × G interactions [10, 11] and gene–environment (G × E) interactions [12, 13, 14] relevant to NSCLC survival. However, these studies only focused on target genes that were identified in the literature. Subsequently, we performed the first genome‐wide G × G interaction study of lung cancer risk among the Asian and European populations, respectively [15, 16], and identified several novel biomarkers associated with lung cancer risk. We further conjectured that a comprehensive epigenomic G × G interaction study of NSCLC survival could identify novel interactions, providing insights into molecular mechanism and guiding precision treatment of NSCLC. However, virtually no studies have related epigenome‐wide G × G interactions to NSCLC survival, owing to enormous computational challenges and lack of reproducibility.
In this study, we integrated epigenomic and transcriptomic data of multiple cohorts and utilized a three‐step analytic strategy to identify robust G × G interactions. First, we performed an epigenome‐wide G × G interaction study of lung cancer survival using samples from Lung Cancer Survival Epigenome Research Group (LCSERG) and further validated the selected signals using The Cancer Genome Atlas (TCGA). Second, we functionally evaluated the significant epigenetic G × G interactions and validated them at the gene expression level using transcriptomic data. Third, focusing on these G × G interactions having epigenetic cis‐regulation of transcription, we conducted a trans‐omics mediation analysis.
2. Materials and methods
2.1. Study populations of DNA methylation data
We harmonized the DNA methylation data for early‐stage (stages I and II) NSCLC patients from LCSERG and TCGA. LCSERG is an international collaborative team composed of four study sites, including USA‐Harvard, Spain, Norway, and Sweden [9]. All patients provided written informed consent. The study methodologies conformed to the standards set by the Declaration of Helsinki and was approved by the local ethics committee.
2.1.1. USA‐Harvard
The USA‐Harvard site consisted of patients recruited at Massachusetts General Hospital (MGH) since 1992 [17]. All were newly diagnosed and histologically confirmed as primary NSCLC at the time of recruitment. Snap‐frozen tumour samples were taken from patients during complete resection. A series of 151 early‐stage patients selected in this study had complete survival information. Tumour DNA was extracted from 5‐μm‐thick histopathological sections. Each specimen was evaluated by an MGH pathologist for the amount (tumour cellularity > 70%) and quality of tumour cells. All specimens were histologically classified using the Word Health Organization (WHO) criteria. The study was approved by the Institutional Review Boards of the Massachusetts General Hospital (Partners Human Research Committee, Protocol #1999P004935/MGH).
2.1.2. Spain
The Spanish centre is a collaborative study centre, consisted of multiple research institutions from Spain (Catalan Institute of Oncology; Center for Applied Medical Research; and Bellvitge Biomedical Research Institute), Italy (IRCCS Foundation National Cancer Institute; and University of Turin), UK (University of Liverpool Cancer Research Centre), France (CHU Albert Michallon), and the USA (University of Michigan Medical School). Tumours were collected by surgical resection from 226 patients between 1991 and 2009 [18]. DNA extraction was performed on tumour specimens (10 μm‐thick, tumour cellularity > 50%). The study was approved by the Bellvitge Biomedical Research Institute Institutional Review Board (PR055/10).
2.1.3. Norway
Participants were 133 lung adenocarcinoma (LUAD) patients with operable lung cancer tumours seen at the Oslo University Hospital between 2006 and 2011 [19]. Tumour tissues were collected during surgery, snap‐frozen in liquid nitrogen, and stored at −80 °C until DNA isolation. The project was approved by the Oslo University Institutional Review Board and the Regional Ethics Committee (S‐05307).
2.1.4. Sweden
Tumour tissue samples were collected from 103 patients with early‐stage NSCLC who underwent operation, including 80 patients with LUAD and 23 patients with lung squamous cell carcinoma (LUSC) at the Skane University Hospital [20]. The study was approved by the Regional Ethical Review Board in Lund, Sweden (Registration nos. 2004/762 and 2008/702).
2.1.5. TCGA
A total of 332 LUAD and 285 LUSC with full DNA methylation, survival time, and covariates data were included. Level 1 HumanMethylation450 DNA methylation data from patients with early‐stage NSCLC were downloaded from Genomic Data Commons Data Portal (GDC) resources.
2.2. Quality control for DNA methylation data
DNA methylation was assessed with Illumina Infinium HumanMethylation450 BeadChips (Illumina Inc., San Diego, CA, USA). Raw image data were imported into GenomeStudio Methylation Module V1.8 (Illumina Inc.) to calculate methylation signals and to perform normalization, background subtraction, and quality control (QC). Unqualified probes were excluded if meeting any of these exclusion criteria: (a) failed detection (P > 0.05) in 5% samples; (b) coefficient of variance < 5%; (c) methylated values of CpG probes were all 0 (unmethylated) or 1 (methylated) across all samples; (d) common single‐nucleotide polymorphisms located in probe sequence or in 10‐bp flanking regions; (e) cross‐reactive probes [21]; and (f) data did not pass QC in all centres. Methylation signals were further processed for quantile normalization as well as types I and II probe correction. Batch effects were adjusted according to the best pipeline and by a comparative study [22]. Details of the QC process are described in Fig. S1.
2.3. Study populations and quality control of gene expression data
Gene expression data for early‐stage NSCLC were derived from the Gene Expression Omnibus (GEO) and TCGA, and early‐stage NSCLC patients profiled by Affymetrix Human Genome U133 Plus 2.0 Array were retrieved from GEO (GSE10245, GSE29013, GSE31210, and GSE50081) (Table S1). Included in the discovery phase of transcriptomic analysis were 484 patients with available overall survival time, clinical stage, and other clinical covariates. Meanwhile, 613 early‐stage NSCLC patients were downloaded from GDC resources for validation of transcriptional G × G interactions. The TCGA workgroup completed the mRNA sequencing data processing and QC. Level 3 gene quantification data were downloaded from the TCGA data portal and were further checked for quality. Gene probes were excluded if the missing rate > 80%, and batch effects were corrected with ComBat. The expression value of each gene was transformed on a log2 scale and standardized.
2.4. Study design and statistical analysis
Figure 1 depicts the workflow of the proposed three‐step analytic strategy. These three steps are detailed below.
Fig. 1.
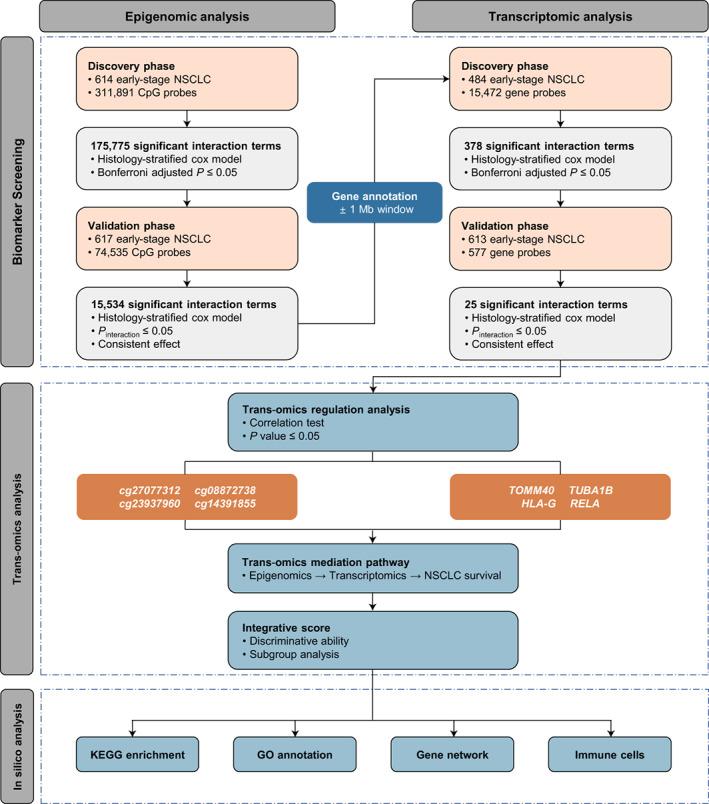
Flow chart of three‐step study design. In the epigenomic analysis step, we performed a two‐phase strategy to screen and validate epigenome‐wide G × G interactions. In the transcriptomic analysis step, we firstly conducted a gene annotation and again performed a two‐phase study to evaluate and validate those interactions at transcriptional level. In the trans‐omics analysis step, we explored the trans‐omics regulatory relationships and evaluated indirect effect of epigenetic G × G interactions on NSCLC survival mediated through transcriptional G × G interactions, and followed by a series of in silico analyses for potential biological functions.
2.4.1. A two‐phase epigenome‐wide G × G interaction study
We conducted a two‐phase epigenomic study to screen G × G interactions out of a massive number of pairs. In the discovery phase, using the LCSERG dataset, we applied Cox proportional hazards models, adjusted by covariates (age, sex, smoking status, clinical stage, and study centre) and stratified by histology (see the Model below), to all G × G interactions one at a time, and identified significant G × G interactions among 49 billion pairs of DNA methylation probes. Significance was set to be at the level of 1.03 × 10−12 = 0.05/(311 891 × 311 890/2) by adjusting for multiple tests with the Bonferroni method. In the validation phase, we further confirmed the selected interactions using the TCGA cohort; only those with P ≤ 0.05 and with the same effect directions as in the discovery phase would be selected as the candidate G × G interactions and passed onto the next steps.
2.4.2. A two‐phase functional validation of G × G interactions in transcriptomic data
We evaluated the candidate G × G interactions at the transcriptional level, by annotating genes in the amplified regions within a 1 Mb window upstream and downstream for each gene. We applied a two‐phase strategy, similar to that outlined in Section 2.4.1, to screen and validate significant G × G interactions at the transcriptional level. Selected as the final candidate G × G interactions would be those with a P Bonferroni ≤ 0.05 in the discovery phase based on the GEO dataset, with P ≤ 0.05 in the validation phase based on the TCGA dataset, and with the same effect directions in these two datasets.
2.4.3. Trans‐omics regulation and mediation analysis
For G × G interactions with significant effects at both the epigenetic and transcriptional levels, we evaluated the trans‐omics regulation between the DNA methylations and gene expressions via the Spearman correlation. The DNA methylation probes located within 1 Mb distances upstream or downstream of its gene, and meanwhile significantly correlated with gene expression were defined as these having significant epigenetic cis‐regulation of transcription. Then, G × G interactions with significant epigenetic cis‐regulation of transcription were identified to be robust interactions. Moreover, we performed a trans‐omics mediation analysis to evaluate whether the prognostic effect of epigenetic G × G interactions on NSCLC survival was mediated through affecting the corresponding transcriptional G × G interactions, implementing by VanderWeele's method [23].
2.4.4. Statistical analysis
Continuous variables were summarized as mean ± standard deviation (SD), and categorized variables were described by frequency (n) and proportion (%). Kaplan–Meier survival curves illustrated the survival differences across different risk groups. The histology‐stratified Cox proportional hazards models, adjusted for age, sex, smoking status, clinical stage, and study centre, were used to model the adjusted effect of each interaction. The epigenetic score and transcriptional score were defined as a linear combination of G × G interactions of two omics, respectively, with coefficients as weights derived from the multivariable Cox proportional hazards models. We applied Gene Ontology (GO) annotation and Kyoto Encyclopedia of Genes and Genomes (KEGG) pathway enrichment analyses to evaluate potential biological functions of screened biomarkers, and used gene network analysis to explore the relationship between screened genes and immune checkpoints by implementing GeneMANIA [24]. Proportions of immune cells were inferred by using CIBERSORT [25].
Statistical analyses were performed using r version 3.6.3 (The R Foundation of Statistical Computing, Vienna, Austria).
3. Results
3.1. Sample characteristics of the study population
After QC, included in this study were 1230 early‐stage NSCLC patients with DNA methylation data and 1097 patients with gene expression data. The demographic and clinical information of these patients are detailed in Table 1 and Table S2.
Table 1.
Demographic and clinical descriptions for early‐stage NSCLC patients with DNA methylation data in five international study centres. LUAD, lung adenocarcinoma; LUSC, lung squamous cell carcinoma.
| Variables | Discovery phase | Validation phase | Combined dataset | ||||
|---|---|---|---|---|---|---|---|
| USA‐Harvard (N = 151) | Spain a (N = 226) | Norway (N = 133) | Sweden (N = 103) | All (N = 613) | USA‐TCGA (N = 617) | Overall (N = 1230) | |
| Age (years) | 67.67 ± 9.92 | 65.67 ± 10.58 | 65.52 ± 9.34 | 67.54 ± 9.99 | 66.44 ± 10.08 | 66.51 ± 9.47 | 66.48 ± 9.78 |
| Sex | |||||||
| Female | 67 (44.37) | 105 (46.46) | 71 (53.38) | 54 (52.43) | 297 (48.45) | 255 (41.33) | 552 (44.88) |
| Male | 84 (55.63) | 121 (53.54) | 62 (46.62) | 49 (47.57) | 316 (51.55) | 362 (58.67) | 678 (55.12) |
| Smoking status | |||||||
| Never | 18 (11.92) | 30 (13.57) | 17 (12.78) | 18 (17.47) | 83 (13.65) | 55 (9.18) | 138 (11.43) |
| Former | 81 (53.64) | 120 (54.30) | 74 (55.64) | 54 (52.43) | 329 (54.11) | 376 (62.77) | 705 (58.41) |
| Current | 52 (34.44) | 71 (32.13) | 42 (31.58) | 31 (30.10) | 196 (32.24) | 168 (28.05) | 364 (30.16) |
| Unknown | 0 | 5 | 0 | 0 | 5 | 18 | 23 |
| Clinical stage | |||||||
| I | 104 (68.87) | 183 (80.97) | 93 (69.92) | 95 (92.23) | 475 (77.49) | 393 (63.70) | 868 (70.57) |
| II | 47 (31.13) | 43 (19.03) | 40 (30.08) | 8 (7.77) | 138 (22.51) | 224 (36.30) | 362 (29.43) |
| Histology | |||||||
| LUAD | 96 (63.58) | 183 (80.97) | 133 (100.00) | 80 (77.67) | 492 (80.26) | 332 (53.81) | 824 (66.99) |
| LUSC | 55 (36.42) | 43 (19.03) | 0 (0.00) | 23 (22.33) | 121 (19.74) | 285 (46.19) | 406 (33.01) |
| Chemotherapy | |||||||
| No | 142 (94.04) | 177 (90.77) | 102 (76.69) | 67 (90.54) | 488 (88.25) | 1974 (76.98) | 682 (84.72) |
| Yes | 9 (5.96) | 18 (9.23) | 31 (23.31) | 7 (9.46) | 64 (11.75) | 58 (23.02) | 123 (15.28) |
| Unknown | 0 | 31 | 0 | 29 | 60 | 365 | 425 |
| Radiotherapy | |||||||
| No | 132 (87.42) | 184 (94.36) | 132 (99.25) | 74 (100.00) | 522 (94.39) | 239 (94.84) | 761 (94.53) |
| Yes | 19 (12.58) | 11 (5.64) | 1 (0.75) | 0 (0.00) | 31 (5.61) | 13 (5.16) | 44 (5.47) |
| Unknown | 0 | 31 | 0 | 29 | 60 | 365 | 425 |
| Adjuvant therapy b | |||||||
| No | 127 (84.11) | 168 (86.15) | 101 (75.94) | 67 (90.54) | 463 (83.73) | 187 (74.21) | 650 (80.75) |
| Yes | 24 (15.89) | 27 (13.85) | 32 (24.06) | 7 (9.46) | 90 (16.27) | 65 (25.79) | 155 (19.25) |
| Unknown | 0 | 31 | 0 | 29 | 60 | 365 | 425 |
| Survival year | |||||||
| Median survival | 6.66 (5.41, 7.87) | 7.12 (5.06, 9.63) | 7.36 (6.77, 7.95) c | 7.39 (4.98, 9.12) | 7.39 (6.50, 8.23) | 4.54 (3.68, 5.41) | 6.60 (5.84, 7.35) |
| Died (%) | 122 (80.79) | 101 (44.69) | 42 (31.58) | 58 (56.31) | 323 (52.69) | 142 (23.01) | 465 (37.80) |
The Spanish centre is a collaborative study centre with samples recruited from Spain, Italy, UK, France, and the USA.
Including chemotherapy or radiotherapy.
The restricted mean survival time was given since the median is not available.
3.2. Two robust G × G interactions identified in epigenome‐wide G × G interaction study and trans‐omics validation in transcriptome
Using the LCSERG cohort in the discovery phase of the epigenomic analysis, we identified a total of 175 775 epigenetic G × G interactions (P Bonferroni ≤ 0.05) significantly associated with NSCLC survival. Among them, 15 534 interactions remained significant (P ≤ 0.05) in the validation phase based on the TCGA cohort (Table S3). These interactions were enriched in the 16p13.3, 4p16.3, 6p21.33, 17q25.3, and 6p22.1 regions (Fig. 2A), and further gene annotation for them resulted in 6 850 451 epigenetic cis‐regulatory gene pairs. By way of transcriptomic analysis, a total of 378 transcriptional G × G interactions were found to be significantly associated with NSCLC survival in the discovery phase; of them, 25 interactions were successfully validated in the validation phase (Table S4), and the 6p21.32, 6p21.33, 6p22.1, 11q13.1, and 17q21.33 regions were identified to be the enriched functional regions (Fig. 2B).
Fig. 2.
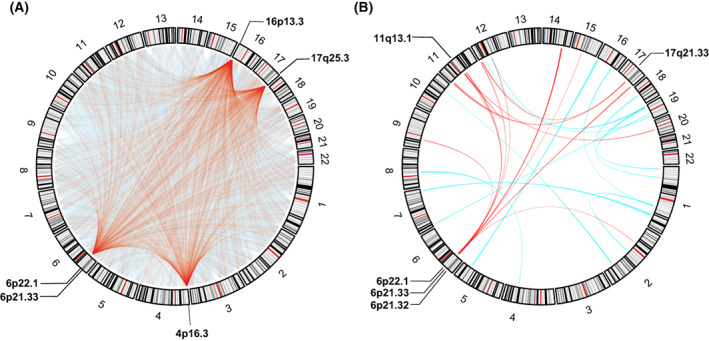
The circos plot for visualization of G × G interactions. Results of G × G interactions were given at epigenetic level (A) and transcriptional level (B), respectively. The chords represent interactions exists between two linked chromosome segments, and the chords of the top five enriched regions are highlighted in red.
Among the interactions deemed significant at both the epigenetic and transcriptional levels, we evaluated the trans‐omics cis‐regulatory relationship between DNA methylations and their mapped gene expressions, and found that two G × G interactions had significant trans‐omics regulations (r cg14391855‐RELA = −0.11, P = 6.80× 10⁻³, r cg23937960‐HLA‐G = −0.08, P = 3.86 × 10⁻²; and r cg08872738‐TUBA1B = 0.12, P = 4.10 × 10⁻³, r cg27077312‐TOMM40 = 0.15, P = 1.87 × 10⁻⁴) (Table S5). Moreover, these G × G interactions remained significant in the subgroup defined by histology, except for a subgroup that have only 73 LUSC samples with gene expression, which might be due to a very limited sample size. Nevertheless, heterogeneity test suggested no significant heterogenous effect was observed between LUAD and LUSC (Fig. S2). Therefore, cg14391855 × cg23937960 (mapped to RELA × HLA‐G) as well as cg08872738 × cg27077312 (mapped to TUBA1B × TOMM40) were viewed as the robust interactions, which were passed onto subsequent analyses.
3.3. Interaction patterns and effect modifications of two G × G interactions on NSCLC survival
Significant synergistic interactions were observed between cg14391855 and cg23937960 (β interaction = 0.018, 95% CI: 0.013–0.023, P = 1.87 × 10⁻¹²) (Fig. 3A), which were mapped to RELA × HLA‐G (β interaction = 0.218, 95% CI: 0.152–0.283, P = 8.82 × 10⁻¹¹) (Fig. 3B). In contrast, as the methylation level of cg27077312 increased, the effect of cg08872738 decreased (β interaction = −0.010, 95% CI: −0.013 to −0.007, P = 1.16 × 10⁻¹¹) (Fig. 3C). Moreover, the antagonistic interaction between their mapped genes, TOMM40 × TUBA1B, was identified (β interaction = −0.250, 95% CI: −0.329 to −0.172, P = 3.83 × 10⁻¹⁰) (Fig. 3D).
Fig. 3.
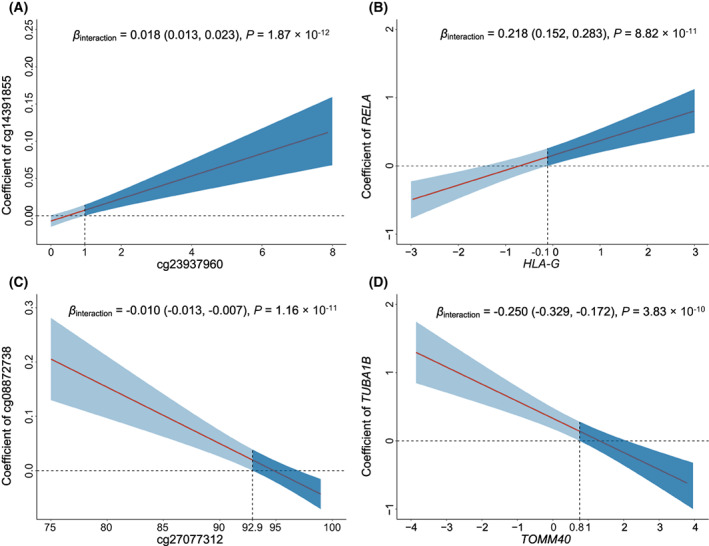
Interaction patterns of the screened G × G interactions. Interactions of cg14391855 × cg23937960 (A), which mapped to RELA × HLA‐G (B); as well as cg08872738 × cg27077312 (C), which mapped to TUBA1B × TOMM40 (D) were displayed as the effects of one gene (y axis) varied by the different level of another gene (x axis). Coefficients, 95% CIs, and P values were derived from histology‐stratified Cox proportional hazards models adjusted for age, sex, smoking status, clinical stage, and study centre. The shaded area represents 95% confidence interval. The horizontal dashed line indicates the zero correlation. The vertical dashed line represents the intersection of the lower bound of the 95% CI and the zero correlation.
To explore the effect modifications, we evaluated the effects of cg14391855 among patients with low and high levels of cg23937960. We observed a harmful effect of cg14391855 in patients with high methylation level of cg23937960 (β H vs L = 0.519, 95% CI: 0.148–0.884, P = 5.50 × 10⁻³), but did not note any significant effects of cg14391855 among those with low methylation level of cg23937960 (β H vs L = −0.261, 95% CI: −0.562 to 0.039, P = 0.087), indicating a significant heterogeneity of the effects of cg14391855 (I 2 = 91.47%, P = 7.17 × 10⁻³); see Fig. 4A. We also observed heterogenous effects of RELA across patients with low and high expression levels of HLA‐G (I 2 = 78.36%, P = 3.16 × 10⁻²). Specifically, high RELA expression was associated with high mortality among patients with high HLA‐G gene expression (β H vs L = 0.928, 95% CI: 0.464–1.391, P = 8.99 × 10⁻⁵), but not so among those with low HLA‐G gene expression (β H vs L = 0.148, 95% CI: −0.462 to 0.761, P = 0.64) (Fig. 4B). Additionally, heterogeneity tests suggested significantly differential effects of cg08872738 across patients with different levels of cg27077312 (β H vs L = 0.693, 95% CI: 0.239–1.151, P = 2.72 × 10⁻³ for low cg27077312 patients; β H vs L = −0.062, 95% CI: −0.400 to 0.285, P = 0.73 for high cg27077312 patients; and I 2 = 83.98%, P = 1.25 × 10⁻²), and significantly differential effects of TUBA1B across patients with low and high TOMM40 expression levels (β H vs L = 0.829, 95% CI: 0.351–1.308, P = 6.68 × 10⁻⁴ for low TOMM40 patients; β H vs L = 0.020, 95% CI: −0.329 to 0.365, P = 0.92 for high TOMM40 patients; and I 2 = 86.15%, P = 7.29 × 10⁻³).
Fig. 4.
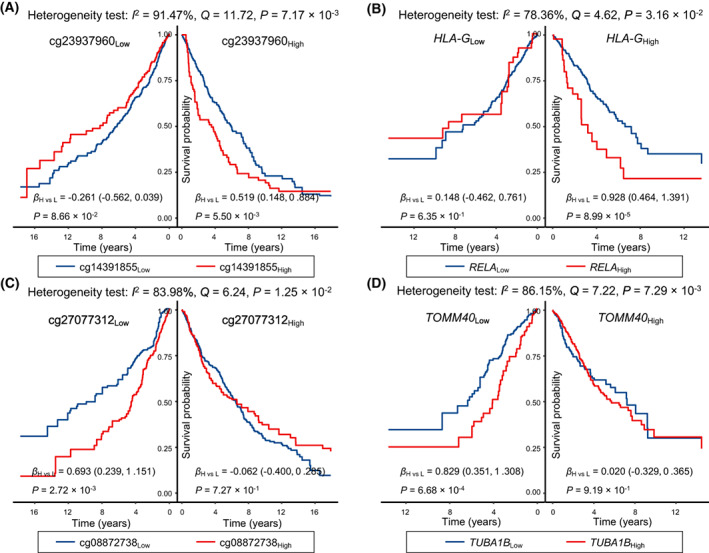
Kaplan–Meier survival curves for effect modifications. Survival differences of cg14391855 stratified by cg23937960 (N Low = 615, N High = 616) (A), RELA stratified by HLA‐G (N Low = 548, N High = 549) (B), cg08872738 stratified by cg27077312 (N Low = 615, N High = 616) (C), and TUBA1B stratified by TOMM40 (N Low = 548, N High = 549) (D), respectively. The coefficients, 95% CIs, and P values for each strata were derived from histology‐stratified Cox proportional hazards models adjusted for age, sex, smoking status, clinical stage and study centre. Heterogeneity tests were used to evaluate effect modifications.
3.4. Trans‐omics analysis of two G × G interactions
A significant trans‐omics regulation was observed between the epigenetic score and transcriptional score (β = 0.16, 95% CI: 0.04–0.27, P = 0.009). Further, mediation analysis for the trans‐omics pathway revealed that 20.3% of the effect of the epigenetic score on NSCLC survival were mediated via the transcriptional score (HRindirect = 1.15, 95% CI: 1.01–1.31, P = 0.034) (Fig. 5).
Fig. 5.
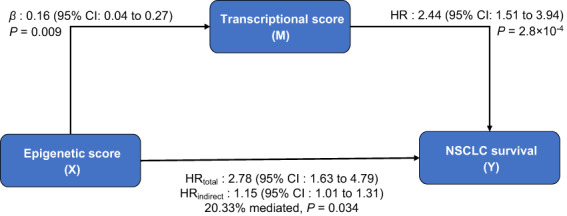
Mediation analysis for trans‐omics regulatory pathway. VanderWeele causal mediation analysis was conducted to evaluate the indirect effect, 95% CI, and P value of epigenetic G × G interactions on overall survival of NSCLC patients via transcriptional G × G interactions.
We constructed an integrative score by linearly combining the epigenetic and transcriptional scores, with coefficients as weights derived from a multivariable Cox regression model, and found it robustly associated with NSCLC survival in patient subgroups defined by various covariates (Fig. 6A). To demonstrate the discriminative ability of this integrative score, we categorized patients into three subgroups based on the tertiles of the score and detected a dose–response association; higher‐percentile groups were associated with higher mortality (HRM vs L = 2.18, 95% CI: 1.29–3.66, P = 3.36 × 10⁻³; HRH vs L = 3.28, 95% CI: 1.99–5.42, P = 3.03 × 10⁻⁶) (Fig. 6B,C). Moreover, we noted that the discriminative ability of integrative score outperforms the clinical factors (Fig. S3).
Fig. 6.
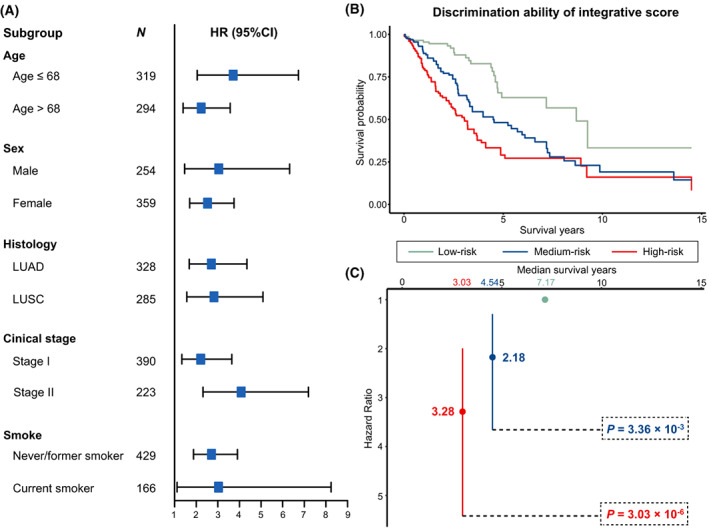
Subgroup analysis and discrimination ability of integrative score. (A) Forest plot for subgroup analysis of integrative score stratified by age, sex, histology, clinical stage, and smoke. (B) Discriminative ability of the integrative score, low‐ (N = 204), medium‐ (N = 205), and high‐risk group (N = 204) were defined by tertiles of integrative score. (C) The hazard ratios (HRs) for patients at medium‐ and high‐risk groups when comparing with patients at low risk. Significances were derived from histology‐stratified Cox proportional hazards models adjusted for age, sex, smoking status, clinical stage, and study centre.
3.5. In silico analyses for potential biological functions
To explore the potential biological functions, we scanned the transcriptome‐wide gene expression probes to find those correlated with the genes included in the integrative score. As a result, we identified a total of 4588 co‐expressed genes, which were significantly enriched in 16 KEGG pathways, suggesting functions in cancer prognosis (Fig. 7A). Additionally, GO annotation analysis identified 491 biological process pathways, 78 molecular function pathways, and 141 cellular component pathways, which comprised the main activity of the major histocompatibility complex (MHC) (Fig. 7B–D). The gene network revealed the potential functional connections between the four genes with interactions and immune checkpoint genes (Fig. 7E). Therefore, we further inferred the proportions of immune cells using CIBERSORT and observed significant and positive correlations between the integrative score and five immune cells (e.g., with macrophages M0, r = 0.23, P = 8.42 × 10⁻⁹), as well as significant and negative correlations with 6 immune cells (e.g., with mast cells resting, r = −0.22, P = 6.29 × 10⁻⁸) (Fig. 7F). Additionally, numerous drugs targeting these interactions are documented in the DrugBank database (Table S6).
Fig. 7.
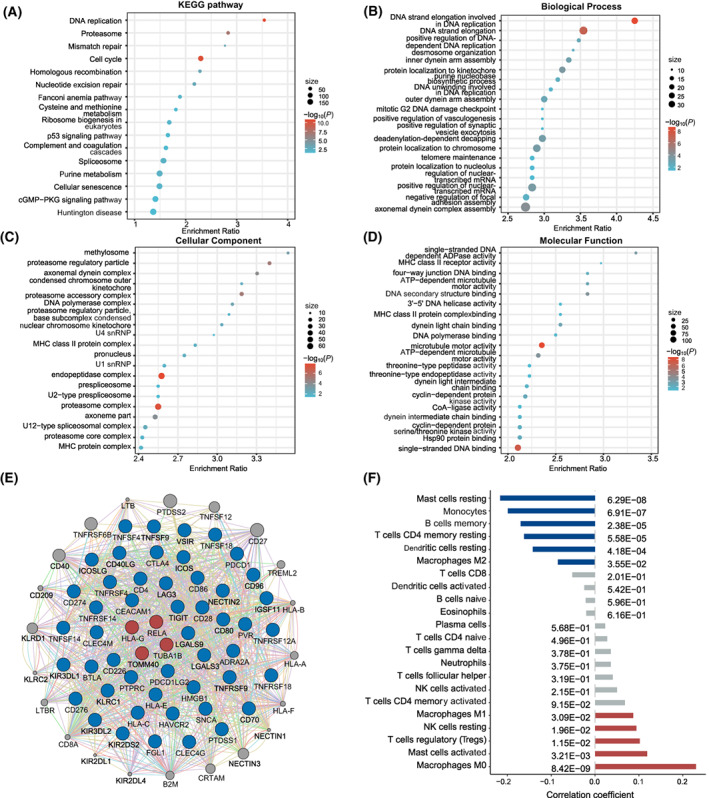
In silico analyses for potential biological functions of screened interactions. The functional enrichment analyses for co‐expressed genes of integrative score. (A) 16 significant KEGG pathways. (B) Top 20 significant biological process pathways. (C) Top 20 significant cellular component pathways. (D) Top 20 significant molecular function pathways. (E) Gene network of screened genes and immune checkpoint genes, which constructed by GeneMINIA. The blue circles represents the first neighbours of the screened genes, which suggests direct functional connections. (F) Correlations between proportions of immune cells and integrative score.
4. Discussion
Wide heterogeneity exists in the outcome of NSCLC patients, especially among the early‐stage NSCLC patients, and highlights the importance of personalized treatment [26], which refers to select specific treatment for patients based on their specific molecular biomarkers, to maximize the benefit from the treatments [27]. Gene–gene (G × G) interactions, in particular, at the epigenome level, play important roles in cancer progression and is an essential component of personalized treatment [26]. However, computational intensiveness and lack of reproducibility in G × G interaction analyses, in particular on the whole epigenome‐wide scale, impede their wide applications and hinder our ability to identify novel biomarkers at both the epigenome and transcriptome level. Our study addressed the serious challenges by using high performance computing clusters and proposing a 3‐step analytical strategy to identify epigenome‐wide G × G interactions, followed by a trans‐omics validation in transcriptome, and in silico analyses for exploring the biological functions, which might be a general schema that could be applied to other cancers.
To our knowledge, our work was the first attempt to identify epigenome‐wide G × G interactions and perform functional validation in transcriptome. Our study identified 16p13.3, 4p16.3, 6p21.33, 17q25.3, and 6p22.1 as the top five functional regions with largest number of epigenetic interactions. Among them, 6p21.33 and 6p22.1 were validated as functional enrichment regions in the transcriptomic interaction analysis. These two are well known regions, which house major histocompatibility complex (MHC) genes, including HLA‐B, HLA‐C, etc. in 6p21.33 and HLA‐A, HLA‐E, HLA‐F, HLA‐G, etc. in 6p22.1, respectively [28]. MHC molecules play essential roles in the immune system, antigen presentation [29]. Much evidence has linked MHC to the development, progression and prognosis of tumours [30], including NSCLC [31].
RELA, an encoder of the essential subunit of nuclear factor‐κB (NF‐κB), is involved in inflammation, immunity, tumourigenesis, and apoptosis, all of which are related to the progress and prognosis of tumour [32, 33]. NF‐κB can promote tumour survival via modifying apoptosis, cause inflammatory microenvironment by interacting with interleukins, and affect NSCLC survival [34]. Meanwhile, HLA‐G, a member of the MHC class I, is a well‐established immune checkpoint that plays an important regulatory role in tumour immune response [35, 36]. HLA‐G can inhibit the functions of NK and T cells, suppress the immune response, help tumour cells escape immune surveillance, and lead to poor prognosis of NSCLC patients [37]. Notably, the immune escape would further deteriorate inflammatory response [38], and increase the mortality risk from NF‐κB, leading to a synergistic effect [39]. Moreover, the protein product of TUBA1B is the main component of microtubules, which is involved in cell movement and intracellular trafficking, and affects cancer prognosis [40, 41]. Microtubules are involved in the mitochondrial motility under the hypoxic tumour microenvironment, promoting the perinuclear aggregation of mitochondria and production of reactive oxygen species (ROS) [42], and leading to cell damage, inflammation storm, and poor prognosis [43]. Additionally, TOMM40, which encodes a channel‐forming subunit of the translocase of the mitochondrial outer membrane, is an essential mediator of mitochondrial functions [44], and highly expressed TOMM40 inhibits the generation of ROS [45, 46], causing an antagonistic interaction.
Another major contribution of our work is the proposed three‐step, multicohort analytic strategy with rigorous validation using independent cohorts and trans‐omics data. The alterations of DNA methylation regulate gene expression, thereby affecting the development, progress, and prognosis of diseases [47]. We integrated trans‐omics data for selecting G × G that were significant at both the epigenetic and transcriptional levels. Additionally, we developed an integrative score based on these interactions, which enabled us to identify patients with high mortality risk. Furthermore, the score was found associated with proportions of immune cell types, including mast cells, monocytes, B cells, T cells CD4, dendritic cells, NK cells and macrophages. The gene network analysis also indicated potential functional connections between the identified G × G interactions and the known immune checkpoint genes. The results, which may hint at the drug targets, have values in clinical immunotherapy and provide hypotheses for clinical trials.
Our study has several strengths. First, we addressed the computational burden and provided a computationally feasible landscape of analysing epigenetic interactions on NSCLC survival. Second, we used a strict strategy to control the false positives, which required G × G interactions to have a Bonferroni‐adjusted P value ≤ 0.05 in the discovery phase, retain significance (P ≤ 0.05) in the validation phase, and have the same effect directions in the two phases. Third, for reproducibility, we explored trans‐omics validation and regulatory relationships, which enhanced robustness. Finally, for clinical usage, we constructed an integrative score which can identify patients with high mortality risk, and the in silico analyses indicated the potential roles of the score in the immune response.
We acknowledge limitations. First, the majority of study subjects were Caucasian, which may limit the generalization of our results to the other ethnicity populations. Second, we only focused on cis‐regulatory genes within 1 Mb windows of CpGs in the trans‐omics validation stage, because cis‐regulations were considered to be causally and biologically interpretable [48, 49]. However, trans‐regulatory genes may also play important roles in the causal paths. Third, we used histology‐stratified Cox proportional hazards models to identify G × G interactions, which guaranteed the statistical power and also accounted for the heterogeneity between LUAD and LUSC. However, such pooled analysis may lose some histology‐specific signals. Finally, though our results were validated using various trans‐omics data, more biological experiments are warranted.
5. Conclusion
We identified two G × G interactions, cg14391855 ×cg23937960 (mapped to RELA × HLA‐G) as well as cg08872738 × cg27077312 (mapped to TUBA1B ×TOMM40), which were significantly and robustly associated with NSCLC survival at both the epigenetic and transcriptional levels. Our findings have implications of precision treatment by providing therapeutic targets for early‐stage NSCLC patients.
Conflict of interest
The authors declare no conflict of interest.
Author contributions
JC, YS, HS, DCC, RZ and FC contributed to the study design; SS, LS, MMB, AK, MP, JS, ÅH, ME, RZ and DCC involved in the data collection and quality control; JC, YS, YL, YW, SS, YZ, DY, DCC, RZ and FC involved in the analyses and interpretation; JC and YS involved in drafting the manuscript; YL, HS, DCC, RZ and FC revised the manuscript; all authors read and approved the final manuscript.
Peer Review
The peer review history for this article is available at https://publons.com/publon/10.1002/1878‐0261.13345.
Supporting information
Fig. S1. Quality control procedures for epigenome‐wide DNA methylation chip data from the USA (Harvard), Spain, Norway, and Sweden centres, as well as TCGA.
Fig. S2. Subgroup analysis of the identified G × G interactions in LUAD and LUSC.
Fig. S3. ROC plot for discrimination ability of integrative score and clinical covariates.
Table S1. Gene expression data downloaded from the GEO database.
Table S2. Demographic and clinical descriptions for early‐stage NSCLC patients with gene expression information from GEO and TCGA.
Table S3. Association results of 15,534 pairs of G × G interactions in the epigenomic analysis.
Table S4. Association results of 25 pairs of G × G interactions in the transcriptomic analysis.
Table S5. Correlation between DNA methylation probes and corresponding gene expressions.
Table S6. Potential targeted drug for screened G × G interactions derived from DrugBank database.
Acknowledgements
This study was supported by the National Natural Science Foundation of China (82220108002 to FC, 82273737 to RZ, 81820108028 to HS, 81973142 to YW and 82103946 to SS), Natural Science Foundation of the Jiangsu Higher Education Institutions of China (21KJB330004 to SS), the US National Institutes of Health (CA209414, CA249096, CA092824 and ES000002 to DCC, CA209414 and CA249096 to YL), Priority Academic Program Development of Jiangsu Higher Education Institutions (PAPD). RZ was partially supported by the Qing Lan Project of the Higher Education Institutions of Jiangsu Province and the Outstanding Young Level Academic Leadership Training Program of Nanjing Medical University.
Jiajin Chen and Yunjie Song contributed equally to this article
David C. Christiani is the senior author who supervised the work
Contributor Information
Ruyang Zhang, Email: zhangruyang@njmu.edu.cn.
Feng Chen, Email: fengchen@njmu.edu.cn.
Data accessibility
The DNA methylation image data of USA‐Harvard, Spain, Norway and Sweden study cohort can be requested from DCC, ME, ÅH, and JS, respectively. Alternatively, it can be retrieved from GEO database (GSE39279, GSE66836 and GSE56044). Gene expression data were retrieved from GEO database (GSE10245, GSE29013, GSE31210, and GSE50081). TCGA: https://tcga‐data.nci.nih.gov; now hosted at GDC: https://portal.gdc.cancer.gov. GEO: https://www.ncbi.nlm.nih.gov/gds/.
References
- 1. Sung H, Ferlay J, Siegel RL, Laversanne M, Soerjomataram I, Jemal A, et al. Global cancer statistics 2020: GLOBOCAN estimates of incidence and mortality worldwide for 36 cancers in 185 countries. CA Cancer J Clin. 2021;71:209–49. [DOI] [PubMed] [Google Scholar]
- 2. Chen Z, Fillmore CM, Hammerman PS, Kim CF, Wong KK. Non‐small‐cell lung cancers: a heterogeneous set of diseases. Nat Rev Cancer. 2014;14:535–46. [DOI] [PMC free article] [PubMed] [Google Scholar]
- 3. Tang S, Pan Y, Wang Y, Hu L, Cao S, Chu M, et al. Genome‐wide association study of survival in early‐stage non‐small cell lung cancer. Ann Surg Oncol. 2015;22:630–5. [DOI] [PubMed] [Google Scholar]
- 4. Jones PA. Functions of DNA methylation: islands, start sites, gene bodies and beyond. Nat Rev Genet. 2012;13:484–92. [DOI] [PubMed] [Google Scholar]
- 5. Koch A, Joosten SC, Feng Z, de Ruijter TC, Draht MX, Melotte V, et al. Analysis of DNA methylation in cancer: location revisited. Nat Rev Clin Oncol. 2018;15:459–66. [DOI] [PubMed] [Google Scholar]
- 6. Anglim PP, Alonzo TA, Laird‐Offringa IA. DNA methylation‐based biomarkers for early detection of non‐small cell lung cancer: an update. Mol Cancer. 2008;7:81. [DOI] [PMC free article] [PubMed] [Google Scholar]
- 7. Cordell HJ. Detecting gene‐gene interactions that underlie human diseases. Nat Rev Genet. 2009;10:392–404. [DOI] [PMC free article] [PubMed] [Google Scholar]
- 8. Chen J, Shen S, Li Y, Fan J, Xiong S, Xu J, et al. APOLLO: an accurate and independently validated prediction model of lower‐grade gliomas overall survival and a comparative study of model performance. EBioMedicine. 2022;79:104007. [DOI] [PMC free article] [PubMed] [Google Scholar]
- 9. Zhang R, Chen C, Dong X, Shen S, Lai L, He J, et al. Independent validation of early‐stage non‐small cell lung cancer prognostic scores incorporating epigenetic and transcriptional biomarkers with gene‐gene interactions and main effects. Chest. 2020;158:808–19. [DOI] [PMC free article] [PubMed] [Google Scholar]
- 10. Zhang R, Lai L, He J, Chen C, You D, Duan W, et al. EGLN2 DNA methylation and expression interact with HIF1A to affect survival of early‐stage NSCLC. Epigenetics. 2019;14:118–29. [DOI] [PMC free article] [PubMed] [Google Scholar]
- 11. Zhu J, Guan J, Ji X, Song Y, Xu X, Wang Q, et al. A two‐phase comprehensive NSCLC prognostic study identifies lncRNAs with significant main effect and interaction. Mol Genet Genomics. 2022;297:591–600. [DOI] [PMC free article] [PubMed] [Google Scholar]
- 12. Chen C, Wei Y, Wei L, Chen J, Chen X, Dong X, et al. Epigenome‐wide gene‐age interaction analysis reveals reversed effects of PRODH DNA methylation on survival between young and elderly early‐stage NSCLC patients. Aging (Albany NY). 2020;12:10642–62. [DOI] [PMC free article] [PubMed] [Google Scholar]
- 13. Ji X, Lin L, Fan J, Li Y, Wei Y, Shen S, et al. Epigenome‐wide three‐way interaction study identifies a complex pattern between TRIM27, KIAA0226, and smoking associated with overall survival of early‐stage NSCLC. Mol Oncol. 2022;16:717–31. [DOI] [PMC free article] [PubMed] [Google Scholar]
- 14. Ji X, Lin L, Shen S, Dong X, Chen C, Li Y, et al. Epigenetic‐smoking interaction reveals histologically heterogeneous effects of TRIM27 DNA methylation on overall survival among early‐stage NSCLC patients. Mol Oncol. 2020;14:2759–74. [DOI] [PMC free article] [PubMed] [Google Scholar]
- 15. Chu M, Zhang R, Zhao Y, Wu C, Guo H, Zhou B, et al. A genome‐wide gene‐gene interaction analysis identifies an epistatic gene pair for lung cancer susceptibility in Han Chinese. Carcinogenesis. 2014;35:572–7. [DOI] [PMC free article] [PubMed] [Google Scholar]
- 16. Zhang R, Shen S, Wei Y, Zhu Y, Li Y, Chen J, et al. A large‐scale genome‐wide gene‐gene interaction study of lung cancer susceptibility in Europeans with a trans‐ethnic validation in Asians. J Thorac Oncol. 2022;17:974–90. [DOI] [PMC free article] [PubMed] [Google Scholar]
- 17. Asomaning K, Miller DP, Liu G, Wain JC, Lynch TJ, Su L, et al. Second hand smoke, age of exposure and lung cancer risk. Lung Cancer. 2008;61:13–20. [DOI] [PMC free article] [PubMed] [Google Scholar]
- 18. Sandoval J, Mendez‐Gonzalez J, Nadal E, Chen G, Carmona FJ, Sayols S, et al. A prognostic DNA methylation signature for stage I non‐small‐cell lung cancer. J Clin Oncol. 2013;31:4140–7. [DOI] [PubMed] [Google Scholar]
- 19. Bjaanæs MM, Fleischer T, Halvorsen AR, Daunay A, Busato F, Solberg S, et al. Genome‐wide DNA methylation analyses in lung adenocarcinomas: association with EGFR, KRAS and TP53 mutation status, gene expression and prognosis. Mol Oncol. 2016;10:330–43. [DOI] [PMC free article] [PubMed] [Google Scholar]
- 20. Karlsson A, Jönsson M, Lauss M, Brunnström H, Jönsson P, Borg Å, et al. Genome‐wide DNA methylation analysis of lung carcinoma reveals one neuroendocrine and four adenocarcinoma epitypes associated with patient outcome. Clin Cancer Res. 2014;20:6127–40. [DOI] [PubMed] [Google Scholar]
- 21. Chen YA, Lemire M, Choufani S, Butcher DT, Grafodatskaya D, Zanke BW, et al. Discovery of cross‐reactive probes and polymorphic CpGs in the Illumina Infinium HumanMethylation450 microarray. Epigenetics. 2013;8:203–9. [DOI] [PMC free article] [PubMed] [Google Scholar]
- 22. Marabita F, Almgren M, Lindholm ME, Ruhrmann S, Fagerström‐Billai F, Jagodic M, et al. An evaluation of analysis pipelines for DNA methylation profiling using the Illumina HumanMethylation450 BeadChip platform. Epigenetics. 2013;8:333–46. [DOI] [PMC free article] [PubMed] [Google Scholar]
- 23. VanderWeele TJ. Mediation analysis: a practitioner's guide. Annu Rev Public Health. 2016;37:17–32. [DOI] [PubMed] [Google Scholar]
- 24. Warde‐Farley D, Donaldson SL, Comes O, Zuberi K, Badrawi R, Chao P, et al. The GeneMANIA prediction server: biological network integration for gene prioritization and predicting gene function. Nucleic Acids Res. 2010;38:W214–20. [DOI] [PMC free article] [PubMed] [Google Scholar]
- 25. Newman AM, Liu CL, Green MR, Gentles AJ, Feng W, Xu Y, et al. Robust enumeration of cell subsets from tissue expression profiles. Nat Methods. 2015;12:453–7. [DOI] [PMC free article] [PubMed] [Google Scholar]
- 26. Mascaux C, Tomasini P, Greillier L, Barlesi F. Personalised medicine for nonsmall cell lung cancer. Eur Respir Rev. 2017;26:170066. [DOI] [PMC free article] [PubMed] [Google Scholar]
- 27. Deb D, Moore AC, Roy UB. 2021 Global lung cancer therapy landscape. J Thorac Oncol. 2022;17:931–6. [DOI] [PubMed] [Google Scholar]
- 28. Shiina T, Hosomichi K, Inoko H, Kulski JK. The HLA genomic loci map: expression, interaction, diversity and disease. J Hum Genet. 2009;54:15–39. [DOI] [PubMed] [Google Scholar]
- 29. Gu SS, Zhang W, Wang X, Jiang P, Traugh N, Li Z, et al. Therapeutically increasing MHC‐I expression potentiates immune checkpoint blockade. Cancer Discov. 2021;11:1524–41. [DOI] [PMC free article] [PubMed] [Google Scholar]
- 30. Neefjes J, Jongsma ML, Paul P, Bakke O. Towards a systems understanding of MHC class I and MHC class II antigen presentation. Nat Rev Immunol. 2011;11:823–36. [DOI] [PubMed] [Google Scholar]
- 31. Yang S, Tang D, Zhao YC, Liu H, Luo S, Stinchcombe TE, et al. Potentially functional variants of ERAP1, PSMF1 and NCF2 in the MHC‐I‐related pathway predict non‐small cell lung cancer survival. Cancer Immunol Immunother. 2021;70:2819–33. [DOI] [PMC free article] [PubMed] [Google Scholar]
- 32. Gyrd‐Hansen M, Meier P. IAPs: from caspase inhibitors to modulators of NF‐kappaB, inflammation and cancer. Nat Rev Cancer. 2010;10:561–74. [DOI] [PubMed] [Google Scholar]
- 33. Verzella D, Pescatore A, Capece D, Vecchiotti D, Ursini MV, Franzoso G, et al. Life, death, and autophagy in cancer: NF‐κB turns up everywhere. Cell Death Dis. 2020;11:210. [DOI] [PMC free article] [PubMed] [Google Scholar]
- 34. Dimitrakopoulos FD, Kottorou AE, Kalofonou M, Kalofonos HP. The fire within: NF‐κB involvement in non‐small cell lung cancer. Cancer Res. 2020;80:4025–36. [DOI] [PubMed] [Google Scholar]
- 35. Contini P, Murdaca G, Puppo F, Negrini S. HLA‐G expressing immune cells in immune mediated diseases. Front Immunol. 2020;11:1613. [DOI] [PMC free article] [PubMed] [Google Scholar]
- 36. Xu HH, Gan J, Xu DP, Li L, Yan WH. Comprehensive transcriptomic analysis reveals the role of the immune checkpoint HLA‐G molecule in cancers. Front Immunol. 2021;12:614773. [DOI] [PMC free article] [PubMed] [Google Scholar]
- 37. Yie SM, Yang H, Ye SR, Li K, Dong DD, Lin XM. Expression of human leucocyte antigen G (HLA‐G) is associated with prognosis in non‐small cell lung cancer. Lung Cancer. 2007;58:267–74. [DOI] [PubMed] [Google Scholar]
- 38. Shalapour S, Karin M. Pas de Deux: control of anti‐tumor immunity by cancer‐associated inflammation. Immunity. 2019;51:15–26. [DOI] [PMC free article] [PubMed] [Google Scholar]
- 39. Berraondo P, Minute L, Ajona D, Corrales L, Melero I, Pio R. Innate immune mediators in cancer: between defense and resistance. Immunol Rev. 2016;274:290–306. [DOI] [PubMed] [Google Scholar]
- 40. Jordan MA, Wilson L. Microtubules as a target for anticancer drugs. Nat Rev Cancer. 2004;4:253–65. [DOI] [PubMed] [Google Scholar]
- 41. Parker AL, Kavallaris M, McCarroll JA. Microtubules and their role in cellular stress in cancer. Front Oncol. 2014;4:153. [DOI] [PMC free article] [PubMed] [Google Scholar]
- 42. Al‐Mehdi AB, Pastukh VM, Swiger BM, Reed DJ, Patel MR, Bardwell GC, et al. Perinuclear mitochondrial clustering creates an oxidant‐rich nuclear domain required for hypoxia‐induced transcription. Sci Signal. 2012;5:ra47. [DOI] [PMC free article] [PubMed] [Google Scholar]
- 43. Idelchik M, Begley U, Begley TJ, Melendez JA. Mitochondrial ROS control of cancer. Semin Cancer Biol. 2017;47:57–66. [DOI] [PMC free article] [PubMed] [Google Scholar]
- 44. Araiso Y, Imai K, Endo T. Role of the TOM complex in protein import into mitochondria: structural views. Annu Rev Biochem. 2022;91:679–703. 10.1146/annurev-biochem-032620-104527 [DOI] [PubMed] [Google Scholar]
- 45. Bender A, Desplats P, Spencer B, Rockenstein E, Adame A, Elstner M, et al. TOM40 mediates mitochondrial dysfunction induced by α‐synuclein accumulation in Parkinson's disease. PLoS One. 2013;8:e62277. [DOI] [PMC free article] [PubMed] [Google Scholar]
- 46. Yang W, Shin HY, Cho H, Chung JY, Lee EJ, Kim JH, et al. TOM40 inhibits ovarian cancer cell growth by modulating mitochondrial function including intracellular ATP and ROS levels. Cancers (Basel). 2020;12:1329. [DOI] [PMC free article] [PubMed] [Google Scholar]
- 47. Greenberg MVC, Bourc'his D. The diverse roles of DNA methylation in mammalian development and disease. Nat Rev Mol Cell Biol. 2019;20:590–607. [DOI] [PubMed] [Google Scholar]
- 48. Mattioli K, Oliveros W, Gerhardinger C, Andergassen D, Maass PG, Rinn JL, et al. Cis and trans effects differentially contribute to the evolution of promoters and enhancers. Genome Biol. 2020;21:210. [DOI] [PMC free article] [PubMed] [Google Scholar]
- 49. Wainberg M, Sinnott‐Armstrong N, Mancuso N, Barbeira AN, Knowles DA, Golan D, et al. Opportunities and challenges for transcriptome‐wide association studies. Nat Genet. 2019;51:592–9. [DOI] [PMC free article] [PubMed] [Google Scholar]
Associated Data
This section collects any data citations, data availability statements, or supplementary materials included in this article.
Supplementary Materials
Fig. S1. Quality control procedures for epigenome‐wide DNA methylation chip data from the USA (Harvard), Spain, Norway, and Sweden centres, as well as TCGA.
Fig. S2. Subgroup analysis of the identified G × G interactions in LUAD and LUSC.
Fig. S3. ROC plot for discrimination ability of integrative score and clinical covariates.
Table S1. Gene expression data downloaded from the GEO database.
Table S2. Demographic and clinical descriptions for early‐stage NSCLC patients with gene expression information from GEO and TCGA.
Table S3. Association results of 15,534 pairs of G × G interactions in the epigenomic analysis.
Table S4. Association results of 25 pairs of G × G interactions in the transcriptomic analysis.
Table S5. Correlation between DNA methylation probes and corresponding gene expressions.
Table S6. Potential targeted drug for screened G × G interactions derived from DrugBank database.
Data Availability Statement
The DNA methylation image data of USA‐Harvard, Spain, Norway and Sweden study cohort can be requested from DCC, ME, ÅH, and JS, respectively. Alternatively, it can be retrieved from GEO database (GSE39279, GSE66836 and GSE56044). Gene expression data were retrieved from GEO database (GSE10245, GSE29013, GSE31210, and GSE50081). TCGA: https://tcga‐data.nci.nih.gov; now hosted at GDC: https://portal.gdc.cancer.gov. GEO: https://www.ncbi.nlm.nih.gov/gds/.


