

Abstract
High grade serous ovarian cancer (HGSOC) is the deadliest ovarian cancer histotype due in-part to the lack of therapeutic options for chemotherapy resistant disease. Poly(ADP)-ribose polymerase inhibitors (PARPi) represent a targeted treatment. However, PARPi resistance is becoming a significant clinical challenge. There is an urgent need to overcome resistance mechanisms to extend disease-free intervals. We established isogeneic PARPi-sensitive and -resistant HGSOC cell lines. In three PARPi-resistant models there is a significant increase in AP-1 transcriptional activity and DNA repair capacity. Using RNA-seq and an shRNA screen, we identified Activating Transcription Factor 6 (ATF6) as a mediator of AP-1 activity, DNA damage response, and PARPi resistance. In publicly available datasets, ATF6 expression is elevated in HGSOC and portends a poorer recurrence free survival. In a cohort of primary HGSOC tumors, higher ATF6 expression significantly correlated to PARPi resistance. In PARPi-resistant cell lines and a PDX model, inhibition of a known ATF6 regulator, p38, attenuated AP-1 activity and RAD51 foci formation, enhanced DNA damage, significantly inhibited tumor burden, and reduced accumulation of nuclear ATF6.
Implications:
This study highlights that a novel p38-ATF6 mediated AP-1 signaling axis contributes to PARPi resistance and provides a clinical rationale for combining PARPi and AP-1 signaling inhibitors.
Introduction
Epithelial ovarian cancer is the deadliest gynecologic malignancy and has a high death to incidence ratio (63:100)[1]. The most common histotype is high grade serous ovarian cancer (HGSOC), which accounts for up to 75% of cases and over 80% of patients are diagnosed at an advanced stage (III/IV)[1–3]. About 80% of HGSOC patients will respond to first line treatment, which includes primary cytoreductive surgery and platinum-based chemotherapy regimens[4]. Unfortunately, over 85% of patients will recur within two years and be treated with additional chemotherapeutic regimens[4]. There is a significant and urgent need to develop therapeutic strategies to complement chemotherapy and overcome acquired resistance.
Poly(ADP)ribose polymerase inhibitors (PARPi; olaparib, rucaparib, niraparib) are FDA-approved targeted therapies for HGSOC upfront as a maintenance therapy for chemosensitive disease and in the setting of recurrence[4–9]. PARPs detect single stranded breaks (SSB) in DNA and will undergo auto-poly(ADP) ribosylation (PAR) to attract other DNA damage repair (DDR) proteins to initiate both SSB and double stranded break (DSB) repair[10, 11]. PARPi inhibit SSB repair by trapping PARP against the DNA, preventing the formation of PAR chains and subsequent DDR leading to replication fork (RF) stalling and the accumulation of DSBs[10, 11]. Cells with deficient homologous recombination (HR) DDR do not effectively repair DNA breaks, which results in mitotic catastrophe and apoptosis[10, 11]. Notably, ~50% of HGSOC tumors have DDR defects[12], making HGSOC an optimal model to test PARPi response and to better understand resistance mechanisms. Furthermore, recent clinical trials with niraparib demonstrated that HR proficient patients also display a significant clinical benefit from PARPi[8, 9]. While PARPi represent a major advancement in the field and it is likely that most patients will receive a PARPi, acquired resistance is becoming a major clinical obstacle, illustrating a critical need to understand mechanisms driving PARPi resistance.
Our group reported that PARPi resistant cell lines exhibit an increased capacity for DDR[13]. However, the mechanism driving DDR and PARPi resistance is unknown. AP-1 is a dimeric transcription factor composed of basic region-leucine zipper (bZip) proteins such as Jun, Fos, and/or activating transcription factor (ATF) proteins[14, 15]. AP-1 signaling regulates a wide range of cellular processes including DNA repair and has been identified as an oncogene[15–17]. AP-1 dimerization and transcriptional activation are regulated by phosphorylation of the subunits, primarily by ERK, JNK, or p38[17–20]. For instance, p38 activates AP-1 in response to genotoxic stresses[17] and p38 has been linked to DDR such as Mismatch Repair, Nucleotide Excision Repair, and HR[21–23]. Thus, in PARPi-resistant models with increased DDR, targeting p38 to inhibit AP-1 transcriptional activity potentially offers an approach to overcome resistance.
This study defines the role of ATF6-dependent AP-1 signaling in mediating DDR and PARPi resistance. In a panel of isogeneic BRCA-mutated and wildtype HGSOC cell lines that are either sensitive or resistant to PARPi, there is an increase in AP-1 transcriptional activity in the resistant models. Through an unbiased screen of 14 AP-1 subunits, we identified that loss of ATF6 promoted PARPi resensitization in resistant HGSOC cells. Our data demonstrate that ATF6 is directly contributing to increased AP-1 signaling. ATF6 has been linked to DDR, p38-mediated chemoresistance, and is directly phosphorylated by p38[24]. In PARPi resistant cells, ATF6 knockdown and p38 inhibition similarly attenuated AP-1 transcriptional activity and related-transcriptomes. Further, ATF6 knockdown and p38 inhibition both induced DNA damage and resensitized HGSOC cells to PARPi. As an approach to inhibit ATF6 activity, an orally available p38 inhibitor in combination with olaparib slowed tumor growth, reduced tumor burden, and induced apoptosis. We discover that targeting a novel p38-mediated ATF6/AP-1 signaling axis is a potential approach to overcome PARPi resistance.
Materials and Methods
Cell Lines and Culture Conditions –
HGSOC cell lines (PEO1 [RRID: CVCL_2686], and OVCA420 [RRID: CVCL_3935]) were cultured in RPMI1640 supplemented with 10% fetal bovine serum (FBS) and 1% penicillin/streptomycin. UWB1.289 (RRID: CVCL_B079) were cultured in 50% RPMI1640 and 50% MEGM supplemented with 3% Fetal Bovine Serum (FBS) and 1% penicillin/streptomycin. Cell lines PEO1 and OVCA420 were obtained from the Gynecologic Tumor and Fluid Bank (GTFB) at the University of Colorado. UWB1.289 were obtained from the American Tissue Culture Collection. Viral packaging cells (293FT [RRID: CVCL_6911]) were cultured in Dulbecco’ modified Eagle’s medium supplemented with 10% FBS at 37°C supplied with 5% CO2. Cells lines were authenticated at The University of Arizona Genomics Core using short tandem repeat DNA profiling. Cell lines are kept in culture for two months or 20 passages. Regular Mycoplasma testing was performed using LookOut Mycoplasma PCR detection (Sigma). Cells were last tested for Mycoplasma on April 25th, 2022.
Inhibitors and Antibodies –
PH-797804 was obtained through Selleckchem (Cat #S2726). Olaparib was obtained through LC Laboratories (Cat #O-9201). A full list of antibodies used for immunoblotting and immunofluorescence can be found in Table S1.
Reverse-transcriptase quantitative polymerase chain reaction –
RNA was extracted with the RNeasy Mini Kit followed by on-column DNase digest (Qiagen). mRNA expression was determined using SYBR green Luna Universal One-step RT-PCR kit (New England Biolabs) with a BioRad CFX96 thermocycler. β-2-Microglobulin (B2M) and 18S rRNA were used as internal controls as stated in figure legends. All primer sequences are provided in Table S2.
Lentiviral Transduction –
Lentiviral production and transduction were performed as described previously[13]. Lentivirus was packaged using the Virapower Kit from Life Technologies (Carlsbad, CA) following the manufacturer’s instructions as described [13]. Cells incubated with lentiviral particles encoding a puromycin resistance gene for 16 hrs and selected in 1 μg/mL puromycin for 48 hrs. The shRNA IDs can be found in Table S3.
Lentiviral shRNA Screen –
400 PEO1-OR cells were plated in each well of a 96-well plate. The next day cells were transduced with lentivirus containing a puromycin resistant gene. The plate includes 5 shRNA targeting each of 14 different AP-1 subunits and 5 shControls. 24 hours after transductions, cells were selected for 24 hours in 1 μg/mL puromycin. Cells were then split into two plates, one to be treated with DMSO and the other to be treated with 625 nM olaparib. After the shControl wells on the control plate were confluent, the assay was stopped and analyzed via a crystal violet assay. Colonies were fixed (10%methanol/10% acetic acid) and stained with 0.4% crystal violet. After taking images of the plate, crystal violet was then dissolved in fixative and absorbance was measured at 570nm. Presented data represents the average results from five independent runs of this assay. One was assigned as no difference between the control and olaparib treated plates. Colony formation less than one was is considered resensitized to olaparib and a value greater than one was considered more resistant to olaparib.
Colony formation assay –
Cell lines were seeded and treated with increasing olaparib doses as described previously[13]. Cell medium and olaparib were changed every 2 days for 12 days. Colonies were fixed (10% methanol/10% acetic acid) and stained with 0.4% crystal violet. Crystal violet was dissolved in fixative and absorbance was measured at 570 nm. Assays were performed in technical triplicate before reporting data. Drug interaction between olaparib and PH-797804 was analyzed using the coefficient of drug interaction (CDI)[25]. CDI = AB/(A x B); AB is the ratio of two0drug combination group to control, and A or B is ratio of single drug to the control. CDI < 1 indicates synergism, CDI < 0.7 indicates significant synergism.
Immunoblotting –
Total protein was extracted with radioimmunoprecipitation assay buffer (150 mM NaCl, 1% TritionX-100, 0.5% sodium deoxycholate, 0.1% sodium dodecyl sulfate [SDS], 50 mM Tris pH 8.0) supplemented with Complete EDTA-free protease inhibitors (Roche), 5 mM NaF, and 1 mM Na3VO4. Nuclear extraction was performed by suspending cells in a hypotonic buffer (10 mM HEPES-KOH pH 7.9, 1.5 mM MgCl2, 10 mM KCl, 1 mM DTT, 1x Halt Protease Inhibitor [ThermoFisher; Cat # 78430]). After dounce homogenization and centrifugation, the resulting nuclear pellets were suspended in a hypertonic buffer (20 mM HEPES-KOH pH 7.9, 25% Glycerol, 1.5 mM MgCl2, 0.6 M KCl, 0.2 mM EDTA, 1 mM DTT, 1x Halt Protease Inhibitor). Protein was separated on an SDS polyacrylamide gel electrophoresis and transferred to polyvinylidene fluoride membrane. Primary antibody incubation was performed overnight at 4C. Secondary goat anti-rabbit (IRDye 680RD or IRDye 800CW, LI-COR, Cat # 92568071 [RRID: AB_2721181] or Cat # 926–32211 [RRID: AB_621842]; 1:20,000) and goat anti-mouse (IRDye 680RD or IRDye 800CW, LI-COR, Cat # 926–68070 [RRID: AB_10956588] or Cat# 925–32210 [RRID: AB_2687825], 1:20,000) antibodies were applied for 1 hour at room temperature. Blots were visualized using the Licor Odyssey Imaging System and ImageStudio software (V4).
Immunohistochemistry –
Cell lines are pelleted and suspended in histogel. After allowing the histogel to solidify, samples are then sent for paraffin embedding. Paraffin embedded sections were dewaxed in xylene twice for 5 min and rehydrated in graded alcohols at 100%, 90%, and 70%, for 10 min each and then in water. Antigen retrieval was performed using 10 mM Citrate Buffer placing the slides in the solution 30 min at 110C in a pressure cooker. Sections were quenched in 3% hydrogen peroxide for 10 min and then incubated at 4C overnight with antibody after blocking in 1% BSA in TBS. Sections were rinsed three times in TBS and then incubated with anti-mouse secondary antibody (Cell Signaling, #7076 [AB_330924]) for one hour at RT followed by three washes with TBS. Dako DAB substrate was applied to the sections for 2 min followed by application of hematoxilyn. Ki67 (Thermo Scientific, cat. # RM-9106 [AB_2341197]) and cleaved caspase 3 (Cell Signaling, cat. # 9661 [RRID: AB_2341188]) were completed by the Histopathology Shared Resource as previously described[13].
3XAP-1 Reporter Assay –
Cell lines were seeded in a 6-well plate and 24 hours later, cells were transfected using Fugene6 with 3 μg of either a control pGL3 (RRID: Addgene_48743) plasmid or a pGL3–3XAP1 (RRID: Addgene_40342) reporter plasmid[26]. 72 hours later cells were lysed for 5 min, scraped off the plate, spun down and lysates collected. Lysates were plated in an opaque 96 well plate with luciferase and luminescence was read on a Promega GloMax. PH-797804 treated plates were treated with 5 μM PH-797804.
Comet assay –
Protocol adapted from Trevigen Comet kit (Cat. # 4250–050-K) and [13]. Cells were seeded in 10 cm dishes and treated with 3 μM olaparib for 24 hours. Cells were collected and plated in the provided low melt agarose on microscope slides. Cells were lysed using Trevigen lysis buffer and then electrophoresed at 4°C in a neutral buffer (100 mM Tris, pH 9.0, 300 mM sodium acetate). Electrophoresis was run at 21 Volts for 45 min. Cells were stained with Sybr Gold and imaged using a Nikon DS-Ri2. The tail moment was measured using ImageJ.
Immunofluorescence –
Cells were seeded on pretreated glass coverslips. 24 hours later plates were fixed in 4% paraformaldehyde. Cells were permeabilized in 0.2% TritonX in PBS and incubated in primary antibody (Table S1) for two hours at room temperature. Cells were rinsed with 1% TritonX and incubated in secondary antibody for one hour at room temperature. Glass slides are mounted with SlowFade Dapi and sealed with nail polish. Images were taken using a Nikon DS-Ri2 and at least 200 cells were quantified.
Tissue Microarray –
A previously constructed tissue microarray comprised of serous tumor from ovarian cancer patients treated at the University of Colorado was provided by the GTFB (COMIRB #17–7788)[27]. Tumor sections were immunohistochemically stained for ATF6. Histology score (H Score) was calculated for each tumor section by board certified pathologist (MDP & AB) as previously described[28]. The generation of the tissue microarray was retrospective and patient information was de-identified thus a written informed consent was not required as deemed by COMIRB as per the ethical standard defined by the Declaration of Helsinki.
RNA-sequencing –
RNA was isolated from PEO1 olaparib-resistant shControl (n=2) and shATF6 (n=2), using RNeasy columns with on-column DNase digest (Qiagen). RNA quality was confirmed using Agilent Tapestation and all RNA used for library preparation had a RIN>9. Libraries were created using Illumina TruSEQ stranded mRNA library prep (Cat # RS-122–2102). Strand-specific pair-ended libraries were pooled and run on HiSeq4000 (Illumina). Library creation and sequencing were performed at the Genomics Core at the University of Colorado Anschutz Medical Campus. HISAT2[29] was used for alignment against GRCh37 version of the human genome. Samples were normalized using TPM (Transcripts per Million) measurement and gene expression using the GRCh37 gene annotation was calculated using home-made scripts. The analysis was performed utilizing BioJupies[30]. RNA-sequencing has been deposited to NCBI: GSE190902.
EPCAM Staining –
PDX-GTFB1016, described below, were thawed, washed with 1x PBS, and trypsinized at 37C for 5 min to obtain a single-cell suspension. 300,000 cells were stained with a PE-conjugated anti-human-EPCAM antibody (Biolegend, 1:400, Catalog #324205, RRID AB_756079) on ice in the dark for 30 min. Cells were centrifuged and re-suspended in flow cytometry media (RPMI), and stained with DAPI, to differentiate between live and dead cells. Flow cytometry was performed using the Gallios 561 (Beckman Coulter) flow cytometer and data analysis was performed using FlowJo software. Unstained cells were used as controls.
Animal Model –
The protocols were approved by the Institutional Animal Care and Use Committee (IACUC). A developed patient-derived xenograft (PDX) model, PDX-GTFB1016, was utilized to evaluate HGSOC treatment with the p38 inhibitor, PH-797804. PDX-GTFB1016 is derived from a chemonaïve stage IIIC HGSOC with somatic TP53 and BRCA2 mutations. To develop the recurrent olaparib-insensitive HGSOC model, patient-derived ascites (2.9 × 10⁶ cells) were intraperitoneally injected into immunocompromised mice. After 7 days, tumor-bearing mice were randomized and treated with vehicle control (10% cyclodextrin) or olaparib (50 mg/kg, daily) for 21 days at which point treatment was stopped. Mice were monitored for 2 months. Recurred tumor and ascites were collected and used for analysis and subsequent PDX studies [13, 31]. For the olaparib and PH-797804 combination experiment, a sample size of 10 mice per group was determined based on the in vitro data. A lentiviral GFP/Luciferase was transduced into ascites collected from the recurrent olaparib-insensitive HGSOC model as previously described[32]. 3 × 10⁶ GFP/luciferase expressing PDX-GTFB1016 olaparib insensitive cells were injected into the peritoneal cavity of 6–8-week-old female immunocompromised mice, (NOD.Cg-Prkdcscid Il2rgtm1Wjl/SzJ; The Jackson Laboratory, Strain # 005557). Tumors were visualized by injecting luciferin (4 mg/mice in PBS) and imaged with an In Vivo Imaging System (IVIS) at the UCCC Small Animal Imaging Shared Resource. Mice were randomized into groups based on total flux. Mice were daily treated for 28 days via oral gavage with vehicle control (10% DMSO), olaparib (50 mg/kg), PH-797804 (15 mg/kg), or olaparib/PH-797804. IVIS images were analyzed with Live Imaging 4.0 software (PerkinElmer). Each mouse was subjected to necropsy after euthanasia with a CO2 chamber and cervical dislocation. Ascites was collected via peritoneal wash in PBS. The peritoneal wash was processed via red blood cell lysis (155 mM NH4Cl, 12 mM NaHCO3, 0.1 mM EDTA). Volume of ascites cells was recorded.
Ovarian cancer dataset analysis –
Publicly available cancer databases: Ovarian cancer single cell RNA-sequencing[33] via http://blueprint.lambrechtslab.org. ATF6 low and high (based on median RNA expression) RNA-sequencing from The Cancer Genome Atlas Ovarian Serous Cystadenocarcinoma Firehose Legacy via https://cbioportal.org[12]. Ovarian cancer KMplotter used autoselect best cut off, all histology stage grade p53 mutation and debulking status were included, excluded biased arrays via https://kmplot.com[34].
Statistical Consideration –
Statistical analyses and P value calculations were performed using GraphPad Prism v9. Quantitative data are expressed as mean +/− standard error of the mean (SEM) unless otherwise noted. Analysis of variance (ANOVA) with Tukey multicomparison correction was used to identify significant differences in multiple comparisons. t-test was used for pairwise comparisons with False Discovery Rate method of Benjamini-Hochberg. Kaplan-Meier and Logrank was used for survival analysis. Dose response curves were analyzed via non-linear regression followed by a comparison of IC50 using the Extra Sum of Squares F Test. Multiple logistic regression with log-likelihood ratio was used to analyze patient characteristics and to assess null hypothesis. Mixed-model effects analysis was completed to determine statistical significance of in vivo models by determining the tumor growth (flux percent change) effect and time effect. All experiments were completed in three independent experiments and at minimum of triplicate. For all statistical analyses, the level of significance was set at 0.05. Outliers have been assessed using the ROUT method with a Q value set at 1%.
Data availability statement –
Data are available upon request from the corresponding author.
Results
AP-1 Signaling is Increased in PARP Inhibitor Resistant Cells and is Mediated by ATF6
We previously observed an increase in DNA damage repair (DDR) capacity in PARP inhibitor (PARPi) resistant high grade serous ovarian cancer (HGSOC) [13]. While we did not observe any previously defined mechanisms that may drive this increased DDR capacity, we noted that AP-1 transcriptional activity was enhanced in PARPi resistant cells based on previously published RNA-sequencing data[13]. AP-1 is a dimeric transcription factor complex that regulates several cellular responses including DDR[14, 19] and has been linked to cancer progression in a variety of different cancers, including ovarian cancer.
We wanted to assess AP-1 transcriptional activity in PARPi resistant models. We established olaparib-resistant HGSOC cell lines (PEO1-olaparib resistant, PEO1-OR; OVCA420-olaparib resistant, OVCA420-OR; and UWB1.289-olaparib resistant, UWB-OR) through step-wise escalation of the PARPi olaparib. PEO1 cell lines were utilized because they are established HGSOC cell lines that have mutated TP53 and BRCA2[35]. The OVCA420 cell line is TP53 mutated and BRCA-wildtype[36]. The UWB1.289 cell line has mutated TP53 and BRCA1[37]. Olaparib resistance was confirmed with a dose-response colony formation assay (Fig S1a–c). Using an AP-1 luciferase reporter assay, we confirmed increased AP-1 transcriptional activity in a panel of olaparib resistant HGSOC lines with differing BRCA mutational statuses (Fig 1a–c). The OVCA420 cell line is more resistant to olaparib before developing the matched resistant pair, possibly explaining the higher levels of AP-1 transcriptional activity seen as compared to the BRCA mutated cell lines. Utilizing a dominant negative AP-1 subunit (A-Fos), we also confirmed a decrease in AP-1 transcriptional activity in PEO1-OR cells following transient transfection (Fig S1d). These data highlight that all PARPi resistant model tested exhibited elevated AP-1 transcriptional activity.
Figure 1: PARPi Resistant HGSOC cells have Increased AP-1 Transcriptional Activity.

A-C) 3xAP-1 luciferase reporter assay performed in BRCA2-mut (PEO1), BRCAWT (OVCA420), and BRCA1-mut (UWB) cell lines and matched olaparib resistant lines. Normalized to pGL3 control set equal to 1. D) Schematic of 96 well shRNA screen targeting 14 AP-1 subunits. Plate treated with 625 nM olaparib was normalized to vehicle control. E) Bar graph of combined shRNA screen results from five independent runs. F) qRT-PCR confirmed increased ATF6 expression in PEO1-OR cells. Internal control, B2M. G) Immunoblot confirming increased protein expression of ATF6. B-Actin used as internal control. H) Immunoblot of nuclear extract confirming increased ATF6 in the nucleus following 24 hour treatment with 3 μM Olaparib. Vinculin used as loading control I) Confirmation of ATF6 knockdown. B2M used as internal control. J) Control and ATF6 knockdown PEO1-OR cells were plated in a 96 well plate and treated with increasing doses of olaparib for 7 days and remaining cells were stained with crystal violet. K) Same as J, quantification of crystal violet staining. L) Luciferase AP-1 reporter assay performed in PEO1-OR control and ATF6 knockdown cells. Error bars, SEM. Statistical test, multicomparison ANOVA, *p<0.05, **p<0.01, ***p<0.001, ****p<0.0001
AP-1 is a dimeric transcription factor complex that can be composed of Jun, Fos, and/or ATF proteins[14, 15]. Using an unbiased approach to determine which AP-1 subunits are contributing to PARPi resistance, we performed an shRNA screen targeting 14 AP-1 subunits (Fig 1d). After transducing PEO1-OR cells with the shRNA, the cells were split into two 96-well plates that were either treated with a sublethal dose of olaparib (625 nM) or a vehicle control. We interrogated the Broad Institute database to determine predicted knockdown performance of each shRNA in the screen and confirmed percent knockdown of the AP-1 subunits (Table S3). ATF3 mRNA expression was not detected, therefore we are unable to confirm the impact of ATF3 on PARPi response. The subunits that significantly resensitized cells to olaparib upon knockdown were ATF5 (p = 0.0144) and ATF6 (p = 0.021) (Fig 1e). Notably, 82% of ATF6 targeting shRNAs successfully resensitized cells to olaparib compared to 56% of ATF5 targeting shRNA (Fig S1e). We measured RNA levels via qPCR of each tested subunit and in PARPi resistant cells, ATF6 is one of the most highly expressed AP-1 subunits (Fig S1f). Thus, we next wanted to determine the role of the ATF6/AP-1 axis in the context of PARPi resistance.
We examined ATF6 expression in PARPi resistant cells. We confirmed that ATF6 is upregulated in olaparib resistant cells as compared to the parental, sensitive cell lines (Fig 1f–g). Classically, ATF6 is a mediator of the unfolded protein response (UPR) [38, 39]. ATF6 is an Endoplasmic Reticulum (ER) trans-membrane protein[38, 39] and through a series of cleavages the N terminal domain of ATF6 (~50kDa) can translocate to the nucleus and function as a bZIP transcription factor that can either mediate UPR gene transcription or be co-opted by the AP-1 pathway[38–40]. We discovered that the 50kDa species of ATF6 is enriched in the nucleus 24 hours following PARPi treatment (Fig 1h). By interrogating ATF6 knockdown (KD) RNA-sequencing data[13], we confirmed no significant change in transcription of UPR genes, suggesting that ATF6-dependent AP-1 function is dominant (Fig S1g). We confirmed the results of the shRNA screen through the establishment of two stable ATF6 KD HGSOC cell lines (Fig 1i). Using colony formation assays, we confirmed that ATF6 KD resensitizes PEO1-OR cells to olaparib (Fig 1j–k). These data highlight that ATF6 in PARPi resistant cells is functioning to maintain resistance. We wanted to confirm that ATF6 is contributing to AP-1 transcriptional activity in our models and so performed AP-1 reporter assays on ATF6 KD cell lines. We confirmed a significant loss of AP-1 transcriptional activity upon ATF6 KD (Fig 1l).
ATF6 is Expressed in Ovarian Cancer and Correlates with PARP Inhibitor Resistance
Using publicly available datasets, we confirmed that ATF6 is more highly expressed in ovarian cancer tumors than in normal ovarian tissues (Fig 2a)[33]. We next examined the correlation between ATF6 expression and HGSOC cancer cells (Mullerian marker, PAX8+) within five HGSOC patient tumors (Fig 2b)[41]. We observed significant overlap between ATF6 and PAX8 expression, suggesting that ATF6 is predominantly expressed in the epithelial tumor cells. The Cancer Genome Atlas (TCGA) data demonstrate that 12% of ovarian cancer patients have deregulated ATF6 and that this is primarily through amplification (Fig 2c). Using KM plotter[34], high levels of ATF6 correlate with a worse progression free survival than low levels of ATF6 (Fig 2d). We performed ATF6 immunohistochemistry (IHC) utilizing a previously described tissue microarray (TMA)[27] (Fig 2e). Antibody specificity was confirmed using paraffin embedded PEO1-OR shControl and two ATF6 KD cell lines (Fig S2a). Specificity of signal was further evaluated in a patient tumor from the TMA, showing ATF6 signal is restricted to the tumor compartment (Fig S2a). The TMA includes 137 tumors from patients with either primary (n=109) or recurrent (n=28) HGSOC. While there is no significant difference in survival calculated in recurrent tumor samples, those with high ATF6 expression had a median survival of 91 months compared to undefined in those with lower ATF6 expression (Fig S2b). Using multiple logistic regression, ATF6 expression is significantly higher in patients resistant to PARPi (PARPi response <6 months) as compared to those sensitive to PARPi (PARPi response >6 months) (Fig 2f and Table S4). There is no significant difference in age, debulking, number of PARPi patients were treated with, or BRCA status between the two groups of patients (Table S4). Taken together, these data indicate that ATF6 expression in primary HGSOC tumors correlates to poor outcomes and PARPi resistance.
Figure 2: ATF6 Mediates PARPi Resistance.

A) Patient sample database showing a significant increase in ATF6 mRNA levels in ovarian cancer tissue as compared to normal tissue. [33] B) Single cell sequencing identifying tumor cells (PAX8+) and ATF6+ cells. [41] C) Oncoprint of ATF6 expression in ovarian cancer patients generated using cBioportal. D) KM plot generated on KMplotter comparing ovarian cancer patients with high and low levels of ATF6. E) Images of IHC staining for ATF6 showing lower to higher H-scores on a TMA of HGSOC patient tumor samples. Scale bar = 100 micron F) ATF6 H-scores from an IHC stained TMA showing increased ATF6 expression in PARPi resistant tumors (PARPi response <6 mo.) as compared to sensitive tumors. G) Volcano plot showing deregulated genes following RNA-sequencing of ATF6 knockdown PEO1-OR cell lines as compared to PEO1-OR shControl. Error bars, SEM. Statistical test, multicomparison ANOVA, *p<0.05, **p<0.01, ***p<0.001, ****p<0.0001
To assess an ATF6-dependent transcriptional program, we examined differentially expressed genes in cells with ATF6 knocked down via RNA-sequencing of ATF6 KD and matched control PEO1-OR cells (Fig 2g and Table S5). We confirmed loss of ATF6 expression as well as a significant overlap (p = 5.79×10⁻¹³) with AP-1 transcription factor activity (Table S5). Cross-referencing a PEO1-OR RNA-sequencing dataset[13], there is a significant overlap (Enrichment = 1.97, p = 3.423×10⁻²⁷) of genes inversely differentially expressed between PEO1-OR and PEO1-OR shATF6 (Fig S2c), demonstrating that ATF6 is involved in the regulation of PARPi resistant associated transcriptome. To further confirm the role of ATF6 of mediated AP-1 transcriptional activity, we confirmed decreased expression of AP-1 target genes using qPCR following ATF6 KD (Fig S2d).
Activated p38 contributes to PARP Inhibitor Resistance
AP-1 transcriptional activity is activated and enhanced through different kinases, namely MAPK14/p38, JNK, and ERK[17–20]. To determine which kinase is activated in olaparib resistant cell lines, we performed immunoblot for active (phosphorylated) levels of each of these three kinases. We observed a mild increase in pJNK and dpERK, and a robust increase in phosphor-p38 (Fig 3a–c). p38 has been shown to activate AP-1 transcriptional activity in response to genotoxic stresses, such as chemotherapy treatment[17, 18]. Also, p38 activation can reduce replication stress and increase DNA repair, both of which are pathways directly involved in PARPi resistance[42–45]. p38 phosphorylates ATF6 to promote AP-1 transcription factor complex formation and transcriptional activity[24]. Using a p38α inhibitor, PH-797804, we confirmed that p38 inhibition significantly reduced AP-1 activity (Fig 3d). Using dose response colony formation assays, we confirmed response to PH-797804 in our panel of HGSOC cell lines (Fig S3a–c). Notably, our olaparib resistant cell lines are not necessarily more sensitive to p38 inhibition than the matched sensitive cell lines. Additionally, we performed colony formation assays on our panel of PARPi resistant cell lines to determine response to PH-797804 treatment in combination with olaparib. We performed a coefficient of drug interaction (CDI) analysis[25] to determine if p38 inhibition synergizes with olaparib (Fig 3e). Two of the three tested cell lines show the predicted synergism (PEO1-OR CDI = 0.62, 420-OR CDI = 0.71, UWB-OR CDI = 1.34). Thus, we decided to further investigate ATF6 inhibition via p38 as a potential treatment to overcome PARPi resistance.
Figure 3: p38 may serve as a therapeutic target in PARPi resistance.
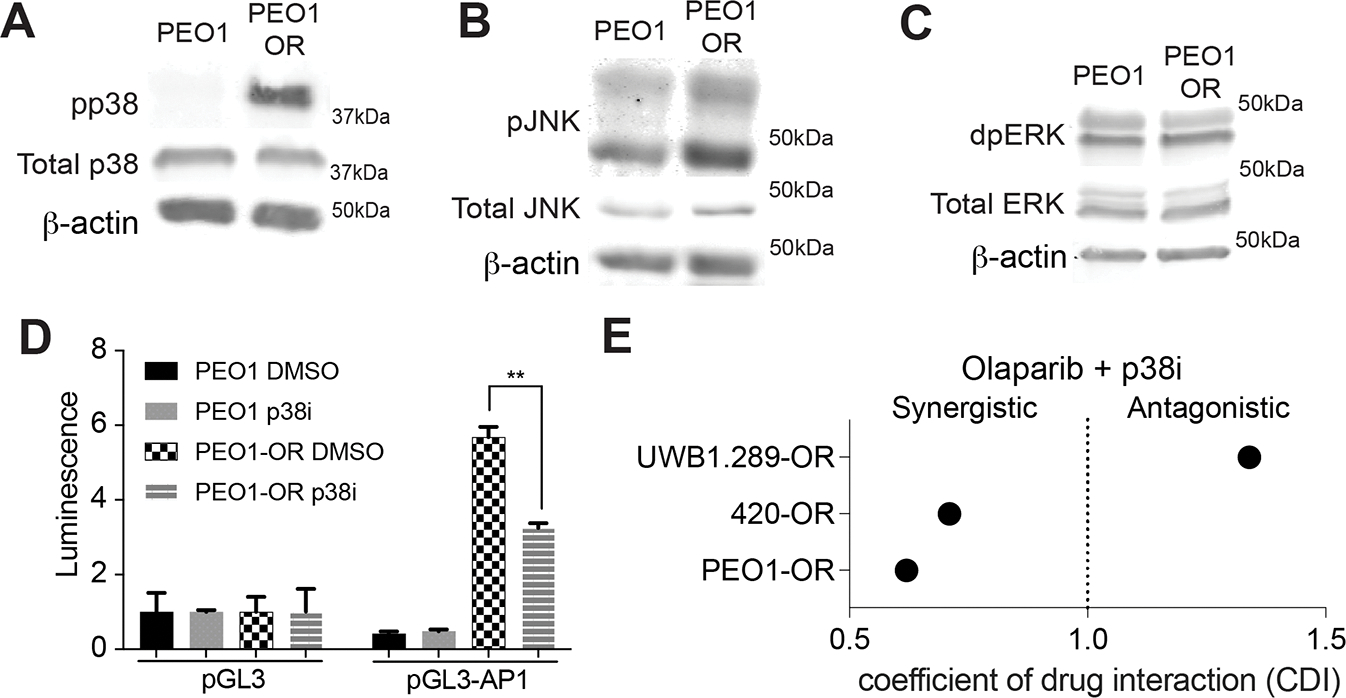
A) Immunoblot showing increased phosphor-p38 in PEO1-OR cells as compared to PEO1. Total p38 included as a control. β-Actin used as loading control. B) Immunoblot showing increased phosphor-JNK in PEO1-OR cells as compared to PEO1. Total JNK included as a control. β-Actin used as loading control. C) Immunoblot showing increased phosphor-ERK in PEO1-OR cells as compared to PEO1. Total ERK included as a control. β-Actin used as loading control. D) Luciferase AP-1 reporter assay performed in PEO1 and PEO1-OR cells treated with either vehicle control or 5 μM PH-797804. E) Colony formation assays performed in biologic triplicate were used to calculate the coefficient of drug interaction (CDI) between olaparib and PH-797804. CDI < 1 indicates synergism, CDI < 0.7 indicates significant synergism, CDI = 1 indicates additive, and CDI > 1 indicates antagonism. Error bars, SEM. Statistical test, multicomparison ANOVA, *p<0.05, **p<0.01, ***p<0.001, ****p<0.0001
ATF6 and p38 mediate DNA damage repair in PARP inhibitor resistant HGSOC
PARPis exploit impaired DDR in cancers with homologous recombination deficiencies[10]. We have previously shown that PARPi resistant cell lines exhibit an increased capacity for DDR[13]. AP-1 signaling has been linked to DNA damage repair in the literature[17]. For this reason, we wanted to determine if ATF6 or p38-mediated activation of ATF6 is required for DDR. To determine levels of DNA damage, we performed neutral comet assays to measure the levels of DSB upon ATF6 KD and treatment with our p38 inhibitor (p38i). ATF6 KD significantly increased DNA damage levels in olaparib treated OR cell lines measured via Comet assay (Fig 4a–c and S4a–b) and immunofluorescence (IF) based γH2AX foci formation (Fig4a–d). We observed increased DNA damage in OR cells treated with p38i alone and in combination with olaparib (Fig 4e–h and S4c–d). Loss of ATF6 and inhibition of p38 enhanced DNA damage in the presence of olaparib.
Figure 4: ATF6 and p38 Mediate DNA Damage Repair in PARPi Resistant HGSOC.

A) Representative images of neutral comet assays performed in PEO1-OR control and shATF6 cells. B) Quantification of A. C) Representative images of immunofluorescent staining of γH2AX foci in PEO1-OR control and shATF6 cells treated with either DMSO or 3 μM olaparib. D) Quantification of C. E) Representative images of neutral comet assay performed in PEO1-OR cells treated with either DMSO, 3 μM olaparib, 5 μM PH-797804, or the combination. F) Quantification of E. G) Representative images of IF staining for γH2AX in PEO1-OR cells treated with DMSO, 3 μM olaparib, 5μM PH-797804, or the combination. H) Quantification of G. I) Representative images of PEO1-OR control and shATF6 cells treated with DMSO, 3 μM olaparib, 5 μM PH-797804, or the combination. J) Quantification of I. K) Representative images of IF staining for γH2AX foci in PEO1-OR control or shATF6 treated with DMSO, 3 μM olaparib, 5 μM PH-797804, or the combination. L) Quantification of K. M) The log fold change in genes associated with different DDR pathways following ATF6 knockdown. Compared to log fold change of the whole transcriptome (WT). Nonhomologous end-joining = NHEJ, Homologous recombination = HR, Base excision repair = BER, Nucleotide excision repair = NER. N) Relative RNA expression of genes associated with different DDR pathways in patient tumors with either high or low ATF6 expression. O) Representative images of IF staining for RAD51 foci in PEO1-OR cells treated with DMSO, 3 μM olaparib, 5 μM PH-797804, or the combination for 24 hours. White arrows indicate RAD51 foci. P) Quantification of O. Error bars, SEM. Statistical test, multicomparison ANOVA, *p<0.05, **p<0.01, ***p<0.001, ****p<0.0001.
We hypothesize that p38 acts on DDR by phosphorylating ATF6 and subsequently activating AP-1 transcriptional activity. To determine if p38 is acting through ATF6 to mediate DDR, we performed both a neutral comet assay and γH2AX IF on ATF6 KD cell lines treated with PH-797804, olaparib, or the combination. In ATF6 KD resistant cells we observed an increase in DNA damage with olaparib treatment, however there was no additional increase in DNA damage when treated with only the p38i as compared to the untreated control and no increase in DNA damage with the combination treatment as compared to olaparib treatment alone (Fig 4i–l). These data suggest that p38 is functioning through a ATF6-mediated signaling axis to promote DDR.
After confirming the connection between ATF6 and p38 signaling and DDR, we investigated what DNA repair pathways are being modulated. Using Reactome Gene Sets [46], we cross-referenced genes associated with homologous recombination (HR), non-homologous end-joining (NHEJ), base excision repair (BER), and nucleotide excision repair (NER) to our RNA-sequencing of PEO1 shControl and shATF6 cells. We found that ATF6 KD leads to a significant downregulation of genes related to HR and NHEJ (Fig 4m). Similarly, interrogating The Cancer Genome Atlas PanCancer Atlas [12] dataset revealed that patient tumors with ATF6 expression higher than the median have significantly elevated expression of genes related to HR, NHEJ, BER, and NER as compared to those with ATF6 expression lower than the median (Fig 4n). We also observe decreased expression of DDR genes related to PARPi response, BRCA1 and PARP1, following ATF6 KD (Fig S4e).
To examine HR function, we performed IF for RAD51 on PEO1-OR cell lines treated PH-797804, olaparib, or the combination. Compared to control cells, p38i alone did not change the number of RAD51 foci per nucleus. However, treatment with the PARPi led to significantly elevated numbers of RAD51 foci compared to control (12.02 foci/nucleus vs. 0.286 foci/nucleus; adj.p<0.0001) (Fig 4o–p), suggesting that resistant cells undergo RAD51-mediated HR repair following PARPi treatment. Compared to olaparib treatment, the addition of the p38i significantly attenuated the number of RAD51 foci per nucleus (12.02 foci/nucleus vs. 6.00 foci/nucleus; adj.p<0.0001) (Fig 4o–p), suggesting that p38 signaling contributes to HR repair in PARPi resistant cells.
PARPi and p38i lead to decreased tumor burden in vivo
We next wanted to determine if inhibiting the ATF6-mediated signaling axis via p38i was effective in vivo. Thus, we utilized a patient derived xenograft (PDX) model with NOD-SCID mice[13]. We orthotopically implanted luciferase-expressing PDX tumor cells via intraperitoneal injections and allowed tumor to establish for four weeks (Fig 5a). After we confirmed tumor establishment via bio-luminescent in vivo imaging, we divided the mice into four treatment groups (Fig 5b and Fig S5a). Mice received oral gavage of vehicle, olaparib (50 mg/kg), p38i/PH-797804 (15 mg/kg), or combination daily for 28 days. Mice receiving either PH-797804 or the combination treatment had the lowest percent change in total flux a measure of tumor burden (Fig 5c and Fig S5b). Toxicity evaluated by mouse weight over the course of the treatment did not show changes (Fig S5c). Upon necropsy, we observed that only the combination treated mice had a significant reduction in total tumor burden (p = 0.0392) (Fig 5d). We performed IHC staining for PAX8 and flow cytometry for EPCAM on ascite cells collected at the time of necropsy to confirm that the collected cells are majority epithelial and Müllerian-derived cells (Fig S5d–e). We evaluated proliferation and cell death in collected ascites cells via Ki67 and cleaved caspase 3 (CC3) IHC, respectively (Fig S5f–g). We did not observe a significant difference in Ki67 histology scores, however, we see an increase in CC3 staining between the control ascites and the combination treated ascites (0.29% vs. 1.41%, p = 0.057) (Fig S5h)[47]. Compared to control and olaparib alone, there is a trend of increasing γH2AX levels in the PH-797804 and combination groups (Fig S5i–j). Similar to our in vitro data, there was a significant increase in nuclear levels of ATF6 in animals treated with olaparib (Fig 5e and S5k). This was attenuated by treatment with the p38i, suggesting that olaparib is driving ATF6 signaling and p38 inhibition is preventing ATF6 nuclear accumulation.
Figure 5: In vivo model using PH-797804 in combination with olaparib attenuates ATF6 nuclear accumulation.

A) Schematic of animal model. B) Bioluminescent imaging from Day 0 and Day 28 of treatments. C) Percent change in flux from day 0 as a surrogate for tumor burden. D) Tumor burden collected at the end of study measured as volume (mL) of ascites. Reported p-values are all in comparison to the control treatment. E) Nuclear protein lysates generated from tumor specimens and nuclear protein used for immunoblot against ATF6. Immunoblot of nuclear tumor lysates shown in Figure S5I. Graph is of densitometry of immunoblots. Lamin A/C used as loading and purity control. Outliers excluded. Error bars, SEM. Statistical test, multicomparison ANOVA, *p<0.05, **p<0.01, ***p<0.001, ****p<0.0001
Discussion
PARP inhibitors are FDA approved for first line maintenance therapy and the evidence that they are beneficial to HGSOC patients without HR deficiencies indicate that PARPi will continue to be increasingly prescribed[5, 7–9]. While PARPi are a major advancement in the management of HGSOC, acquired resistance is becoming a major clinical hurdle. This highlights the need to identify targetable mechanisms of acquired PARP inhibitor resistance. PARPi take advantage of deficient DDR within cancer cells, however following acquired resistance, our HGSOC models can mediate DDR independent of previously identified DDR mechanisms. AP-1 signaling has been linked to DDR[19] and we have shown an increase in AP-1 transcriptional activity in our three PARPi resistant models. Future studies should examine of AP-1 transcriptional activity in primary resistant ovarian cancer tumors. In an unbiased AP-1 subunit screen, we identified ATF6 as a mediator of AP-1 activity and PARPi resistance. There are currently no ATF6 inhibitors and AP-1 inhibition has been shown to be toxic when previously tested, leading us to investigate targetable activators of AP-1 transcriptional activity[17, 20]. We demonstrated that p38 is hyperactivated in PARPi resistant models and that it may serve as a promising therapeutic target to inhibit AP-1 activity and overcome PARPi resistance. P38 has been linked to DDR in several contexts, both by activation following DNA damage as well as mediating increased DDR protein transcription[22]. In line with this, we observed increased DNA damage upon p38i in two of three olaparib resistant models. Interestingly, the BRCA1-mutated cell line had an antagonistic response when treated in combination with PARPi/p38i, suggesting an alternative mechanism of elevated AP-1 activity. Additionally, p38 appears to mediate DDR through ATF6 signaling as p38 inhibition’s impact on DNA damage was attenuated in ATF6 knockdown cell lines. AP-1 activity regulates DNA damage repair genes, and consistently, we observed that loss of ATF6 downregulated several DNA damage genes and pathways. Future studies will be needed to determine the specific ATF6-regulated DNA repair pathways contributing to therapy resistance.
Previous studies have linked AP-1 signaling to PARPi resistance in other cancer models, specifically in the context of Triple Negative Breast Cancer (TNBC)[48]. Song et al demonstrated that Fra1 binds directly to PARP1 and that both knockdown of PARP1 and treatment with olaparib leads to decreased Fra1-PARP binding accompanied by an increase of AP-1 transcriptional activity[48]. This increased AP-1 transcriptional activity contributed to increased cell survival and metastasis[48]. Knockdown of Fra1 was able to sensitize TNBC models to PARP inhibition[48]. This combined with our data demonstrate the therapeutic potential of targeting AP-1 signaling in the context of PARPi resistance. As AP-1 is a dimeric transcription factor complex we did identify ATF6 as a mediator of PARPi resistance through AP-1 signaling, it is likely acting in complex with Jun or Fos subunit. Thus, targeting ATF6’s binding partner could serve as another potential therapeutic target to overcome PARPi resistance.
In our in vivo model, p38 inhibition alone was effective at slowing the growth of the tumor, and we did not observe a difference in the combination of olaparib and p38 inhibition compared to p38 inhibition alone. There are several possibilities that could account for this observation including differential mechanisms of PARPi resistance in the PDX model compared to the in vitro models. Regardless of this limitation, p38 inhibition alone was still effective at reducing tumor growth rate. This suggests that targeting the ATF6/p38 signaling axis represents a viable option for second-line therapy following the development of PARPi resistance. Further, studies have demonstrated an increase of PD-L1 in PARPi resistance[49], which implies the importance of evading the immune microenvironment in PARPi resistance. Consistently, p38 promotes the differentiation of tumor associated macrophages to a pro-tumorigenic state[50]. Therefore, in vivo inhibition of AP-1 signaling via targeting p38 might be more effective in an immune competent model.
In a previous study, we identified canonical Wnt signaling as a mediator of PARPi resistance[13]. We were able to demonstrate that HGSOC cells with hyperactivated Wnt signaling have an increased capacity for DDR and that DDR in PARPi resistant cells can be attenuated following treatment with a Wnt inhibitor[13]. β-catenin dependent transcription has not been linked to DDR, however, Wnt signaling has been linked to increased activation of and transcription of AP-1 subunits. We do observe an increase in FOSL1, an AP-1 subunit, in cells with hyperactivated Wnt signaling and a decrease following Wnt inhibition, suggesting that Wnt signaling is impacting the transcription of AP-1 subunits in our HGSOC model[13]. Additionally, it has been shown that canonical Wnt signaling can contribute to increased phosphorylation of p38[51]. This suggests that it would be worthwhile to investigate the link between Wnt and AP-1 signaling in the context of PARPi resistance.
In conclusion, ATF6 and p38 mediated AP-1 signaling contributes to PARPi resistance, in part through regulation of DDR. Both inhibition of p38 and knockdown of ATF6 can resensitize HGSOC cells to olaparib and lead to increased DNA damage upon PARPi treatment (Fig. 6). Taken together, these data provide compelling rationale to further explore the connection between AP-1 signaling and PARPi resistance in the hopes of identifying novel therapeutic targets.
Figure 6: Increased ATF6 expression and p38-mediated activation contributes to PARPi Resistance.

We propose that increased ATF6 expression and p38-mediated activation occurs in PARP inhibitor resistant cell lines. This leads to increased AP-1 transcriptional activity which contributes to increased DNA damage repair and ultimately cancer cell survival.
Limitations of the Study
We show that ATF6 and p38 signaling both impact AP-1 transcriptional activity and that these proteins work together to promote DNA damage repair. However, we have not shown direct phosphorylation of ATF6 by p38 in our models. Future studies should confirm this interaction and determine which phosphorylation site on ATF6 is driving the observed phenotypes. Additionally, we only interrogated the role of p38 in PARPi resistance using a single p38 inhibitor. Future studies should utilize different inhibitors as well as genetic modulation of p38 in order to account for any off target effects of PH-797804.
Supplementary Material
ACKNOWLEDGMENTS:
We acknowledge philanthropic contributions from Kay L. Dunton Endowed Memorial Professorship In Ovarian Cancer Research, the McClintock-Addlesperger Family, Karen M. Jennison, Don and Arlene Mohler Johnson Family, Michael Intagliata, Duane and Denise Suess, Mary Normandin, and Donald Engelstad. This work was supported by the Foundation for Women’s Cancer: The St. Louis Ovarian Cancer Awareness and Caring Together Research Grant for Ovarian Cancer (B Sanders). This work was supported by The Department of Defense (B Bitler, OC170228, OC200302, OC200225), The American Cancer Society (B Bitler, RSG-19–129-01-DDC), NIH/NCI (B Bitler, R37CA261987; E Chuong, 1R35GM128822), Ovarian Cancer Research Alliance (B Bitler), and CCTSI TL1 (A McMellen, TL1TR002533). The University of Colorado Cancer Center Support Grant (P30CA046934). We acknowledge support from the University of Colorado Cancer Center and the Cancer Biology Graduate Program. Thank you to Dr. Phillip Owens for use of equipment and Dr. Matthew Sikora for project guidance.
Footnotes
Conflict of Interests: B Bitler receives grant money from the Department of Defense; the National Institute of Health, American Cancer Society, and Ovarian Cancer Research Alliance. BGB unrelated sponsored research: Onconic Therapeutics. There is no competing interest declared by the authors.
References
- 1.Siegel RL, Miller KD, and Jemal A, Cancer statistics, 2020. CA Cancer J Clin, 2020. 70(1): p. 7–30. [DOI] [PubMed] [Google Scholar]
- 2.Ledermann JA, Drew Y, and Kristeleit RS, Homologous recombination deficiency and ovarian cancer. Eur J Cancer, 2016. 60: p. 49–58. [DOI] [PubMed] [Google Scholar]
- 3.Labidi-Galy SI, Papp E, Hallberg D, Niknafs N, Adleff V, Noe M, et al. , High grade serous ovarian carcinomas originate in the fallopian tube. Nat Commun, 2017. 8(1): p. 1093. [DOI] [PMC free article] [PubMed] [Google Scholar]
- 4.Bitler BG, Watson ZL, Wheeler LJ, and Behbakht K, PARP inhibitors: Clinical utility and possibilities of overcoming resistance. Gynecol Oncol, 2017. 147(3): p. 695–704. [DOI] [PMC free article] [PubMed] [Google Scholar]
- 5.Domchek SM, Aghajanian C, Shapira-Frommer R, Schmutzler RK, Audeh MW, Friedlander M, et al. , Efficacy and safety of olaparib monotherapy in germline BRCA1/2 mutation carriers with advanced ovarian cancer and three or more lines of prior therapy. Gynecol Oncol, 2016. 140(2): p. 199–203. [DOI] [PMC free article] [PubMed] [Google Scholar]
- 6.Farmer H, McCabe N, Lord CJ, Tutt AN, Johnson DA, Richardson TB, et al. , Targeting the DNA repair defect in BRCA mutant cells as a therapeutic strategy. Nature, 2005. 434(7035): p. 917–21. [DOI] [PubMed] [Google Scholar]
- 7.McCabe N, Lord CJ, Tutt AN, Martin NM, Smith GC, and Ashworth A, BRCA2-deficient CAPAN-1 cells are extremely sensitive to the inhibition of Poly (ADP-Ribose) polymerase: an issue of potency. Cancer Biol Ther, 2005. 4(9): p. 934–6. [DOI] [PubMed] [Google Scholar]
- 8.Mirza MR, Monk BJ, Herrstedt J, Oza AM, Mahner S, Redondo A, et al. , Niraparib Maintenance Therapy in Platinum-Sensitive, Recurrent Ovarian Cancer. N Engl J Med, 2016. 375(22): p. 2154–2164. [DOI] [PubMed] [Google Scholar]
- 9.Oza AM, Matulonis UA, Malander S, Hudgens S, Sehouli J, Del Campo JM, et al. , Quality of life in patients with recurrent ovarian cancer treated with niraparib versus placebo (ENGOT-OV16/NOVA): results from a double-blind, phase 3, randomised controlled trial. Lancet Oncol, 2018. 19(8): p. 1117–1125. [DOI] [PubMed] [Google Scholar]
- 10.Sonnenblick A, de Azambuja E, Azim HA Jr., and Piccart M, An update on PARP inhibitors--moving to the adjuvant setting. Nat Rev Clin Oncol, 2015. 12(1): p. 27–41. [DOI] [PubMed] [Google Scholar]
- 11.Dziadkowiec KN, Gasiorowska E, Nowak-Markwitz E, and Jankowska A, PARP inhibitors: review of mechanisms of action and BRCA1/2 mutation targeting. Prz Menopauzalny, 2016. 15(4): p. 215–219. [DOI] [PMC free article] [PubMed] [Google Scholar]
- 12.Cancer Genome Atlas Research, N., Integrated genomic analyses of ovarian carcinoma. Nature, 2011. 474(7353): p. 609–15. [DOI] [PMC free article] [PubMed] [Google Scholar]
- 13.Yamamoto TM, McMellen A, Watson ZL, Aguilera J, Ferguson R, Nurmemmedov E, et al. , Activation of Wnt signaling promotes olaparib resistant ovarian cancer. Mol Carcinog, 2019. 58(10): p. 1770–1782. [DOI] [PMC free article] [PubMed] [Google Scholar]
- 14.Karin M, Liu Z, and Zandi E, AP-1 function and regulation. Curr Opin Cell Biol, 1997. 9(2): p. 240–6. [DOI] [PubMed] [Google Scholar]
- 15.Hess J, Angel P, and Schorpp-Kistner M, AP-1 subunits: quarrel and harmony among siblings. J Cell Sci, 2004. 117(Pt 25): p. 5965–73. [DOI] [PubMed] [Google Scholar]
- 16.Kappelmann M, Bosserhoff A, and Kuphal S, AP-1/c-Jun transcription factors: regulation and function in malignant melanoma. Eur J Cell Biol, 2014. 93(1–2): p. 76–81. [DOI] [PubMed] [Google Scholar]
- 17.Shaulian E and Karin M, AP-1 as a regulator of cell life and death. Nat Cell Biol, 2002. 4(5): p. E131–6. [DOI] [PubMed] [Google Scholar]
- 18.Shaulian E and Karin M, AP-1 in cell proliferation and survival. Oncogene, 2001. 20(19): p. 2390–400. [DOI] [PubMed] [Google Scholar]
- 19.Christmann M and Kaina B, Transcriptional regulation of human DNA repair genes following genotoxic stress: trigger mechanisms, inducible responses and genotoxic adaptation. Nucleic Acids Res, 2013. 41(18): p. 8403–20. [DOI] [PMC free article] [PubMed] [Google Scholar]
- 20.Ye N, Ding Y, Wild C, Shen Q, and Zhou J, Small molecule inhibitors targeting activator protein 1 (AP-1). J Med Chem, 2014. 57(16): p. 6930–48. [DOI] [PMC free article] [PubMed] [Google Scholar]
- 21.Hirose Y, Katayama M, Stokoe D, Haas-Kogan DA, Berger MS, and Pieper RO, The p38 mitogen-activated protein kinase pathway links the DNA mismatch repair system to the G2 checkpoint and to resistance to chemotherapeutic DNA-methylating agents. Mol Cell Biol, 2003. 23(22): p. 8306–15. [DOI] [PMC free article] [PubMed] [Google Scholar]
- 22.Wang QE, Han C, Zhao R, Wani G, Zhu Q, Gong L, et al. , p38 MAPK- and Akt-mediated p300 phosphorylation regulates its degradation to facilitate nucleotide excision repair. Nucleic Acids Res, 2013. 41(3): p. 1722–33. [DOI] [PMC free article] [PubMed] [Google Scholar]
- 23.Bulavin DV, Higashimoto Y, Popoff IJ, Gaarde WA, Basrur V, Potapova O, et al. , Initiation of a G2/M checkpoint after ultraviolet radiation requires p38 kinase. Nature, 2001. 411(6833): p. 102–7. [DOI] [PubMed] [Google Scholar]
- 24.Schewe DM and Aguirre-Ghiso JA, ATF6alpha-Rheb-mTOR signaling promotes survival of dormant tumor cells in vivo. Proc Natl Acad Sci U S A, 2008. 105(30): p. 10519–24. [DOI] [PMC free article] [PubMed] [Google Scholar]
- 25.Kim H, Xu H, George E, Hallberg D, Kumar S, Jagannathan V, et al. , Combining PARP with ATR inhibition overcomes PARP inhibitor and platinum resistance in ovarian cancer models. Nat Commun, 2020. 11(1): p. 3726. [DOI] [PMC free article] [PubMed] [Google Scholar]
- 26.Vasanwala FH, Kusam S, Toney LM, and Dent AL, Repression of AP-1 function: a mechanism for the regulation of Blimp-1 expression and B lymphocyte differentiation by the B cell lymphoma-6 protooncogene. J Immunol, 2002. 169(4): p. 1922–9. [DOI] [PubMed] [Google Scholar]
- 27.Watson ZL, Yamamoto TM, McMellen A, Kim H, Hughes CJ, Wheeler LJ, et al. , Histone methyltransferases EHMT1 and EHMT2 (GLP/G9A) maintain PARP inhibitor resistance in high-grade serous ovarian carcinoma. Clin Epigenetics, 2019. 11(1): p. 165. [DOI] [PMC free article] [PubMed] [Google Scholar]
- 28.Bitler BG, Nicodemus JP, Li H, Cai Q, Wu H, Hua X, et al. , Wnt5a suppresses epithelial ovarian cancer by promoting cellular senescence. Cancer Res, 2011. 71(19): p. 6184–94. [DOI] [PMC free article] [PubMed] [Google Scholar]
- 29.Kim D, Langmead B, and Salzberg SL, HISAT: a fast spliced aligner with low memory requirements. Nat Methods, 2015. 12(4): p. 357–60. [DOI] [PMC free article] [PubMed] [Google Scholar]
- 30.Torre D, Lachmann A, and Ma’ayan A, BioJupies: Automated Generation of Interactive Notebooks for RNA-Seq Data Analysis in the Cloud. Cell Syst, 2018. 7(5): p. 556–561 e3. [DOI] [PMC free article] [PubMed] [Google Scholar]
- 31.Sanders BE, Yamamoto TM, McMellen A, Woodruff ER, Berning A, Post MD, et al. , Targeting DUSP Activity as a Treatment for High-Grade Serous Ovarian Carcinoma. Mol Cancer Ther, 2022. 21(8): p. 1285–1295. [DOI] [PMC free article] [PubMed] [Google Scholar]
- 32.Sawyer BT, Qamar L, Yamamoto TM, McMellen A, Watson ZL, Richer JK, et al. , Targeting Fatty Acid Oxidation to Promote Anoikis and Inhibit Ovarian Cancer Progression. Mol Cancer Res, 2020. [DOI] [PMC free article] [PubMed] [Google Scholar]
- 33.Park SJ, Yoon BH, Kim SK, and Kim SY, GENT2: an updated gene expression database for normal and tumor tissues. BMC Med Genomics, 2019. 12(Suppl 5): p. 101. [DOI] [PMC free article] [PubMed] [Google Scholar]
- 34.Gyorffy B, Lanczky A, and Szallasi Z, Implementing an online tool for genome-wide validation of survival-associated biomarkers in ovarian-cancer using microarray data from 1287 patients. Endocr Relat Cancer, 2012. 19(2): p. 197–208. [DOI] [PubMed] [Google Scholar]
- 35.Coscia F, Watters KM, Curtis M, Eckert MA, Chiang CY, Tyanova S, et al. , Integrative proteomic profiling of ovarian cancer cell lines reveals precursor cell associated proteins and functional status. Nat Commun, 2016. 7: p. 12645. [DOI] [PMC free article] [PubMed] [Google Scholar]
- 36.Domcke S, Sinha R, Levine DA, Sander C, and Schultz N, Evaluating cell lines as tumour models by comparison of genomic profiles. Nat Commun, 2013. 4: p. 2126. [DOI] [PMC free article] [PubMed] [Google Scholar]
- 37.DelloRusso C, Welcsh PL, Wang W, Garcia RL, King MC, and Swisher EM, Functional characterization of a novel BRCA1-null ovarian cancer cell line in response to ionizing radiation. Mol Cancer Res, 2007. 5(1): p. 35–45. [DOI] [PubMed] [Google Scholar]
- 38.Lee J and Ozcan U, Unfolded protein response signaling and metabolic diseases. J Biol Chem, 2014. 289(3): p. 1203–11. [DOI] [PMC free article] [PubMed] [Google Scholar]
- 39.Chakrabarti A, Chen AW, and Varner JD, A review of the mammalian unfolded protein response. Biotechnol Bioeng, 2011. 108(12): p. 2777–93. [DOI] [PMC free article] [PubMed] [Google Scholar]
- 40.Hai T, The ATF Transcription Factors in Cellular Adaptive Responses 2006. [Google Scholar]
- 41.Qian J, Olbrecht S, Boeckx B, Vos H, Laoui D, Etlioglu E, et al. , A pan-cancer blueprint of the heterogeneous tumor microenvironment revealed by single-cell profiling. Cell Res, 2020. 30(9): p. 745–762. [DOI] [PMC free article] [PubMed] [Google Scholar]
- 42.Manke IA, Nguyen A, Lim D, Stewart MQ, Elia AE, and Yaffe MB, MAPKAP kinase-2 is a cell cycle checkpoint kinase that regulates the G2/M transition and S phase progression in response to UV irradiation. Mol Cell, 2005. 17(1): p. 37–48. [DOI] [PubMed] [Google Scholar]
- 43.Reinhardt HC, Hasskamp P, Schmedding I, Morandell S, van Vugt MA, Wang X, et al. , DNA damage activates a spatially distinct late cytoplasmic cell-cycle checkpoint network controlled by MK2-mediated RNA stabilization. Mol Cell, 2010. 40(1): p. 34–49. [DOI] [PMC free article] [PubMed] [Google Scholar]
- 44.Raman M, Earnest S, Zhang K, Zhao Y, and Cobb MH, TAO kinases mediate activation of p38 in response to DNA damage. EMBO J, 2007. 26(8): p. 2005–14. [DOI] [PMC free article] [PubMed] [Google Scholar]
- 45.Im JS and Lee JK, ATR-dependent activation of p38 MAP kinase is responsible for apoptotic cell death in cells depleted of Cdc7. J Biol Chem, 2008. 283(37): p. 25171–7. [DOI] [PubMed] [Google Scholar]
- 46.Griss J, Viteri G, Sidiropoulos K, Nguyen V, Fabregat A, and Hermjakob H, ReactomeGSA - Efficient Multi-Omics Comparative Pathway Analysis. Mol Cell Proteomics, 2020. 19(12): p. 2115–2125. [DOI] [PMC free article] [PubMed] [Google Scholar]
- 47.Bankhead P, Loughrey MB, Fernandez JA, Dombrowski Y, McArt DG, Dunne PD, et al. , QuPath: Open source software for digital pathology image analysis. Sci Rep, 2017. 7(1): p. 16878. [DOI] [PMC free article] [PubMed] [Google Scholar]
- 48.Song D, He H, Sinha I, Hases L, Yan F, Archer A, et al. , Blocking Fra-1 sensitizes triple-negative breast cancer to PARP inhibitor. Cancer Lett, 2021. 506: p. 23–34. [DOI] [PubMed] [Google Scholar]
- 49.Jiao S, Xia W, Yamaguchi H, Wei Y, Chen MK, Hsu JM, et al. , PARP Inhibitor Upregulates PD-L1 Expression and Enhances Cancer-Associated Immunosuppression. Clin Cancer Res, 2017. 23(14): p. 3711–3720. [DOI] [PMC free article] [PubMed] [Google Scholar]
- 50.Mehta AK, Cheney EM, Hartl CA, Pantelidou C, Oliwa M, Castrillon JA, et al. , Targeting immunosuppressive macrophages overcomes PARP inhibitor resistance in BRCA1-associated triple-negative breast cancer. Nat Cancer, 2021. 2(1): p. 66–82. [DOI] [PMC free article] [PubMed] [Google Scholar]
- 51.Bikkavilli RK, Feigin ME, and Malbon CC, p38 mitogen-activated protein kinase regulates canonical Wnt-beta-catenin signaling by inactivation of GSK3beta. J Cell Sci, 2008. 121(Pt 21): p. 3598–607. [DOI] [PubMed] [Google Scholar]
Associated Data
This section collects any data citations, data availability statements, or supplementary materials included in this article.
Supplementary Materials
Data Availability Statement
Data are available upon request from the corresponding author.