Abstract
Background
The registration committee for esophageal cancer in the Japan Esophageal Society (JES) has collected the patients' characteristics, treatment, and outcomes of patients who underwent any treatment during 2015 in Japan.
Methods
We analyzed patients' data who had visited the participating hospitals in 2015. We collected the data using the National Clinical Database with a web-based data collection system. We used the Japanese Classification of Esophageal Cancer 10th edition by JES and the TNM classification by the Union of International Cancer Control (UICC) for cancer staging.
Results
A total of 9368 cases were registered from 355 institutions in Japan. Squamous cell carcinoma and adenocarcinoma accounted for 86.7% and 7.4%, respectively. The 5-year survival rates of patients treated by endoscopic resection, concurrent chemoradiotherapy, radiotherapy alone, and esophagectomy were 87.2%, 33.5%, 24.2%, and 59.9%, respectively. Esophagectomy was performed in 5172 cases. Minimally invasive approaches were selected for 60.6%, and 54.4% underwent thoracoscopic esophagectomy. The operative mortality (within 30 days after surgery) was 0.79% and the hospital mortality was 2.3%. The survival curves showed an excellent discriminatory ability both in the clinical and pathologic stages by the JES system. The survival of pStage IV was better than IIIC in the UICC system because pStage IV included the patients with supraclavicular lymph node metastasis (M1 LYM).
Conclusion
We hope this report improves all aspects of diagnosing and treating esophageal cancer in Japan.
Keywords: Esophageal cancer, Esophagectomy, Endoscopic resection, Chemotherapy, Chemoradiotherapy, Cancer registry
Preface 2015
We sincerely appreciate the outstanding contributions of many physicians in the registry of esophageal cancer cases. The Comprehensive Registry of Esophageal Cancer in Japan, 2015, was published here. In 2019, the data collection method was changed from an electronic submission to a web-based data collection using the National Clinical Database (NCD). Personal information was replaced with individual management codes inside each institute, and the NCD collected only anonymized information. The registry complies with the Act for the Protection of Personal Information.
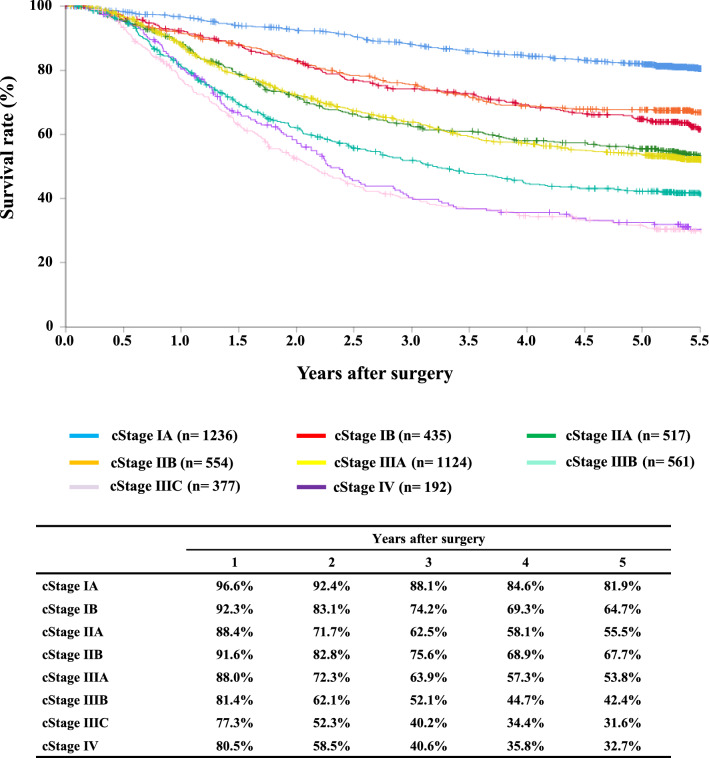
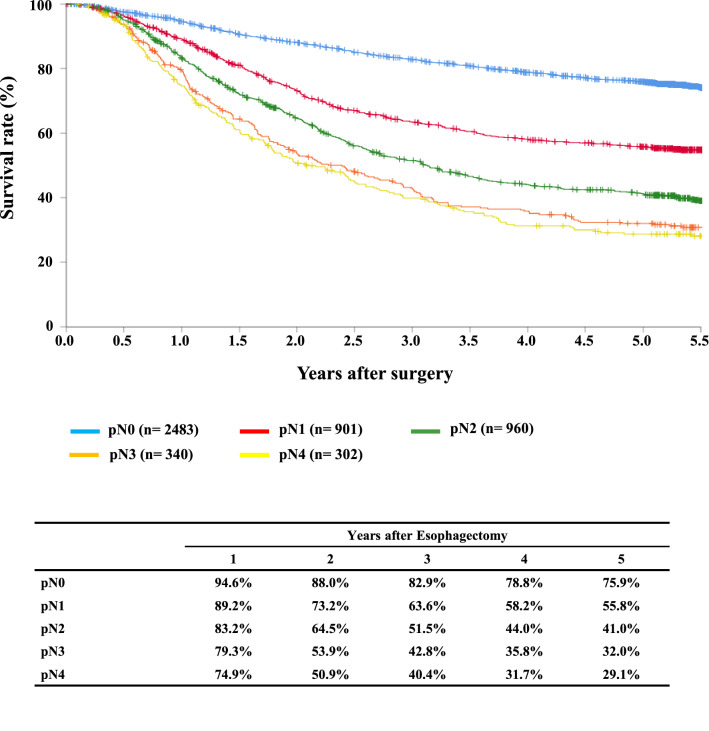
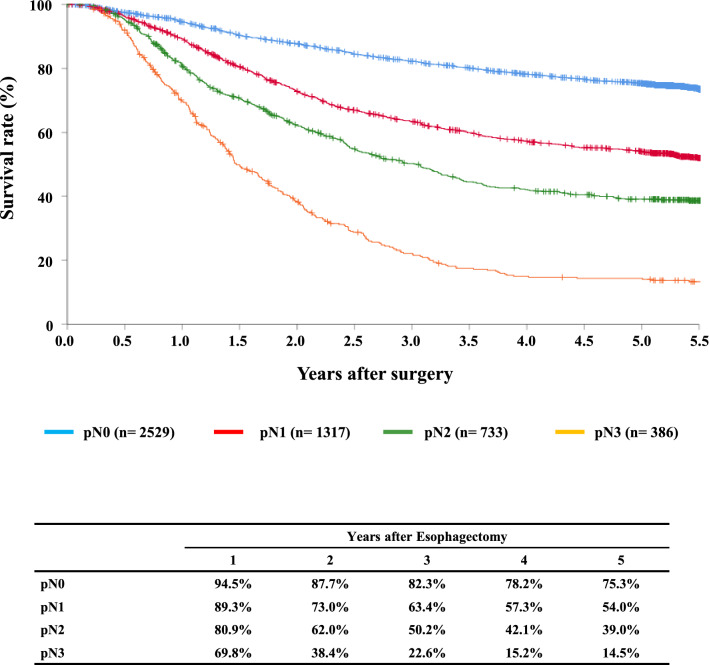
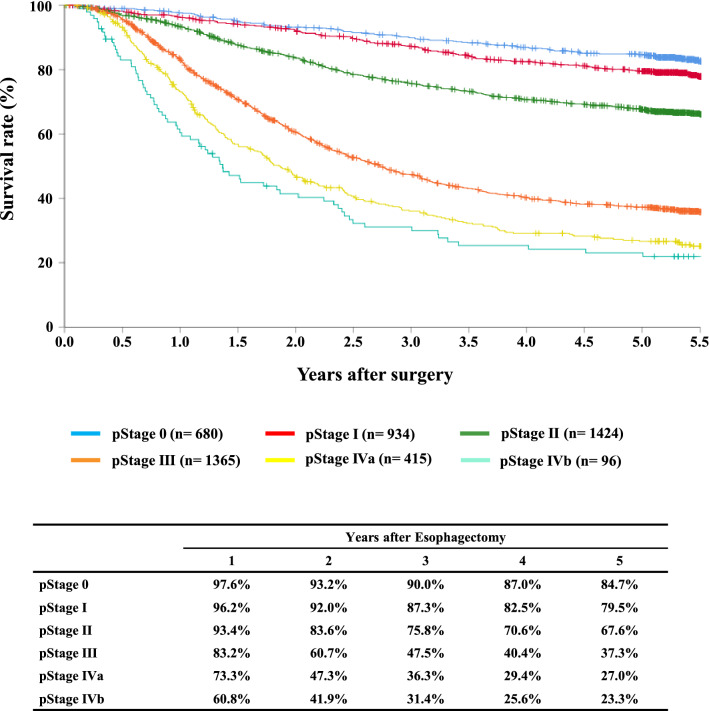
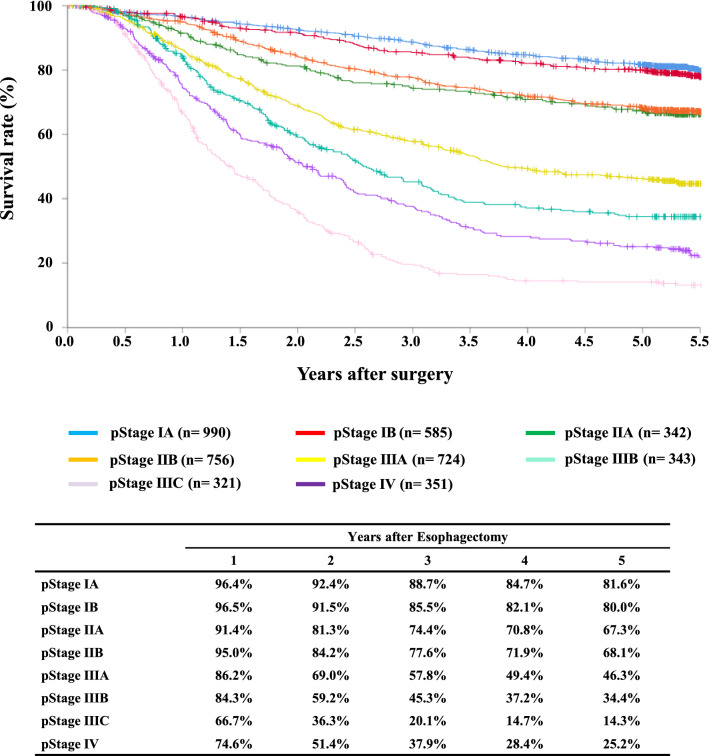
We briefly summarized the Comprehensive Registry of Esophageal Cancer in Japan, 2015. According to the subject year, we used the Japanese Classification of Esophageal Cancer 10th by the Japan Esophageal Society (JES) [1] and the Union of International Cancer Control (UICC) TNM Classification 7th [2] for cancer staging. A total of 9368 cases were registered from 355 institutions in Japan. Tumor locations were cervical in 4.6%, upper thoracic in 12.1%, middle thoracic in 46.0%, lower thoracic in 27.9%, and esophagogastric junction in 8.5%. Superficial carcinomas (Tis, T1a, T1b) were 38.2%. As for the histologic type of biopsy specimens, squamous cell carcinoma and adenocarcinoma accounted for 86.7% and 7.4%, respectively. Regarding clinical results, the 5-year survival rates of patients treated using endoscopic resection, concurrent chemoradiotherapy, radiotherapy alone, and esophagectomy were 87.2%, 33.5%, 24.2%, and 59.9%, respectively. The endoscopic submucosal dissection accounted for 92.9% of endoscopic resection. Esophagectomy was performed in 5172 cases. Minimally invasive approaches were selected for 60.6%, and 54.4% underwent thoracoscopic esophagectomy. The operative mortality (within 30 days after surgery) was 0.79%, and the hospital mortality was 2.3%. The N-grade significantly differed between the JES and the UICC systems; based on the location of metastatic lymph nodes in the JES system and the number of metastatic nodes in the UICC system. However, the N-grades effectively estimated the survival in both the JES and the UICC systems. The survival curves showed an excellent discriminatory ability both in the clinical and pathologic stages by the JES system. In contrast, in the UICC system, the survival of cStage IIB was identical to IB and better than IIA, and the survival curves were similar between cStage IIIC and IV. Also, the survival curve of pStage IIB was superior to IIA, and the survival of pStage IV was better than IIIC. pStage IV in the UICC system included the patients with supraclavicular lymph node metastasis (M1 LYM), which is possibly the reason for the better prognosis of pStage IV than IIIC.
We hope that this Comprehensive Registry of Esophageal Cancer in Japan 2015 will help improve all aspects of the diagnosis and treatment of esophageal cancer in Japan.
Contents
I. Clinical factors of esophageal cancer patients treated in 2015
1. Institution-registered cases in 2015
2. Patient background
Table 1 Age and gender
Table 1.
Age and gender
| Age | Male | Female | Cases (%) |
|---|---|---|---|
| ≤ 29 | 14 | 5 | 19 (0.2%) |
| 30–39 | 17 | 11 | 28 (0.3%) |
| 40–49 | 171 | 93 | 264 (2.8%) |
| 50–59 | 946 | 227 | 1173 (12.5%) |
| 60–69 | 2928 | 559 | 3487 (37.2%) |
| 70–79 | 2954 | 502 | 3456 (36.9%) |
| 80–89 | 713 | 185 | 898 (9.6%) |
| 90 ≤ | 25 | 18 | 43 (0.5%) |
| Total | 7768 | 1600 | 9368 |
Table 2 Performed treatment
Table 2.
Performed treatment
| Treatments | Cases (%) |
|---|---|
| Surgery | 5354 (57.2%) |
| Esophagectomy | 5172 (55.2%) |
| Palliative surgery | 182 (1.9%) |
| Chemotherapy and/or Radiotherapy | 5119 (54.6%) |
| Chemoradiotherapy | 1207 (12.9%) |
| Radiotherapy alone | 330 (3.5%) |
| Chemotherapy alone | 450 (4.8%) |
| Palliative radiation | 112 (1.2%) |
| Others | 3020 (32.2%) |
| Endoscopic treatment | 1709 (18.2%) |
Table 3 Tumor location
Table 3.
Tumor location
| Location of tumor | Endoscopic treatment (%) | Surgery | Chemotherapy and/or radiotherapy | Total (%) | |||||
|---|---|---|---|---|---|---|---|---|---|
| Esophagectomy (%) | Palliative surgery (%) | CRT (%) | RT alone (%) | Chemotherapy alone (%) | Palliative radiotherapy (%) | Others (%) | |||
| Cervical | 39 (2.3%) | 155 (3.0%) | 11 (6.0%) | 147 (12.2%) | 32 (9.7%) | 22 (4.9%) | 6 (5.4%) | 107 (3.5%) | 435 (4.6%) |
| Upper thoracic | 171 (10.0%) | 581 (11.2%) | 24 (13.2%) | 220 (18.2%) | 56 (17.0%) | 39 (8.7%) | 9 (8.0%) | 373 (12.4%) | 1131 (12.1%) |
| Middle thoracic | 903 (52.8%) | 2305 (44.6%) | 99 (54.4%) | 555 (46.0%) | 142 (43.0%) | 177 (39.3%) | 57 (50.9%) | 1364 (45.2%) | 4308 (46.0%) |
| Lower thoracic | 430 (25.2%) | 1585 (30.6%) | 39 (21.4%) | 252 (20.9%) | 76 (23.0%) | 171 (38.0%) | 33 (29.5%) | 946 (31.3%) | 2609 (27.9%) |
| EG | 110 (6.4%) | 393 (7.6%) | 2 (1.1%) | 20 (1.7%) | 8 (2.4%) | 18 (4.0%) | 6 (5.4%) | 166 (5.5%) | 562 (6.0%) |
| E = G | 30 (1.8%) | 75 (1.5%) | 3 (1.6%) | 3 (0.2%) | 0 (0.0%) | 5 (1.1%) | 1 (0.9%) | 26 (0.9%) | 118 (1.3%) |
| GE | 6 (0.4%) | 71 (1.4%) | 3 (1.6%) | 3 (0.2%) | 1 (0.3%) | 10 (2.2%) | 0 (0.0%) | 34 (1.1%) | 110 (1.2%) |
| unknown | 20 (1.2%) | 7 (0.1%) | 1 (0.5%) | 7 (0.6%) | 15 (4.5%) | 8 (1.8%) | 0 (0.0%) | 4 (0.1%) | 95 (1.0%) |
| Total | 1709 | 5172 | 182 | 1207 | 330 | 450 | 112 | 3020 | 9368 |
E esophageal, G gastric
Table 4 Histologic types of biopsy specimens
Table 4.
Histologic type of biopsy specimens
| Histologic types | Endoscopic treatment (%) | Surgery | Chemotherapy and/or radiotherapy | Total (%) | |||||
|---|---|---|---|---|---|---|---|---|---|
| Esophagectomy (%) | Palliative surgery (%) | CRT (%) | RT alone (%) | Chemotherapy alone (%) | Palliative RT (%) | Others (%) | |||
| Squamous cell carcinoma | 1405 (82.2%) | 4524 (87.5%) | 165 (90.7%) | 1152 (95.4%) | 307 (93.0%) | 360 (80.0%) | 103 (92.0%) | 2730 (90.4%) | 8123 (86.7%) |
| Squamous cell carcinoma | 1065 (62.3%) | 2486 (48.1%) | 114 (62.6%) | 764 (63.3%) | 205 (62.1%) | 221 (49.1%) | 59 (52.7%) | 1566 (51.9%) | 5041 (53.8%) |
| Well differentiated | 136 (8.0%) | 421 (8.1%) | 11 (6.0%) | 60 (5.0%) | 26 (7.9%) | 32 (7.1%) | 5 (4.5%) | 227 (7.5%) | 687 (7.3%) |
| Moderately differentiated | 179 (10.5%) | 1231 (23.8%) | 28 (15.4%) | 223 (18.5%) | 53 (16.1%) | 69 (15.3%) | 28 (25.0%) | 710 (23.5%) | 1783 (19.0%) |
| Poorly differentiated | 25 (1.5%) | 386 (7.5%) | 12 (6.6%) | 105 (8.7%) | 23 (7.0%) | 38 (8.4%) | 11 (9.8%) | 227 (7.5%) | 612 (6.5%) |
| Adenocarcinoma | 56 (3.3%) | 358 (6.9%) | 8 (4.4%) | 17 (1.4%) | 3 (0.9%) | 41 (9.1%) | 2 (1.8%) | 190 (6.3%) | 507 (5.4%) |
| Barrett's carcinoma | 56 (3.3%) | 116 (2.2%) | 1 (0.5%) | 0 (0.0%) | 1 (0.3%) | 10 (2.2%) | 2 (1.8%) | 17 (0.6%) | 187 (2.0%) |
| Adenosquamous carcinoma | 3 (0.2%) | 16 (0.3%) | 0 (0.0%) | 3 (0.2%) | 1 (0.3%) | 3 (0.7%) | 0 (0.0%) | 10 (0.3%) | 23 (0.2%) |
| Mucoepidermoid carcinoma | 0 (0.0%) | 3 (0.1%) | 0 (0.0%) | 0 (0.0%) | 0 (0.0%) | 0 (0.0%) | 0 (0.0%) | 3 (0.1%) | 4 (0.0%) |
| Basaloid carcinoma | 4 (0.2%) | 43 (0.8%) | 1 (0.5%) | 5 (0.4%) | 0 (0.0%) | 4 (0.9%) | 0 (0.0%) | 15 (0.5%) | 56 (0.6%) |
| Neuroendocrine tumor | 1 (0.1%) | 0 (0.0%) | 0 (0.0%) | 0 (0.0%) | 0 (0.0%) | 2 (0.4%) | 0 (0.0%) | 0 (0.0%) | 3 (0.0%) |
| Neuroendocrine carcinoma | 1 (0.1%) | 19 (0.4%) | 1 (0.5%) | 9 (0.7%) | 1 (0.3%) | 10 (2.2%) | 1 (0.9%) | 16 (0.5%) | 47 (0.5%) |
| Undifferentiated carcinoma | 1 (0.1%) | 5 (0.1%) | 0 (0.0%) | 3 (0.2%) | 0 (0.0%) | 1 (0.2%) | 0 (0.0%) | 3 (0.1%) | 10 (0.1%) |
| Malignant melanoma | 2 (0.1%) | 20 (0.4%) | 0 (0.0%) | 0 (0.0%) | 0 (0.0%) | 3 (0.7%) | 0 (0.0%) | 5 (0.2%) | 27 (0.3%) |
| Carcinosarcoma | 0 (0.0%) | 15 (0.3%) | 1 (0.5%) | 0 (0.0%) | 0 (0.0%) | 0 (0.0%) | 1 (0.9%) | 5 (0.2%) | 18 (0.2%) |
| GIST | 1 (0.1%) | 4 (0.1%) | 0 (0.0%) | 0 (0.0%) | 0 (0.0%) | 0 (0.0%) | 0 (0.0%) | 1 (0.0%) | 8 (0.1%) |
| Adenoid cyctic carcinoma | 1 (0.1%) | 4 (0.1%) | 0 (0.0%) | 1 (0.1%) | 0 (0.0%) | 0 (0.0%) | 0 (0.0%) | 1 (0.0%) | 5 (0.1%) |
| Nonepithelial tumors | 2 (0.1%) | 3 (0.1%) | 0 (0.0%) | 0 (0.0%) | 0 (0.0%) | 0 (0.0%) | 0 (0.0%) | 1 (0.0%) | 6 (0.1%) |
| Other epithelial tumors | 23 (1.3%) | 6 (0.1%) | 0 (0.0%) | 1 (0.1%) | 0 (0.0%) | 2 (0.4%) | 0 (0.0%) | 3 (0.1%) | 34 (0.4%) |
| Other tumors | 50 (2.9%) | 7 (0.1%) | 0 (0.0%) | 2 (0.2%) | 3 (0.9%) | 2 (0.4%) | 1 (0.9%) | 3 (0.1%) | 77 (0.8%) |
| Unknown | 103 (6.0%) | 29 (0.6%) | 5 (2.7%) | 14 (1.2%) | 14 (4.2%) | 12 (2.7%) | 2 (1.8%) | 17 (0.6%) | 233 (2.5%) |
| Total | 1709 | 5172 | 182 | 1207 | 330 | 450 | 112 | 3020 | 9368 |
GIST gastrointestinal stromal tumor
Table 5 Depth of tumor invasion, cT (UICC TNM 7th)
Table 5.
Depth of tumor invasion, cT (UICC TNM 7th)
| Clinical T | Endoscopic treatment (%) | Surgery | Chemotherapy and/or radiotherapy | Total (%) | |||||
|---|---|---|---|---|---|---|---|---|---|
| Esophagectomy (%) | Palliative surgery (%) | CRT (%) | RT alone (%) | Chemotherapy alone (%) | Palliative RT (%) | Others (%) | |||
| cT0 | 12 (0.7%) | 4 (0.1%) | 0 (0.0%) | 0 (0.0%) | 0 (0.0%) | 0 (0.0%) | 1 (0.9%) | 0 (0.0%) | 17 (0.2%) |
| cT1a | 1332 (77.9%) | 240 (4.6%) | 1 (0.5%) | 46 (3.8%) | 16 (4.8%) | 8 (1.8%) | 4 (3.6%) | 70 (2.3%) | 1698 (18.1%) |
| cT1b | 242 (14.2%) | 1392 (26.9%) | 5 (2.7%) | 177 (14.7%) | 66 (20.0%) | 31 (6.9%) | 4 (3.6%) | 362 (12.0%) | 1880 (20.1%) |
| cT2 | 20 (1.2%) | 857 (16.6%) | 6 (3.3%) | 107 (8.9%) | 48 (14.5%) | 50 (11.1%) | 14 (12.5%) | 525 (17.4%) | 1123 (12.0%) |
| cT3 | 54 (3.2%) | 2315 (44.8%) | 78 (42.9%) | 435 (36.0%) | 114 (34.5%) | 217 (48.2%) | 62 (55.4%) | 1702 (56.4%) | 3294 (35.2%) |
| cT4a | 9 (0.5%) | 174 (3.4%) | 15 (8.2%) | 120 (9.9%) | 21 (6.4%) | 44 (9.8%) | 2 (1.8%) | 126 (4.2%) | 411 (4.4%) |
| cT4b | 23 (1.3%) | 172 (3.3%) | 73 (40.1%) | 308 (25.5%) | 49 (14.8%) | 77 (17.1%) | 23 (20.5%) | 226 (7.5%) | 786 (8.4%) |
| cTX | 17 (1.0%) | 18 (0.3%) | 4 (2.2%) | 14 (1.2%) | 16 (4.8%) | 23 (5.1%) | 2 (1.8%) | 9 (0.3%) | 159 (1.7%) |
| Total | 1709 | 5172 | 182 | 1207 | 330 | 450 | 112 | 3020 | 9368 |
Table 6 Lymph node metastasis, cN (UICC TNM 7th)
Table 6.
Lymph node metastasis, cN (UICC TNM 7th)
| Clinical N | Endoscopic treatment (%) | Surgery | Chemotherapy and/or radiotherapy | Total (%) | |||||
|---|---|---|---|---|---|---|---|---|---|
| Esophagectomy (%) | Palliative surgery (%) | CRT (%) | RT alone (%) | Chemotherapy alone (%) | Palliative RT (%) | Others (%) | |||
| cN0 | 1612 (94.3%) | 2365 (45.7%) | 19 (10.4%) | 327 (27.1%) | 128 (38.8%) | 69 (15.3%) | 22 (19.6%) | 844 (27.9%) | 4621 (49.3%) |
| cN1 | 54 (3.2%) | 1752 (33.9%) | 57 (31.3%) | 389 (32.2%) | 119 (36.1%) | 139 (30.9%) | 30 (26.8%) | 1290 (42.7%) | 2602 (27.8%) |
| cN2 | 31 (1.8%) | 901 (17.4%) | 76 (41.8%) | 346 (28.7%) | 63 (19.1%) | 144 (32.0%) | 37 (33.0%) | 745 (24.7%) | 1642 (17.5%) |
| cN3 | 12 (0.7%) | 154 (3.0%) | 30 (16.5%) | 145 (12.0%) | 20 (6.1%) | 98 (21.8%) | 23 (20.5%) | 141 (4.7%) | 503 (5.4%) |
| cNX | 0 (0.0%) | 0 (0.0%) | 0 (0.0%) | 0 (0.0%) | 0 (0.0%) | 0 (0.0%) | 0 (0.0%) | 0 (0.0%) | 0 (0.0%) |
| Total | 1709 | 5172 | 182 | 1207 | 330 | 450 | 112 | 3020 | 9368 |
Table 7 Distant metastasis, cM (UICC TNM 7th)
Table 7.
Distant metastasis, cM (UICC TNM 7th)
| Clinical M | Endoscopic treatment (%) | Surgery | Chemotherapy and/or radiotherapy | Total (%) | |||||
|---|---|---|---|---|---|---|---|---|---|
| Esophagectomy (%) | Palliative surgery (%) | CRT (%) | RT alone (%) | Chemotherapy alone (%) | Palliative RT (%) | Others (%) | |||
| cM0 | 1680 (98.3%) | 4976 (96.2%) | 133 (73.1%) | 897 (74.3%) | 266 (80.6%) | 218 (48.4%) | 86 (76.8%) | 2814 (93.2%) | 8370 (89.3%) |
| cM1 | 29 (1.7%) | 196 (3.8%) | 49 (26.9%) | 310 (25.7%) | 64 (19.4%) | 232 (51.6%) | 26 (23.2%) | 206 (6.8%) | 998 (10.7%) |
| Total | 1709 | 5172 | 182 | 1207 | 330 | 450 | 112 | 3020 | 9368 |
Table 8 Clinical stage (UICC TNM 7th)
Table 8.
Clinical Stage (UICC TNM 7th)
| Clinical stage | Endoscopic treatment (%) | Surgery | Chemotherapy and/or radiotherapy | Total (%) | |||||
|---|---|---|---|---|---|---|---|---|---|
| Esophagectomy (%) | Palliative surgery (%) | CRT (%) | RT alone (%) | Chemotherapy alone (%) | Palliative RT (%) | Others (%) | |||
| Stage IA | 1557 (91.1%) | 1291 (25.0%) | 5 (2.7%) | 175 (14.5%) | 70 (21.2%) | 12 (2.7%) | 4 (3.6%) | 234 (7.7%) | 3126 (33.4%) |
| Stage IB | 10 (0.6%) | 448 (8.7%) | 3 (1.6%) | 36 (3.0%) | 15 (4.5%) | 17 (3.8%) | 8 (7.1%) | 235 (7.8%) | 548 (5.8%) |
| Stage IIA | 6 (0.4%) | 537 (10.4%) | 5 (2.7%) | 62 (5.1%) | 25 (7.6%) | 17 (3.8%) | 7 (6.3%) | 324 (10.7%) | 661 (7.1%) |
| Stage IIB | 19 (1.1%) | 568 (11.0%) | 2 (1.1%) | 63 (5.2%) | 31 (9.4%) | 22 (4.9%) | 3 (2.7%) | 353 (11.7%) | 715 (7.6%) |
| Stage IIIA | 21 (1.2%) | 1146 (22.2%) | 30 (16.5%) | 136 (11.3%) | 50 (15.2%) | 51 (11.3%) | 20 (17.9%) | 858 (28.4%) | 1454 (15.5%) |
| Stage IIIB | 9 (0.5%) | 575 (11.1%) | 20 (11.0%) | 96 (8.0%) | 18 (5.5%) | 31 (6.9%) | 16 (14.3%) | 434 (14.4%) | 758 (8.1%) |
| Stage IIIC | 30 (1.8%) | 391 (7.6%) | 68 (37.4%) | 322 (26.7%) | 49 (14.8%) | 61 (13.6%) | 26 (23.2%) | 370 (12.3%) | 992 (10.6%) |
| Stage IV | 29 (1.7%) | 196 (3.8%) | 49 (26.9%) | 310 (25.7%) | 64 (19.4%) | 232 (51.6%) | 26 (23.2%) | 206 (6.8%) | 998 (10.7%) |
| Unknown | 28 (1.6%) | 20 (0.4%) | 0 (0.0%) | 7 (0.6%) | 8 (2.4%) | 7 (1.6%) | 2 (1.8%) | 6 (0.2%) | 116 (1.2%) |
| Total | 1709 | 5172 | 182 | 1207 | 330 | 450 | 112 | 3020 | 9368 |
II. Results of endoscopically treated patients in 2015
Table 9 Details of endoscopic treatment for curative intent
Table 9.
Details of endoscopic treatment for curative intent
| Treatment details | Cases (%) |
|---|---|
| EMR | 114 (6.8%) |
| EMR + YAG laser | 1 (0.1%) |
| EMR + MCT or RFA | 0 (0.0%) |
| ESD | 1537 (91.2%) |
| ESD + EMR | 14 (0.8%) |
| ESD + PDT | 0 (0.0%) |
| ESD + YAG laser | 1 (0.1%) |
| PDT | 5 (0.3%) |
| YAG laser | 14 (0.8%) |
| Total | 1686 |
EMR endoscopic mucosal resection, PDT photodynamic therapy, YAG yttrium aluminum garnet, MCT microwave coagulation therapy, ESD endoscopic submucosal dissection
Table 10 Complications of EMR/ESD
Table 10.
Complications of EMR/ESD
| Complications of EMR/ESD | Cases (%) |
|---|---|
| None | 1599 (96.0%) |
| Perforation | 15 (0.9%) |
| Bleeding | 2 (0.1%) |
| Mediastinitis | 2 (0.1%) |
| Stenosis | 45 (2.7%) |
| Others | 0 (0.0%) |
| Unknown | 2 (0.1%) |
| Total | 1665 |
Table 11 Pathologic depth of tumor invasion of EMR/ESD specimens
Table 11.
Pathologic depth of tumor invasion of EMR/ESD specimens
| Pathological depth of tumor invasion (pT) | Cases (%) |
|---|---|
| pT0 | 34 (2.0%) |
| pT1a | 1315 (78.8%) |
| pT1b | 291 (17.4%) |
| pT2 | 6 (0.4%) |
| pT3 | 0 (0.0%) |
| pTX | 23 (1.4%) |
| Total | 1669 |
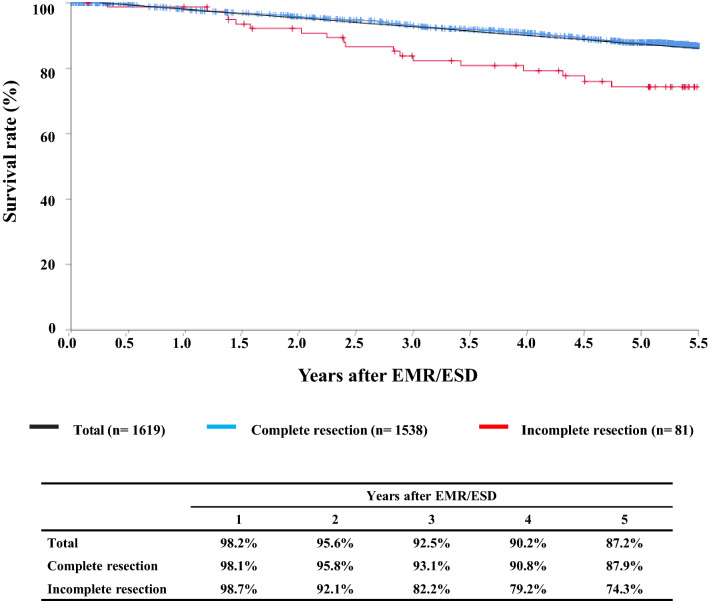
Figure 1 Survival of patients treated with EMR/ESD
Fig. 1.
Survival of patients treated with EMR/ESD
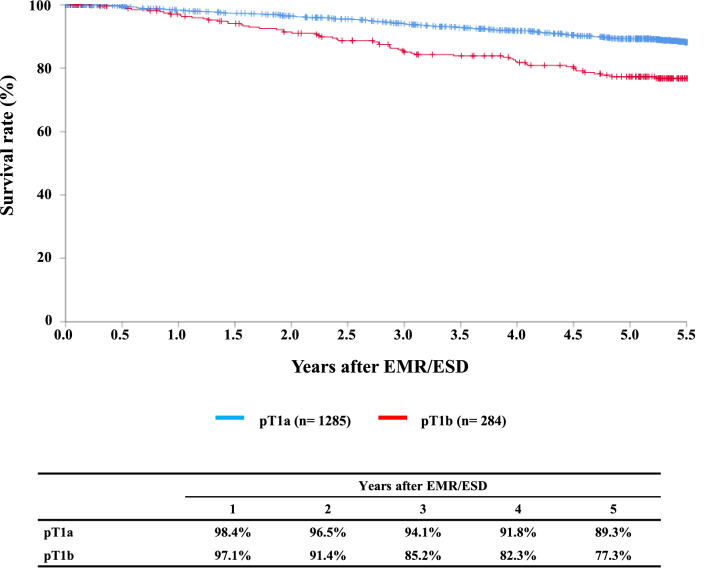
Figure 2 Survival of patients treated with EM/ESD according to the pathological depth of tumor invasion, pT (JES 10th)
Fig. 2.
Survival of patients treated with EM/ESD according to the pathological depth of tumor invasion, pT (JES 10th)
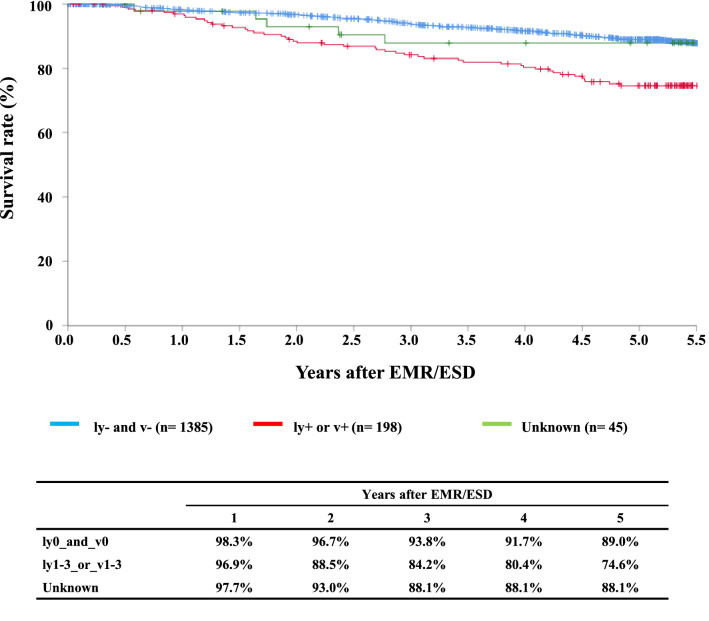
Figure 3 Survival of patients treated with EMR/ESD according to the lymphatic and venous invasion
Fig. 3.
Survival of patients treated with EMR/ESD according to the lymphatic and venous invasion
III. Results in patients treated with chemotherapy and/or radiotherapy in 2015
Table 12. Dose of irradiation (non-surgically treated cases)
Table 12.
Dose of irradiation (non-surgically treated cases)
| Dose of irradiation (Gy) | Definitive | Palliative (%) | Recurrence (%) | Others (%) | Total | |
|---|---|---|---|---|---|---|
| Radiation alone (%) | Chemoradiotherapy (%) | |||||
| -29 | 9 (4.3%) | 13 (1.3%) | 29 (9.3%) | 0 (0.0%) | 2 (28.6%) | 53 (3.5%) |
| 30–39 | 9 (4.3%) | 12 (1.2%) | 50 (16.0%) | 3 (8.8%) | 0 (0.0%) | 74 (4.8%) |
| 40–49 | 13 (6.3%) | 32 (3.3%) | 52 (16.6%) | 5 (14.7%) | 1 (14.3%) | 103 (6.7%) |
| 50–59 | 38 (18.3%) | 260 (26.8%) | 70 (22.4%) | 11 (32.4%) | 1 (14.3%) | 380 (24.8%) |
| 60–69 | 131 (63.0%) | 619 (63.8%) | 105 (33.5%) | 15 (44.1%) | 3 (42.9%) | 873 (57.0%) |
| -70 | 7 (3.4%) | 33 (3.4%) | 6 (1.9%) | 0 (0.0%) | 0 (0.0%) | 46 (3.0%) |
| Unknown | 1 (0.5%) | 1 (0.1%) | 1 (0.3%) | 0 (0.0%) | 0 (0.0%) | 3 (0.2%) |
| Total | 208 (100.0%) | 970 (100.0%) | 313 (100.0%) | 34 (100.0%) | 7 (100.0%) | 1532 (100.0%) |
| Median (min—max) | 60.0 (1.8–92.0) | 60.0 (1.8–99.0) | 50.0 (1.8–99.0) | 52.2 (30.0–66.0) | 59.4 (14.0–61.2) | 60.0 (1.8–99.0) |
Table 13. Dose of irradiation (surgically treated cases)
Table 13.
Dose of irradiation (surgically treated cases)
| Dose of irradiation (Gy) | Preoperative irradiation (%) | Postoperative irradiation (%) |
|---|---|---|
| -29 | 6 (2.2%) | 5 (8.1%) |
| 30–39 | 30 (11.1%) | 14 (22.6%) |
| 40-49 | 194 (71.9%) | 18 (29.0%) |
| 50–59 | 23 (8.5%) | 22 (35.5%) |
| 60–69 | 17 (6.3%) | 0 (0.0%) |
| -70 | 0 (0.0%) | 0 (0.0%) |
| Unknown | 1 (0.0%) | 1 (1.6%) |
| Total Median | 270 | 62 |
| (min-max) | 40.0 (20.0–66.0) | 50.4 (1.8–61.2) |
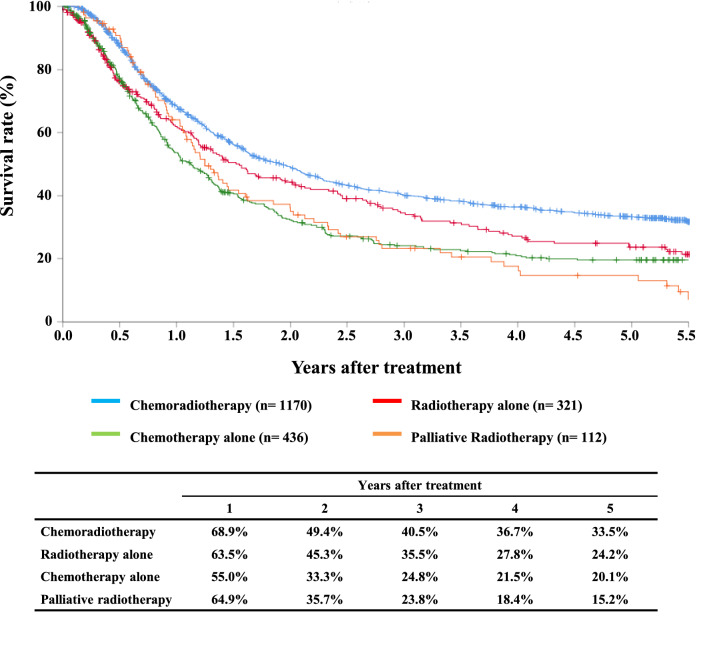
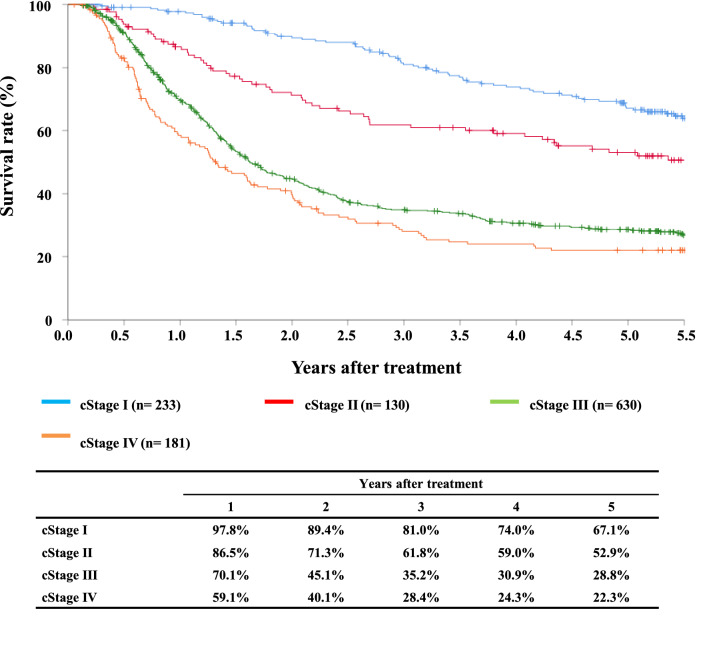
Figure 4 Survival of patients treated with chemotherapy and/or radiotherapy
Fig. 4.
Survival of patients treated with chemotherapy and/or radiotherapy
Figure 5 Survival of patients treated with definitive chemoradiotherapy according to the clinical stage (UICC TNM 7th)
Fig. 5.
Survival of patients treated with definitive chemoradiotherapy according to the clinical stage (UICC TNM 7th)
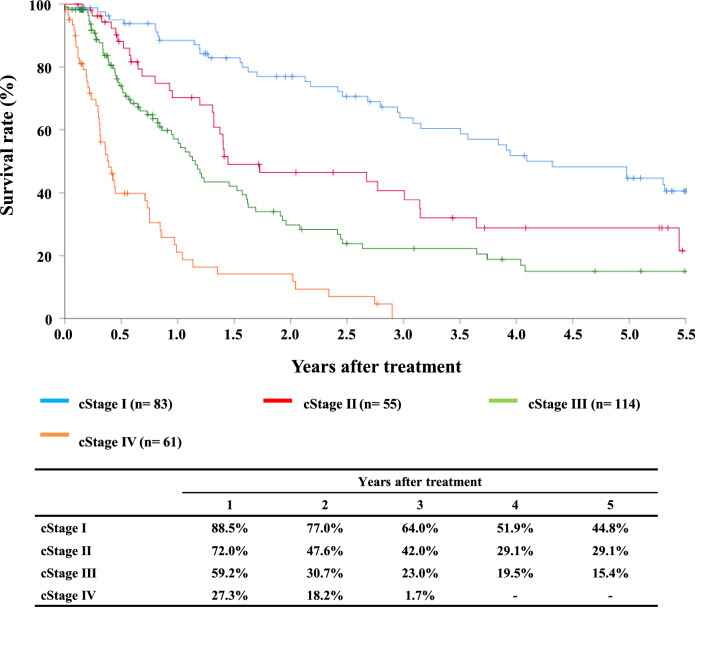
Figure 6 Survival of patients who underwent radiotherapy alone according to the clinical stage (UICC TNM 7th)
Fig. 6.
Survival of patients who underwent radiotherapy alone according to the clinical stage (UICC TNM 7th)
IV. Results in patients who underwent esophagectomy in 2015
Table 14 Treatment modalities of esophagectomy
Table 14.
Treatment modalities of esophagectomy
| Treatment modalities | Cases (%) |
|---|---|
| Esophagectomy alone | 2166 (41.9%) |
| Esophagectomy + postoperative chemotherapy | 418 (8.1%) |
| Esophagectomy + postoperative chemoradiotherapy | 109 (2.1%) |
| Esophagectomy + postoperative radiotherapy | 30 (0.6%) |
| Preoperative chemotherapy + Esophagectomy | 1901 (36.8%) |
| Preoperative chemoradiotherapy + Esophagectomy | 266 (5.1%) |
| Definitive radiotherapy + Esophagectomy | 7 (0.1%) |
| Definitive chemoradiotherapy + Esophagectomy | 122 (2.4%) |
| Others | 153 (3.0%) |
| Total | 5172 |
Table 15 Tumor location
Table 15.
Tumor location
| Locations | Cases (%) |
|---|---|
| Cervical | 181 (3.3%) |
| Upper thoracic | 620 (11.3%) |
| Middle thoracic | 2437 (44.5%) |
| Lower thoracic | 1616 (29.5%) |
| EG | 404 (7.4%) |
| E = G | 106 (1.9%) |
| GE | 93 (1.7%) |
| Unknown | 22 (0.4%) |
| Total | 5479 |
EG esophagogastric, E esophagus, G gastric
Table 16 Approaches to tumor resection
Table 16.
Approaches to tumor resection
| Approaches | Cases (%) |
|---|---|
| Cervical | 143 (2.8%) |
| Right thoracic | 4590 (88.7%) |
| Left thoracic | 72 (1.4%) |
| Left thoracoabdominal | 58 (1.1%) |
| Abdominal | 133 (2.6%) |
| Transhiatal lower esophagectomy | 71 (1.4%) |
| Transhiatal thoracic esophagectomy | 81 (1.6%) |
| Sternotomy | 9 (0.2%) |
| Others | 9 (0.2%) |
| Unknown | 6 (0.1%) |
| Total | 5172 |
Thoracic includes thoracotomy and thoracoscopic
Abdominal includes laparotomy and laparoscopic
Table 17 Video-assisted surgery
Table 17.
Video-assisted surgery
| Video-assisted surgery | Cases (%) |
|---|---|
| None | 2039 (39.4%) |
| Thoracoscopy | 1480 (28.6%) |
| Thoracoscopy + Laparoscopy | 1319 (25.5%) |
| Thoracoscopy + Laparoscopy + Mediastinoscopy | 9 (0.2%) |
| Thoracoscopy + Mediastinoscopy | 3 (0.1%) |
| Thoracoscopy + Other | 2 (0.0%) |
| Laparoscopy | 222 (4.3%) |
| Laparoscopy + Mediastinoscopy | 16 (0.3%) |
| Laparoscopy + Mediastinoscopy + Other | 0 (0.0%) |
| Mediastinoscopy | 72 (1.4%) |
| Laparoscopy + Other | 5 (0.1%) |
| Others | 4 (0.1%) |
| Unknown | 1 (0.0%) |
| Total | 5172 |
Table 18 Fields of lymph node dissection according to the location of the tumor
Table 18.
Fields of lymph node dissection according to the location of tumor
| Field of lymphadenectomy | Cervical | Upper thoracic | Middle thoracic | Lower thoracic | Abdominal | E = G | GE | Unknown | Total |
|---|---|---|---|---|---|---|---|---|---|
| None | 10 (6.3%) | 9 (1.5%) | 34 (1.5%) | 36 (2.3%) | 6 (1.6%) | 0 (0.0%) | 4 (5.2%) | 1 (12.5%) | 100 (1.9%) |
| C | 31 (19.5%) | 14 (2.4%) | 31 (1.3%) | 17 (1.1%) | 1 (0.3%) | 0 (0.0%) | 0 (0.0%) | 0 (0.0%) | 94 (1.8%) |
| C + UM | 19 (11.9%) | 3 (0.5%) | 5 (0.2%) | 1 (0.1%) | 2 (0.5%) | 0 (0.0%) | 0 (0.0%) | 0 (0.0%) | 30 (0.6%) |
| C + UM + MLM | 8 (5.0%) | 19 (3.2%) | 48 (2.1%) | 24 (1.5%) | 1 (0.3%) | 0 (0.0%) | 1 (1.3%) | 0 (0.0%) | 101 (2.0%) |
| C + UM + MLM + A | 73 (45.9%) | 382 (65.3%) | 1227 (53.2%) | 626 (40.0%) | 60 (16.0%) | 11 (11.5%) | 3 (3.9%) | 4 (50.0%) | 2386 (46.1%) |
| C + UM + A | 1 (0.6%) | 7 (1.2%) | 15 (0.7%) | 3 (0.2%) | 1 (0.3%) | 0 (0.0%) | 0 (0.0%) | 0 (0.0%) | 27 (0.5%) |
| C + MLM | 1 (0.6%) | 1 (0.2%) | 0 (0.0%) | 2 (0.1%) | 0 (0.0%) | 0 (0.0%) | 0 (0.0%) | 0 (0.0%) | 4 (0.1%) |
| C + MLM + A | 1 (0.6%) | 2 (0.3%) | 13 (0.6%) | 9 (0.6%) | 2 (0.5%) | 0 (0.0%) | 0 (0.0%) | 0 (0.0%) | 27 (0.5%) |
| C + A | 1 (0.6%) | 0 (0.0%) | 6 (0.3%) | 4 (0.3%) | 1 (0.3%) | 0 (0.0%) | 0 (0.0%) | 0 (0.0%) | 12 (0.2%) |
| UM | 1 (0.6%) | 2 (0.3%) | 13 (0.6%) | 7 (0.4%) | 0 (0.0%) | 0 (0.0%) | 0 (0.0%) | 0 (0.0%) | 23 (0.4%) |
| UM + MLM | 3 (1.9%) | 12 (2.1%) | 45 (2.0%) | 22 (1.4%) | 2 (0.5%) | 0 (0.0%) | 1 (1.3%) | 0 (0.0%) | 85 (1.6%) |
| UM + MLM + A | 8 (5.0%) | 116 (19.8%) | 785 (34.0%) | 667 (42.6%) | 150 (39.9%) | 39 (40.6%) | 16 (20.8%) | 2 (25.0%) | 1783 (34.5%) |
| UM + A | 1 (0.6%) | 1 (0.2%) | 4 (0.2%) | 4 (0.3%) | 1 (0.3%) | 0 (0.0%) | 0 (0.0%) | 0 (0.0%) | 11 (0.2%) |
| MLM | 1 (0.6%) | 4 (0.7%) | 4 (0.2%) | 11 (0.7%) | 2 (0.5%) | 2 (2.1%) | 2 (2.6%) | 0 (0.0%) | 26 (0.5%) |
| MLM + A | 0 (0.0%) | 6 (1.0%) | 62 (2.7%) | 114 (7.3%) | 109 (29.0%) | 37 (38.5%) | 29 (37.7%) | 0 (0.0%) | 357 (6.9%) |
| A | 0 (0.0%) | 7 (1.2%) | 15 (0.7%) | 17 (1.1%) | 38 (10.1%) | 7 (7.3%) | 21 (27.3%) | 1 (12.5%) | 106 (2.0%) |
| Total | 159 | 585 | 2,307 | 1,564 | 376 | 96 | 77 | 8 | 5172 |
C bilateral cervical nodes, UM upper mediastinal nodes, MLM middle-lower mediastinal nodes, A abdominal nodes
Table 19 Reconstruction route
Table 19.
Reconstruction route
| Route | Cases (%) |
|---|---|
| None | 57 (1.1%) |
| Subcutaneous | 319 (6.2%) |
| Retrosternal | 2383 (46.1%) |
| Posterior mediastinal | 1977 (38.2%) |
| Intrathoracic | 317 (6.1%) |
| Cervical | 67 (1.3%) |
| Others | 44 (0.9%) |
| Unknown | 8 (0.2%) |
| Total | 5172 |
Table 20 Organs used for reconstruction
Table 20.
Organs used for reconstruction
| Organs | Cases (%) |
|---|---|
| None | 69 (1.3%) |
| Whole stomach | 212 (4.0%) |
| Gastric tube | 4504 (85.4%) |
| Jejunum | 210 (4.0%) |
| Free jejunum | 85 (1.6%) |
| Colon | 158 (3.0%) |
| Free colon | 17 (0.3%) |
| Others | 21 (0.4%) |
| Total organs | 5,276 |
| Total cases | 5,103 |
Table 21 Histological classification
Table 21.
Histological classification
| Histological classification | Cases (%) |
|---|---|
| Squamous cell carcinoma | 4,329 (83.7%) |
| Squamous cell carcinoma | 925 (17.9%) |
| Well differentiated | 727 (14.1%) |
| Moderately differentiated | 2075 (40.1%) |
| Poorly differentiated | 602 (11.6%) |
| Adenocarcinoma | 316 (6.1%) |
| Barrett's carcinoma | 139 (2.7%) |
| Adenosquamous carcinoma | 34 (0.7%) |
| Mucoepidermoid carcinoma | 2 (0.0%) |
| Basaloid carcinoma | 87 (1.7%) |
| Neuroendocrine tumor | 1 (0.0%) |
| Neuroendocrine carcinoma | 29 (0.6%) |
| Undifferentiated carcinoma | 8 (0.2%) |
| Malignant melanoma | 22 (0.4%) |
| Carcinosarcoma | 25 (0.5%) |
| GIST | 3 (0.1%) |
| Adenoid cystic carcinoma | 4 (0.1%) |
| Sarcoma | 3 (0.1%) |
| Other carcinomas | 7 (0.1%) |
| Other tumors | 33 (0.6%) |
| Unknown | 130 (2.5%) |
| Total | 5,172 |
GIST gastrointestinal stromal tumor
Table 22 Pathological depth of tumor invasion, pT (JES 10th)
Table 22.
Pathological depth of tumor invasion, pT (JES 10th)
| Pathological depth of tumor invasion | Cases (%) |
|---|---|
| pT0 | 227 (4.4%) |
| pT1a | 637 (12.3%) |
| pT1b | 1470 (28.4%) |
| pT2 | 606 (11.7%) |
| pT3 | 1915 (37.0%) |
| pT4a | 152 (2.9%) |
| pT4b | 102 (2.0%) |
| pTX | 63 (1.2%) |
| Total | 5172 |
Table 23 Pathological grading of lymph node metastasis, pN (JES 10th)
Table 23.
Pathological grading of lymph node metastasis, pN (JES 10th)
| Lymph node metastasis | Cases (%) |
|---|---|
| pN0 | 2568 (49.7%) |
| pN1 | 926 (17.9%) |
| pN2 | 989 (19.1%) |
| pN3 | 349 (6.7%) |
| pN4 | 309 (6.0%) |
| Unknown | 31 (0.6%) |
| Total | 5172 |
Table 24 Pathological findings of lymph node metastasis, pN (UICC TNM 7th)
Table 24.
Pathological grading of lymph node metastasis, pN (UICC TNM 7th)
| Lymph node metastasis (Number of metastasis) | Cases (%) |
|---|---|
| pN0 | 2614 (50.5%) |
| pN1(1–2) | 1353 (26.2%) |
| pN2(3–6) | 754 (14.6%) |
| pN3(7-) | 398 (7.7%) |
| pNX | 53 (1.0%) |
| Total | 5172 |
Table 25 Pathological findings of distant organ metastasis, pM (JES 10th)
Table 25.
Pathological findings of distant organ metastasis, pM (JES 10th)
| Distant metastasis (M) | Cases (%) |
|---|---|
| M0 | 5009 (96.8%) |
| M1 | 103 (2.0%) |
| Mx | 60 (1.2%) |
| Total | 5172 |
Table 26 Residual tumor
Table 26.
Residual tumor
| Residual tumor (R) | Cases (%) |
|---|---|
| R0 | 4667 (90.2%) |
| R1 | 241 (4.7%) |
| R2 | 152 (2.9%) |
| RX | 112 (2.2%) |
| Total | 5172 |
Table 27 Cause of death after esophagectomy
Table 27.
Cause of death after esophagectomy
| Cause of death | Cases (%) |
|---|---|
| Death due to recurrence | 1809 (62.6%) |
| Death due to other cancer | 205 (7.1%) |
| Death due to other diseases (with recurrence) | 68 (2.4%) |
| Death due to other diseases (without recurrence) | 404 (14.0%) |
| Death due to other diseases (recurrence unknown) | 23 (0.8%) |
| Operative death* | 41 (1.4%) |
| Postoperative hospital death** | 77 (2.7%) |
| Unknown | 264 (9.1%) |
| Total of death cases | 2891 |
| Follow-up period (months) | |
|---|---|
| Median (min–max) | 59.76 (0.00–78.72) |
*Operative death means death within 30 days after operation in or out of the hospital.
Operative mortality rate: 0.79%
**Hospital death is defined as death during the same hospitalization, regardless of department at the time of death. Hospital mortality rate: 2.3%
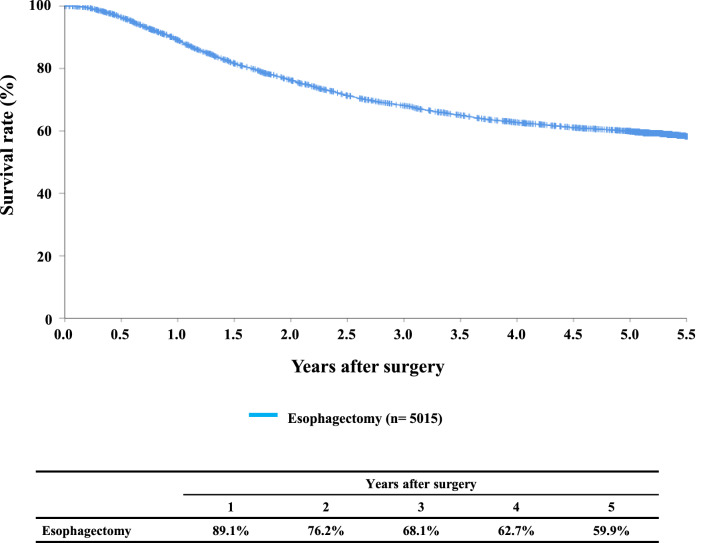
Figure 7 Survival of patients who underwent esophagectomy
Fig. 7.
Survival of patients who underwent esophagectomy
Figure 8 Survival of patients who underwent esophagectomy according to the clinical stage (JES 10th)
Fig. 8.
Survival of patients who underwent esophagectomy according to the clinical stage (JES 10th)
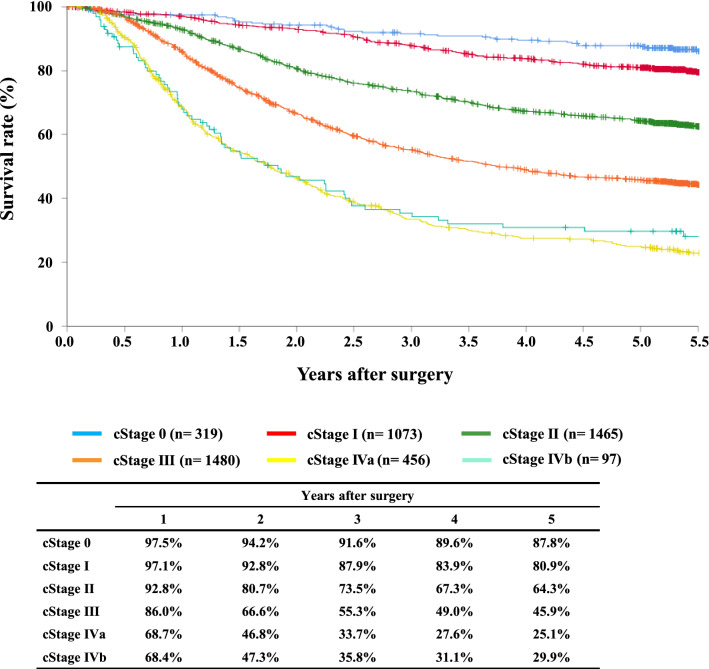
Figure 9 Survival of patients who underwent esophagectomy according to the clinical stage (UICC TNM 7th)
Fig. 9.
Survival of patients who underwent esophagectomy according to the clinical stage (UICC TNM 7th)
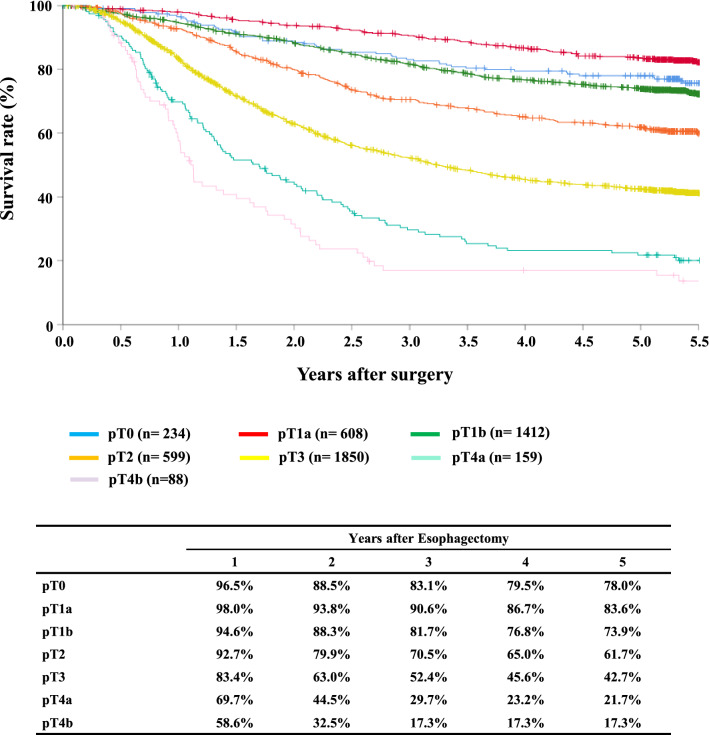
Figure 10 Survival of patients who underwent esophagectomy according to the depth of tumor invasion, pT (JES 10th)
Fig. 10.
Survival of patients who underwent esophagectomy according to the depth of tumor invasion, pT (JES 10th)
Figure 11 Survival of patients who underwent esophagectomy according to lymph node metastasis (JES 10th)
Fig. 11.
Survival of patients who underwent esophagectomy according to lymph-node metastasis (JES 10th)
Figure 12 Survival of patients who underwent esophagectomy according to lymph node metastasis (UICC TNM 7th)
Fig. 12.
Survival of patients who underwent esophagectomy according to lymph-node metastasis (UICC TNM 7th)
Figure 13 Survival of patients who underwent esophagectomy according to the pathological stage (JES 10th)
Fig. 13.
Survival of patients who underwent esophagectomy according to the pathological stage (JES 10th)
Figure 14 Survival of patients who underwent esophagectomy according to the pathological stage (UICC TNM 7th)
Fig. 14.
Survival of patients who underwent esophagectomy according to the pathological stage (UICC TNM 7th)
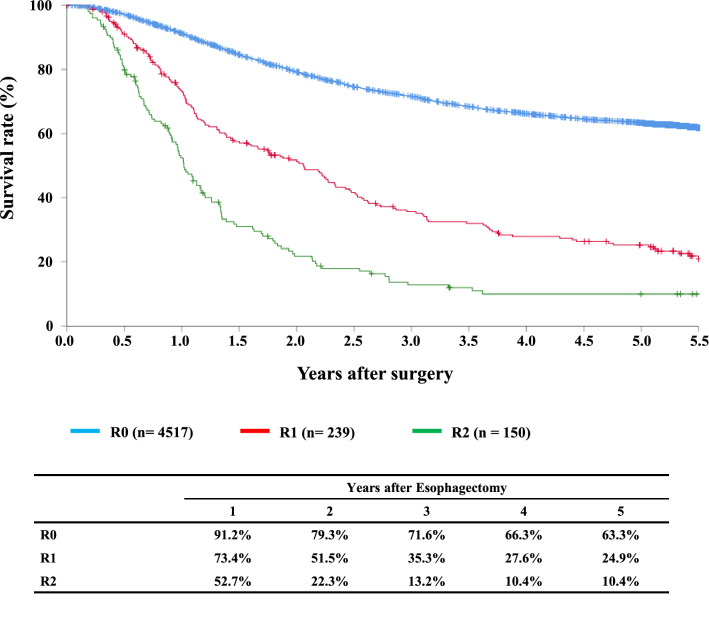
Figure 15 Survival of patients who underwent esophagectomy according to the residual tumor (R)
Fig. 15.
Survival of patients
I. Clinical features of esophageal cancer patients treated in 2015
Institution-registered cases in 2015
| Institutions |
|---|
| Aomori Prefectural Central Hospital |
| Ageo Central General Hospital |
| Aichi Cancer Center |
| Aichi Medical University Hospital |
| Aizawa Hospital |
| Akita University Hospital |
| Arao Municipal Hospital |
| Asahi Rousai Hospital |
| Asahikawa Medical University Hospital |
| Cancer Institute Hospital of JFCR |
| Chiba Cancer Center |
| Chiba-Nishi General Hospital |
| Chiba University Hospital |
| Dokkyo Medical University Hospital |
| Dokkyo Medical University Saitama Medical Center |
| Edogawa Hospital |
| Ehime Prefectural Central Hospital |
| Eijyu General Hospital |
| Fuji City General Hospital |
| Fujioka General Hospital |
| Fujisaki Hospital |
| Fujisawa City Hospital |
| Fujita Health University Hospital |
| Fukaya Red Cross Hospital |
| Fukui University Hospital |
| Fukui-ken Saiseikai Hospital |
| Fukuoka City Hospital |
| Fukuoka Shin Mizumaki Hospital |
| Fukuoka University Chikushi Hospital |
| Fukuoka University Hospital |
| Fukuoka Wajiro Hospital |
| Fukushima Medical University Hospital |
| Fukushima Rosai Hospital |
| Fukuyama City Hospital |
| Gifu Prefectural General Center |
| Gifu Municipal Hospital |
| Gifu University Hospital |
| Gunma Prefectural Cancer Center |
| Gunma Saiseikai Maebashi Hospital |
| Gunma University Hospital |
| Hachinohe City Hospital |
| Hakodate City Hospital |
| Hakodate Goryokaku Hospital |
| Hakodate National Hospital |
| Hamamatsu University Hospital |
| Hamanomachi Hospital |
| Hannan Chuo Hospital |
| Hanyu General Hospital |
| Hasuda Hospital |
| Heartlife Hospital |
| Higashiosaka City Medical Center |
| Hiraka General Hospital |
| Hiratsuka City Hospital |
| Hirosaki University Hospital |
| Hiroshima City Asa Hospital |
| Hiroshima City Hospital |
| Hiroshima Memorial Hospital |
| Hiroshima Prefectural Hospital |
| Hiroshima Red Cross Hospital & Atomic-bomb Survivors Hospital |
| Hiroshima University Hospital |
| Hitachi General Hospital |
| Hofu Institute of Gastroenterology |
| Hokkaido University Hospital |
| Hospital of the University of Occupational and Environmental Health, Japan |
| Hyogo Cancer Center |
| Hyogo Prefectural Amagasaki General Medical Center |
| Hyogo Prefectural Nishinomiya Hospital |
| Ibaraki Prefectural Central Hospital |
| Iizuka Hospital |
| Ikeda City Hospital |
| Imari Arita Kyoritsu Hospital |
| International University of Health and Welfare Hospital |
| International University of Health and Welfare Mita Hospital |
| Iseikai Hospital |
| Ishikawa Prefectural Central Hospital |
| Itami City Hospital |
| Iwata City Hospital |
| Iwate Medical University Hospital |
| Iwate Prefectural Central Hospital |
| Iwate Prefectural Chubu Hospital |
| Iwate Prefectural Ofunato Hospital |
| JA Hiroshima General Hospital |
| JA Kouseiren Enshu Hospital |
| JA Onomichi General Hospital |
| Japanese Red Cross Ashikaga Hospital |
| Japanese Red Cross Fukuoka Hospital |
| Japanese Red Cross Ishinomaki Hospital |
| Japanese Red Cross Kitami Hospital |
| Japanese Red Cross Kyoto Daiichi Hospital |
| Japanese Red Cross Maebashi Hospital |
| Japanese Red Cross Medical Center |
| Japanese Red Cross Musashino Hospital |
| Japanese Red Cross Nagoya Daiichi Hospital |
| Japanese Red Cross Nagoya Daini Hospital |
| Japanese Red Cross Saitama Hospital |
| Japanese Red Cross Tottori Hospital |
| Japanese Red Cross Wakayama Medical Center |
| Japanese Red Cross Yamaguchi Hospital |
| JCHO Gunma Chuo Hospital |
| JCHO Kyushu Hospital |
| JCHO Osaka Hospital |
| Jichi Medical University Hospital |
| Jichi Medical University Saitama Medical Center |
| Juntendo University Hospital |
| Juntendo University Nerima Hospital |
| Juntendo University Shizuoka Hospital |
| Juntendo University Urayasu Hospital |
| Junwakai Memorial Hospital |
| Kagawa Prefectural Central Hospital |
| Kagawa Rosai Hospital |
| Kagawa University Hospital |
| Kagoshima City Hospital |
| Kagoshima Medical Association Hospital |
| Kagoshima University Hospital |
| Kaizuka City Hospital |
| Kakogawa Central City Hospital |
| Kanagawa Cancer Center |
| Kanagawa Prefectural Ashigarakami Hospital |
| Kanazawa Medical University Hospital |
| Kanazawa University Hospital |
| Kansai Denryoku Hospital |
| Kansai Medical University Hospital |
| Kansai Medical University Medical Center |
| Kansai Rosai Hospital |
| Kanto Central Hospital for Public School Teachers |
| Kashiwa Kousei General Hospital |
| Kawakita General Hospital |
| Kawasaki Medical School Hospital |
| Kawasaki Medical School Kawasaki Hospital |
| Kawasaki Municipal Hospital |
| Kawasaki Municipal Ida Hospital |
| Kawasaki Saiwai Hospital |
| Keio University Hospital |
| Keiyu Hospital |
| Keiyukai Sapporo Hospital |
| Kindai University Hospital |
| Kindai University Nara Hospital |
| Kinki Central Hospital |
| Kiryu Kousei General Hospital |
| Kishiwada City Hospital |
| Kitaharima Medical Center |
| Kitakyushu Municipal Medical Center |
| Kitano Hospital |
| Kitasato University Hospital |
| Kobe City Medical Center General Hospital |
| Kobe University Hospital |
| Kochi Health Science Center |
| Kochi University Hospital |
| Kohga Public Hospital |
| Kokura Memorial Hospital |
| Kosei Hospital |
| Kouseiren Takaoka Hospital |
| Kumagai General Hospital |
| Kumamoto University Hospital |
| Kumamoto Regional Medical Center |
| Kurashiki Central Hospital |
| Kurume University Hospital |
| Kyorin University Hospital |
| Kyoto Okamoto Memorial Hospital |
| Kyoto University Hospital |
| Kyoto-Katsura Hospital |
| Kyushu Central Hospital |
| Kyushu University Hospital |
| Matsudo City General Hospital |
| Matsushita Memorial Hospital |
| Matsuyama Red Cross Hospital |
| Mie University Hospital |
| Minamiosaka Hospital |
| Minoh City Hospital |
| Mito Red Cross Hospital |
| Mitsui Memorial Hospital |
| Miyazaki University Hospital |
| Moriguchi Keijinkai Hospital |
| Nagahama City Hospital |
| Nagahama Red Cross Hospital |
| Nagano Municipal Hospital |
| Nagaoka Chuo General Hospital |
| Nagasaki University Hospital |
| Nagoya City University Hospital |
| Nagoya City West Medical Center |
| Nagoya Tokushukai General Hospital |
| Nagoya University Hospital |
| Nanpuh Hospital |
| Nara City Hospital |
| Nara Medical University Hospital |
| National Cancer Center Hospital |
| National Cancer Center Hospital East |
| National Center for Global Health and Medicine |
| National Defence Medical College Hospital |
| Nerima Hikarigaoka Hospital |
| New Tokyo Hospital |
| NHO Beppu Medical Center |
| NHO Chiba Medical Center |
| NHO Disaster Medical Center |
| NHO Iwakuni Clinical Center |
| NHO Kanmon Medical Center |
| NHO Kure Medical Center |
| NHO Kyoto Medical Center |
| NHO Kyushu Cancer Center |
| NHO Kyushu Medical Center |
| NHO Matsumoto Medical Center |
| NHO Mito Medical Center |
| NHO Miyakonojo Medical Center |
| NHO Nagasaki Medical Center |
| NHO Oita Medical Center |
| NHO Osaka Medical Center |
| NHO Saitama Hospital |
| NHO Sendai Medical Center |
| NHO Shikoku Cancer Center |
| NHO Takasaki General Medical Center |
| NHO Tokyo Medical Center |
| NHO Yokohama Medical Center |
| Nihonkai General Hospital |
| Niigata Cancer Center Hospital |
| Niigata City General Hospital |
| Niigata Prefectural Central Hospital |
| Niigata Prefectural Shibata Hospital |
| Niigata University Medical & Detal Hospital |
| Nikko Memorial Hospital |
| Nippon Medical School Chiba Hokusou Hospital |
| Nippon Medical School Hospital |
| Nippon Medical School Musashi Kosugi Hospital |
| Nippon Medical School Tama Nagayama Hospital |
| Nishi Kobe Medical Center |
| Nissan Tamagawa Hospital |
| Northern Okinawa Medical Center |
| NTT Medical Center Tokyo |
| Numazu City Hospital |
| Obihiro Kousei Hospital |
| Ofuna Chuo Hospital |
| Ogaki Municipal Hospital |
| Ogikubo Hospital |
| Ogori Daiichi General Hospital |
| Ohara General Hospital |
| Ohta Hospital |
| Ohta Nishinouchi Hospital |
| Oita Prefectural Hospital |
| Oita Red Cross Hospital |
| Oita University Hospital |
| Okayama City Hospital |
| Okayama Red Cross General Hospital |
| Okayama Saiseikai General Hospital |
| Okayama University Hospital |
| Okitama Public General Hospital |
| Osaka City General Hospital |
| Osaka City University Hospital |
| Osaka General Medical Center |
| Osaka International Cancer Institute |
| Osaka Medical and Pharmaceutical University Hospital |
| Osaka Police Hospital |
| Osaka Red Cross Hospital |
| Osaka Rosai Hospital |
| Osaka University Hospital |
| Osaki City Hospital |
| Otsu City Hospital |
| Rinku General Medical Center |
| Saga Prefectural Hospital Koseikan |
| Saga University Hospital |
| Saiseikai Fukuoka General Hospital |
| Saiseikai Karatsu Hospital |
| Saiseikai Kawaguchi General Hospital |
| Saiseikai Noe Hospital |
| Saiseikai Utsunomiya Hospital |
| Saiseikai Yamaguchi General Hospital |
| Saiseikai Yokohama Tobu Hospital |
| Saitama Cancer Center |
| Saitama Citizens Medical Center |
| Saitama City Hospital |
| Saitama Medical University International Medical Center |
| Saitama Medical University Saitama Medical Center |
| Sakai City Medical Center |
| Saku Central Hospital |
| Seikei-kai Chiba Medical Center |
| Seirei Hamamatsu General Hospital |
| Sendai City Hospital |
| Sendai Kosei Hospital |
| Shiga General Hospital |
| Shiga University of Medical Science Hospital |
| Shimane Prefectural Central Hospital |
| Shimane University Hospital |
| Shin Takeo Hospital |
| Shinko Hospital |
| Shinshu University Hospital |
| Shizuoka Cancer Center |
| Shizuoka City Shizuoka Hospital |
| Shizuoka General Hospital |
| Showa University Hospital |
| Showa University Koto Toyosu Hospital |
| Southern Tohoku General Hospital |
| St. Luke's International Hospital |
| St. Marianna University School of Medicine Hospital |
| St. Mary's Hospital |
| Steel Memorial Yawata Hospital |
| Suita Municipal Hospital |
| Tachikawa Hospital |
| Takatsuki Red Cross Hospital |
| Tama Kyuryo Hospital |
| Teikyo University Chiba Medical Center |
| Teikyo University Hospital |
| Teikyo University Hospital Mizonokuchi |
| Teine Keijinkai Hospital |
| Tenri Hospital |
| The Hospital of Hyogo College of Medicine |
| The Jikei University Daisan Hospital |
| The Jikei University Hospital |
| Tochigi Cancer Center |
| Toda Central General Hospital |
| Toho University Ohashi Medical Center |
| Toho University Omori Medical Center |
| Toho University Sakura Medical Center |
| Tohoku University Hospital |
| Tokai University Hachioji Hospital |
| Tokai University Hospital |
| Tokai University Tokyo Hospital |
| Tokushima Red Cross Hospital |
| Tokushima University Hospital |
| Tokyo Dental College Ichikawa General Hospital |
| Tokyo Medical and Dental University Hospital |
| Tokyo Medical University Hachioji Medical Center |
| Tokyo Medical University Hospital |
| Tokyo Metropolitan Cancer and Infectious Diseases Center Komagome Hospital |
| Tokyo Metropolitan Tama Medical Center |
| Tokyo University Hospital |
| Tokyo Women's Medical University Hospital |
| Tokyo Women's Medical University Medical Center East |
| Tokyo Women's Medical University Yachiyo Medical Center |
| Tonan Hospital |
| Toranomon Hospital |
| Toshima Hospital |
| Tottori Prefectural Central Hospital |
| Tottori University Hospital |
| Toyama Prefectural Central Hospital |
| Toyama University Hospital |
| Toyonaka Municipal Hospital |
| Toyota Kosei Hospital |
| Toyota Memorial Hospital |
| Tsuchiura Kyodo Hospital |
| Tsukuba University Hospital |
| University Hospital, Kyoto Prefectural University of Medicine |
| University of the Ryukyus Hospital |
| Wakayama Medical University Hospital |
| Wakayama Rosai Hospital |
| Yamagata Prefectural Central Hospital |
| Yamagata University Hospital |
| Yamaguchi University Hospital |
| Yamanashi Prefectural Central Hospital |
| Yamanashi University Hospital |
| Yao Municipal Hospital |
| Yokkaichi Hospital |
| Yokohama City Minato Red Cross Hospital |
| Yokohama City Municipal Hospital |
| Yokohama City University Hospital |
| Yokohama City University Medical Center |
| Yokosuka General Hospital Uwamachi |
| Yuai Memorial Hospital |
(Total 355 institutions).
Patient background
II. Results of endoscopically treated patients in 2015
III. Results in patients treated with chemotherapy and/or radiotherapy in 2015
IV. Results in patients who underwent esophagectomy in 2015
Tables 14, 15, 16, 17, 18, 19, 20, 21, 22, 23, 24, 25, 26, 27, and Figs. 7, 8, 9, 10, 11, 12, 13, 14, 15
Declarations
Ethical statement
All procedures were in accordance with the ethical standards of the responsible committee on human experimentation (institutional and national) and with the Helsinki Declaration of 1964 and later versions.
Conflict of interest
Shiyori Usune, Arata Takahashi, and Hiroaki Miyata are affiliated with the Department of Healthcare Quality Assessment at the University of Tokyo. The department is a social collaboration department supported by grants from the National Clinical Database, Johnson & Johnson K.K., Nipro Co, and Intuitive Surgical Sàrl. Other authors have no conflict of interest.
Footnotes
The authors were members of the Registration Committee for Esophageal Cancer, the Japan Esophageal Society, and made great contribution to the preparation of this material.
Publisher's Note
Springer Nature remains neutral with regard to jurisdictional claims in published maps and institutional affiliations.
References
- 1.Japan Esophageal Society Japanese classification of esophageal cancer, 10th edition: part 1. Esophagus. 2009;6:1–25. doi: 10.1007/s10388-009-0169-0. [DOI] [PMC free article] [PubMed] [Google Scholar]
- 2.Sobin LH, Gospodarowicz MK, Wittekind C. UICC International Union Against Cancer. TNM classification of malignant tumors. 7th ed. New York: Wiley-Blackwell; 2009.


