

Abstract
Purpose
To differentiate among infectious diseases, drug-induced lung injury (DILI) and pulmonary infiltration due to underlying malignancy (PIUM) based on high-resolution computed tomographic (HRCT) findings from patients with hematological malignancies who underwent chemotherapy or hematopoietic stem cell transplantation.
Materials and methods
A total of 221 immunocompromised patients with hematological malignancies who had proven chest complications (141 patients with infectious diseases, 24 with DILI and 56 with PIUM) were included. Two chest radiologists evaluated the HRCT findings, including ground-glass opacity, consolidation, nodules, and thickening of bronchovascular bundles (BVBs) and interlobular septa (ILS). After comparing these CT findings among the three groups using the χ2test, multiple logistic regression analyses (infectious vs noninfectious diseases, DILI vs non-DILI, and PIUM vs non-PIUM) were performed to detect useful indicators for differentiation.
Results
Significant differences were detected in many HRCT findings by the χ2 test. The results from the multiple logistic regression analyses identified several indicators: nodules without a perilymphatic distribution [p = 0.012, odds ratio (95% confidence interval): 4.464 (1.355–11.904)], nodules with a tree-in-bud pattern [p = 0.011, 8.364 (1.637–42.741)], and the absence of ILS thickening[p = 0.003, 3.621 (1.565–8.381)] for infectious diseases, the presence of ILS thickening [p = 0.001, 7.166 (2.343–21.915)] for DILI, and nodules with a perilymphatic distribution [p = 0.011, 4.256 (1.397–12.961)] and lymph node enlargement (p = 0.008, 3.420 (1.385–8.441)] for PIUM.
Conclusion
ILS thickening, nodules with a perilymphatic distribution, tree-in-bud pattern, and lymph node enlargement could be useful indicators for differentiating among infectious diseases, DILI, and PIUM in patients with hematological malignancies.
Keywords: Hematological malignancy, Infection, Drug-induced lung injury, Pulmonary infiltration due to underlying malignancy, High-resolution CT (HRCT)
Introduction
During the past several decades, due to the progression of intensive chemotherapy and hematopoietic stem cell transplantation (HSCT), the therapeutic outcomes of patients with hematological malignancy have become more favorable. In addition to the fact that patients undergoing chemotherapy or HSCT are susceptible to infection and drug-induced lung injury (DILI), pulmonary infiltration due to underlying malignancy (PIUM) could be a possible disease in patients to whom HSCT or repeated chemotherapy is no longer effective [1–3]. These three types of complications are a major cause of morbidity and mortality and the differential diagnosis among these three entities seems to be a major concern for physicians because the therapeutic strategy for each entity is quite different; therefore, early diagnosis and treatment are important. However, distinguishing among these complications is often difficult due to nonspecific chest symptoms and radiologic findings. According to several reports, a chest radiograph could show normal findings in up to 10% of patients with confirmed lung diseases [2–4].
High-resolution computed tomography (HRCT) is superior to chest radiography for the diagnosis of acute lung diseases in immunocompromised patients [2, 4]; however, even HRCT often shows nonspecific findings, including airspace consolidation, ground-glass opacity (GGO), and nodules; therefore, accurate diagnoses with a high degree of confidence are limited except for some diseases [5].
In the current study, we aimed to differentiate among infectious diseases, DILI and PIUM using a relatively large number of patients with hematologic malignancies who underwent chemotherapy or HSCT.
Materials and methods
Patients
The review board of the institution, in which this work was carried out, approved this study. The requirement for the patient’s informed consent was waived due to the retrospective nature of this study.
We retrospectively reviewed the CT database at this institution for acute chest complications in immunocompromised patients from January 1990 to December 2015. The selection criteria for this study were as follows: (1) HRCT was performed to investigate the lung abnormalities of the patients, (2) HRCT showed any parenchymal abnormalities, and (3) only one final diagnosis was determined for each case. First, we identified a total of 1073 immunocompromised patients with chest complications depicted on HRCT images. Among them, 852 patients were excluded due to lack of a definitive diagnosis (n = 424), coinfections (n = 25), a short interval (within four weeks) between a new episode and a previous episode (n = 11), underlying diseases other than hematological malignancy and not undergoing chemotherapy or HSCT (n = 348), and lung diseases other than infection, DILI, or PIUM (n = 44), including diffuse pulmonary hemorrhage, idiopathic pneumonia syndrome, and pulmonary edema; therefore, 221 cases were included in this study. The reason for exclusion due to a short interval was that the previous episode may have influenced the HRCT findings of the current episode. Finally, a total of 221 cases of 188 patients [129 males and 92 females; mean age was 49.6 standard deviation (SD),17.0; age range: 5–82 years] were identified as the current study population, as shown in Fig. 1. Among the 188 patients, 25 patients had 2 episodes, and 4 patients had 3 episodes of complications, resulting in a total of 221 cases. The final diagnoses of the 221 cases included 141 cases of infectious diseases, 24 cases of DILI and 56 cases of PIUM; detailed information, including the diagnostic methods, is shown in Table 1. Some cases of DILI and PIUM were diagnosed based on the clinical course. Criteria for diagnosis of DILI due to clinical course included onset of lung diseases after chemotherapy, immediate responsiveness to newly administered steroids, and exclusion of infections from the results of sputum culture, serum antigens or antibodies for specific microorganisms or bronchoalveolar lavage. Criteria for diagnosis of PIUM due to clinical course included responsiveness of lung diseases to the administration of chemotherapy. The diagnoses of these cases were basically determined by the attending physicians according to detailed analyses of all physical and laboratory findings and the responsiveness to the therapy including steroids/immunosuppressants and chemotherapy. The underlying diseases of 188 patients were leukemia (n = 99), malignant lymphoma (n = 62), and other hematological malignancies (n = 27) including myelodysplastic syndrome and multiple myeloma.
Fig. 1.

Flow diagram of patient selection
Table 1.
Characteristics of all 221 cases and diagnostic methods for all cases included in this study
| Lung disease groups | Age [mean (SD)] | Gender | Diagnostic methods |
|---|---|---|---|
|
Infectious diseases (n = 141) Bacterial pneumonia 50 Fungal infection 34 Septic emboli 7 Tuberculosis 3 Pneumocystis pneumonia 40 Cytomegalovirus pneumonia 7 |
48.5 (17.2) (5–81 years) |
Male 86 Female 55 |
Sputum smear/culture 32 Blood culture 28 Serum antigen/antibody 33 Urinary antigen 1 BAL 30 TBLB 7 BAL + TBLB 1 SLB 1 Autopsy 8 |
| Drug toxicity (n = 24) | 56.9 (15.0) (20–82 years) |
Male 12 Female 12 |
DLST 2 TBLB 2 BAL + TBLB 2 CT guided biopsy 1 Clinical course and laboratory findings 17 |
|
Pulmonary infiltration due to underlying malignancy (n = 56) Leukemic infiltration 25 Lymphoma infiltration 31 |
49.3 (17.0) (20–78 years) |
Male 31 Female 25 |
BAL 5 TBLB 3 BAL + TBLB 1 CT guided biopsy 1 SLB 3 Autopsy 4 Cytology of pleural effusion 5 Clinical course and laboratory findings 34 |
SD standard deviation, BAL bronchoalveolar lavage, TBLB transbronchial lung biopsy, SLB surgical lung biopsy, DLST drug lymphocyte stimulation test
CT scanning
CT scans were obtained using a TCT-900S (Canon medical systems corporation, Tokyo, Japan), a Somatom Plus 4, a Volume Zoom, Somatom Definition and Somatom Sensation 64 (Siemens, Erlangen, Germany). CT scans were obtained at suspended end-inspiration in the supine position without intravenous contrast material. The CT protocols were diverse due to the long period of the current study. With the TCT-900S scanner, which is not a multislice CT scanner, after 10 mm collimation scans were obtained at contiguous 10-mm intervals through the entire chest, all patients underwent HRCT through the region showing abnormal parenchymal findings at 2 mm collimation. With other multislice CT scanners, after contiguous 10, 7 or 5 mm slice CT images were obtained through the chest, additional 1 or 2 mm slice HRCT images were obtained at 1, 2, 5, or 10 mm intervals through the abnormal lung parenchyma. The scanning parameters were 140 kVp and 160–250 effective mAs. All images were viewed at the lung (window width, 1500 or 1750 HU; window level, -600 or -700 HU) and mediastinal (window width, 250–400 HU; window level, 40–50 HU) windows.
Interpretation of CT images
The CT images were independently evaluated by two chest radiologists (16 and 29 years of experience) in random order without knowledge of the clinical information of the patients except that they were all patients with hematological malignancies who underwent chemotherapy or HSCT. Cases of discordant results between the two radiologists were resolved by consensus of the same two radiologists.
Each of the following HRCT findings was separately assigned as “present” or “absent”: (a) consolidation, (b) GGO, (c) a crazy-paving pattern, (d) a mosaic pattern, (e) nodules, (f) nodules with a halo sign, (g) nodules with a tree-in-bud (TIB) pattern, (h) bronchovascular bundle (BVB) thickening, (i) interlobular septal (ILS) thickening, (j) hilar or mediastinal lymph node (LN) enlargement, and (k) pleural effusion. Concerning the three HRCT findings of (a), (b) and (e), the extent of the lesions within the entire bilateral lung field was graded subjectively on a five-point scale (0: 0%, 1: 1–25%, 2: 26–50%, 3: 51–75%, and 4: 76–100%). In addition, the overall lesional extent within the entire lung field was also graded on the same five-point scale.
When GGO or consolidation was present, the predominance of consolidation or GGO (GGO/Con predominance) was classified as GGO predominance, consolidation predominance, or their equal predominance of both. The distribution of GGO or consolidation (GGO/Con distribution) was classified as segmental, nonsegmental, or lobular. Nodules were classified by size as micro (< 3 mm), small (> 3 mm and < 10 mm), or large (> 10 mm), and by distribution as centrilobular, perilymphatic, or random.
Furthermore, the overall lesional distribution was classified axially (axial distribution) as inner, outer, diffuse or indeterminate and craniocaudally (craniocaudal distribution) as upper, lower, diffuse or indeterminate. One predominant CT pattern was recorded for each patient as follows: a micro or small (micro/small) nodular pattern, a large nodular pattern, a diffuse GGO pattern, a segmental GGO or consolidation (GGO/Con) pattern, a nonsegmental (nonseg) GGO/Con pattern, or a BVB or ILS thickening (BVB/ILS) pattern.
Statistical analysis
Interobserver agreement between the two radiologists was evaluated by calculating the kappa value (κ-value) as follows: poor (κ = 0.00–0.20), fair (κ = 0.21–0.40), moderate (κ = 0.41–0.60), good (κ = 0.61–0.80), or excellent (κ = 0.81–1.00) [7]. The extent of consolidation, GGO, nodules, and overall distribution were calculated using weighted kappa statistics.
Each CT finding and CT pattern were compared among the three groups using a Chi-square (χ2) test for independence. A comparison of the extent of CT findings among the three groups was performed using the Kruskal–Wallis test. A p value less than 0.05 was considered indicative of a significant difference. Furthermore, as an index of the degree of significant differences, Pearson’s χ2 value was used. When the χ2 test detected a significant difference among the groups, adjusted standardized residuals were calculated to identify the groups for which the CT findings contributed to the significant difference. An adjusted standardized residual of > 1.96 or < −1.96 was considered indicative of a group with a significantly higher or lower frequency, respectively.
Multiple logistic regression analyses were conducted to identify significant indicators for the differentiation of each group from the other two groups, for example, between infectious diseases and the two other diseases, including DILI and PIUM. The forward selection (likelihood ratio) method was used for the multiple logistic regression analyses, and all HRCT findings, including parametric factors (extent of HRCT findings), were included. All statistical analyses were performed using commercially available software (SPSS, version 24.0, IBM).
Results
The results of the comparison of HRCT findings among the three groups using the χ2 test and interobserver variabilities are shown in Table 2. Regarding the interobserver variabilities, the κ-values were generally moderate except for the κ-values for the GGO/Con distribution (fair: κ = 0.263, nodules with TIB (fair: κ = 0.265) and the overall axial distribution (fair: κ = 0.354). The χ2 test showed significant differences in more than half of the HRCT findings. The χ2 values were especially high for the GGO/Con distribution (25.93), the distribution of nodules (30.65) and the predominant CT pattern (36.14).
Table 2.
Comparison of the HRCT findings among the three groups
| Infectious disease (n = 141) | DILI (n = 24) | PIUM (n = 56) | P value | χ2 value | κ value | ||
|---|---|---|---|---|---|---|---|
| Consolidation (%) | – | 90 (64) | 14 (58) | 30 (54) | 0.401 | 1.827 | 0.518 |
| Extent (SD) | – | 0.78 [0.65] | 0.69 (0.64) | 0.72 [0.77] | 0.691+ | – | 0.570$ |
| GGO (%) | – | 128 (91) | 23 (96) | 44 (79)* | 0.03 | 7.25 | 0.540 |
| Extent (SD) | – | 1.86 [1.16] ± | 2.38 (1.09) | 1.45 [1.08] | 0.004+ | – | 0.673$ |
| Crazy-paving (%) | – | 49 (35)** | 5 (21) | 7 (13)* | 0.005 | 10.55 | 0.365 |
| Mosaic pattern (%) | – | 44 (31) | 10 (42) | 7 (13)* | 0.008 | 9.68 | 0.568 |
| GGO/con predominance (%) | Con. pred | 44 (34) | 3 (13) | 12 (27) | 0.151 | 6.73 | 0.540 |
| GGO pred | 78 (60) | 20 (87) | 30 (67) | ||||
| Equal | 8 (6) | 0 (0) | 3 (7) | ||||
|
GGO/con distribution (%) |
Segmental | 57 (44)** | 3 (13)* | 14 (31) | < 0.001 | 25.93 | 0.263 |
| Nonseg | 23 (18)* | 8 (35) | 23 (51)** | ||||
| Lobular | 50 (38) | 12 (52) | 8 (18)* | ||||
| Nodule (%) | – | 86 (61) | 10 (42) | 39 (70) | 0.063 | 5.53 | 0.469 |
| Extent [SD] | – | 0.89 [0.92] | 0.92 [1.32] | 1.15 [1.05] | 0.207+ | – | 0.568$ |
| Size (%) | Micro | 21 (24) | 6 (60)** | 10 (26) | 0.021 | 11.56 | 0.468 |
| Small | 31 (36) | 3 (30) | 7 (18)* | ||||
| Large | 34 (40) | 1 (10)* | 22 (56)** | ||||
| Distribution (%) | Centrilobular | 40 (47)** | 7 (70)** | 6 (15)* | < 0.001 | 30.65 | 0.571 |
| Perilymphatic | 7 (8)* | 0 (0) | 17 (44)** | ||||
| Random | 39 (45) | 3 (30) | 16 (41) | ||||
| Nodule with halo (%) | – | 36 (26) | 1 (4) | 12 (21) | 0.066 | 5.45 | 0.543 |
| Nodule with TIB (%) | – | 22 (16)** | 1 (4) | 1 (2)* | 0.010 | 9.15 | 0.265 |
| BVB thickening (%) | – | 60 (43) * | 10 (42) | 36 (54)** | 0.018 | 8.01 | 0.621 |
| ILS thickening (%) | – | 48 (34)* | 20 (83)** | 30 (54) | < 0.001 | 22.78 | 0.579 |
| Axial distribution (%) | Inner | 7 (5) | 0 (0) | 8 (14)** | 0.006 | 18.25 | 0.354 |
| Outer | 38 (27) | 5 (21) | 12 (21) | ||||
| Diffuse | 46 (33) | 16 (67)** | 17 (30) | ||||
| Indeterminate | 50 (35) | 3 (13)* | 19 (34) | ||||
| Craniocaudal distribution (%) | Upper | 16 (11) | 1 (4) | 10 (18) | 0.076 | 11.42 | 0.408 |
| Lower | 31 (22) | 8 (33) | 10 (18) | ||||
| Diffuse | 48 (34) | 13 (54) | 18 (32) | ||||
| Indeterminate | 46 (33) | 2 (8) | 18 (32) | ||||
| Overall distribution [SD] (SD) | – | 2.40 [1.00] | 2.81 [0.88] | 2.34 [1.01] | 0.125+ | – | 0.571$ |
|
Predominant CT pattern (%) |
Micro/small nodule | 21 (15) | 2 (8) | 10 (18) | < 0.001 | 36.14 | 0.510 |
| Large nodule | 24 (17) | 1 (4)* | 18 (32)** | ||||
| Diffuse GGO | 39 (28) | 11 (46)** | 8 (14)* | ||||
| Segmental GGO/Con | 44 (31)** | 3 (13) | 6 (11)* | ||||
| Nonseg. GGO/Con | 12 (9)* | 5 (21) | 10 (18) | ||||
| BVB/ILS thickening | 1 (1)* | 2 (8) | 4 (7)** | ||||
| LN enlargement (%) | – | 30 (21)* | 5 (21) | 30 (54)** | < 0.001 | 21.09 | 0.709 |
| Pleural effusion (%) | – | 38 (27) | 3 (13) | 18 (32) | 0.190 | 3.33 | 0.733 |
All values are presented as the number of cases, with percentages in parentheses
DILI drug-induced lung injury, PIUM pulmonary infiltration due to underlying malignancy, Cons consolidation, GGO ground-glass opacity, TIB tree-in-bud, LN lymph node, Hematol. malig hematological malignancy, pred predominance, Nonseg nonsegmental, BVB bronchovascular bundle, ILS interlobular septum, SD standard deviation
+Kruskal–Wallis test
$Weighted κ(kappa) value
* and **Chi-square (χ2) test for independence
*Significantly less frequent (adjusted standard residual < −1.96)
**Significantly more frequent (adjusted standard residual > 1.96)
Table 3 shows the detailed frequencies of HRCT findings among infectious diseases. The HRCT findings did not share the same high or low frequency among individual diseases; for example, the frequency of ILS thickening in infectious diseases was significantly higher in pneumocystis pneumonia (PCP) (45%) and cytomegalovirus (CMV) pneumonia (57%) than in other infectious diseases.
Table 3.
Detailed frequencies of HRCT findings among infectious diseases
| Infectious disease (n = 141) | |||||||
|---|---|---|---|---|---|---|---|
| Bacterial-P (n = 50) | Fungal-I (n = 34) | PCP (n = 40) | CMV (n = 7) | Septic emboli (n = 7) | TB (n = 3) | ||
| Consolidation (%) | – | 40 (80) | 18 (53) | 19 (48) | 5 (71) | 5 (71) | 3 (100) |
| GGO (%) | – | 46 (92) | 25 (74) | 40 (100) | 7 (100) | 7 (100) | 3 (100) |
| Crazy-paving (%) | – | 18 (36) | 8 (24) | 19 (48) | 4 (57) | 0 (0) | 0 (0) |
| Mosaic pattern (%) | – | 8 (16) | 3 (9) | 29 (73) | 3 (43) | 0 (0) | 1 (33) |
| GGO/con predominance (%) | Con. pred | 25 (53) | 11 (42) | 1 (3) | 1 (14) | 4 (57) | 2 (67) |
| GGO pred | 18 (38) | 12 (46) | 39 (98) | 5 (71) | 3 (43) | 1 (33) | |
| Equal | 4 (9) | 3 (12) | 0 (0) | 1 (14) | 0 (0) | 0 (0) | |
| GGO/con distribution (%) | Segmental | 33 (70) | 17 (65) | 1 (3) | 2 (29) | 2 (29) | 2 (67) |
| Nonseg | 6 (13) | 7 (27) | 3 (8) | 2 (29) | 5 (71) | 0 (0) | |
| Lobular | 8 (17) | 2 (8) | 36 (90) | 3 (43) | 0 (0) | 1 (33) | |
| Nodule (%) | – | 30 (60) | 30 (88) | 11 (28) | 5 (71) | 7 (100) | 3 (100) |
| Size (%) | Micro | 10 (33) | 5 (17) | 3 (27) | 1 (14) | 1 (14) | 1 (33) |
| Small | 9 (30) | 9 (30) | 5 (46) | 3 (43) | 3 (43) | 2 (67) | |
| Large | 11 (37) | 16 (53) | 3 (27) | 1 (14) | 3 (43) | 0 (0) | |
| Distribution (%) | Centrilobular | 17 (57) | 11 (37) | 7 (64) | 3 (43) | 0 (0) | 2 (67) |
| Perilymphatic | 2 (7) | 2 (7) | 0 (0) | 1 (14) | 2 (29) | 0 (0) | |
| Random | 11 (36) | 17 (57) | 4 (36) | 1 (14) | 5 (71) | 1 (33) | |
| Nodule with halo (%) | – | 12 (24) | 15 (44) | 2 (5) | 4 (57) | 3 (43) | 0 (0) |
| Nodule with TIB (%) | – | 10 (20) | 7 (21) | 2 (5) | 2 (29) | 0 (0) | 1 (33) |
| BVB thickening (%) | – | 30 (60) | 16 (47) | 6 (15) | 2 (29) | 4 (57) | 2 (67) |
| ILS thickening (%) | – | 19 (36) | 3 (9) | 18 (45) | 4 (57) | 3 (43) | 1 (33) |
All values are presented as the number of cases, with percentages in parentheses
Bacterial-P bacterial pneumonia, Fungal-I fungal infection, TB tuberculosis, PCP pneumocystis pneumonia, CMV-P cytomegalovirus pneumonia, GGO ground-glass opacity, Cons consolidation, TIB tree-in-bud, BVB bronchovascular bundle, ILS interlobular septum, LN lymph node, pred predominance, Nonseg nonsegmental
According to the results of the multiple logistic regression analyses, several significant indicators were detected for each group (Table 4). In infectious diseases, nodules without a perilymphatic distribution, nodules with a TIB pattern, and the absence of ILS thickening (Figs. 2, 3) were detected as useful indicators for differentiation. Among these indicators, the significance of nodules with a TIB pattern might be degraded due to low sensitivity (15.6%). Instead, the specificity (97.5%) and positive predictive value (PPV) (91.7%) for this indicator were the highest among these indicators detected by multiple logistic regression analyses. In DILI, the presence of ILS thickening (Fig. 4) was detected as a useful indicator for differentiation. In PIUM, nodules with a perilymphatic distribution and the presence of LN enlargement (Figs. 5, 6) were detected as useful indicators for differentiation.
Table 4.
Three multiple logistic regression analyses for differentiating one disease from the others.
| A. Differentiation of infectious diseases from other diseases | ||||||||||
|---|---|---|---|---|---|---|---|---|---|---|
| Infectious diseases (n = 141) | Others (n = 80) | Wald value | Odds ratio [95% CI] | P value | Sensitivity | Specificity | Accuracy | PPV | NPV | |
| Nodular distribution | ||||||||||
|
Perilymphatic Others |
7 (8) 79 (92) |
17(35) 32(65) |
6.287 |
– 4.464 [1.355, 11.904] |
0.012 | 91.9% | 34.7% | 71.1% | 71.2% | 70.8% |
| Tree-in-bud | ||||||||||
|
Positive Negative |
22 (16) 119 (84) |
2 (3) 78 (98) |
6.512 |
8.364 [1.637, 42.741] – |
0.011 | 15.6% | 97.5% | 45.2% | 91.7% | 39.6% |
| ILS thickening | ||||||||||
|
Positive Negative |
48 (34) 93 (66) |
50 (63) 30 (38) |
9.032 |
– 3.621 [1.565, 8.381] |
0.003 | 66.0% | 62.5% | 64.7% | 75.6% | 51.0% |
| B. Differentiation of DILI from other diseases | ||||||||||
|---|---|---|---|---|---|---|---|---|---|---|
| DILI (n = 24) | Others (n = 197) | Wald value | Odds ratio [95% CI] | P value | Sensitivity | Specificity | Accuracy | PPV | NPV | |
| ILS thickening | ||||||||||
|
Positive Negative |
20 (83) 4 (17) |
78 (40) 119 (60) |
11.921 |
7.166 [2.343, 21.915] – |
0.001 | 83.3% | 60.4% | 62.9% | 20.4% | 96.7% |
| C. Differentiation of PIUM from other diseases | ||||||||||
|---|---|---|---|---|---|---|---|---|---|---|
| PIUM (n = 56) | Others (n = 165) | Wald value | Odds ratio [95% CI] | P value | Sensitivity | Specificity | Accuracy | PPV | NPV | |
| Nodular distribution | ||||||||||
|
Perilymphatic Others |
17 (44) 22 (56) |
7 (7) 89 (93) |
6.497 |
4.256 [1.397,12.961] – |
0.011 | 43.6% | 92.7% | 78.5% | 70.8% | 80.2% |
| LN enlargement | ||||||||||
|
Positive Negative |
30 (54) 26 (46) |
35 (21) 130 (79) |
7.114 |
3.420 [1.385, 8.441] – |
0.008 | 53.6% | 78.8% | 72.4% | 46.2% | 83.3% |
All values in parentheses show percentages.
DILI drug-induced lung injury, PIUM pulmonary infiltration due to underlying malignancy, ILS interlobular septum, BVB bronchovascular bundle, LN lymph node
PPV positive predictive value, NPV negative predictive value
Fig. 2.
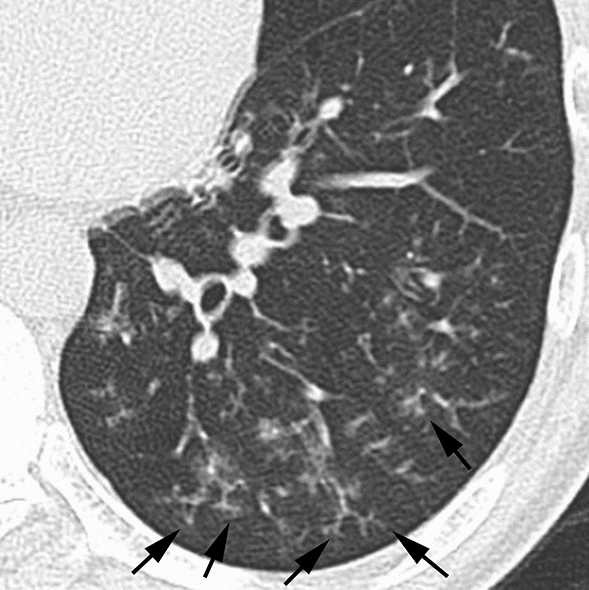
Infectious disease (bacterial pneumonia) in a 56-year-old male patient with acute myelogenous leukemia. HRCT image of the left lower lung showing nodules with a centrilobular distribution and TIB pattern (arrows). Note that ILS thickening is not evident
Fig. 3.
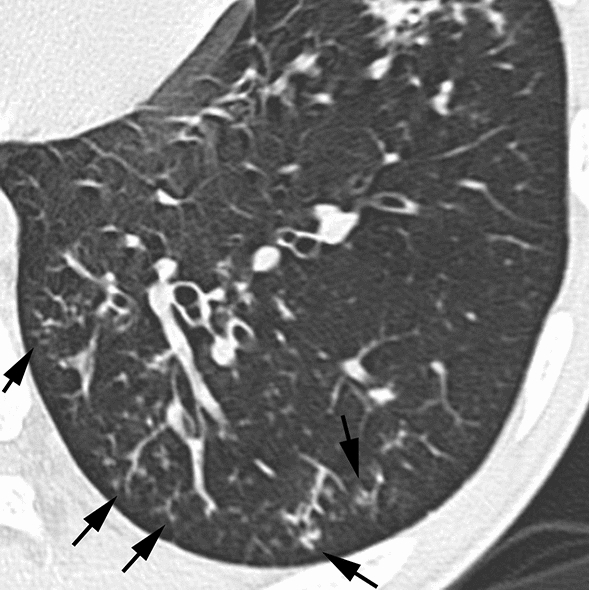
Infectious disease (invasive aspergillosis) in an 18-year-old male patient with acute myelogenous leukemia. HRCT image of the left lower lung showing nodules with a centrilobular distribution and TIB pattern (arrows). Note that ILS thickening is not evident
Fig. 4.
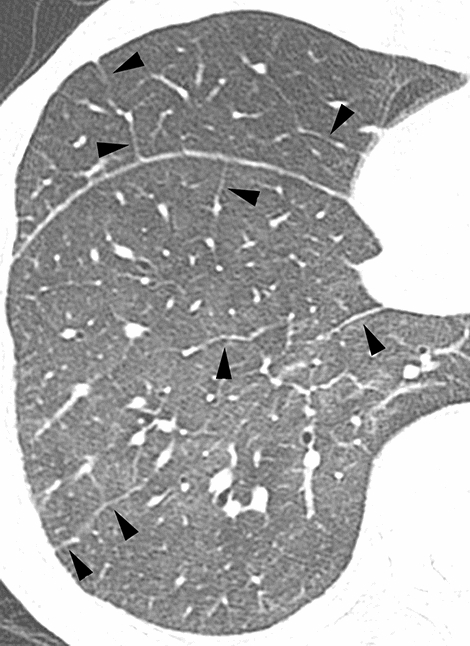
Drug-induced lung injury in a 65-year-old male patient with multiple myeloma.HRCT image of the right lower lung showing extensive GGO and ILS thickening (arrowheads). Note also that nodules are not evident
Fig. 5.
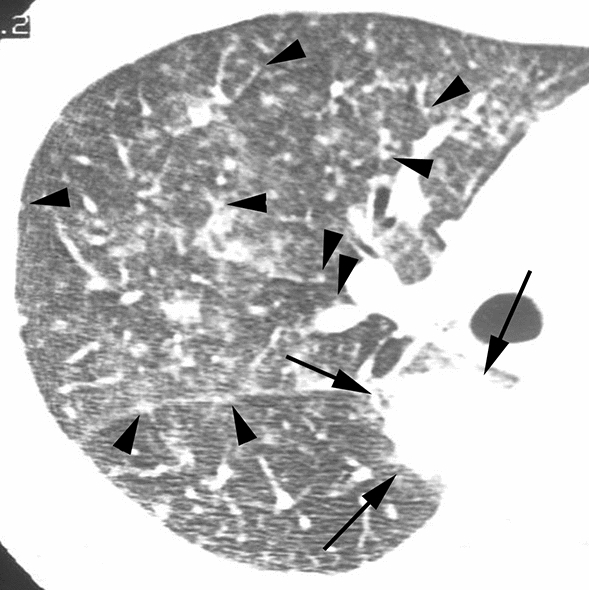
Pulmonary infiltration due to underlying malignancy (leukemic infiltration) in a 44-year-old male patient with acute myelogenous leukemia.HRCT image of the right middle lung showing multiple nodules varying in size. Note that small nodules are attached to the pleura or thickened BVB (arrowheads), with differences in the number of nodules in the segments, reflecting a perilymphatic distribution rather than a random distribution. Note also that a large nodule is observed in the right lower lobe (arrows)
Fig. 6.

Pulmonary infiltration due to underlying malignancy (lymphoma infiltration) in a 23-year-old male patient with non-Hodgkin lymphoma. HRCT image of the right upper lung showing multiple nodules varying in size (arrowheads), some of which attached to the pulmonary arteries, veins, or ILS, reflecting a perilymphatic distribution. Note the enlargement of the mediastinum with LN enlargement (arrows), which is not clear due to the lung window setting of this CT image
Considering the highest χ2 values of a predominant CT pattern (36.14), the predominant CT pattern might be worth adding to the useful CT findings even though it was not detected as a significant indicator according to the multiple logistic regression analyses; a segmental GGO/Con pattern is frequent in infectious diseases, a diffuse GGO pattern is common in DILI, and large nodules or a BVB/ILS thickening pattern is frequently found in PIUM (Table 2). Furthermore, concerning the extent of HRCT findings, the extent of GGO was only detected as a significant factor by the Kruskal–Wallis test; DILI showed the highest extent of GGO, which might also be worth adding to the useful CT findings (Fig. 4).
Discussion
It should be noted that all 221 subjects included in the current study were previously used in another study of 555 subjects that compared HRCT findings between infectious and noninfectious diseases [6]; however, the current study included only patients with hematological malignancies after chemotherapy or HSCT, while the previous report included immunocompromised patients other than hematological malignancies. Furthermore, while the previous report compared HRCT findings between patients with infectious diseases and noninfectious diseases, the current study compared those among infectious diseases, DILI, and PIUM; therefore, the purpose of the current study differs from that of the previous report.
According to the results of the multiple logistic regression analyses, ILS thickening is a significant indicator for the differentiation of infectious disease and DILI; the absence of ILS thickening is an indicator that differentiates infectious disease from the other two entities, while the presence of ILS thickening is also an indicator that differentiates DILI from the other two entities. Nodules with a perilymphatic distribution are also a significant indicator for the differentiation of infectious diseases and PIUM; nodules without a perilymphatic distribution are an indicator differentiating infectious diseases from the other two entities, while nodules with a perilymphatic distribution are also an indicator differentiating PIUM from the other two entities.
ILS thickening is observed in several interstitial lung diseases [8, 9], and has also been reported as a frequent HRCT finding in DILI [8, 10, 11]. According to two reports, ILS thickening was observed in 67% and 75% of patients with DILI [10, 11]. ILS thickening was also more frequent in PIUM, although the difference was not statistically significant. ILS thickening has been reported as a relatively frequent finding in leukemic infiltration; its frequency has been reported to be 33% [12], 55% [13], and 100% [14]. On the other hand, ILS thickening has not been a frequent HRCT finding for infectious diseases except for PCP and CMV pneumonia [15, 16]. In bacterial pneumonia or fungal infection, ILS thickening has been reported as an infrequent finding; according to the two reports, the frequency of ILS thickening in bacterial pneumonia and fungal infection was 0% for both diseases in one report [5] and 5 and 0%, respectively, in another report[17]. Concerning PCP and CMV pneumonia, ILS thickening has been reported as a relatively frequent finding (40–50%) in PCP and CMV pneumonia in two reports [15, 16]. In fact, ILS thickening was relatively frequent in PCP and CMV pneumonia in the current study (45 and 57%, respectively). Therefore, PCP or CMV pneumonia as well as noninfectious diseases should be considered as a possible diagnosis when ILS thickening is observed. Concerning the mechanisms of ILS thickening in PCP or CMV pneumonia, it is speculated that this finding may reflect the thickening of the interstitium or dilated lymphatics resulting from the organization of intraalveolar exudates [18]. However, since ILS thickening has not been reported as a predominant HRCT finding for PCP or CMV pneumonia [19–27] and other characteristic HRCT findings exist in these two entities [15, 16, 22, 26, 27], we believe that it is not so difficult to differentiate these two entities from DILI.
Nodules with a perilymphatic distribution correspond to infiltration of malignant cells or inflammatory cells or the presence of granulomatous lesions along or adjacent to the lymphatic channel within the lung, which sometimes creates nodular lesions and could be evident in lymphangitic carcinomatosis, leukemic or lymphoma infiltration, lymphocytic interstitial pneumonia, amyloidosis, and sarcoidosis. In leukemic or lymphoma infiltration, this finding and BVB thickening are frequently observed [13, 14, 28]. In infectious diseases, nodules without a perilymphatic distribution, namely, nodules with a centrilobular or random distribution, are frequently observed, with a centrilobular distribution often observed in bacterial pneumonia, fungal infection, CMV pneumonia, and tuberculosis, and with a random distribution often observed in CMV pneumonia and miliary tuberculosis [18].
In infectious diseases, in addition to the indicators of nodules without a perilymphatic distribution and the absence of ILS thickening, nodules with a TIB pattern were detected as a significant indicator according to the multiple logistic regression analyses. In the report by Okada et al., who dealt with 533 patients with centrilobular findings, the presence of centrilobular nodules with a TIB pattern strongly suggested the likelihood of infectious diseases [29]. However, the significance of nodules with a TIB pattern might be deducted due to low sensitivity (15.6%). One of the reasons for this low sensitivity is that the infectious disease group is not a uniform group. In fact, nodules with a TIB pattern are not frequent findings in PCP and septic emboli. Despite the low sensitivity of this finding, the specificity (97.5%) and PPV (91.7%) were the highest among the indicators detected by the multiple logistic regression analyses. Therefore, once this finding is detected, the possibility of infectious diseases may increase.
In DILI, in addition to ILS thickening detected as an indicator for its differentiation from the other two entities by multiple logistic regression analyses, GGO was more extensive in DILI than in the other two entities according to the Kruskal–Wallis test. In DILI, several HRCT patterns, including diffuse alveolar damage (DAD), nonspecific interstitial pneumonia (NSIP), hypersensitivity pneumonia (HP), organizing pneumonia and eosinophilic pneumonia patterns, have been reported [11, 30–33]. In these HRCT patterns, particularly in the DAD, HP, and NSIP patterns, extensive GGO is a characteristic HRCT finding, which might support the results of more extensive GGO in patients with DILI.
In PIUM, including lymphoma infiltration and leukemic infiltration, multiple logistic regression analysis detected nodules with a perilymphatic distribution as a significant indicator. In these diseases, pathological analyses have revealed that malignant cells infiltrate along or adjacent to the lymphatic channels along the bronchovascular bundles and pulmonary veins within the lungs, corresponding to the HRCT findings of nodules with a perilymphatic distribution. LN enlargement is also a key indicator discriminating PIUM from the other two entities according to multiple logistic regression analyses. The frequencies of LN enlargement in lymphoma infiltration and leukemic infiltration were relatively high (35% [34] and 55% [13], respectively). Thus, PIUM exhibited two HRCT findings that were associated with the lymphatic route within the lung.
Furthermore, several predominant CT patterns were detected according to the χ2 test results, although these were not detected as significant indicators according to the multiple logistic regression analyses: the segmental GGO/Con pattern was frequent in infectious diseases, diffuse GGO was often found in DILI, and large nodules and a BVB/ILS thickening pattern were common in PIUM. These patterns seem to reflect characteristic HRCT findings detected according to the multiple logistic regression analyses and χ2 test results, as mentioned above.
The current study has several limitations. First, the nature of this study was retrospective; therefore, the CT protocols and diagnostic procedures were diverse. Second, we divided the chest complications of these patients into three categories even though infectious diseases were diverse. Each disease in the infectious disease group has characteristic findings; therefore, the infectious disease group is a heterogeneous group. Establishing an inclusive group of infectious diseases consisting of several different entities may be controversial. However, it might be valuable to detect three indicators by multiple logistic regression analysis despite the heterogeneity of an infectious group. Third, the number of patients with DILI was relatively small compared with the numbers of patients with the other two entities. The diagnosis of DILI remains difficult and depends on the exclusion of other causes. No true gold standard test is available, and no specific histologic appearance is useful for the confirmation of the diagnosis, which seems to be the main reason why we had only a small number of patients with DILI. Fourth, the sensitivity of some indicators that were detected using multiple logistic regression analysis, including nodules with tree-in-bud patterns in infectious diseases, nodules with a perilymphatic distribution and LN enlargement in PIUM, was relatively low. This is a disadvantageous problem in this study. Instead, the specificity of these indicators was relatively high; therefore, once these findings are detected, the possibility of these diseases may increase. Finally, several other important diseases that should be considered as a possible diagnosis in clinical practice, including pulmonary hemorrhage, pulmonary edema, and idiopathic pneumonia syndrome, were excluded from this study because, this time, we aimed to differentiate only among three groups of infectious diseases, DILI, and PIUM. The results might have changed if these diseases had been included in this study.
Diagnosing chest complications in patients with hematological malignancies is not often straightforward, and one of the main concerns for clinicians who treat chest complications in such patients might be whether the pathology is an infectious disease, DILI, or PIUM. We detected several HRCT indicators among the three entities using a relatively large number of patients. To the best of our knowledge, this study dealt with the largest number of patients in the differential diagnosis among infectious diseases, DILI, and PIUM, which might be the essential advantageous point in the current study.
In conclusion, according to the statistical analyses including multiple logistic regression analyses, several HRCT findings were detected as characteristic for differentiating among infectious diseases, DILI, and PIUM in 221 patients with hematological malignancies who underwent chemotherapy or HSCT: nodules without a perilymphatic distribution, nodules with a TIB pattern, and the absence of ILS thickening in infectious diseases; the presence of ILS thickening and a wider extent of GGO in DILI; and nodules with a perilymphatic distribution and the presence of LN enlargement in PIUM.
Declarations
We declare that this work has not been published previously, that it is not under consideration for publication elsewhere, that its publication is approved by all authors and tacitly or explicitly by the responsible authorities where the work was carried out, and that, if accepted, it will not be published elsewhere in the same form, in English or in any other language, including electronically without the written consent of the copyright-holder
Conflict of interest
The authors declare that they have no conflict of interest. They also declare that there has been no significant financial support for this work that could have influenced its outcome.
Ethical approval
The institutional review board of the institution approved this study. The requirement for informed consent was waived due to the retrospective design.The authors declare that they preserve ethical standards as laid down in the 1964 Declaration of Helsinki.
Footnotes
Publisher's Note
Springer Nature remains neutral with regard to jurisdictional claims in published maps and institutional affiliations.
Contributor Information
Nobuyuki Tanaka, Email: golfernt17@me.com.
Yoshie Kunihiro, Email: kyoshie@yamaguchi-u.ac.jp.
Reo Kawano, Email: rkawano@hiroshima-u.ac.jp.
Toshiaki Yujiri, Email: yujirit@yamaguchi-u.ac.jp.
Kazuhiro Ueda, Email: uedakazu@m.kufm.kagoshima-u.ac.jp.
Toshikazu Gondo, Email: toshigondo@gmail.com.
Taiga Kobayashi, Email: madtiger298@yahoo.co.jp.
Tsuneo Matsumoto, Email: matsumoto@yhoken.jp.
References
- 1.Brown MJ, Miller RR, Muller NL. Acute lung disease in the immunocompromised host: CT and pathologic examination findings. Radiology. 1994;190(1):247–254. doi: 10.1148/radiology.190.1.8259414. [DOI] [PubMed] [Google Scholar]
- 2.Primack SL, Muller NL. High-resolution computed tomography in acute diffuse lung disease in the immunocompromised patient. Radiol Clin N Am. 1994;32(4):731–744. doi: 10.1016/S0033-8389(22)00405-5. [DOI] [PubMed] [Google Scholar]
- 3.Tanaka N, Matsumoto T, Miura G, Emoto T, Matsunaga N. HRCT findings of chest complications in patients with leukemia. Eur Radiol. 2002;12(6):1512–1522. doi: 10.1007/s003300101112. [DOI] [PubMed] [Google Scholar]
- 4.Worthy S, Kang EY, Muller NL. Acute lung disease in the immunocompromised host: differential diagnosis at high-resolution CT. Semin Ultrasound CT MR. 1995;16(5):353–360. doi: 10.1016/0887-2171(95)90024-1. [DOI] [PubMed] [Google Scholar]
- 5.Hartman TE, Primack SL, Muller NL, Staples CA. Diagnosis of thoracic complications in AIDS: accuracy of CT. AJR Am J Roentgenol. 1994;162(3):547–553. doi: 10.2214/ajr.162.3.8109494. [DOI] [PubMed] [Google Scholar]
- 6.Tanaka N, Kunihiro Y, Kawano R, Yujiri T, Ueda K, Gondo T, et al. Chest complications in immunocompromised patients without acquired immunodeficiency syndrome (AIDS): differentiation between infectious and non-infectious diseases using high-resolution CT findings. Clin Radiol. 2021;76(1):50–59. doi: 10.1016/j.crad.2020.07.029. [DOI] [PubMed] [Google Scholar]
- 7.Maclure M, Willett WC. Misinterpretation and misuse of the kappa statistic. Am J Epidemiol. 1987;126(2):161–169. doi: 10.1093/aje/126.2.161. [DOI] [PubMed] [Google Scholar]
- 8.Andreu J, Hidalgo A, Pallisa E, Majo J, Martinez-Rodriguez M, Caceres J. Septal thickening: HRCT findings and differential diagnosis. Curr Probl Diagn Radiol. 2004;33(5):226–237. doi: 10.1067/j.cpradiol.2004.06.001. [DOI] [PubMed] [Google Scholar]
- 9.HRCT findings: linear and reticular opacities. In: Webb WR MN, Naidich DP, editor. High-resolution CT of the lung. 5th edn. Philadelphia: Wolters Kluwer Health; 2015. p. 74–105.
- 10.Akira M, Ishikawa H, Yamamoto S. Drug-induced pneumonitis: thin-section CT findings in 60 patients. Radiology. 2002;224(3):852–860. doi: 10.1148/radiol.2243011236. [DOI] [PubMed] [Google Scholar]
- 11.Cleverley JR, Screaton NJ, Hiorns MP, Flint JD, Muller NL. Drug-induced lung disease: high-resolution CT and histological findings. Clin Radiol. 2002;57(4):292–299. doi: 10.1053/crad.2001.0792. [DOI] [PubMed] [Google Scholar]
- 12.Okada F, Sato H, Omeri AK, Ono A, Tokuyama K, Ando Y, et al. Chest HRCT findings in acute transformation of adult T-cell lymphoma/leukemia. Eur Radiol. 2015;25(6):1607–1613. doi: 10.1007/s00330-014-3565-3. [DOI] [PubMed] [Google Scholar]
- 13.Tanaka N, Matsumoto T, Miura G, Emoto T, Matsunaga N, Satoh Y, et al. CT findings of leukemic pulmonary infiltration with pathologic correlation. Eur Radiol. 2002;12(1):166–174. doi: 10.1007/s003300101013. [DOI] [PubMed] [Google Scholar]
- 14.Heyneman LE, Johkoh T, Ward S, Honda O, Yoshida S, Muller NL. Pulmonary leukemic infiltrates: high-resolution CT findings in 10 patients. AJR Am J Roentgenol. 2000;174(2):517–521. doi: 10.2214/ajr.174.2.1740517. [DOI] [PubMed] [Google Scholar]
- 15.Vogel MN, Brodoefel H, Hierl T, Beck R, Bethge WA, Claussen CD, et al. Differences and similarities of cytomegalovirus and pneumocystis pneumonia in HIV-negative immunocompromised patients thin section CT morphology in the early phase of the disease. Br J Radiol. 2007;80(955):516–523. doi: 10.1259/bjr/39696316. [DOI] [PubMed] [Google Scholar]
- 16.Kunihiro Y, Tanaka N, Matsumoto T, Yamamoto N, Matsunaga N. The usefulness of a diagnostic method combining high-resolution CT findings and serum markers for cytomegalovirus pneumonia and pneumocystis pneumonia in non-AIDS patients. Acta Radiol. 2015;56(7):806–813. doi: 10.1177/0284185114539320. [DOI] [PubMed] [Google Scholar]
- 17.Demirkazik FB, Akin A, Uzun O, Akpinar MG, Ariyurek MO. CT findings in immunocompromised patients with pulmonary infections. Diagn Interv Radiol. 2008;14(2):75–82. [PubMed] [Google Scholar]
- 18.Infection. In: Webb WRMN, Naidich DP editors. High-resolution CT of the lung, 5th edn. Philadelphia: Wolters Kluwer Health, 2015;p. 429–80.
- 19.Bergin CJ, Wirth RL, Berry GJ, Castellino RA. Pneumocystis carinii pneumonia: CT and HRCT observations. J Comput Assist Tomogr. 1990;14(5):756–759. doi: 10.1097/00004728-199009000-00014. [DOI] [PubMed] [Google Scholar]
- 20.Kanne JP, Yandow DR, Meyer CA. Pneumocystis jiroveci pneumonia: high-resolution CT findings in patients with and without HIV infection. AJR Am J Roentgenol. 2012;198(6):W555–W561. doi: 10.2214/AJR.11.7329. [DOI] [PubMed] [Google Scholar]
- 21.Tasaka S, Tokuda H, Sakai F, Fujii T, Tateda K, Johkoh T, et al. Comparison of clinical and radiological features of pneumocystis pneumonia between malignancy cases and acquired immunodeficiency syndrome cases: a multicenter study. Intern Med. 2010;49(4):273–281. doi: 10.2169/internalmedicine.49.2871. [DOI] [PubMed] [Google Scholar]
- 22.Franquet T, Lee KS, Muller NL. Thin-section CT findings in 32 immunocompromised patients with cytomegalovirus pneumonia who do not have AIDS. AJR Am J Roentgenol. 2003;181(4):1059–1063. doi: 10.2214/ajr.181.4.1811059. [DOI] [PubMed] [Google Scholar]
- 23.Horger MS, Pfannenberg C, Einsele H, Beck R, Hebart H, Lengerke C, et al. Cytomegalovirus pneumonia after stem cell transplantation: correlation of CT findings with clinical outcome in 30 patients. AJR Am J Roentgenol. 2006;187(6):W636–W643. doi: 10.2214/AJR.04.1592. [DOI] [PubMed] [Google Scholar]
- 24.Gasparetto EL, Ono SE, Escuissato D, Marchiori E, Roldan L, Marques HL, et al. Cytomegalovirus pneumonia after bone marrow transplantation: high resolution CT findings. Br J Radiol. 2004;77(921):724–727. doi: 10.1259/bjr/70800575. [DOI] [PubMed] [Google Scholar]
- 25.Moon JH, Kim EA, Lee KS, Kim TS, Jung KJ, Song JH. Cytomegalovirus pneumonia: high-resolution CT findings in ten non-AIDS immunocompromised patients. Korean J Radiol. 2000;1(2):73–78. doi: 10.3348/kjr.2000.1.2.73. [DOI] [PMC free article] [PubMed] [Google Scholar]
- 26.Tanaka N, Kunihiro Y, Yanagawa N. Infection in immunocompromised hosts: imaging. J Thorac imaging. 2018;33(5):306–321. doi: 10.1097/RTI.0000000000000342. [DOI] [PubMed] [Google Scholar]
- 27.Franquet T. Imaging of pulmonary viral pneumonia. Radiology. 2011;260(1):18–39. doi: 10.1148/radiol.11092149. [DOI] [PubMed] [Google Scholar]
- 28.Tanaka N, Matsumoto T, Furukawa M, Tokuda O. Leukemia. In: Guermazi A, editor. Radiological imaging in hamatological malignancies. Berlin: Springer; 2004. pp. 351–366. [Google Scholar]
- 29.Okada F, Ando Y, Yoshitake S, Ono A, Tanoue S, Matsumoto S, et al. Clinical/pathologic correlations in 553 patients with primary centrilobular findings on high-resolution CT scan of the thorax. Chest. 2007;132(6):1939–1948. doi: 10.1378/chest.07-0482. [DOI] [PubMed] [Google Scholar]
- 30.Ellis SJ, Cleverley JR, Muller NL. Drug-induced lung disease: high-resolution CT findings. AJR Am J Roentgenol. 2000;175(4):1019–1024. doi: 10.2214/ajr.175.4.1751019. [DOI] [PubMed] [Google Scholar]
- 31.Silva CI, Muller NL. Drug-induced lung diseases: most common reaction patterns and corresponding high-resolution CT manifestations. Semin Ultrasound CT MR. 2006;27(2):111–116. doi: 10.1053/j.sult.2006.01.001. [DOI] [PubMed] [Google Scholar]
- 32.Rossi SE, Erasmus JJ, McAdams HP, Sporn TA, Goodman PC. Pulmonary drug toxicity: radiologic and pathologic manifestations. Radiographics. 2000;20(5):1245–1259. doi: 10.1148/radiographics.20.5.g00se081245. [DOI] [PubMed] [Google Scholar]
- 33.Sakai F, Johkoh T, Kusumoto M, Arakawa H, Takahashi M. Drug-induced interstitial lung disease in molecular targeted therapies: high-resolution CT findings. Int J Clin Oncol. 2012;17(6):542–550. doi: 10.1007/s10147-012-0489-2. [DOI] [PubMed] [Google Scholar]
- 34.Lewis ER, Caskey CI, Fishman EK. Lymphoma of the lung: CT findings in 31 patients. AJR Am J Roentgenol. 1991;156(4):711–714. doi: 10.2214/ajr.156.4.2003430. [DOI] [PubMed] [Google Scholar]