Abstract
Within the tumour microenvironment, CD4+ T cells can promote or suppress antitumour responses through the recognition of antigens presented by human leukocyte antigen (HLA) class II molecules1,2, but how cancers co-opt these physiologic processes to achieve immune evasion remains incompletely understood. Here we performed in-depth analysis of the phenotype and tumour specificity of CD4+ T cells infiltrating human melanoma specimens, finding that exhausted cytotoxic CD4+ T cells could be directly induced by melanoma cells through recognition of HLA class II-restricted neoantigens, and also HLA class I-restricted tumour-associated antigens. CD4+ T regulatory (TReg) cells could be indirectly elicited through presentation of tumour antigens via antigen-presenting cells. Notably, numerous tumour-reactive CD4+ TReg clones were stimulated directly by HLA class II-positive melanoma and demonstrated specificity for melanoma neoantigens. This phenomenon was observed in the presence of an extremely high tumour neoantigen load, which we confirmed to be associated with HLA class II positivity through the analysis of 116 melanoma specimens. Our data reveal the landscape of infiltrating CD4+ T cells in melanoma and point to the presentation of HLA class II-restricted neoantigens and direct engagement of immunosuppressive CD4+ TReg cells as a mechanism of immune evasion that is favoured in HLA class II-positive melanoma.
Antigen-specific CD4+ T cells have a central role in adaptive immunity1, since they can polarize immune responses as T helper cells, orchestrate humoral responses as T follicular helper (TFH) cells, modulate the activity of effector cells as TReg cells, or directly kill targets as cytotoxic T cells2. Several studies have demonstrated the presence of CD4+ tumour-infiltrating lymphocytes (TILs) in diverse cancers3–7 and that they can have a role in determining the outcome of therapies8,9. Although CD4+ TILs can be elicited though the interaction of T cell receptors (TCRs) with peptide–HLA class II complexes expressed on target cells1,2, the mechanisms driving their activation within the tumour microenvironment (TME) remain unclear10, especially since only a minority of tumours express HLA class II molecules at high levels11,12. Therefore, how CD4+ TILs interact with tumour cells and the identity of the tumour antigens that can elicit cytotoxic or regulatory responses remain poorly understood.
Here we performed single-cell characterization of CD4+ TILs from human melanomas with low or high expression of HLA class II and used TCR reconstruction to reveal the tumour specificity of CD4+ TILs. By testing TCR reactivity against autologous patient-derived melanoma cell lines (pdMel-CLs) or antigen-presenting cells (APCs) loaded with tumour lysates, we assessed the capacity of CD4+ TCRs to directly or indirectly recognize tumour cells. Our studies thus enabled the unambiguous linking of the phenotypes and antigen specificities of antitumour CD4+ TILs.
Cell states of CD4+ TIL TCR clonotypes
We profiled CD4+ TILs in five tumour specimens collected prior to immune checkpoint blockade from four previously reported patients13 (Pt-A, Pt-B, Pt-C and Pt-D) with stage III/IV melanoma (Supplementary Table 1). We characterized CD45− and CD45+CD3+ TIL fractions by high-throughput single-cell RNA sequencing (scRNA-seq) and single-cell TCR sequencing (scTCR-seq) coupled with detection of surface proteins (that is, cellular indexing of transcriptomes and epitopes by sequencing14 (CITE-seq)) (Fig. 1a, Supplementary Table 2). PdMel-CLs that faithfully recapitulated the genomic and transcriptomic features of parental tumours were generated as described13.
Fig. 1 |. Melanoma HLA class II expression and phenotype of CD4+ TIL TCR clonotypes.
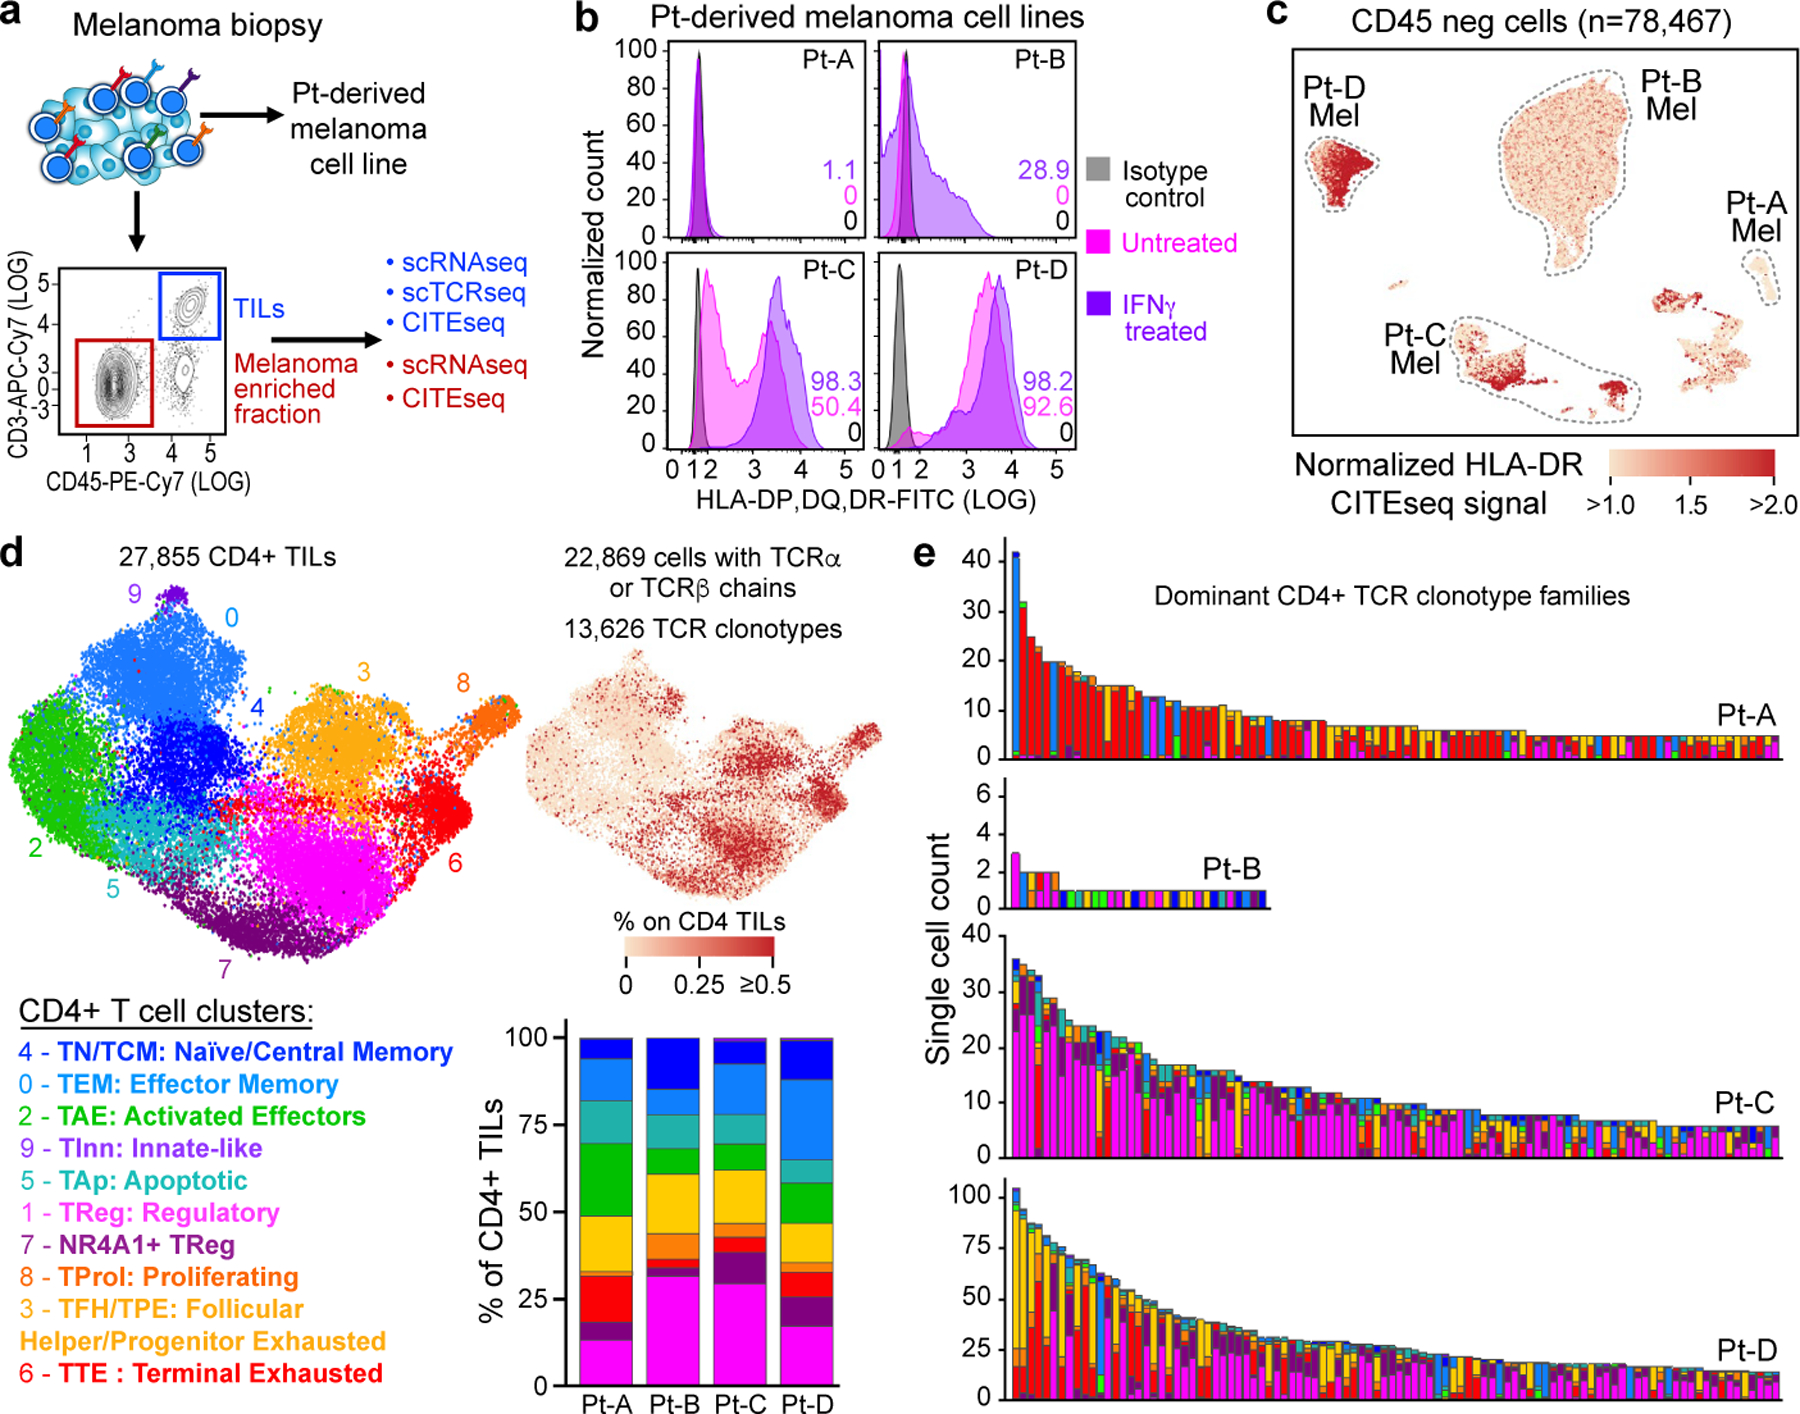
a, Schematic of processing and single-cell sequencing analysis of melanoma samples. b, Flow cytometric assessment of HLA class II expression in 4 pdMel-CLs under basal culture conditions (magenta) or on exposure to IFNγ for 72 h (purple), compared with isotype control (grey). c, Uniform manifold approximation and projection (UMAP) of scRNA-seq data from tumour-enriched CD45− cells isolated from melanomas from four patients. Clusters of patients’ melanoma cells (Mel) were inferred on the basis of markers reported in Extended Data Fig. 1a–c. Colour indicates surface HLA-DR expression as determined by CITE-seq. d, UMAP of inferred cell states from scRNA-seq data of CD4+ TILs. Right, CD4+ TILs on the same UMAP, annotated for intra-patient TCR-clone frequency (defined by scTCR-seq). Bottom right, cluster frequencies among CD4+ TILs from the four patients. e, Cluster distribution of the top 100 CD4+ TCR clonotype families from melanomas from the four patients. Colours indicate cell states, as delineated in d.
To evaluate whether melanomas could directly stimulate CD4+ TILs, we assessed expression of HLA class II in tumours. Flow cytometry analysis showed that HLA class II was not expressed in pdMel-CLs from Pt-A and Pt-B, and remained negative in Pt-A even under inflammatory conditions (with interferon-γ (IFNγ) treatment) (Fig. 1b). By contrast, pdMel-CLs from Pt-C and Pt-D showed evident baseline expression of HLA class II, which was confirmed in the parental primary tumours by scRNA-seq and CITE-seq (Fig. 1c, Extended Data Fig. 1a–f,). Immunohistochemistry (IHC) staining of primary specimens confirmed the expression of HLA class II in tumours (Extended Data Fig. 1g), which was maintained over time in biopsies serially collected from Pt-C. We also observed consistency and stability of HLA class II expression between pdMel-CLs and parental tumours in 8 pdMel-CLs generated from 17 independent treatment-naive melanomas and cultured without an inflammatory milieu (Extended Data Fig. 1h, i, Supplementary Table 3). Indeed, a subset of melanomas showed constitutive and stable presentation of surface HLA class II complexes.
To determine whether these disparate patterns of melanoma HLA class II expression were mirrored by diverse landscapes of CD4+ TILs, we analysed 27,855 CD4+ TILs characterized by scRNA-seq and CITE-seq13 (Supplementary Table 4). The CD4+ TILs segregated into ten clusters (Fig. 1d, top, Extended Data Fig. 2a, Supplementary Table 5) based on the expression of T cell-related genes and enrichment of gene signatures from external single-cell datasets4–6 (Extended Data Fig. 2b–e). This process (Supplementary Results) led us to define major CD4+ T cell phenotypes, such as naive T (TN) and central memory T (TCM), effector memory T (TEM,), activated effector T (TAE) and terminally exhausted (TTE) TILs and TFH cells with features of progenitor exhausted (TPE) TILs (TFH/TPE)15. We further identified two TReg clusters, exhausted proliferating cells (TProl), apoptotic cells (TAp) and rare CD4+ cells with receptors of innate-like cells (TInn).
To assess the relationship between phenotype and TCR clonality, we used scTCR-seq to identify TCR αβ-chains from 22,869 cells that were grouped into 13,626 distinct CD4+ clonotypes (Extended Data Fig. 3a, Supplementary Table 4). Highly expanded clones were distributed among exhausted CD4+ TILs (TTE, TFH/TPE and TProl; Fig. 1d, right), but also among TReg TILs, as confirmed by the skewing of TCR diversity in these clusters (Extended Data Fig. 3b). The cellular phenotypes within each expanded CD4+ TIL TCR clonotype were highly homogeneous (Extended Data Fig. 3c) and appeared to follow three distinct major patterns (Fig. 1e, Extended Data Fig. 3d): (1) the predominant acquisition of an exhausted phenotype (TEx), comprising TTE, TFH/TPE and TProl cells; (2) the predominant acquisition of a non-exhausted memory phenotype (TNExM), comprising TN/TCM, TEM and TAE; and (3) the acquisition of a TReg fate. This enabled the assignment of one of these three patterns to each expanded TCR clonotype as the dominant ‘primary phenotype’. Notably, we observed that clonal expansion of CD4+ TReg TILs was far greater within the TME of the HLA class II-positive (HLA class IIpos) tumours from Pt-C and Pt-D (Fig. 1e).
Tumour-reactivity of CD4+ TIL TCRs
We sought to determine whether the TCR clonotypes from these diverse CD4+ phenotypic patterns were characterized by differences in the extent of tumour recognition. Given the marked expansion of TReg clonotypes in HLA class IIpos melanomas, we further hypothesized that such tumours could directly control the presentation of antigens to CD4+ TILs, thereby orchestrating the activation of both effector cells and potentially immunosuppressive TReg cells. From patients with high numbers of CD4+ TILs (Pt-A, Pt-C and Pt-D), we reconstructed 19 TNExM TCRs, 56 TEx TCRs (distributed across 18 TFH/TPE TCRs and 38 TTE/TProl TCRs) and 56 TReg TCRs and expressed them in T cells from healthy donors (Methods). We determined tumour-specific reactivity on the basis of the upregulation of the activation molecule CD13716, following co-culture of CD4+ TCR-transduced cells with autologous pdMel-CLs that were either pretreated or not with IFNγ to induce HLA class II upregulation. In parallel, we also tested the TCRs against non-tumour controls—autologous peripheral blood mononuclear cells (PBMCs), B cells and Epstein–Barr virus (EBV)-immortalized lymphoblastoid cell lines (EBV-LCLs) (Extended Data Fig. 4a, b).
We found the TNExM TCRs to be poorly tumour-reactive, since only one of the TCRs derived from Pt-D exhibited moderate recognition of autologous tumour (Fig. 2a); notably, three out of six TNExM TCRs from Pt-A demonstrated viral reactivity, as shown by the specific recognition of EBV-infected targets. By contrast, the CD4+ TEx compartment was enriched for antitumour specificities. TTE/TProl phenotypes were the most enriched in tumour-specific reactivity across all 3 patients, with 32 out of 38 (84%) TCRs demonstrating tumour-specific activation. For TFH/TPE phenotypes, 5 out of 18 (28%) TCRs exhibited modest tumour recognition, exclusively in patients with HLA class IIpos melanoma (Pt-C and Pt-D). Strikingly, only in Pt-C and Pt-D, the TReg clusters were highly enriched for tumour-specific TCRs (28 out of 41 (68%) TReg TCRs). These data thus show that HLA class IIpos melanomas can directly engage and stimulate TCRs expressed by CD4+ TILs with potential immunosuppressive capabilities (Fig. 2a, bottom row, Extended Data Fig. 4c). Consistently, TCRs cloned from TReg and TEx clusters, but not those cloned from TNExM clusters, conferred both activation and cytotoxic potential to transduced lymphocytes (Extended Data Fig. 4d).
Fig. 2 |. Tumour reactivity of TCRs from CD4+ TIL.
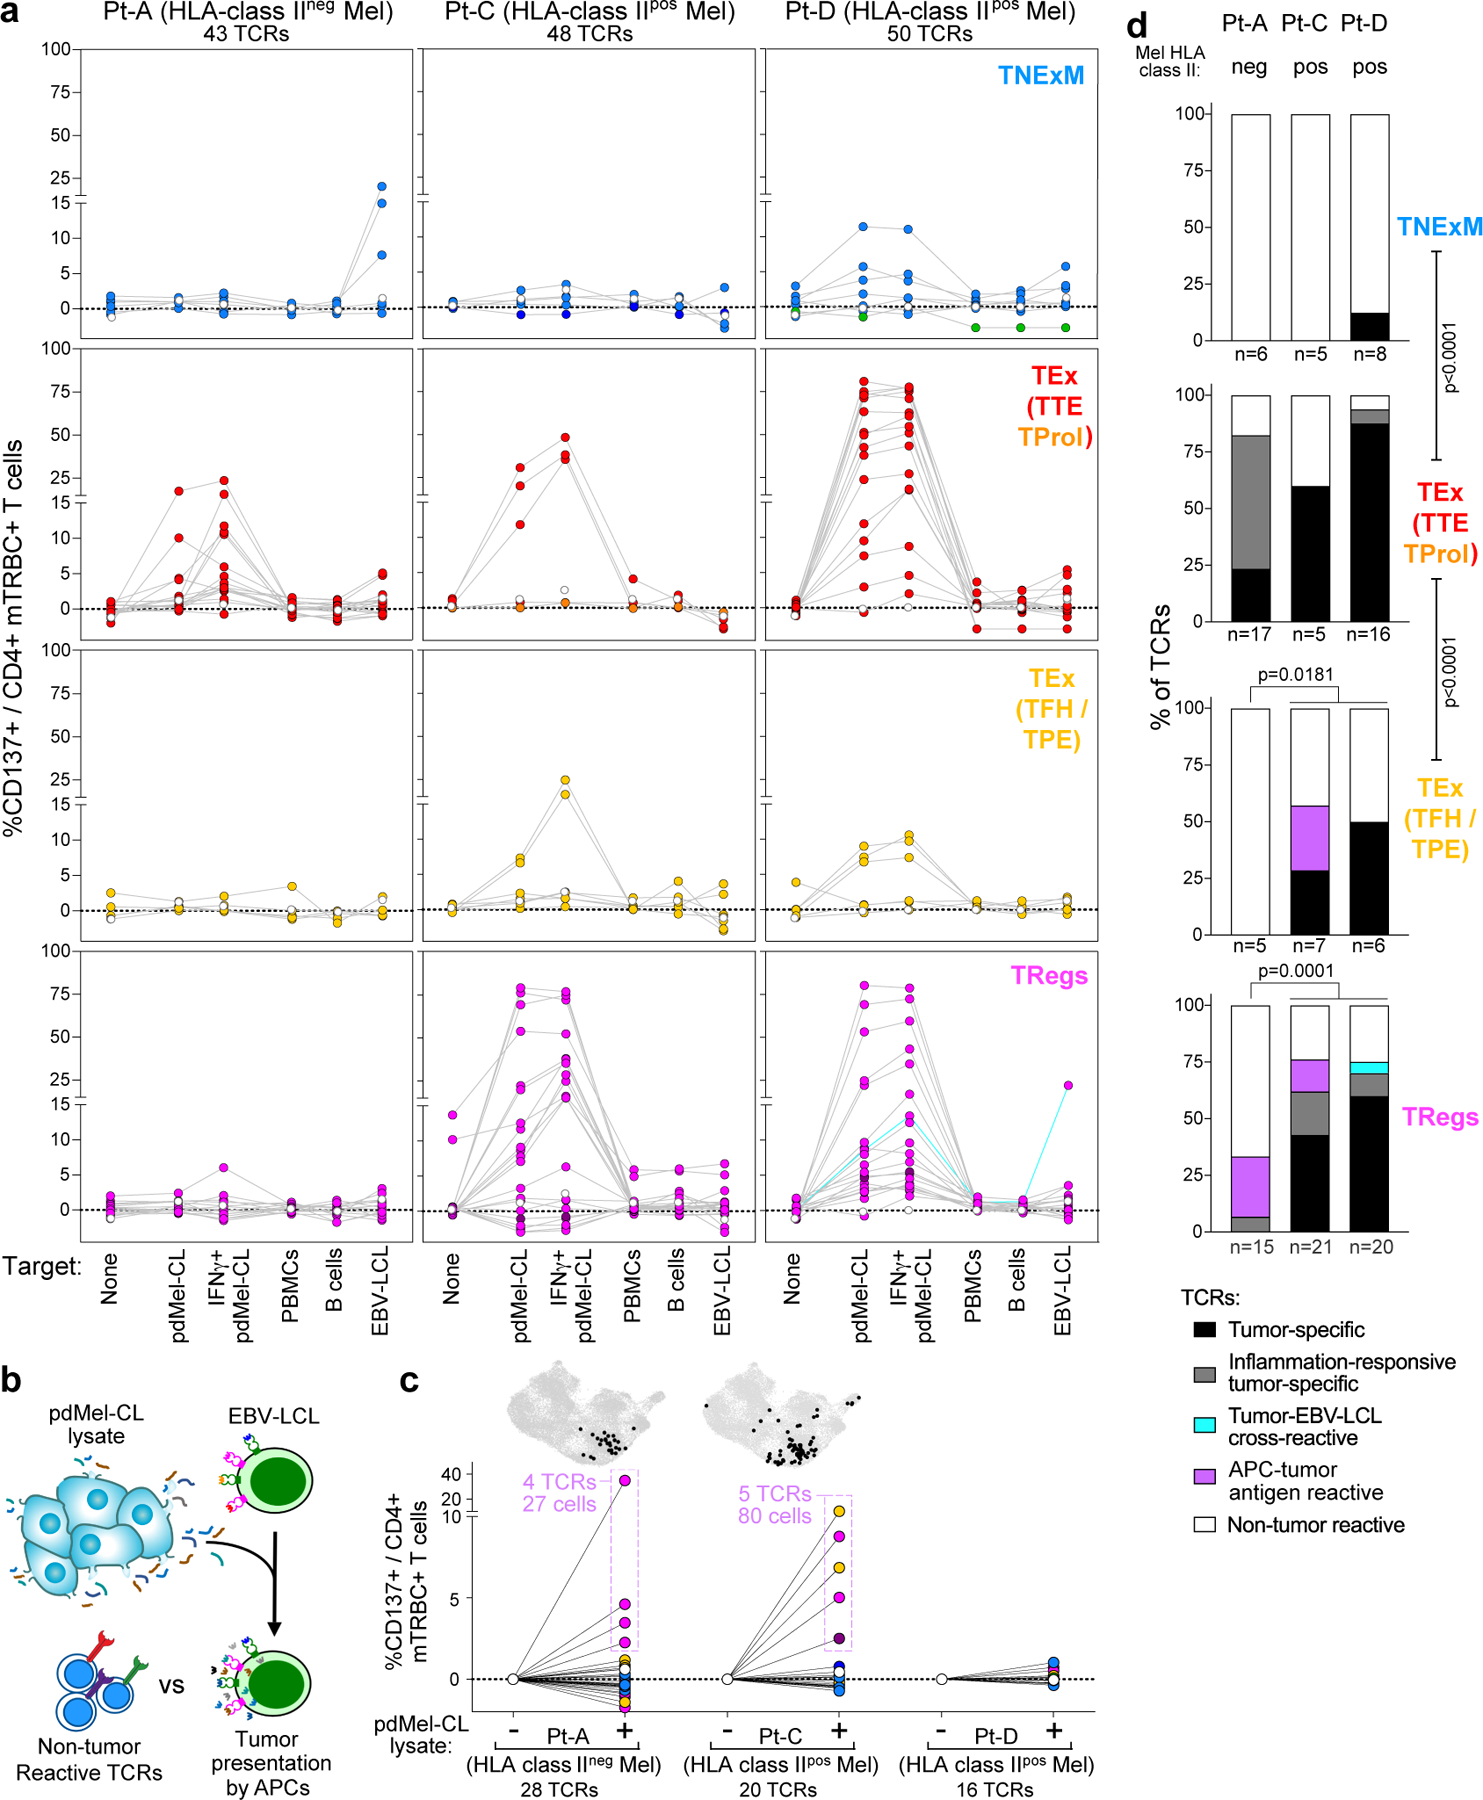
a, Reactivity of the dominant TCRs cloned from CD4+ TILs with TNExM, TEx (divided into TTE/TProl and TFH/TPE) or TReg phenotypes in three patients with melanoma. CD137 upregulation was measured on TCR-transduced (mTRBC+) CD4+ T cells cultured alone (no target) or in the presence of autologous pdMel-CLs (with or without IFNγ pre-treatment) or controls (PBMCs, B cells or EBV-LCLs). Background reactivity of an irrelevant TCR was subtracted (examples in Extended Data Fig. 4b). Dotted lines show behaviour of individual TCRs; dot colours correspond to the phenotypes of TCR clonotypes shown in Fig. 1d; open dots show the signal of untransduced cells and turquoise lines show tumour- and EBV-LCL-cross-reactive TCR. Reactivity of TCRs obtained from Pt-B in Extended Data Fig. 4c. b, Workflow for testing indirect antitumour reactivity: autologous APCs (EBV-LCLs) were pulsed with tumour lysates from pdMel-CLs and used to challenge 64 TCRs that did not exhibit direct tumour recognition, as evaluated in a (from Pt-A, Pt-C and Pt-D). c, TCR reactivity against tumour antigens presented by APCs, measured as upregulation of CD137. PBS-pulsed targets were used as background controls. Dot colours correspond to the phenotypes of TCR clonotypes shown in Fig. 1d. Reactive TCRs were traced (outlined in purple) in CD4+ TILs (corresponding to the UMAP in Fig. 1c), to depict abundance and cluster distribution of corresponding TCR clonotypes (top, black dots). d, Summary of CD4+ TIL TCR reactivity as measured in a and c for three patients (Pt-A, Pt-C and Pt-D) and classified as detailed in Extended Data Fig. 4a. Percentages of TCR classes are shown for four different CD4+ phenotypes. Labels below the x-axis show the number of tested TCRs. two-sided Fisher’s exact test on total numbers of TCRs with direct antitumour activity (black or grey) tested in each phenotypic compartment, or in HLA class IIpos (Pt-C and Pt-D) vs HLA class IIneg (Pt-A) melanomas.
Direct tumour recognition was not detected for 64 CD4+ TIL TCRs, even though these clonotypes were expanded. We thus explored whether the engagement of such CD4+ clonotypes could be elicited via indirect presentation by APCs, which would process and present tumour antigens in the context of HLA class II even within the TME of HLA class IIneg tumours. To test this, we challenged non-tumour-reactive TCRs against autologous APCs (EBV-LCLs) pulsed with lysates of autologous pdMel-CLs (Fig. 2b). Nine TCRs (four from Pt-A and five from Pt-C) recognized tumour antigens when presented on APCs (Fig. 2c, bottom). Such TCR clonotypes exhibited TFH/TPE (n = 2) or TReg (n = 7) primary phenotypes, with only TReg TCRs corresponding to highly clonally expanded TILs (Fig. 2c, top). Together, these results document that CD4+ TILs could be stimulated in the absence of tumour-intrinsic HLA class II expression via indirect presentation of tumour antigens by APCs. This process can apparently elicit either productive (TFH/TPE) or detrimental (TReg) antitumour responses.
Overall, in all the analysed patients, TTE TCRs were highly enriched in antitumour specificities (P < 0.0001, Fig. 2d), whereas TNExM TCRs did not demonstrate substantial tumour recognition. As expected, the frequency of CD4+ TCRs with direct tumour recognition was increased in HLA class IIpos melanomas (Fig. 2d, Pt-A vs Pt-C and Pt-D). Presentation of tumour antigens by APCs could result in indirect recruitment of putative immunosuppressive TReg cells even in HLA class IIneg melanoma. HLA class IIpos melanomas could directly stimulate not only TTE TCRs or TFH/TPE TCRs, but also many TReg TCRs, thus conferring these tumour cells with the ability to directly control immune suppression. In line with their high antitumour reactivity, TEx and TReg TCR clonotypes were relatively rare among circulating T cells (Extended Data Fig. 5a, b, Supplementary Results) compared with TNExM clones, as determined by tracing TIL TCR β-chains in blood. Moreover, we detected TEx and TReg TCRs, respectively, in effector and regulatory fractions sorted from CD4+ circulating T cells (Extended Data Fig. 5c), suggesting that TILs preserve their phenotype even outside the TME.
Specificity of antitumour CD4+ TCRs
To understand how melanomas could engage CD4+ TEx and TReg TCR clonotypes within the TME, we investigated the specificity of 131 TCRs from CD4+ TIL (Fig. 3a), including 67 TCRs with direct tumour reactivity and 9 TCRs with indirect recognition of tumour antigens reconstructed from three patients (Pt-A, Pt-C and Pt-D). TCRs were screened against autologous EBV-LCLs pulsed with hundreds of peptides corresponding to: (1) personal neoantigens defined by HLA class I or II prediction pipelines (Methods; Supplementary Table 6) or detected within the HLA class II immunopeptidomes of pdMel-CLs; (2) previously identified melanoma-associated antigens (MAAs), tested as pools of overlapping peptides; or (3) collections of common viral antigens.
Fig. 3 |. Antigen specificity of TCRs from CD4+ TILs.
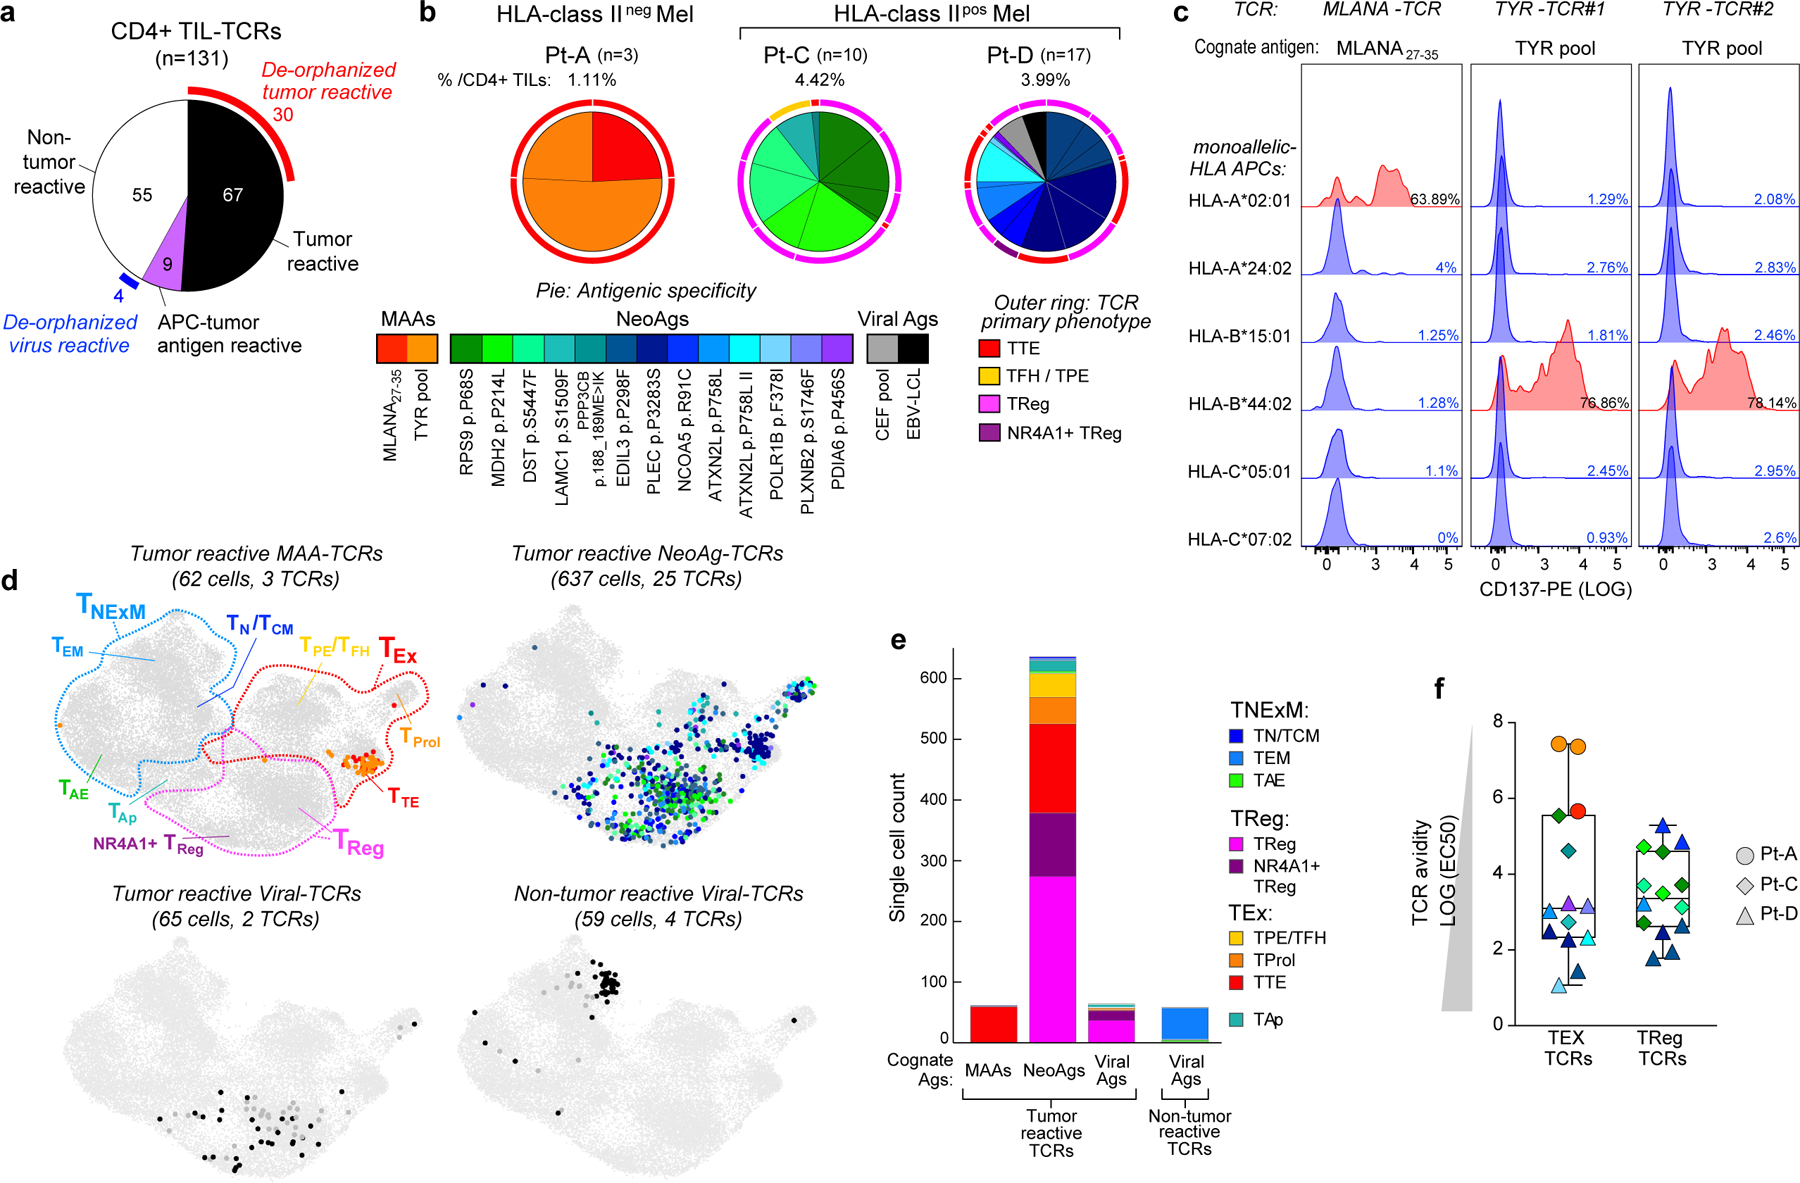
a, Pie chart summarizing the classification of 131 CD4+ TIL TCRs tested for antigen specificity in melanomas from 3 patients (Pt-A, Pt-C and Pt-D). Partial outer ring indicates TCRs with detected antigen specificity (that is, de-orphanized). b, Cognate antigens of de-orphanized antitumour TIL TCRs, showing the relative frequency of CD4+ TCR-clonotypes with MAA, neoantigen or viral antigen specificity. Numbers and total frequencies of tested TCR clonotypes among CD4+ TILs are reported above each chart. Pie colours indicate the cognate antigens of the TCR; the outer ring colours show the primary phenotype of the clonotypes. c, Deconvolution of HLA class I restriction of 3 de-orphanized tumour-specific CD4+ TCRs from Pt-A. Flow cytometry histograms depict CD137 upregulation measured on CD4+ T cells transduced with TCRs reactive to MLANA27–35 peptide (n = 1, left) or to TYR peptide pool (n = 2, right). TCRs were tested against their cognate antigen, presented by APCs stably transformed with single HLA class I alleles from Pt-A (rows). Red histograms show HLA class I restrictions capable of triggering TCR reactivity upon binding of cognate antigens. d, UMAPs of CD4+ TILs bearing antitumour TCRs specific for MAAs, neoantigens or viral antigens, or non tumour-reactive TCRs specific for viral antigens. Dot colours indicate TCR antigenic specificity corresponding to the scheme in b. TIL phenotypic clusters are delineated within the first UMAP as reference. e, Cell counts of de-orphanized tumour-reactive or non tumour-reactive CD4+ TCR clonotypes specific for different types of cognate antigens (MAAs, neoantigens and viral antigens). Colours show cell states, as inferred by scRNA-seq (Fig. 1c). f, Comparison of avidities of de-orphanized antitumour TIL TCRs with TEx (n = 14) or TReg (n = 14) phenotypes. Dot colours show TCR cognate antigens; colour scheme as in b. The shapes indicate the patient in whom the TCRs were detected. Whiskers extend from minimum to maximum values; horizontal bars represent the median and boxes encompass 25th–75th percentiles.
We were able to define the antigenic specificity (that is, ‘de-orphanize’ them) for 30 out of 67 (45%) directly tumour-reactive TCRs (Extended Data Fig. 6a–c), whereas none of the 9 TCRs with indirect tumour antigen reactivity recognized the tested antigens (Fig. 3a). For Pt-A, three TTE TCRs demonstrated specificity for peptides derived from MLANA and TYR pools (Fig. 3b, Extended Data Fig. 6a). Since we observed that these TCRs directly recognized pdMel-CLs from Pt-A—which did not express HLA class II, even upon IFNγ treatment (Fig. 1b)—we tested whether they recognized MAA peptides when presented within the patient’s HLA class I restrictions. In co-culture with peptide-pulsed monoallelic HLA class I-expressing targets, TCR-transduced CD4+ effectors recognized their cognate antigens (immunogenic MLANA27–35 (ref.17) or TYR peptide pools) within HLA class I restrictions (HLA-A*02:01 or HLA-B*44:02; Fig. 3c). TILs expressing these three TCRs were unambiguously confirmed as CD4+ clonotypes on the basis of scRNA-seq and CITE-seq analysis (Extended Data Fig. 7a). Both CD4+ or CD8+ T cells transduced with a MLANA27–35-specific TCR isolated from Pt-A CD4+ TILs could bind cognate dextramers (Methods; Extended Data Fig. 7b), demonstrating the low dependency on CD4 or CD8 co-stimulation for these interactions. HLA-A*02:01-restricted MLANA27–35–specific CD4+ TILs were directly detectable in samples from Pt-A by multiparametric flow cytometry and were positive for PD-1 and CD39 exhaustion markers and negative for regulatory or memory T-cell markers (CD25, CD127, CD45RA and CCR7)—in concordance with scRNA-seq and CITE-seq data (Extended Data Fig. 7c, d). Of note, HLA class I-restricted CD4+ TILs were highly similar to cytotoxic CD8+ TILs detected within the same TME and specific for the same HLA–peptide complex13, since they exhibited strong cytotoxic profiles with evidence of degranulation upon stimulation with autologous melanoma (Extended Data Fig. 7d, e). These data demonstrate that CD4+ TILs can harbour HLA class I-restricted TCRs, thereby enabling their tumour-directed cytotoxicity against HLA class IIneg tumours.
In Pt-C and Pt-D (both with HLA class IIpos melanomas), 25 de-orphanized antitumour TCRs recognized 13 neoantigens with predicted HLA class II restriction (Fig. 3b, Supplementary Table 7); 2 tumour-reactive TCRs from Pt-D cross-recognized viral antigens, whereas no MAA-specific TCR was detected. Whereas MAA-specific TCRs from Pt-A tracked almost exclusively to the TTE compartment, neoantigen-specific TCRs from Pt-C and Pt-D largely harboured TReg clusters, although expression of TEx phenotypes was also common (Fig. 3b, d, e). Tumour and viral-crossreactive clonotypes also had TReg phenotypes, while the few deorphanized non-tumour reactive TCRs (n = 4; Fig. 3a) recognized viral targets and were expressed by TNExM TILs (Fig. 3d, e). Despite these phenotypic differences, we found that TEx or TReg TCRs had similar wide ranges of avidities (Fig. 3f, Extended Data Fig. 8a, b), which were inversely correlated with tumour antigen abundance, especially for TEx TCRs (P = 0.0113; Extended Data Fig. 8c, d). Together, these data reveal that the HLA class IIpos melanoma TME is rich in neoantigen-specific TReg cells. Further, they suggest an active contribution by neoantigen and HLA class II expression in these tumours to orchestrate interactions with immunosuppressive cells.
HLA class IIpos melanomas have high TMB
The clonal expansion of numerous neoantigen-specific TReg cells in Pt-C and Pt-D appeared to be favoured by extremely high tumour neoantigen burdens (Supplementary Table 1). We thus hypothesized that HLA class IIpos melanoma can tolerate large numbers of mutations, since they would have a rich source of neoantigens from which to expand tumour-specific TReg cells. We therefore evaluated the relationship between HLA class II expression on melanoma cells (by IHC) and tumour mutation burden (TMB, calculated from bulk sequencing data) in 116 specimens from 4 cohorts (DFCI-Neovax18, MGH3, CheckMate 064 (ref.11) and CheckMate 038 (ref.19); Supplementary Table 8). Twenty-eight melanomas (24%) with high HLA class II frequency (score above 10; Methods) had a higher TMB compared with 87 HLA class IIneg melanomas (P < 0.0001; Fig. 4a). In selected patients, we verified that HLA class IIpos melanomas had higher numbers of CD8+ and CD4+ TILs (Extended Data Fig. 9a, b; P < 0.0001 and P = 0.0004 respectively), probably resulting from recognition of neoantigens derived from their elevated TMB. HLA class IIpos melanomas also showed higher levels of HLA class I expression (P = 0.0005; Fig. 4b), suggesting that such tumours may use HLA class II upregulation as a mechanism of immune evasion rather than HLA class I downregulation to counteract CD8+ T cell responses20,21. The pattern of HLA class I/II expression in mela- nomas in relation to their TMB (Fig. 4a, Methods) indicated that HLA class I was frequently downregulated in melanomas with low, moderate or high TMB, whereas HLA class II upregulation was enriched among tumours with extremely high TMB (P < 0.0001; Fig. 4c). Consistent with previous reports11,12, overall survival and progression-free survival following immunotherapy treatments were higher for patients with HLA class IIpos melanoma than for those with HLA class IIneg tumours (P < 0.0180 and P = 0.0136, respectively; Extended Data Fig. 9c, d, Supplementary Table 8). These outcomes could be ascribed primarily to the high TMB associated with HLA class IIpos melanomas (Extended Data Fig. 9e, f), and to the ability to leverage the abundant CD4+ and CD8+ TILs resulting from numerous neoantigens. Our findings implicate HLA class II upregulation as the preferred mechanism in the setting of extreme TMB, since this expression state would endow melanoma cells with the ability to present mutated peptides to CD4+ TILs, thus increasing the chances of engaging immunosuppressive TReg cells.
Fig. 4 |. Relationship between HLA expression and mutation burden in melanoma.
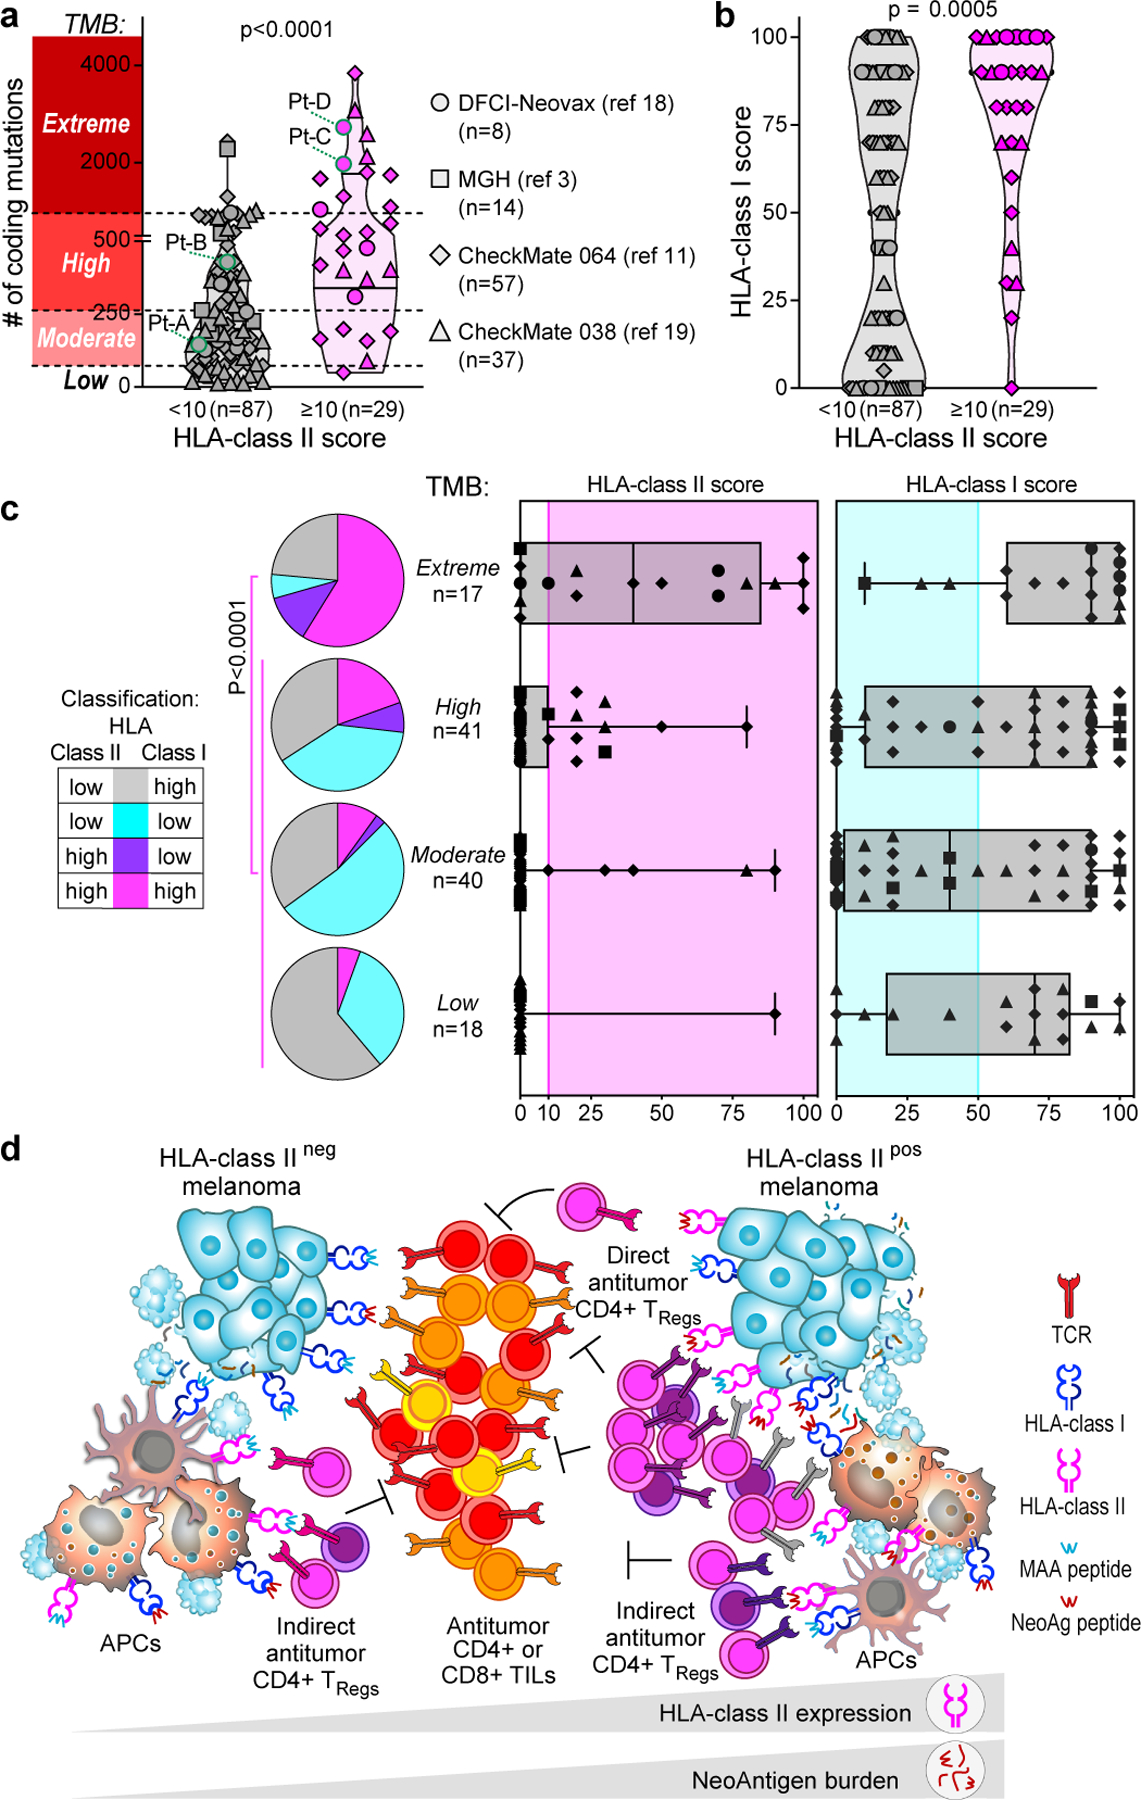
a, b, Number of coding mutations (from tumour bulk-sequencing analysis) (a) and HLA class I scores (from IHC) (b) detected in patients with melanoma from four previous studies3,11,18,19; the same shapes represent the studies throughout the figure. Melanomas were classified on the basis of HLA class II expression, scored on tumours by IHC (≥10% or < 10% of SOX10+ melanoma cells). Horizontal lines represent the median (bold) and quartiles;P two-sided Mann–Whitney test. Melanomas were divided in four groups on the basis of the TMB (y-axis in a): low, below 15th percentile; moderate, 15th percentile to median; high, median to 85th percentile; extreme, above 85th percentile. c, Tumour HLA class I (top) and HLA class II (bottom) scores determined by IHC of 116 melanoma specimens with different TMB ranges, as established in a. Pink area indicates HLA class II upregulation (IHC score ≥ 10%) and turquoise area indicates HLA class I downregulation (IHC score ≤ 50%). Whiskers extend to minimum and maximum values, horizontal bars show the median and boxes encompass 25th–75th percentiles. Pie charts show the proportion of melanomas classified on the basis of HLA class I and class II expression for each TMB category. P-value for enrichment of HLA class IIpos cases in the extreme TMB group versus non-extreme TMB groups (two-sided Fisher’s exact test). d, Proposed mechanism of HLA class II-driven immune evasion in melanoma: as well as being able to the indirectly elicit CD4+ responses through APCs, HLA class IIpos melanoma with extreme TMB can directly trigger and expand immunosuppressive TReg cell clones (delineated by different TCR colours) through exposure of HLA class II–neoantigen complexes.
Evaluation of TMB and HLA class I/II expression in a comprehensive dataset of 927 human tumour cell lines22 revealed that only a subset of skin cancer cell lines exhibited levels of HLA class II expression comparable to those in cancers with known HLA class II positivity (that is, haematopoietic malignancies; Extended Data Fig. 10a). Direct comparison of the transcriptional profile of HLA class IIpos and HLA class IIneg melanoma cell lines revealed that the former were enriched for increased expression of genes related to nervous system differentiation (SOX2 and NGFR) and remodelling of cellular interactions (Extended Data Fig. 10b, c, Supplementary Tables 9, 10). Previous studies have defined an NGFRpos programme within a subset of melanomas with dedifferentiation and increased invasiveness23,24. Our data support the notion that HLA class II expression is thus associated with this cancer phenotype and contributes to its evasion from immune control.
Discussion
Although high frequencies of helper or regulatory T cells have been described within the TME of diverse cancers4–7,25–27, little is known about how tumours engage CD4+ TILs. Here we captured the potential cross-talk between cancer and immune cells by coupling high-resolution single-cell profiling with reconstruction and specificity testing of CD4 TIL TCRs. Our data draw attention to three general types of potential interactions between tumour-specific CD4+ TILs and melanomas.
First, we confirmed that tumour-specific CD4+ TIL TCRs can be engaged through presentation of tumour antigens by APCs, enabling the induction of CD4+ responses even in absence of tumour HLA class II expression. We ascertained that this indirect pathway of tumour antigen presentation predominantly elicited putative immunosuppressive TReg cells, as observed recently in mouse models28. Thus, in coordination with other immune cells, HLA class IIneg tumours can indirectly activate tumour-specific immunosuppressive TReg cells.
A second class of interactions involves direct engagement of TReg cells by tumour cells, highlighting the acquisition of immune-evasion capabilities by melanomas that aberrantly express HLA class II. We unambiguously established the direct tumour specificity of more than 70% of T TCRs that were expanded in the TME of two patients with HLA class IIpos melanomas. The majority of such TCRs showed specificity for neoantigens with avidities that were similar to those of TEx TCRs, suggesting that their stimulation could result in activation of putatively immunosuppressive TReg cells. In Pt-C and Pt-D, this phenomenon was favoured not only by the stable tumour expression of HLA class II, but also by an extremely high TMB. Indeed, HLA class II expression was highly enriched in melanomas with extreme TMBs, as robustly validated in independent specimens. We presume that this association would provide the basis for clonal expansion of functional neoantigen-specific TReg cells, although definitive demonstration of this effect requires evaluation of additional scRNA-seq and scTCR-seq datasets with the high depth required to detect large numbers of TReg cells and assess their clonality and functional capabilities. Indeed, the generally low level of expansion of CD4+ clonotypes and the low frequency of HLA class IIpos melanomas with extreme TMB (10%) limit validation in existing melanoma datasets3,29–31. Nonetheless, the data from Pt-C and Pt-D suggest that by enabling the presentation of numerous neoantigens, expression of HLA class II allows melanomas to engage and control putatively immunosuppressive neoantigen-specific TReg clones and thereby counterbalance the high immunogenicity that would be otherwise expected from extremely mutated tumours13,32. As suggested by the analysis of tumour cell lines, we suspect that aberrant HLA class II expression is particularly enriched in melano- mas with a de-differentiated neural crest phenotype23,24, which may acquire an HLA class IIposSOX2pos state similar to that observed in fetal neural cells33,34.
Finally,CD4 TExTILs were highly enriched for tumour-specific TCRs, revealing how their interactions with tumour antigens markedly skewed the phenotype of cytotoxic CD4+ T cells towards a highly exhausted state. Such CD4+ TILs could be elicited by HLA class II-restricted neoantigens (as in Pt-C and Pt-D) and by MAA peptides when presented within the context of HLA class I molecules, as verified in Pt-A. These CD4+ TILs harboured CD4− and CD8-independent TCRs and displayed phenotypes and cytotoxicity highly similar to those of antitumour CD8+ TILs. Further studies are required to investigate the incidence of HLA class I-restricted CD4+ TILs, but we speculate that such TILs are more likely to be present when canonical HLA class II-restricted CD4+ responses are poorly favoured (as in the melanoma from Pt-A, which exhibits low HLA class II expression).
This study focused on the in-depth characterization of treatment-naive melanomas. However, HLA class II expression is associated with increased overall survival and progression-free survival after immune checkpoint blockade11,12. Indeed, we found that HLA class II pos melanomas were characterized not only by clonal expansion of TReg cells, but also by high numbers of CD8+ TILs, owing to their association with extreme TMB. Under such conditions, the revival of CD8+ responses may disrupt the equilibrium between effectors and TReg cells, thus fostering the high immunogenicity expected from HLA class IIpos melanomas. Given the importance of direct or indirect engagement of TReg cells, our study provides a rationale for the development of therapies that might disrupt such interactions to increase the efficacy of immunotherapies such as cancer vaccines or immune checkpoint blockade.
Methods
Study subjects and patient samples
Single-cell sequencing and TCR-screening analyses were conducted on a discovery cohort of 4 patients (Pt-A, Pt-B, Pt-C and Pt-D) with high-risk melanoma enrolled between May 2014 and July 2016 to a single-centre, phase I clinical trial approved by the Dana-Farber/Harvard Cancer Center Institutional Review Board (IRB) (NCT01970358, DFCI-Neovax). This study was conducted in accordance with the Declaration of Hel- sinki. The details about eligibility criteria have been described previ- ously13,18,35, and all subjects received neoantigen-targeting peptide vaccines, as previously reported (Supplementary Table 1). Tumour samples were obtained immediately following surgery and processed as previously described13,18,35 for single-cell analyses. Heparinized blood samples were obtained from the same study subjects on IRB-approved protocols at Dana-Farber Cancer Institute (DFCI).
For collection of the melanoma specimens listed in Supplementary Table 3, tumour tissues were procured under IRB-approved protocols (06–375) at Brigham and Women’s Hospital.
The analysis was extended to all the patients treated within the DFCI-Neovax trial18, and to three additional independent cohorts of melanoma patients treated with immune checkpoint blockade therapy, as previously reported3,11,19. These included patients from CheckMate 064 (NCT01783938) and CheckMate 038 (NCT01621490) clinical trials. All the patients from whom anonymized specimens were obtained and analysed (Supplementary Tables 3, 8) provided written informed consent for the collection of tissue samples for research and genomic profiling.
Sequencing of melanoma cell lines and parental tumours
Whole-exome sequencing (WES) and RNA sequencing (RNA-seq) of patients or cell lines from the discovery cohort were analysed as previously reported13,18,35 and as described in the Supplementary Information. For patients from validation cohorts, mutations sequenced by WES or RNA-seq were annotated from corresponding published studies3,11,18,19. To determine the TMB of melanomas, mutations in gene-coding regions and resulting in modifications of the wiltype amino acid sequence (coding mutations) were counted and the total number of coding mutations were reported per tumour sample. Melanomas were divided into 4 subgroups on the basis of TMB (Fig. 4a): specimens above the 85th percentile were included within the extreme TMB subgroup; the 15th percentile was used to define the cases with low TMB, based on symmetry. The median marked the difference between melanomas with moderate (15th percentile to median) versus high (median to 85th percentile) TMB.
Processing of single-cell data
Processing of scTCR-seq data.
TCR-seq data were processed using Cell Ranger software (version 3.1.0). On the basis of TCRα–TCRβ chain identity, TCRs were grouped in patient-specific TCR clonotype families allowing for a single amino acid substitution within the TCRα–TCRβ CDR3s. Cells with a single TCR chain were included; the resulting TCR clonotype families were incorporated into downstream analysis. This procedure was reiterated on all samples sequenced from the same patient and results were manually reviewed. Owing to the low number of TCR clonotypes specific for the Pt-C relapse specimen (n = 7), Pt-C and Pt-C relapse TILs were analysed together (referred to as Pt-C within the text).
Processing and analysis of scRNA-seq and CITE-seq data.
scRNA-seq data were processed with Cell Ranger software (version 3.1.0). scRNA-seq count matrices and CITE-seq antibody expression matrices were read into Seurat36 (version 3.2.0). For each batch of samples comprising all tumour or PBMC single-cell data acquired for a single patient, a Seurat object was generated. Cells were filtered to retain those with ≤20% mitochondrial RNA content and with a number of unique molecular identifiers (UMIs) comprised between 250 and 10,000. For TIL analysis, scTCR-seq data were integrated and cells with ≥3 TCRα chains, ≥3 TCRβ chains or 2 TCRα and 2 TCRβ chains were removed. scRNA-seq and data CITE-seq were normalized using Seurat NormalizeData function and the centre log-ratio (CLR) function respectively. CITE-seq signals were then expressed as relative to isotype controls signals of each single cell, dividing each antibody signal by the average signal from three CITE-seq isotype control antibodies. For cells with an average isotype signal less than 1, all the corresponding CITE-seq signals were increased of a value equal to 1 − mean isotype signal.
Each patient dataset was scaled and processed under principal component analysis using the ScaleData, FindVariableFeatures and RunPCA functions in Seurat. Serial custom filters were used to identify CD4+ T lymphocytes: first, UMAP areas with predominance of cells belonging to FACS-sorted CD45+CD3+ populations and with high density of CD3E transcripts were selected. Second, possible contaminants belonging to B and myeloid lineages were removed by excluding cells with high expression of CD19 and ITGAM transcripts or positivity for CD19 or CD11b CITE-seq antibodies. Remaining events were grouped in CD8+ or CD4+ cells using the corresponding CITE-seq antibodies, and CD4+CD8− TILs were selected13. Importantly, these steps were designed to maximize the ability to correctly detect CD4+ T cells by relying on the actual surface protein expression of CD4, thus avoiding cell loss due to possible false negatives at the RNA level. Cells classified as CD4+CD8− from tumour specimens of the four patients were combined using the RunHarmony function in Seurat with default parameters37. Data were normalized and scaled and principal components computed as previously described. UMAP coordinates, neighbours and clusters were calculated with the reduction parameter set to ‘harmony’ to identify clusters of cells. Cluster stability over objects with different resolutions was evaluated to select the appropriate level of resolution (0.6). Clusters composed of less than 100 cells were not characterized. Markers specific for each cluster were found using Seurat’s FindAllMarkers function with min.pct set to 0.25 and logfc.threshold set to log(2) (Supplementary Table 5). Cluster classification was performed using RNA and surface protein expression of a panel of T cell-related genes and by cross-labelling with reference gene signatures from external single-cell datasets of human TILs4–6 (see Supplementary Information).
Phenotypic distribution of TCR clonotypes composed by >1 cell (defined as TCR clonotype families) was examined using the CD4+ clusters identified through Seurat clustering. To associate a cell state with each TCR clonotype family, a ‘primary cluster’ or ‘primary phenotype’ was assigned by selecting the cluster with the largest representation of cells in the clone. No primary cluster was assigned in case of a tie.
For analysis of tumour-enriched fractions (CD45− single cells), we first selected in each patient the events from samples containing tumour cells (CD45−CD3− fractions or unsorted tumour specimens) and then removed cells and clusters previously identified as T cells or other immune types. The remaining cells from all tumour biopsies were then combined and classified based on expression of cell markers, as described38 (Extended Data Fig. 1b). Clusters constituted by cells from individual patients were classified as tumours by analysing the expression of melanoma-associated markers (MLANA, TYR, PMEL and PRAME), as depicted in Extended Data Fig. 1c.
Comparisons with other datasets
Previously published scRNA-seq, scTCR-seq and bulk TCR-seq data reanalysed here are available from gene expression omnibus under accession codes GSE123814 (ref.4), GSE139555 (ref.5), GSE149652 (ref.6) or from the portal22 www.broadinstitute.org/ccle.
We used the SingleR package to compute reference signatures from the Yost et al., Wu et al. and Oh et al. datasets4–6. Count matrices were downloaded from the Gene Expression Omnibus (GSE123814, GSE139555 and GSE149652, respectively). The scater package was used o normalize expression values for SingleR, and 10% trimmed means for each gene across cells in clusters classified as CD4-related (Oh et al. datasets6) or across cells without CD8A/CD8B transcript expression (Yost et al. and Wu et al. datasets4,5) were calculated. These data were used to train SingleR for classification of the CD4+ TIL internal dataset upon normalization with the same scater function. Counts of cells based on the internal cluster assignment and external assignments performed with SingleR were computed and normalized as described5, resulting in the matrices reported in Extended Data Fig. 2d.
TCR reconstruction and expression in T cells for reactivity screening
In vitro TCR reconstruction and antigen specificity screening was performed for TCRs from CD4+ TILs of the discovery cohort, selected to be highly expanded within the intratumoural microenvironment or having a primary phenotype representative of all the clusters classified as TEx, TNExM or TReg. Selection criteria also included: (1) the availability of reliable sequences for both TCRα and TCRβ chains; (2) the absence of the tested TCRα–TCRβ pairs among CD8+ TILs13; and (3) the absence of multiple TCRα or TCRβ chains.
The full-length TCRα and TCRβ chains, separated by a Furin SGSG P2A linker, were synthesized in the TCRβ–TCRα orientation (Integrated DNA Technologies) and cloned into a lentiviral vector (LV) under the control of the pEF1α promoter using Gibson assembly13 (New England Biolabs). Full-length TCRα V-J regions and TCRβ V-D-J regions were fused to optimized mouse TRA and TRB constant regions respectively, to allow preferential pairing of the introduced TCR chains, enhanced surface expression and functionality39–41. Up to 96 TCRs were cloned in parallel in 96-well plates; the assembled plasmids were transfected in 5-alpha competent Escherichia coli bacteria (New England Biolabs). After expansion of bacteria in LB broth (ThermoFisher Scientific) supplemented with ampicillin (Sigma), plasmids were purified using the 96 Miniprep Kit (Qiagen), resuspended in water and sequence-verified through standard sequencing (Eton).
T cells were isolated from PBMCs obtained by healthy individuals using the Pan-T cell selection kit (Miltenyi Biotech) and then activated with antiCD3/CD28 dynabeads (Gibco) in the presence of 5 ng ml−1 IL-7 and IL-15 (Peprotech) in 96-well plates. After 1 day, activated cells were transduced with a lentivirus encoding the reconstructed TCRβ and TCRα chains. In brief, lentivirus particles were produced by transient transfection of the lentiviral packaging Lenti-X 293T cells (Takara) with the TCR-encoding and packaging plasmids (VSVg and PSPAX2 (ref.42)) using Transit LT-1 (Mirus). Parallel production of different lentiviruses encoding diverse TCRs was achieved by seeding packaging cells in 96-well plate format. Lentivirus supernatants were collected each day for 3 consecutive days (days 1, 2 and 3 after transfection) and used on activated T cells on days 1, 2 and 3 after activation. To increase the transduction efficiency, spinoculation (2,000 rpm, 2 h, 37 °C) in the presence of 8 μg ml−1 polybrene (ThermoFisher Scientific) was performed at day 2. Beads were removed six days after activation using Dynal magnets and supernatant was replaced with complete medium supplemented with cytokines. Transduction efficiency was assessed quantifying by flow cytometry the percentage of T cells expressing the murine TCRβ with the anti-mouse TCRβ antibody (PE, clone H57– 597, 1:50, eBioscience). Cells were also labelled with anti-human CD3 (PE–Cy7, clone UCHT1, 1:50, Biolegend), CD4 (Pacific Blue, clone OKT4, 1:30, Biolegend) and CD8a (BV785, clone RPA-T8, 1:100, Biolegend) antibodies to assess purity of T cell subpopulations: all CD8− cells were verified to be CD3+CD4+ and thus CD3+CD8− cells were considered as CD4+. T cells were used 14 days after transduction for TCR reactivity tests, as detailed below.
CD137 upregulation assay
TCR signal transduction resulting from antigen recognition was assessed by measuring the upregulation of CD137 surface expression on effector T cells upon co-culture with target cells. To enable simultaneous evaluation of up to 64 distinct TCRs, T cell lines expressing distinct reconstructed TCRs were pooled after labelling with a combination of cytoplasmic dyes, as previously described13. In brief, TCR-transduced T cell lines were washed, resuspended in PBS at 1 × 10⁶ cells per ml and labelled with a combination of 3 dyes (Cell Trace CFSE, Far Red or Violet Proliferation Kits, Life Technologies). Up to 4 dilutions per dye were created and then mixed, resulting in up to 64 colour combinations. After incubation at 37 °C for 20 min, T cells were washed twice, resuspended in complete medium and divided in pools. Internal controls were included in each pool; controls consisted in mock-transduced lymphocytes and in T cells transduced with an irrelevant TCR. Effector pools were plated in 96-well plates (0.25 × 10⁶ cells per well) with the following targets: (1) pdMel-CLs (0.25 × 10⁵ cells per well), either untreated or pre-treated with IFNγ (2,000 U ml−1, Peprotech); (2) patient PBMCs (0.25 × 10⁶ cells per well); (3) patient B cells (0.25 × 10⁶ cells per well), purified from PBMCs using anti-human CD19 microbeads (Miltenyi Biotec); (4) patient EBV-LCLs (0.25 × 10⁶ cells per well) alone or pulsed with peptides; (5) medium, as negative control; (6) phytohemaggluti- nin (2 μg ml−1, Sigma-Aldrich) or PMA (50 ng ml−1, Sigma-Aldrich) and ionomycin (10 μg ml−1, Sigma-Aldrich) as positive controls.
Peptide pulsing of target cells was performed by incubating EBV-LCLs in FBS-free medium at a density of 5 × 10⁶ cells per ml for 2 h in the presence of individual peptides (107 pg ml−1, Genscript) or peptide pools (each at 107 pg ml−1, JPT Technologies) diluted in ultrapure DMSO (Sigma-Aldrich). Tested peptides comprised pools of: (1) HLA class I-restricted peptides (>70% purity) predicted from patient neoantigens, as previously reported35 (Supplementary Table 6); (2) HLA class II restricted peptides (>70% purity) predicted from patient neoanti- gens using NetMHCIIpan43 (Supplementary Table 6); (3) overlapping 15mer peptides (>70% purity) spanning the entire length of 12 MAA genes (MAGE-A1, MAGE-A3, MAGE-A4, MAGE-A9, MAGE-C, MAGE-D, MLANA, PMEL, TYR, DCT, PRAME, NYESO-1); (4) class I and II peptides (>70% purity) encoding immunogenic viral antigens (CEF pools, JPT Technologies); (5) neoantigen peptides (>70% purity or crude) detected by mass spectrometry within HLA class II binding immunopeptidomes of pdMel-CLs (Supplementary Table 6). In selected experiments, pulsing of EBV-LCLs was performed using pdMel-CL lysates, obtained by repeated cycles of freezing (in dry ice) and thawing (at 37 °C) of melanoma cells.
Following overnight co-incubation of effector and target cells, TCR reactivity was assessed by flow cytometric detection of CD137 upregulation on CD8− (considered as CD4+)-transduced T cells, using the following antibodies: anti-human CD8a (BV785, clone RPA-T8, 1:100, Biolegend), anti-mouse TRBC (PE-Cy7, clone H57–597, 1:50, eBiosci- ence) and anti-human CD137 (PE, clone 4B4–1, 1:50, Biolegend). Data were acquired on a high throughput sampler (HTS)-equipped Fortessa cytometer (BD Biosciences) and analysed using Flowjo v10.3 software (BD Biosciences). CD137 upregulation was analysed on each effector subpopulation, upon gating of CD4+ (CD8−) mTRBC+ cells, and with downstream gating strategy as described13. For each tested condition, background signal measured on CD4+ T cell transduced with an irrelevant TCR was subtracted. Based on CD137 upregulation upon challenge with the different targets, each TCR was classified as described in Extended Data Fig. 4a. A TCR was considered tumour-reactive if the level of background-subtracted CD137 upon coculture with melanoma cells was at least 3% with 2 × s.d. higher than that of the unstimulated control (mean value from 3 replicates per condition). Activation-dependent TCR downregulation was manually evaluated to further corroborate ongoing TCR signal transduction.
In peptide deconvolution analyses, peptide recognition was calculated by subtracting the background detected with DMSO-pulsed EBV-LCLs from the CD137 upregulation level measured from the peptide-pulsed EBV-LCLs. Those TCR reactivities that were detected against target pulsed with crude peptides were subsequentially vali- dated using >90% pure peptides. When TCRs specific for individual peptides were identified, reactivity was validated and titrated using EBV-LCL cells pulsed with increasing doses of pure peptides (from 100 to 108 pg ml−1). For neoantigen-specific TCRs, titration was performed for both mutated and wildtype antigens. To define the recognition affinity for each TCR-peptide pair, results of titration curves were normalized, and EC50 values were calculated using GraphPad Prism 9 software.
Finally, in selected experiments, deconvolution of HLA class I restriction of selected de-orphanized CD4+ TCRs was performed by testing TCR against the corresponding cognate antigen, presented by monoallelic APCs stably transformed with single patient’s HLAs, as available from previous published studies44,45.
Immunohistochemistry staining and scoring
The procedure of HLA class I/II IHC of formalin fixed-paraffin embedded tumour specimens was previously described11. In brief, dual IHC for HLA class I (HLA-A, HLA-B and HLA-C, clone EMR8–5, 1:6,000; Abcam) or HLA class II (HLA-DR, HLA-DP and HLA-DQ, clone CR3/43 or CR3/45, 1:750; Dako) with the melanoma marker SOX10 (clone EP268, 1:1,500; Cell Marque) was performed by Brigham and Women’s Hospital Pathology Core (Boston, MA, USA) using an automated staining system46 (Bond-III, Leica Biosystems).
HLA class I/II staining was scored as the percentage of malignant cells (in 10% increments: 0 to 100%) with positive membrane staining within the entire tissue section, as determined by a pathologist, as previously reported46. Malignant cells were defined by nuclear staining for the melanoma marker SOX10 and were only scored if they were nucleated and viable. Necrotic or fibrotic tissue was excluded from the analysis. Any HLA class I or II expression in nonmalignant (SOX10-negative) inflammatory cells served as an internal positive staining control. HLA class II was considered upregulated when the IHC score was ≥10%, while HLA class I was considered downregulated when the IHC score was ≤50%.
IHC staining and quantification of CD8+ and CD4+ of tumour specimens collected from selected patients from CheckMate 064 cohort has been described previously11. For selected patients from DFCI-Neovax and MGH cohorts, CD8+ and CD4+ TILs were quantified through immunofluorescence (see Supplementary Information).
Statistical analyses
The following statistical tests were used in this study, as indicated throughout the text: (1) Spearman’s correlation coefficients and associated two-sided P values were computed using R to test the null hypothesis that the correlation coefficient is zero (Fig. 1e); (2) two-tailed Fisher’s exact test were performed using GraphPad Prism 9 to calculate significance of deviation of a distribution from the null hypothesis of no differential distribution (Figs. 2d, 4c); (3) Mann–Whitney tests were performed using the GraphPad Prism 9 software to compare ranks of TMB and HLA expression in melanoma with different HLA class II scores (Fig. 4); (4) ratio-paired parametric t-tests were performed using the GraphPad Prism 9 software, to obtain the two-sided P value of the null hypothesis that the paired values of two groups have ratio equal to 1 (Extended Data Fig. 7d); (5) linear regressions were performed on log-transformed values of different parameters using GraphPad Prism 9 software, which provided R2 values and two-sided P value of the null hypothesis that the regression coefficient is zero (Extended Data Fig. 8d); (6) log-rank Mantel–Cox test was calculated with GraphPad Prism 9 software, to compare estimates of the hazard function between 2 or 4 groups (Extended Data Fig. 9c–f); (7) normalized Shannon index (Extended Data Fig. 3b) was calculated on patient-specific TCRs or on all available TCR clonotypes as follows:
where k is the number of TCR clonotypes, n is the total count of cells and f is frequency. No statistical methods were used to predetermine sample size.
Reporting summary
Further information on research design is available in the Nature Research Reporting Summary linked to this paper.
Extended Data
Extended Data Fig. 1 |. Characterization of HLA class II expression in melanoma biopsies.
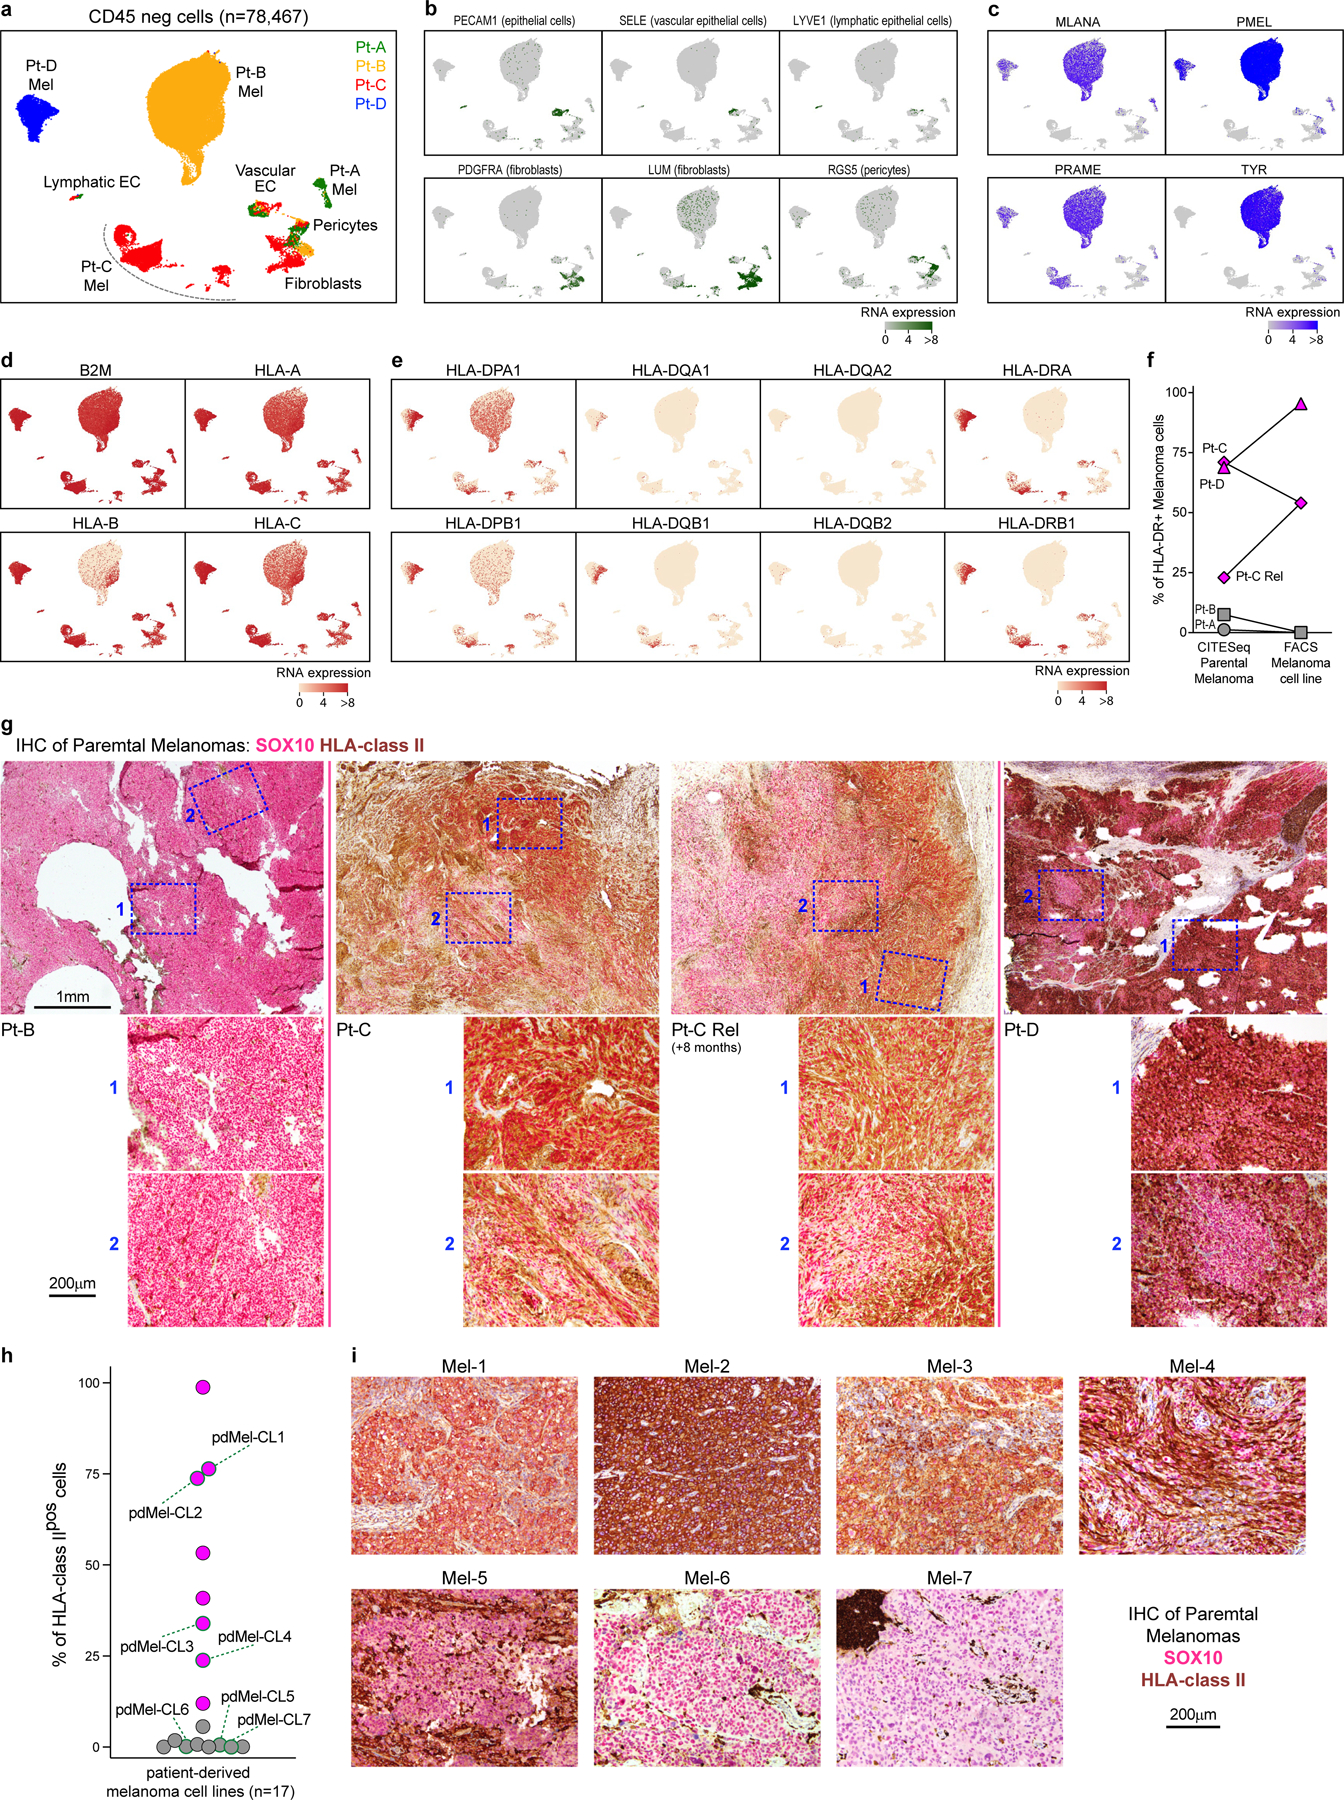
a, UMAP of scRNA-seq data from melanoma-enriched CD45neg cells isolated from tumors obtained from 4 patients with melanoma (Pt-A,B,C,D). Patients’ origin of cells is denoted with colors. Cell types are inferred based on the expression of markers depicted in panels b-c. EC: endothelial cells. b, Single-cell RNA expression of markers associated with non- tumor subpopulations, as reported in38. c, Single-cell RNA expression of melanoma-associated markers, which allow identification of melanoma cells within patient-specific clusters. d, e, Single-cell expression of canonical HLA class I (d) and HLA class II (e) transcripts, which demonstrate aberrant HLA class II expression in Pt-C and Pt-D parental tumors. f, Levels of HLA-DR surface expression detected on melanoma cells from 4 patients of the discovery cohorts (Pt-A,B,C,D, corresponding to different symbol shapes). HLA-DR expression is detected on primary melanoma cells through CITE-seq (left, as shown also in Fig. 1c) and on patient-derived melanoma cell lines through flow cytometry (right). Melanomas are classified in HLA class IIpos (magenta) and HLA class IIneg (grey). For Pt-C, two primary biopsies (Pt-C and Pt-C Rel) collected longitudinally have been analyzed. g, Dual chromogenic immunohistochemical (IHC) staining of formalin-fixed paraffin-embedded (FFPE) tumor samples from Pt-B/C/D for HLA class II (brown) and melanoma transcription factor SOX10 (red-pink). For each specimen, the whole slide was assessed for HLA class II expression. Representative low-magnification images of tumors are provided in top images, with blue boxes identifying representative areas (n = 2 repeated acqusitions), as depicted in bottom panels with 20X magnifications. For Pt-C, the same analysis was performed on 2 tumor biopsies collected at 8 months interval, demonstrating the stability of HLA class II pattern of expression in melanoma cells. h, i, Tumor HLA class II expression on independent melanoma specimens (Supplementary Table 3). HLA class II expression was measured by flow cytometry on patient-derived tumor cell lines generated from 17 different patients with melanoma (h). Cell lines are classified as HLA class IIpos (magenta) and HLA class IIneg (grey). For cell lines with available FFPE tissue blocks from parental tumors (Mel-1/7), Dual chromogenic IHC staining was performed (i) using HLA class II (brown) and melanoma SOX10 (red-pink) antibodies. For each specimen, the whole slide was assessed for HLA class II expression. Representative images are displayed. The IHC-stainings document patterns of melanoma HLA class II expression similar to what observed in corresponding cell lines, demonstrating that such feature was constitutive and stably perpetuated in culture in the absence of an inflammatory milieu.
Extended Data Fig. 2 |.
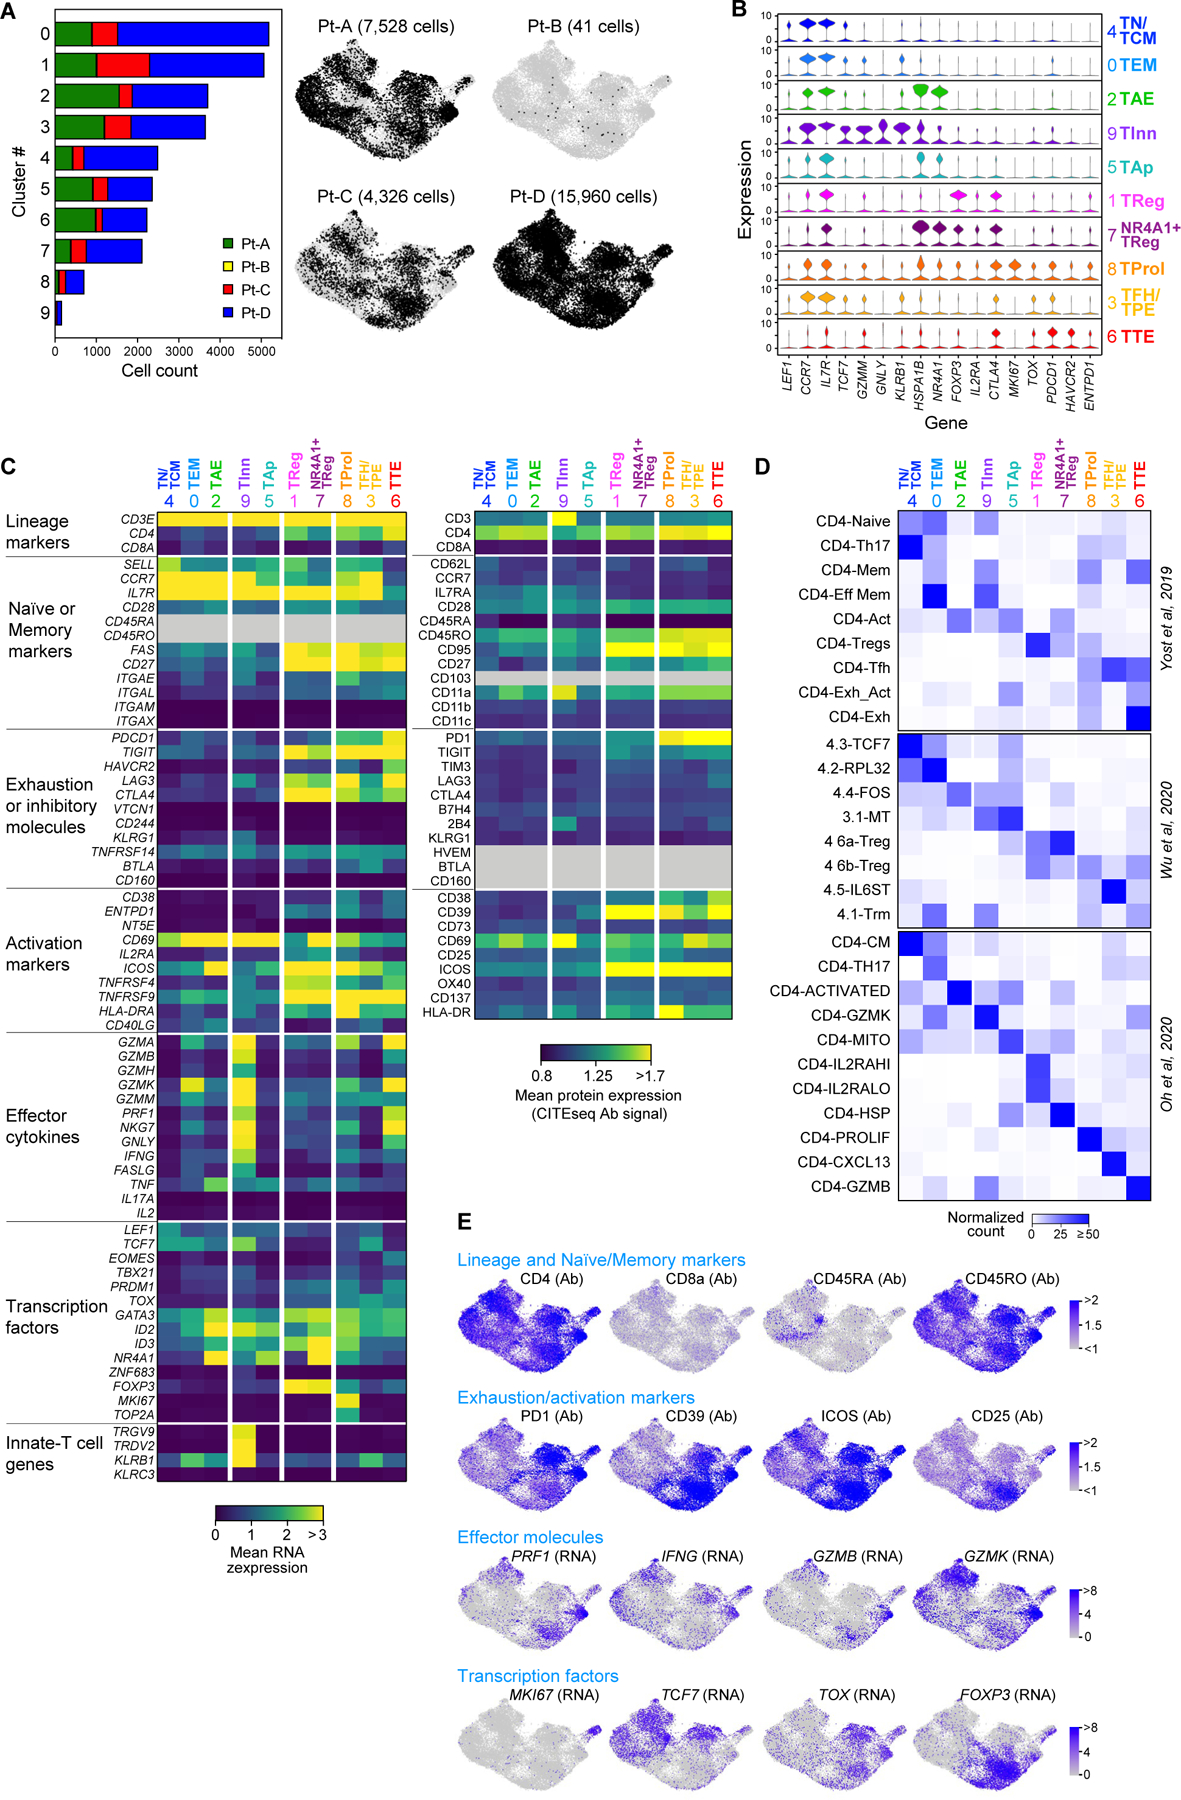
Single-cell profiling of CD4+ tumor infiltrating lymphocytes. a, Size and patient distribution of the 10 clusters identified from CD4+TIL scRNA-seq. Left: per cluster, patient origin is denoted by color. Right: UMAPs depicting cluster distribution of patient-specific CD4+TILs. b, Violin plots quantifying relative transcriptional expression of genes (columns) with high differential expression among CD4+TIL clusters (rows). c, Heatmaps depicting the mean cluster expression of a panel of T cell related genes, measured by scRNA-seq (left panel) and the mean surface expression of the corresponding proteins measured through CITE-seq (right panel). Clusters (columns) are labelled using the annotation provided in Fig. 1d; markers (rows) are grouped based on their biological function. Grey - unevaluable markers (CD45 isoforms for scRNA-seq) or which were not assessed (for CITE-seq). CITE- seq CD3 surface expression was poorly detected because of the presence of competing anti-CD3 sorting antibody. d, Characterization of the CD4+TIL clusters using independent reference gene-signatures4–6. Heatmaps show cross-labelling of T cell clusters defined in the present study (columns, reported as in Fig. 1d) versus reference gene-signatures (rows) derived from the analyses in Yost et al.4, Wu et al.5 and Oh et al.6, with intensities indicating normalized frequency. e, UMAPs depicting the single-cell expression of representative T cell markers among CD4+TILs either through detection of surface protein expression with CITE-seq (Ab), or through scRNA-seq (RNA).
Extended Data Fig. 3 |. Clonality of CD4+TILs and cell states of TCR clonotypes.
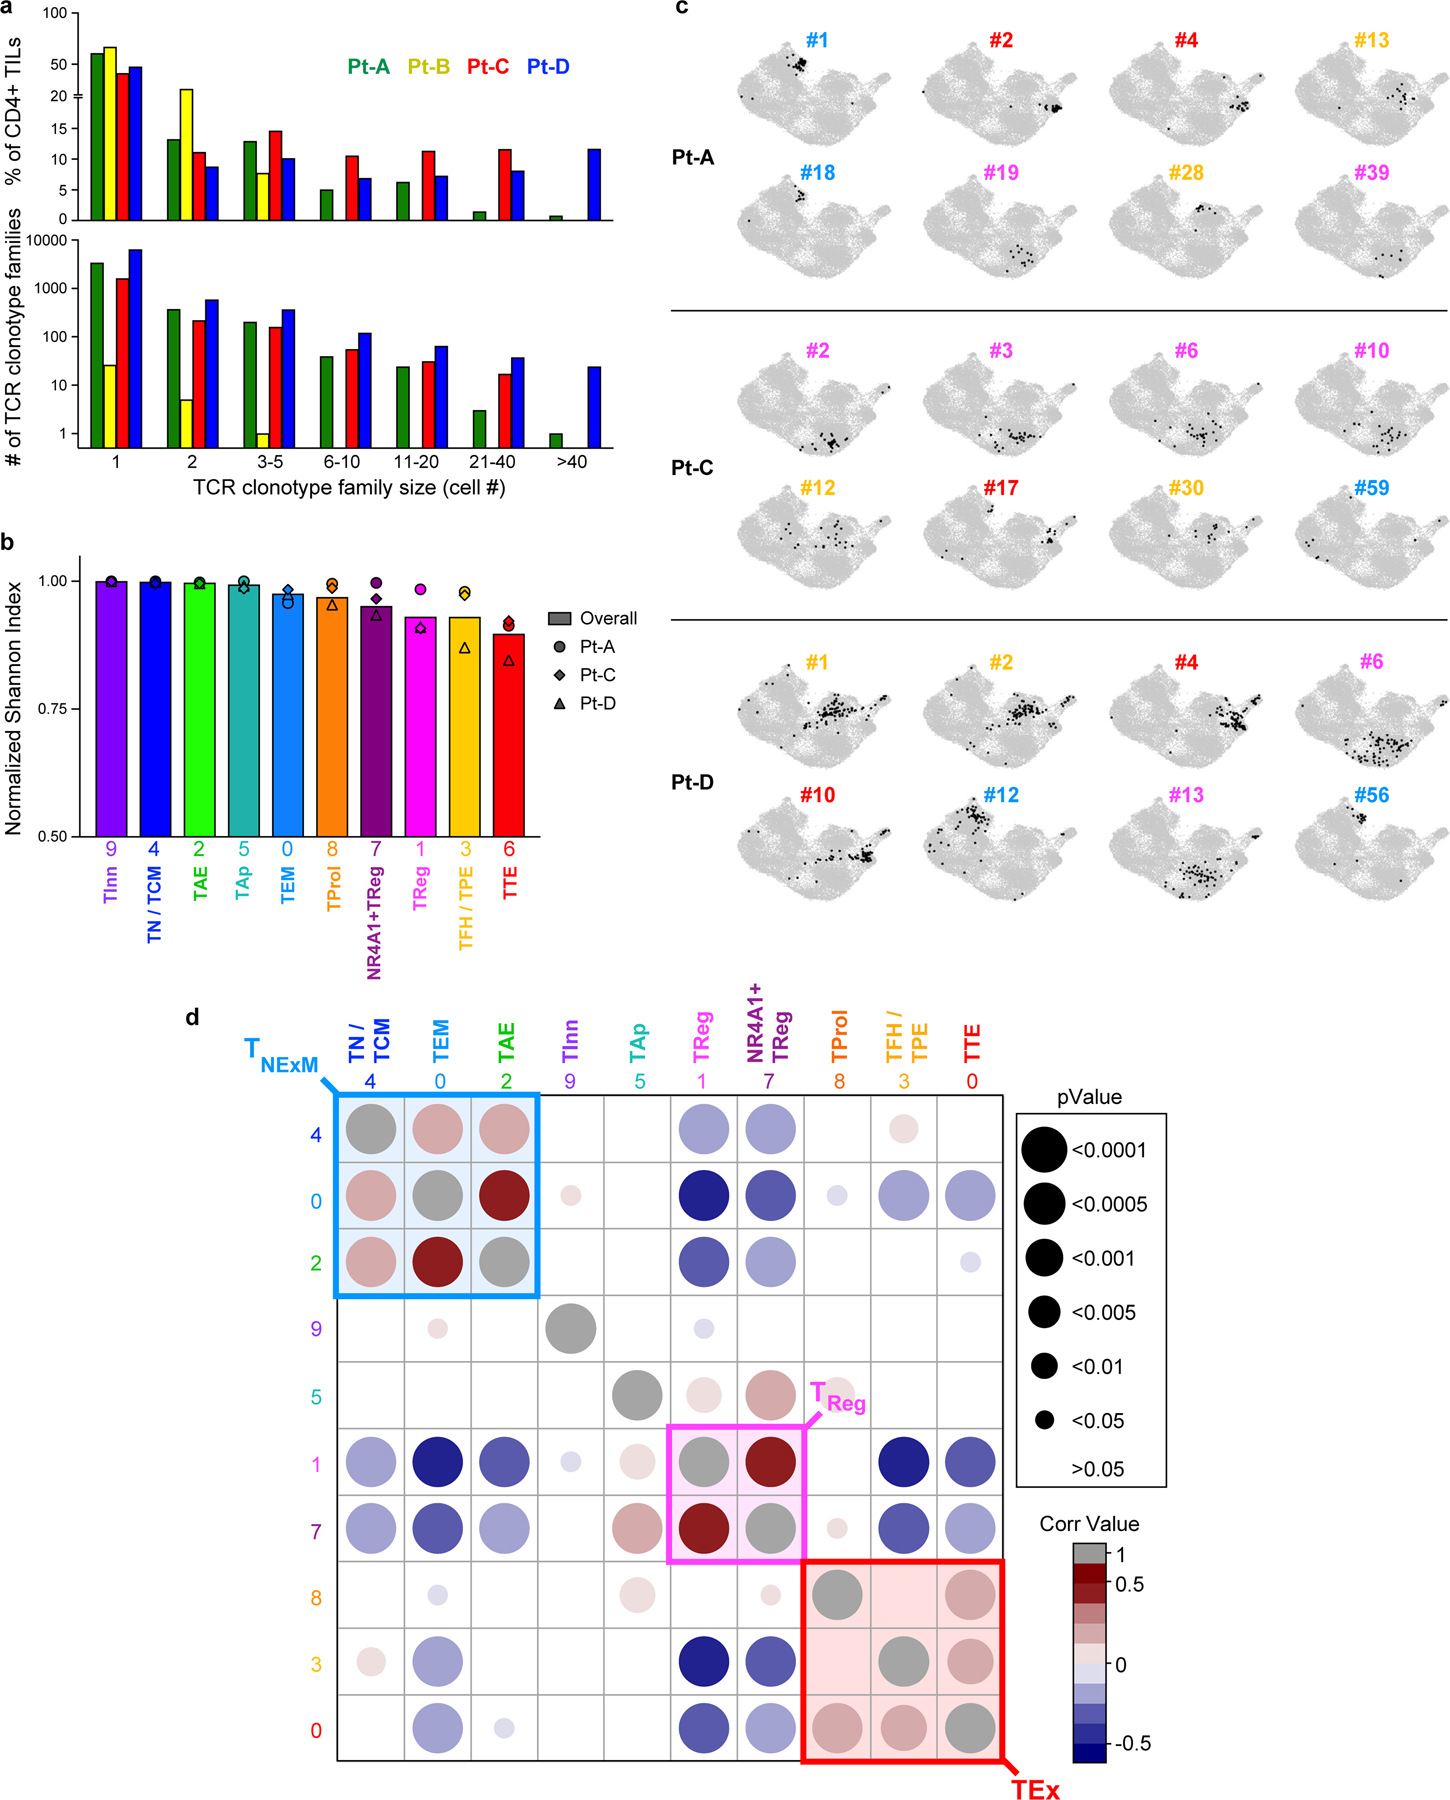
a, Histograms depicting the number (bottom panel) and overall frequency (top panel) of patients’ TCR clonotype families divided in categories based on their size (x axis). b, Histograms showing the intra-cluster TCR clonality, calculated for CD4+ T cells in each cluster (x axis) using normalized Shannon index. Symbols - individual TCR clonality for the 3 patients with high numbers of TILs (Pt-A, Pt-C, Pt-D). Bars - the overall TCR clonality measured within each cluster. c, UMAPs of the cluster distribution of representative dominant TCR clonotype families among CD4+TILs from TIL-rich patients (n = 3). For each patient, numbers denote the ranking of each TCR clonotype (see Fig. 1e), while colors identify their primary cluster (see Fig. 1d). d, Matrix displaying Spearman correlation of normalized cluster distribution of dominant TCR clonotype families composed by ≥4 cells. Colors and area of the circles indicate the strength and significance of the correlation, respectively.
Extended Data Fig. 4 |. Antitumor reactivity of in vitro reconstructed TCRs.
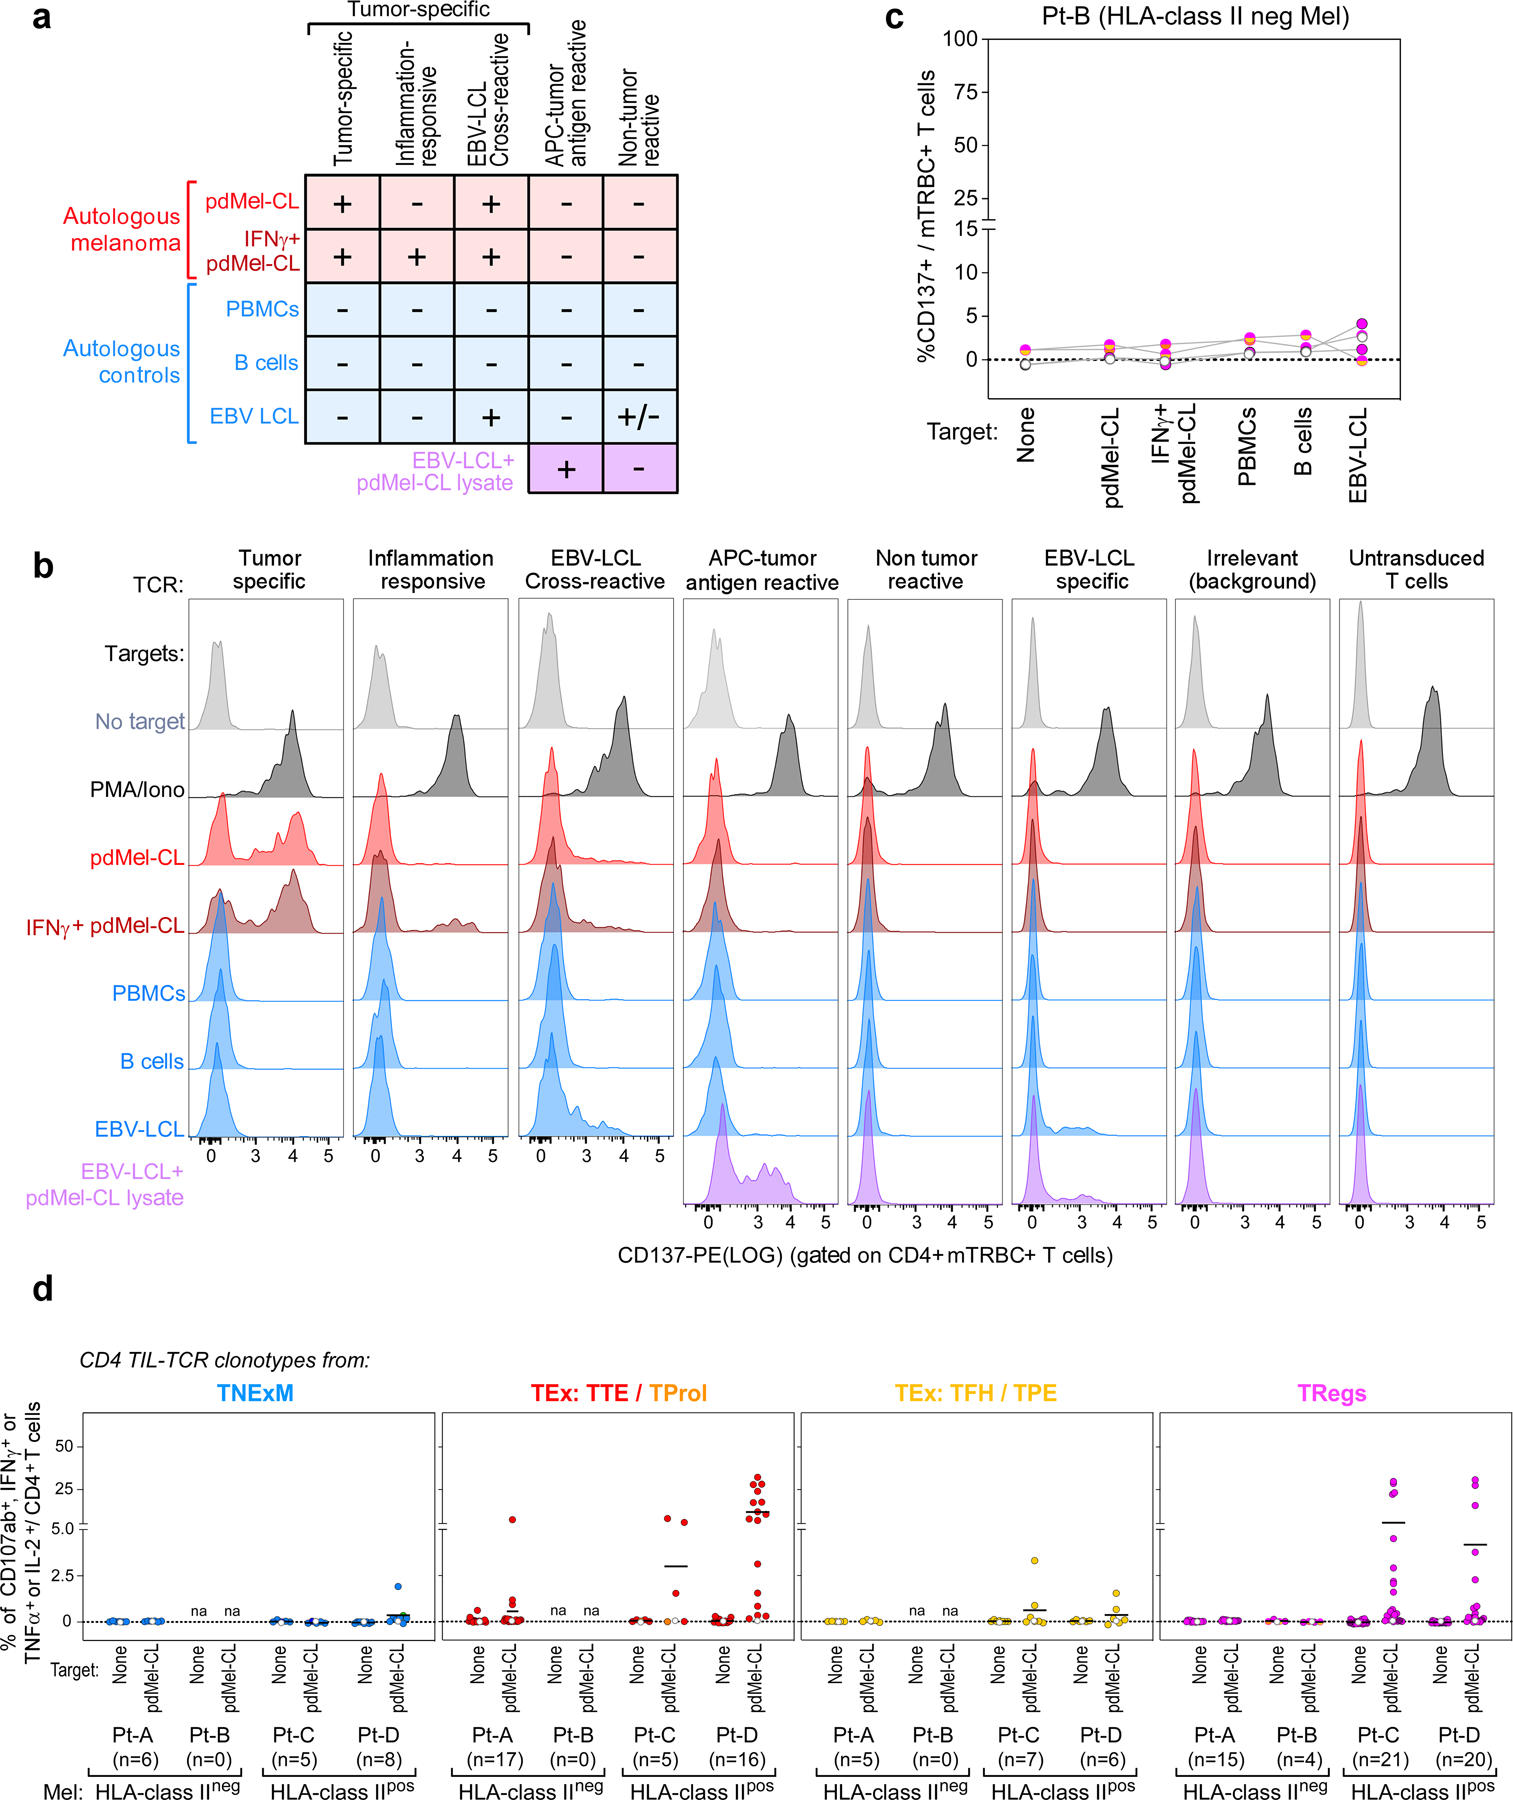
a, Schema for classification of TCR reactivities based on CD137 upregulation of TCR transduced T cell lines upon challenge with patient-derived melanoma cells (pdMel-CLs, with or without IFNγ pre-treatment [red]), with controls (PBMCs, B cells and EBV-LCLs [blue]), or with EBV-LCLs pulsed with tumor lysate (purple). b, Representative flow cytometry plots depicting CD137 upregulation measured on CD4+ T cells transduced with TCRs isolated from CD4+ melanoma TILs and cultured with melanoma or control targets. Background reactivity was estimated by measuring CD137 upregulation on CD4+ T cells transduced with an irrelevant TCR. c, TCR reactivities from Pt-B, measured on TCR transduced (mTRBC+) CD4+ lymphocytes cultured alone or with patient- derived target cells. Background activation measured on CD4+ T cells transduced with an irrelevant TCR was subtracted. Each dot-line set represents the behavior of a single TCR; dot colors denote cell states of TCR clonotypes, as delineated in Fig. 1c; white dots show background signal of untransduced CD4+ T cells. d, Cytotoxic potential provided by TCRs isolated from all 4 studied melanoma patients and reconstructed from memory clusters (blue), from TTE and TProl exhausted clusters (red), from TFH/TPE exhausted clusters (yellow) or from TReg clusters (magenta). Degranulation (CD107a/b+) and concomitant production of cytokines (IFNγ, TNFα and IL-2) were assessed through intracellular staining, gating on TCR-transduced (mTRBC+) CD4+ T cells cultured alone or in the presence of autologous melanoma (pdMel-CLs). Each dot represents the result for a single TCR isolated from CD4+TILs, color-coded based to its primary phenotypic cluster (as defined in Fig. 1d). For each analyzed TCR, background cytotoxicity from CD4+ T cells transduced with an irrelevant TCR was subtracted. White dots - basal level of activation of untransduced cells. Overall, these data indicate that antitumor cytotoxicity mainly resides among TCR clonotypes with exhausted and regulatory primary clusters.
Extended Data Fig. 5 |. Peripheral blood phenotype and distribution of CD4+ intratumoral TCR clonotypes.
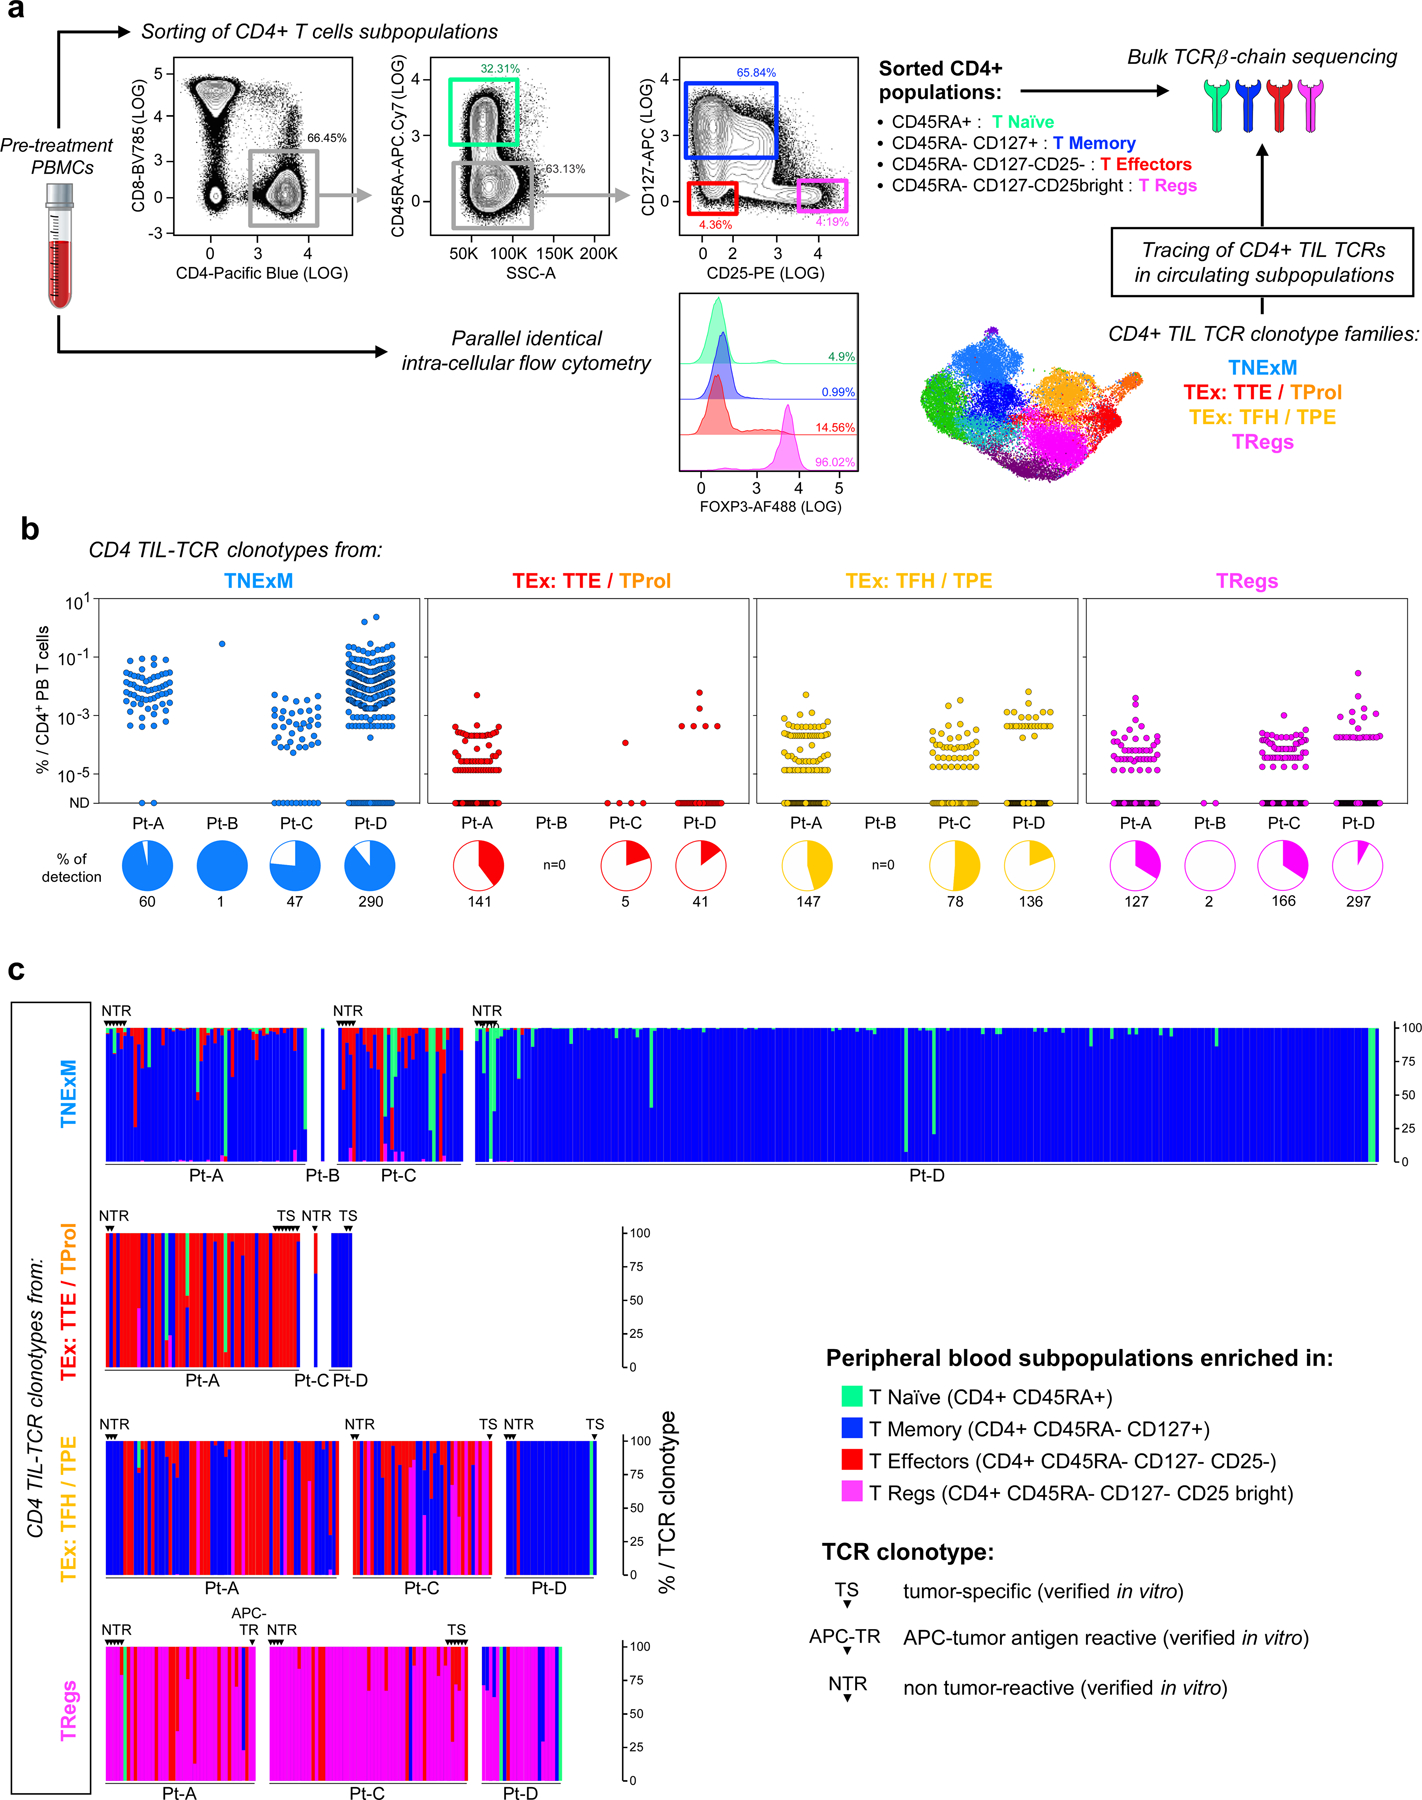
a, Schema for analysis of peripheral blood distribution and phenotype of CD4+ intratumoral clonotypes. PBMCs collected at pre-treatment timepoints from 4 melanoma patients in the discovery cohort were FACS-sorted to isolate CD4+ fractions enriched in T Naïve, T Memory, T Effectors and T Regulatory cells. FACS-plots show the sorting strategy for a representative patient (Pt-A). In parallel, an aliquot of PBMCs was analyzed with intracellular flow-cytometry using the same panel of antibodies with the addition of FOXP3 marker, to confirm enrichment of FOXP3+ cells within the CD4+TReg fraction. Bulk sequencing of TCRβ-chains was performed on sorted CD4+ subpopulation to detect the TCRβ-chains of CD4+TIL-TCR clonotype families (with >1 cell). This allowed to trace in the peripheral blood the TCR clonotypes with different intratumoral phenotypes. b, Peripheral blood frequencies of CD4+TIL-TCR clonotypes. TCR clonotype families detected amongst CD4+TILs and with different primary clusters (TNExM, TEx: TTE+TProl, TEx: TFH/TPE, TRegs) were traced in peripheral blood, as depicted in a. The frequency of each TCR clonotype among circulating CD4+ T cells was reconstructed by taking into account the frequencies of CD4+ subpopulations (determined by FACS-sorting) and the frequencies of each TCRβ-chain within each CD4 fraction (determined by bulk TCRseq). For each patient, the proportion of CD4+TIL-TCRs detected in blood is summarized with pies below each graph. c, Peripheral blood phenotype of CD4+TIL TCRs. The graphs show the distribution among 4 FACS-sorted fractions of circulating CD4+ T cells for each CD4+TIL-TCR traced in peripheral blood by bulk TCRseq. The TIL-TCR clonotypes are divided based on their intratumoral primary cluster (rows: TNExM, TEx: TTE+TProl, TEx: TFH/TPE, TRegs) and based on the patient of origin (x axis). TCRβ-chains corresponding to TCR clonotypes reconstructed in vitro are pointed with arrows and labeled based on classification of their reactivity as reported in the legend.
Extended Data Fig. 6 |. Antigen specificity of CD4+ tumor-reactive TCRs.
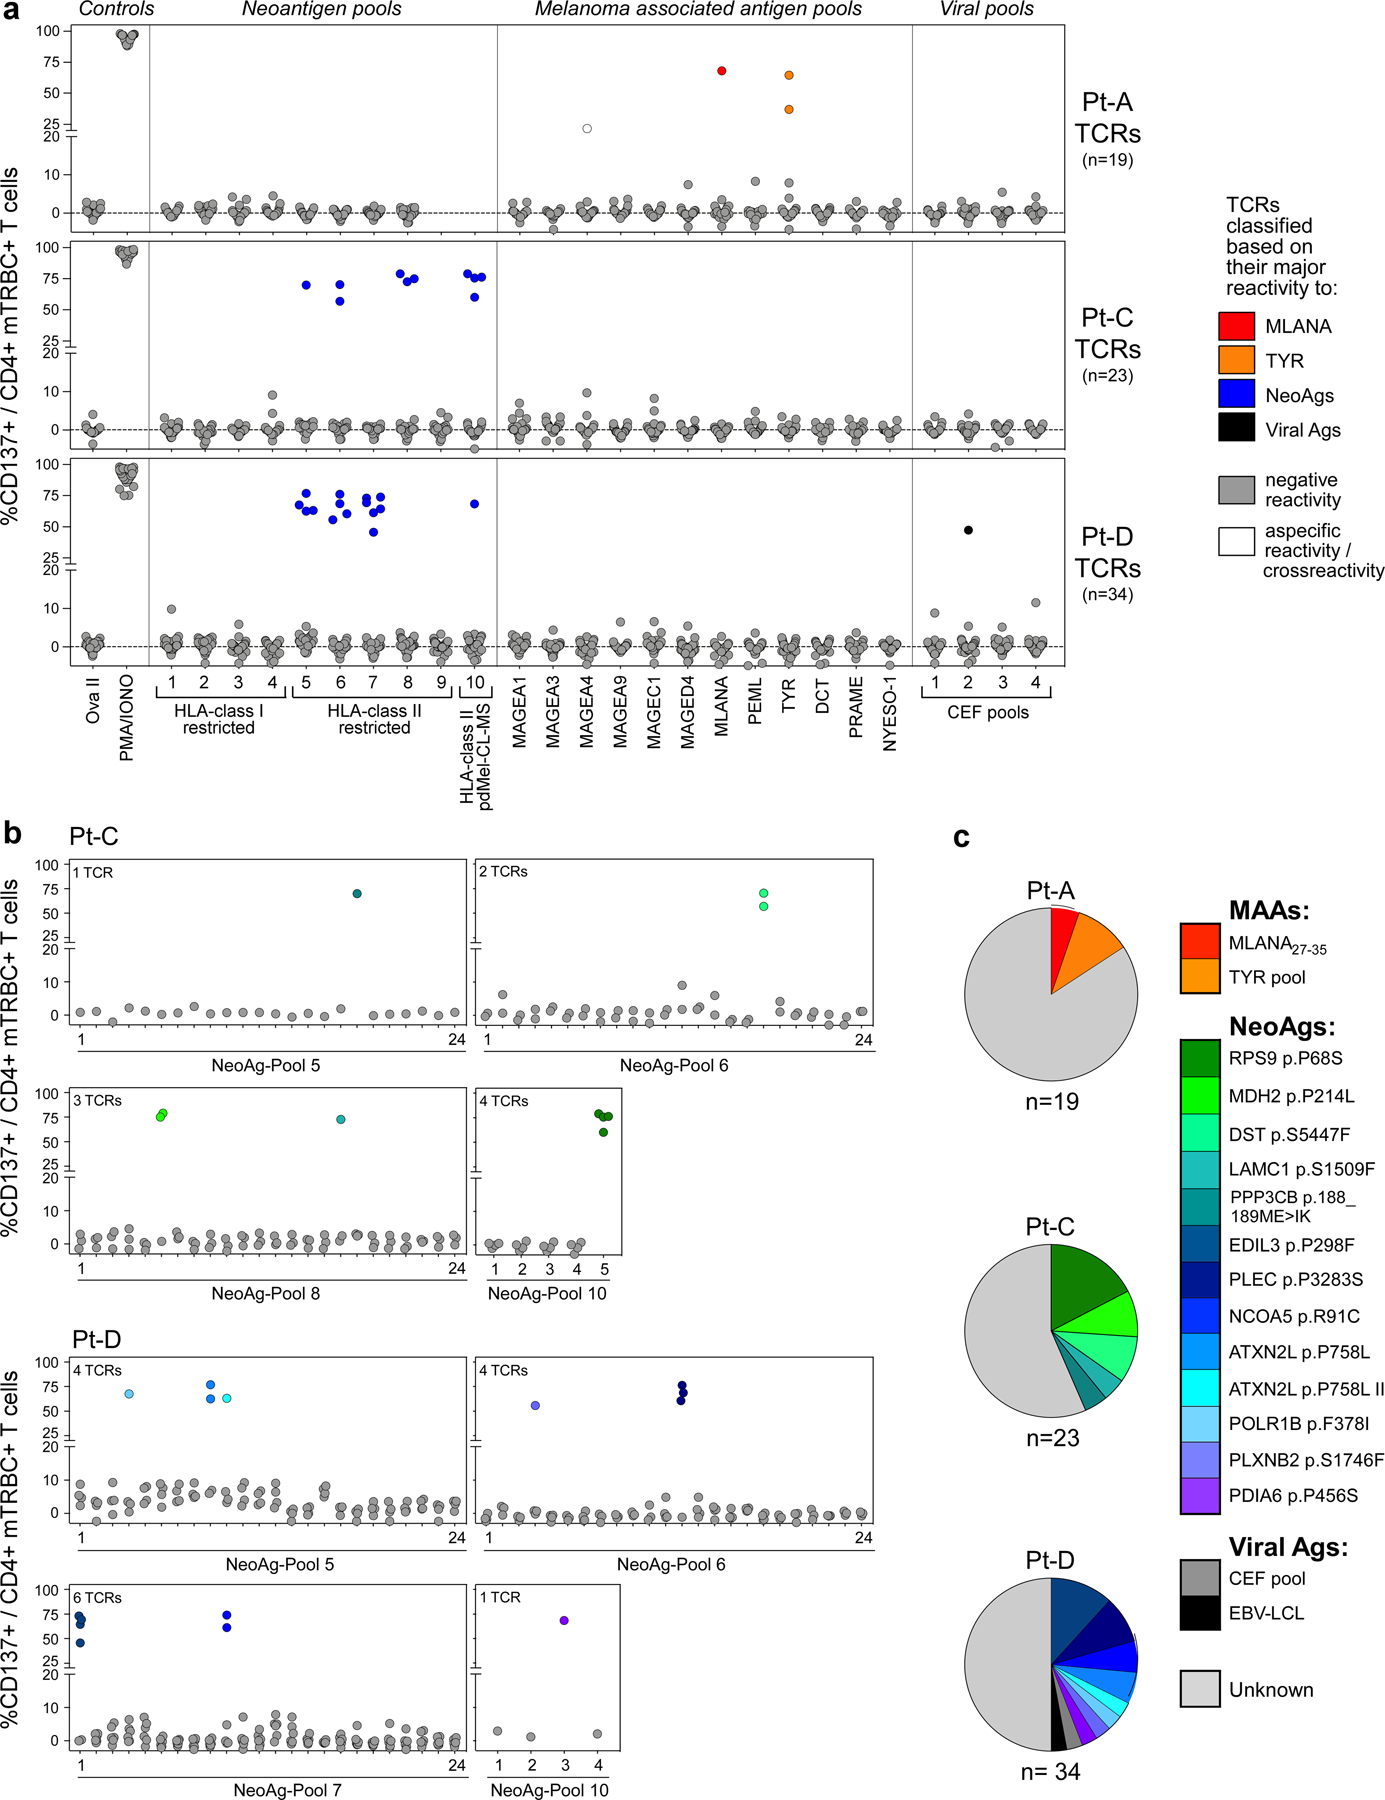
a, Antigen specificity screening of 76 CD4+TCRs with direct or indirect tumor recognition. Upregulation of CD137 was assessed by flow-cytometry on CD4+ T cells transduced with previously identified tumor-specific or APC-tumor antigen reactive TCRs. Antigen recognition was tested upon culture with autologous EBV-LCLs pulsed with pools of peptides corresponding to immunogenic neoantigens (NeoAgs) predicted to bind patients’ HLA class I or II restrictions or detected through Mass-spectrometry (MS) within the HLA class II immunopeptidome (see Supplementary Table 6), known melanoma associated antigens (MAAs) or immunogenic viral epitopes (CEF pools). Reactivity was also assessed against an irrelevant long peptide (Ova II) or in the presence of polyclonal stimulators (PMA/ionomycin) as negative and positive controls, respectively. Background, assessed using DMSO-pulsed target cells, was subtracted from each condition. Colored dots – confirmed antigen- reactive TCRs, colored based on highest reactivity against a particular antigen, as per the legend, compared to the other tested antigens; white dots – TCRs reactive against an antigen which was not the highest of the panel of antigens tested, and hence considered a cross-reactive response; grey dots - negative responses. b, Deconvolution of antigen specificity of TCRs reactive to NeoAg- peptide pools. Colored dots indicate the deconvoluted cognate antigens, with antigens corresponding to colors represented in panel c. c, Distribution of antigen specificities of tumor reactive CD4+TCRs per patient successfully deorphanized after screening. Colors denote the distinct peptides recognized by individual TCRs.
Extended Data Fig. 7 |. Characterization of HLA class I restricted CD4+TILs.
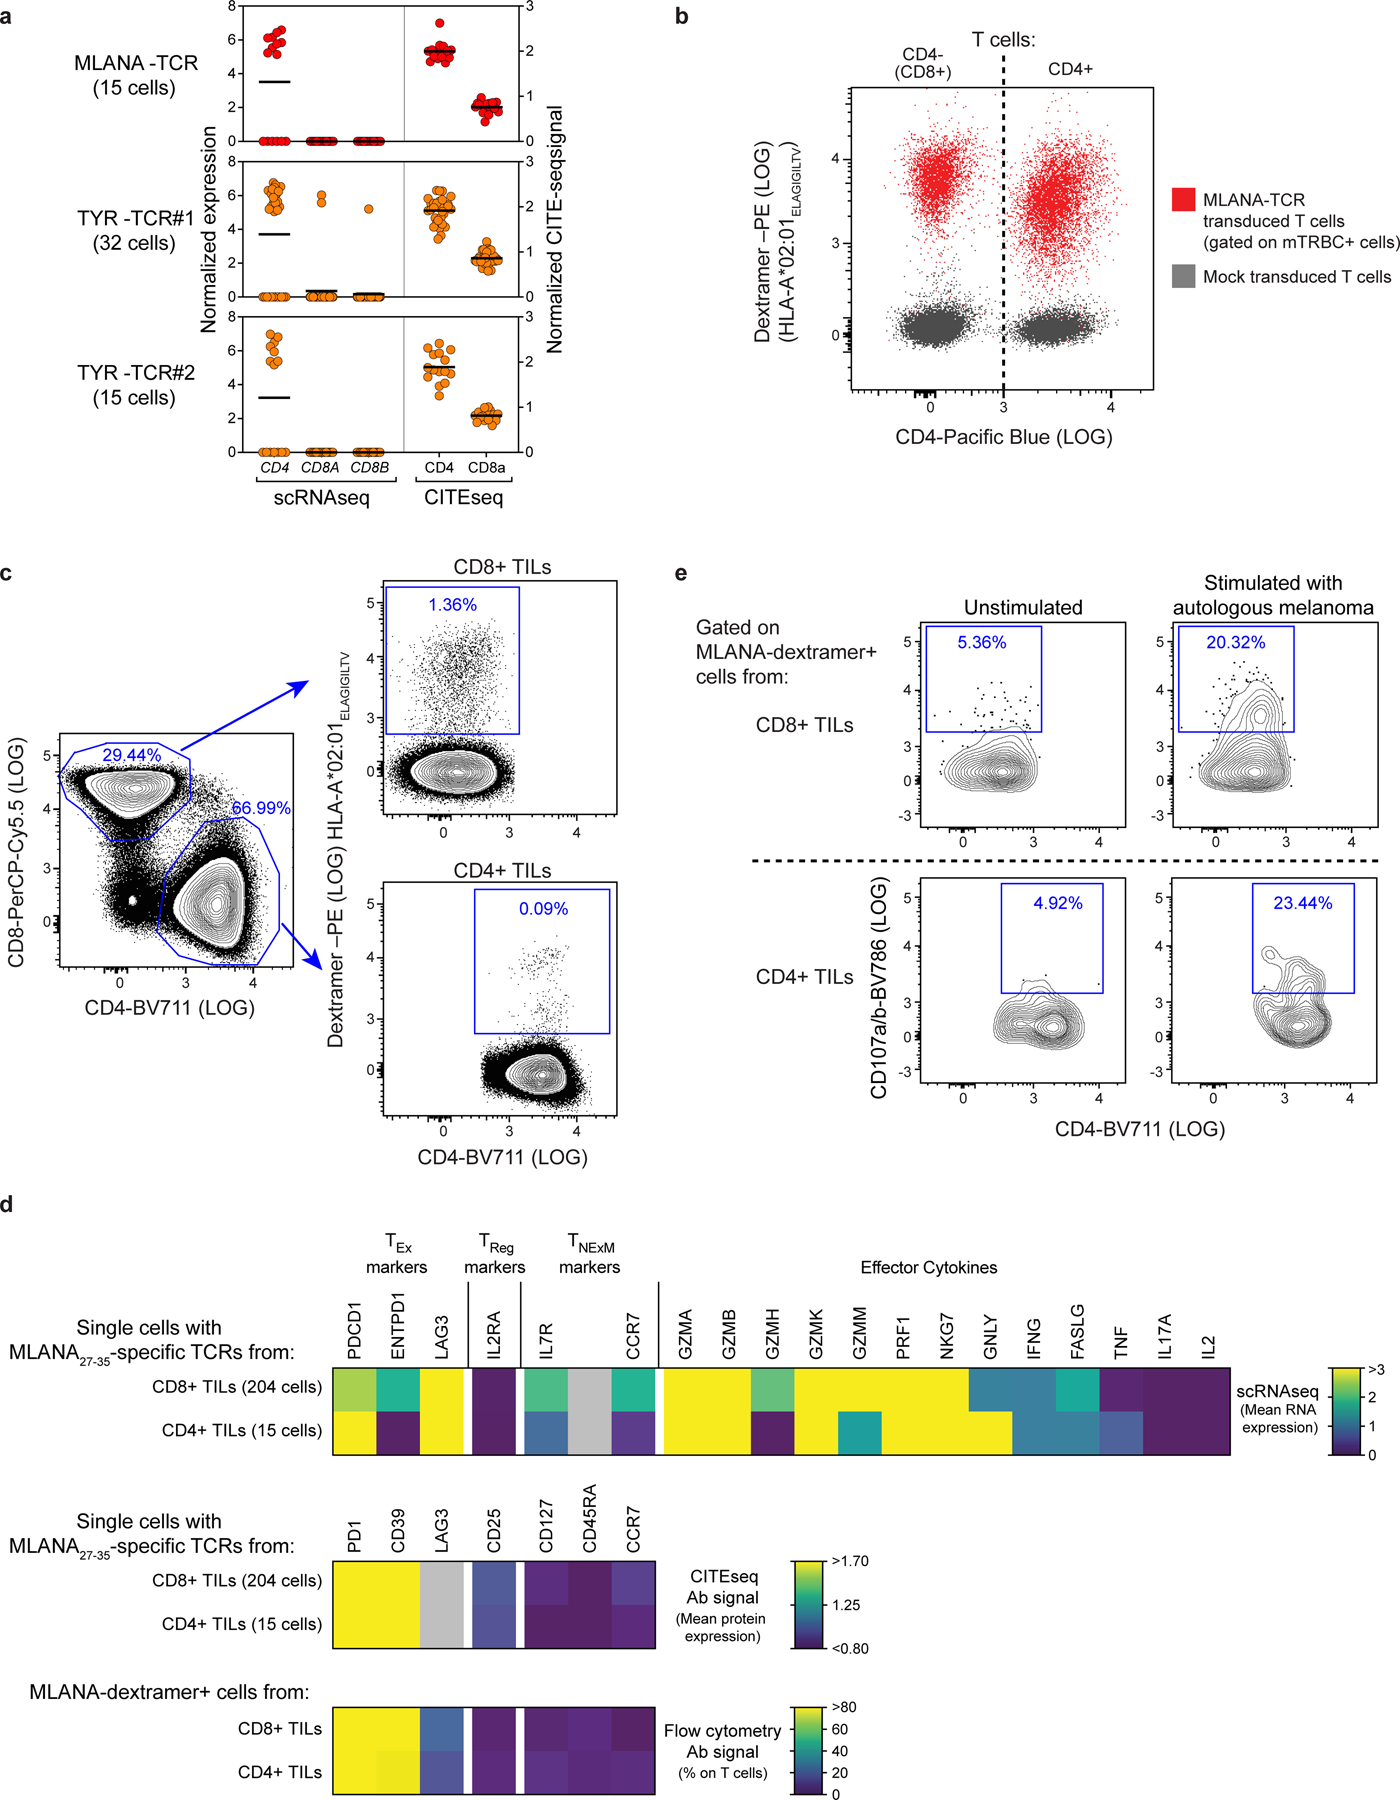
a, Levels of CD4/CD8 transcripts (left, detected by scRNA-seq) or surface proteins (right, detected by CITE-seq) expressed by single cells with CD4+HLA class I restricted TCRs specific for MLANA (n = 1) or TYR (n = 2) isolated from Pt-A. The data indicate that the 3 clonotype families belong to CD4+TILs, despite their reactivity to HLA class I restricted epitopes. b, Flow cytometric plot depicting peptide-HLA binding of T cells transduced with MLANA27–35- specific TCR (red), isolated in CD4+TILs from Pt-A. Transduced T cells comprising CD4+ and CD8+ (CD4−) lymphocytes were stained using HLA-A*02:01 dextramers loaded with MLANA26–35 heteroclitic peptide (ELAGIGILTV). Untransduced T cells (grey) are shown as control. The similar level of binding exhibited by CD4+ and CD8+ T cells demonstrates that tested HLA class I TCR act independently from CD4/CD8 co-stimulation. c, Flow cytometry tracing of MLANA-specific HLA class I restricted CD4+ T cells in Pt-A TILs. Plots depict identification of CD4+ or CD8+ cells within CD3+ TILs from Pt-A (left) and binding to HLA-A*02:01 dextramers loaded with MLANA26–35 heteroclitic peptide among CD4+ or CD8+ TILs (right). Frequencies of each population are provided (blue), demonstrating reliable detected of HLA class I restricted CD4+TILs. d, Phenotype of MLANA-specific HLA class I restricted CD4+TILs from Pt-A. Heatmaps show transcript levels detected by scRNA-seq (top), surface protein expression measured by CITE-seq (middle) or flowcytometry (bottom) for CD4+ T cells with TCRs specific for HLA-A*02:01- MLANA26/27–35 complexes. As comparison, the same analysis was performed on CD8+ TILs specific for the same antigen-HLA (as identified in13) or detected by flow cytometry (as depicted in panel c). Markers detected with all the 3 technologies are shown (exhaustion markers: PD-1, CD39, LAG3; regulatory marker: CD25; memory markers: CD127, CD45RA, CD127). For scRNA-seq (top) transcripts related to effector molecules are reported. Grey color: values not available. This analysis shows that HLA class I restricted CD4+TILs specific for MLANA display an exhausted and cytotoxic phenotype similar to the one of CD8+ TILs. e, Cytotoxicity of HLA-class I-restricted CD4+TILs. Degranulation (CD107a/b upregulation) measured in vitro on MLANA-specific HLA-A*01:02 restricted CD4+ or CD8+ T cells, identified in TILs from Pt-A as depicted in c. Cells were cultured in the absence (left) or presence (right) of autologous melanoma for 6 h. HLA-class I restricted CD4+TILs specific for MLANA antigen (bottom raw) exhibited degranulation levels comparable to those observed for CD8+ counterparts (top raw), demonstrating their ability to mediate cytotoxicity.
Extended Data Fig. 8 |. Avidities of CD4+ MAA/NeoAg-TCRs.
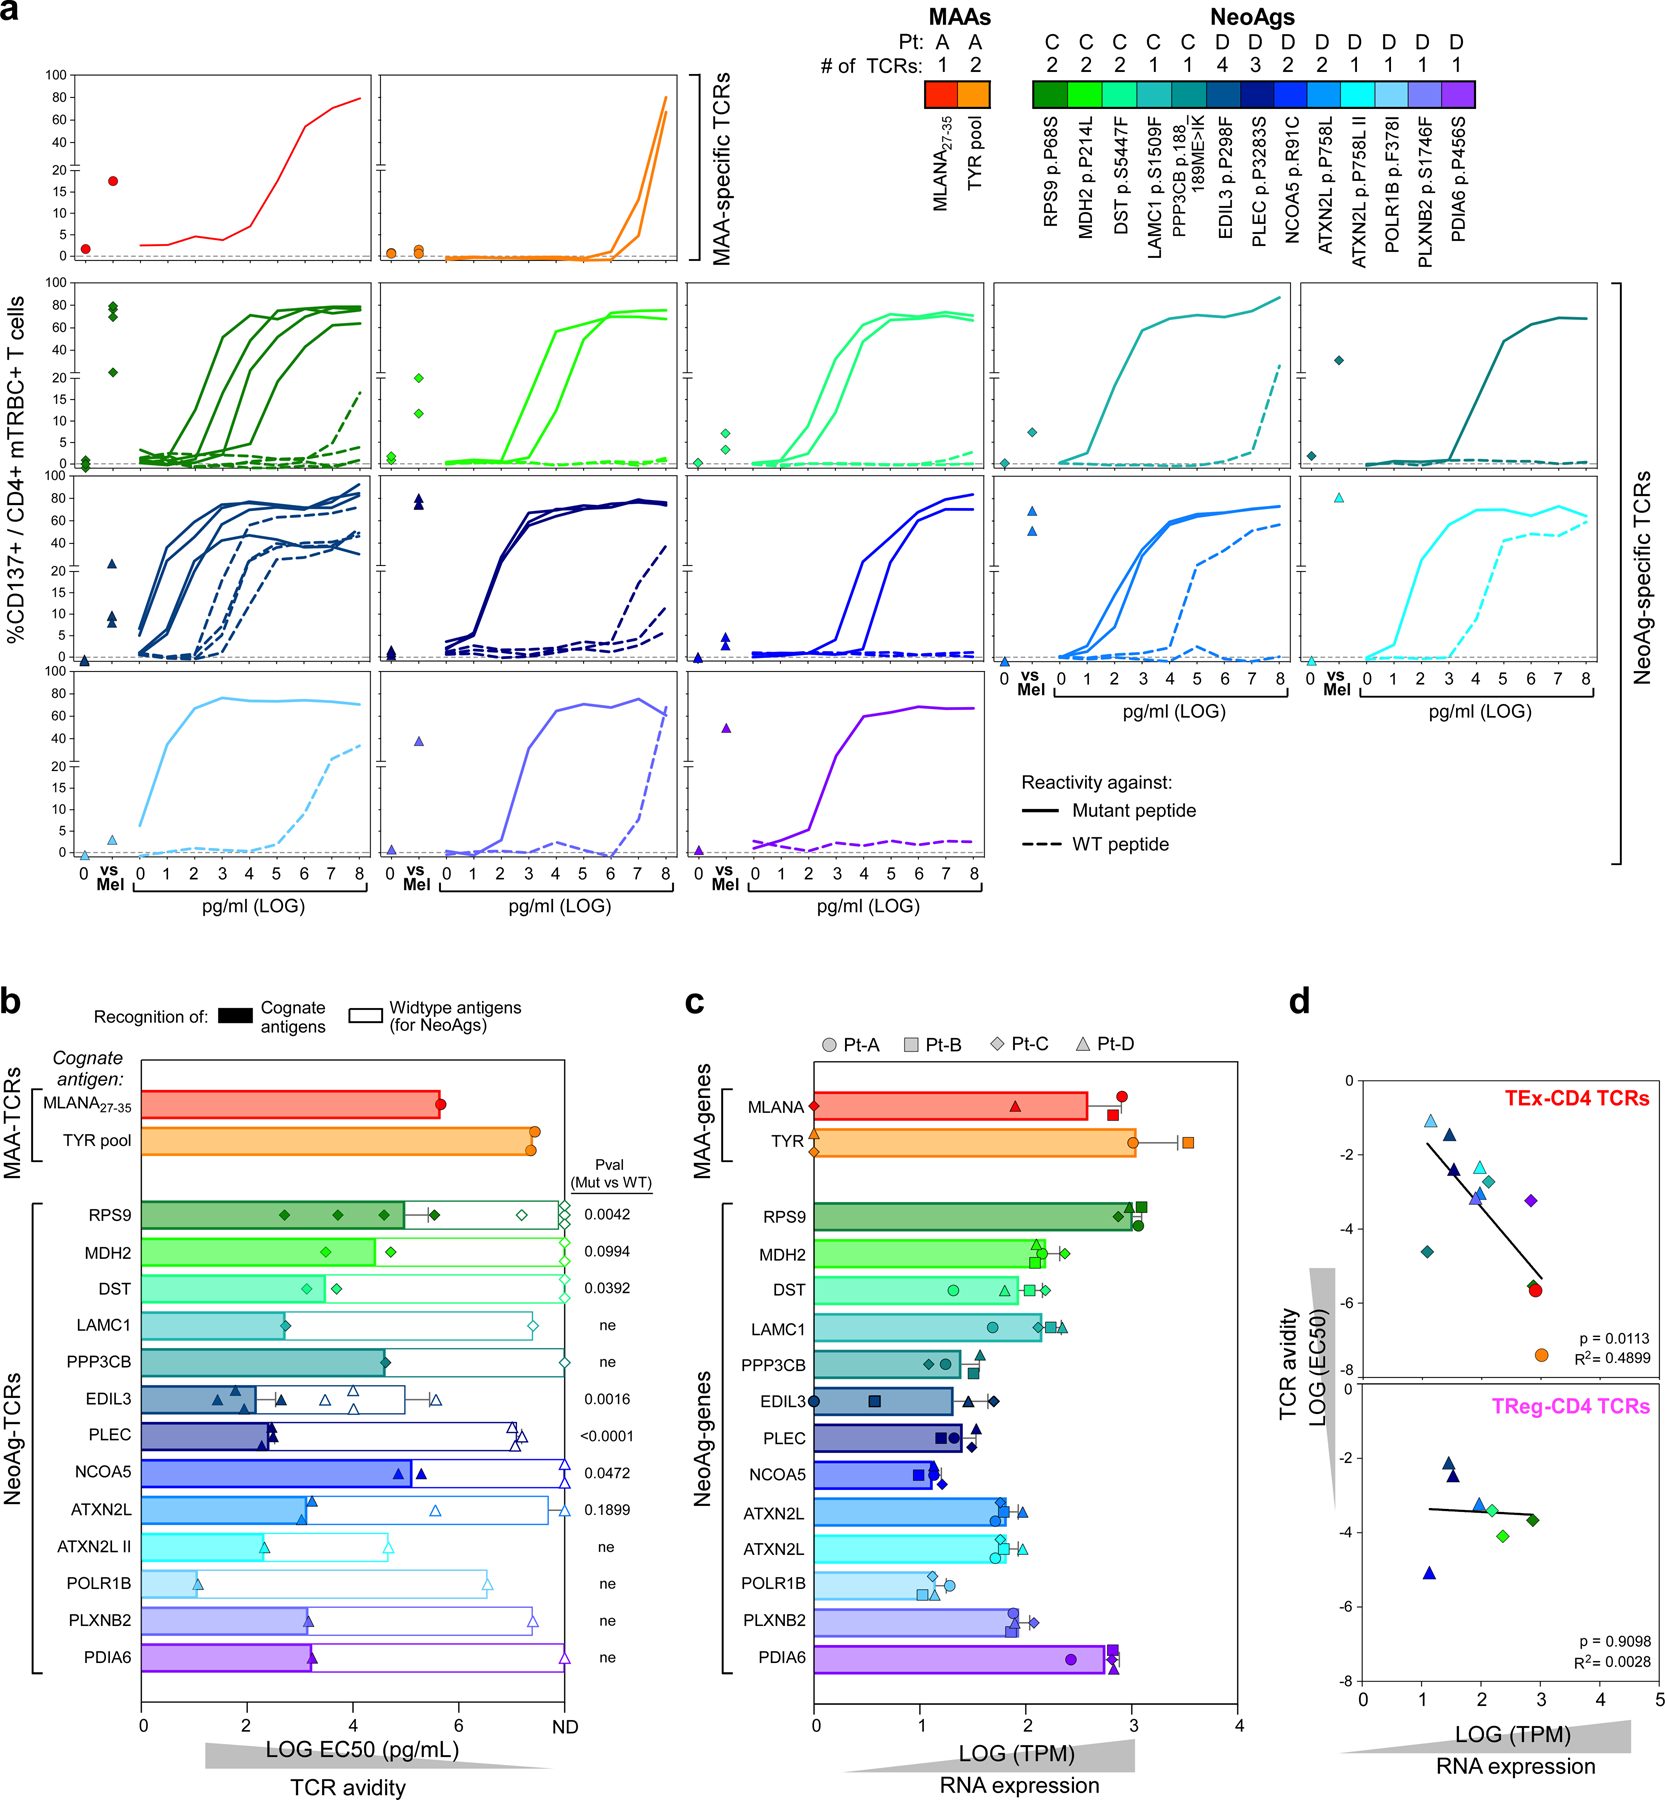
a, Avidity of de- orphanized TCRs with MAA or NeoAg specificity (n = 3 and n = 23 respectively). TCR-dependent CD137 upregulation was measured on TCR-transduced (mTRBC+) CD4+ cells upon culture with patient-derived EBV-LCLs pulsed with increasing concentrations of the cognate antigen (MAAs in the top panels, NeoAgs in bottom panels). Background activation measured on CD4+ T cells transduced with an irrelevant TCR was subtracted. Reactivity to DMSO-pulsed targets (0) and autologous melanoma (pdMel-CL) are reported on the left; for NeoAg-specific TCRs, the dashed lines report reactivity against wildtype peptides. A color legend depicts the different cognate antigens targeted by the deorphanized TCRs and specifies the number of TCRs able to recognize each cognate antigen and the patient the TCR belongs to. b, EC50 calculated from titration curves of MAA or NeoAg-specific TCRs (n = 3 and n = 23 respectively); note that high EC50 values correspond to low TCR avidities. Means with SD are reported, with TCR numbers corresponding to those reported in a. c, Expression levels of MAA or NeoAg transcripts (from bulk RNAseq of pdMel- CLs) from which the analyzed epitopes are generated, as a measure of cognate peptide abundance in tumor cells. Columns show means values with s.d. of values from n = 4 pdMel-CLs (symbols). d, Correlation between the avidity of antitumor CD4+TCRs (y axis) and target abundance (x axis), as measured by RNA expression of TCR-targeted genes detected in the autologous pdMel-CLs and expressed as transcripts per million mapped reads (TPM). Values for TCR avidity represent averages of EC50 data presented in b. The correlation is measured on de-orphanized antitumor CD4+TCR specificities with intratumoral TEx (top) or TReg (bottom) primary clusters, as showed in Fig. 3b, f. Significance of each linear regression is reported within each panel. Symbols: patients from whom TCRs were identified. Colors: cognate antigens of antitumor TCRs, as depicted in a.
Extended Data Fig. 9 |. Quantification of TILs and clinical outcome of patients with melanoma.
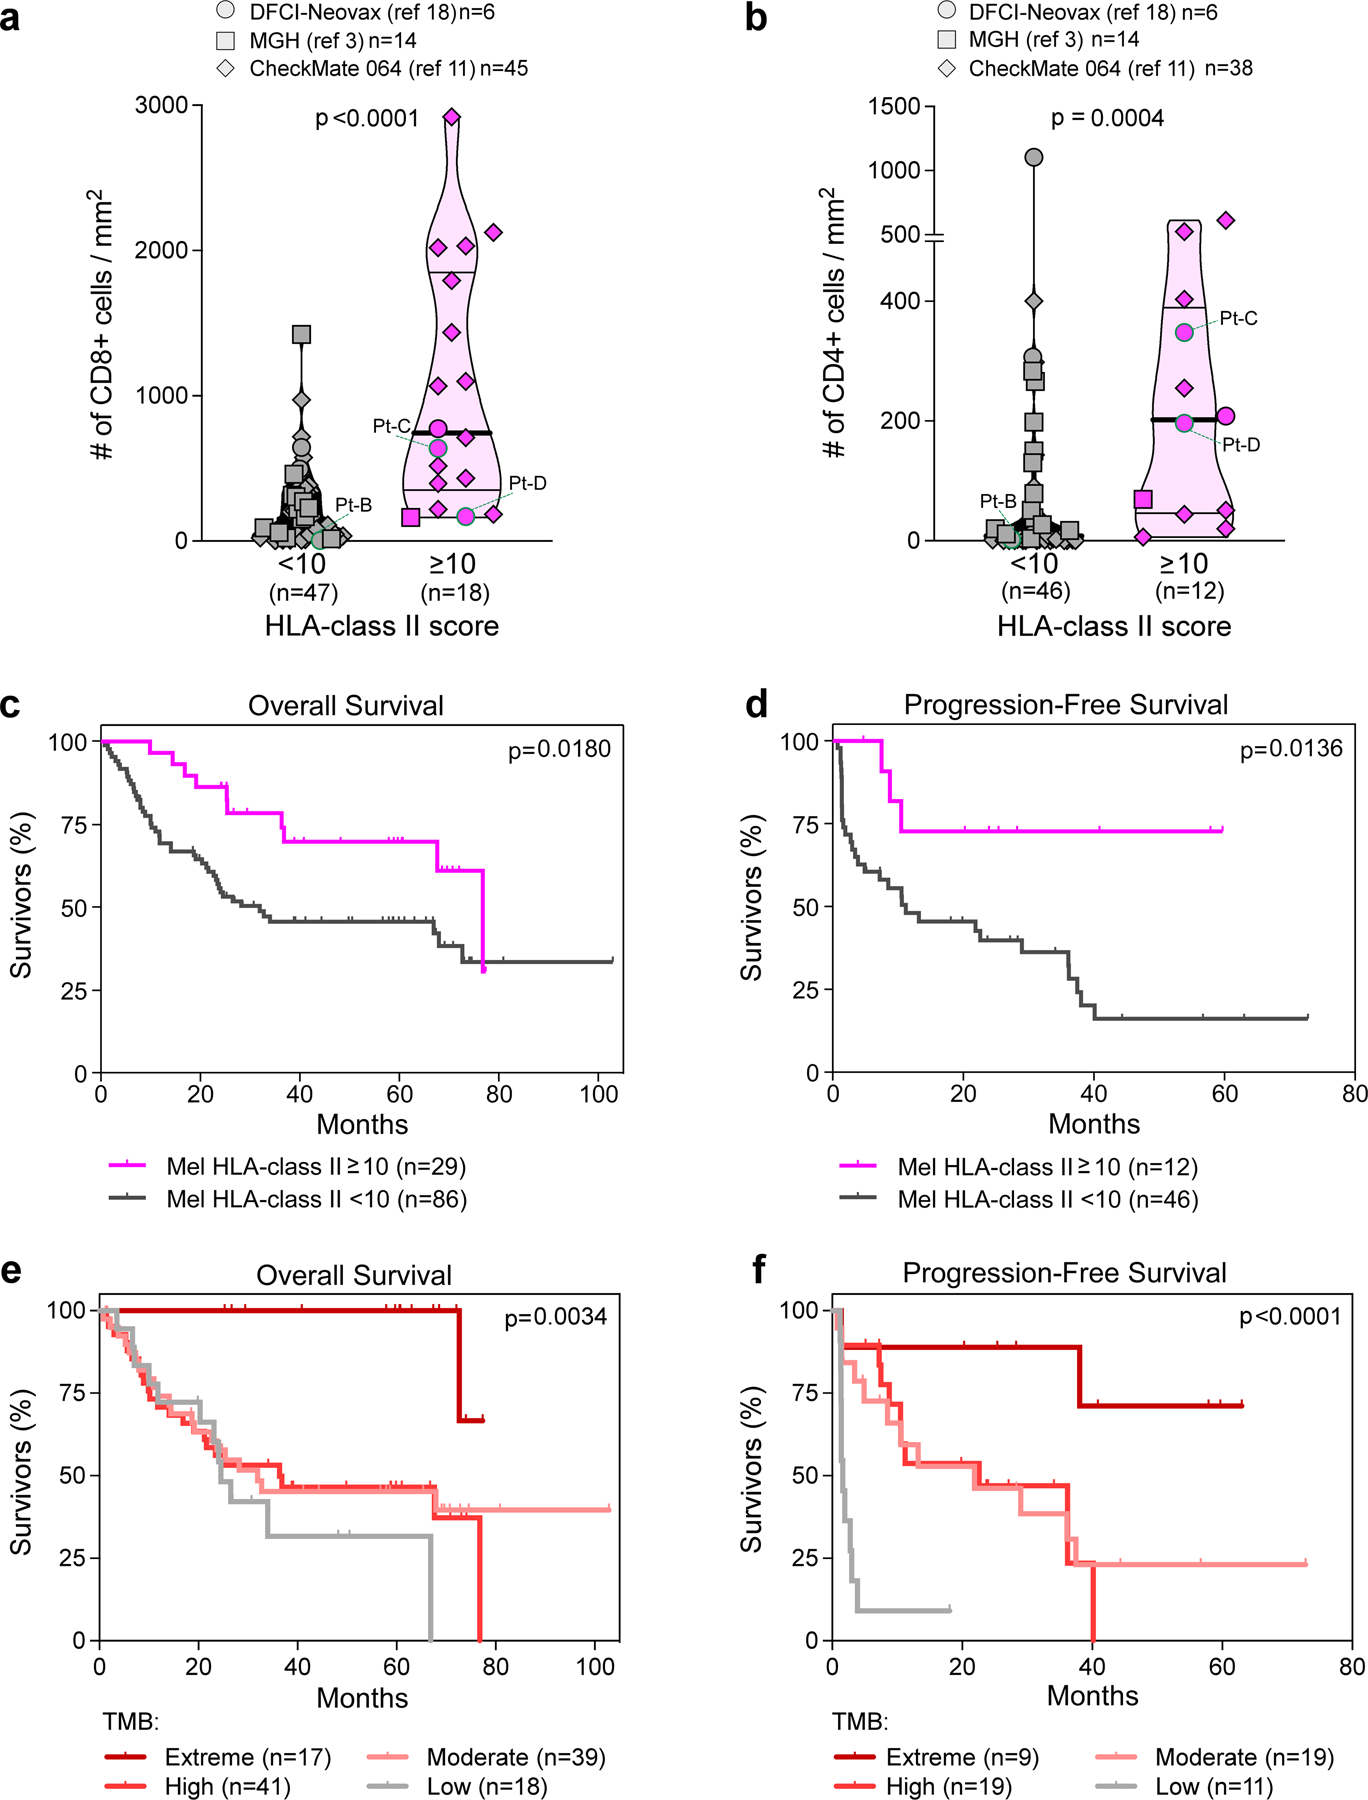
a, b, Quantification of CD8+ (a) and CD4+ (b) TILs detected in tumor specimens from patients reported in cohorts from published studies3,11,18. TILs were quantified in tumor areas using immunohistochemical or immunofluorescence stainings (see Supplementary Information). Only patients with available tumor FFPE were analyzed (n indicated in the legends). Values from patients included in the discovery cohort are labeled (specimens from Pt-A were not available for this analysis). Melanoma were classified based on HLA class II expression, scored on tumor cells by IHC (≥ or < 10% of tumor cells with positive staining). Patients from each study are denoted by different symbol shapes (as reported in each legend, with number of patients for each cohort). Horizontal lines show median (bold) and quartiles values; p-values indicate the significance of comparisons calculated using Mann-Whitney test. c–f, Clinical outcome of patients with melanoma, classified based on tumor HLA class II expression (c, d) or based on classes of tumor mutation burden (e, f), as defined in Fig. 4a and indicated in each color legend. Kaplan-Meier curves estimate the overall survival (c, e) and progression-free survival (d, f) of patients with melanoma from 4 published studies3,11,18,19. Only patients with available overall survival or progression-free survival after treatment with immunotherapies have been analyzed (see Supplementary Table 8). For each category, number of analyzed patients is reported within the legends. P-values indicate the significance of comparison between Kaplan-Meier curves, as obtained using Log-rank Mantel-Cox test between 2 groups (c, d) or 4 groups (e, f).
Extended Data Fig. 10 |. Analysis of HLA class II expression in cancer cell lines.
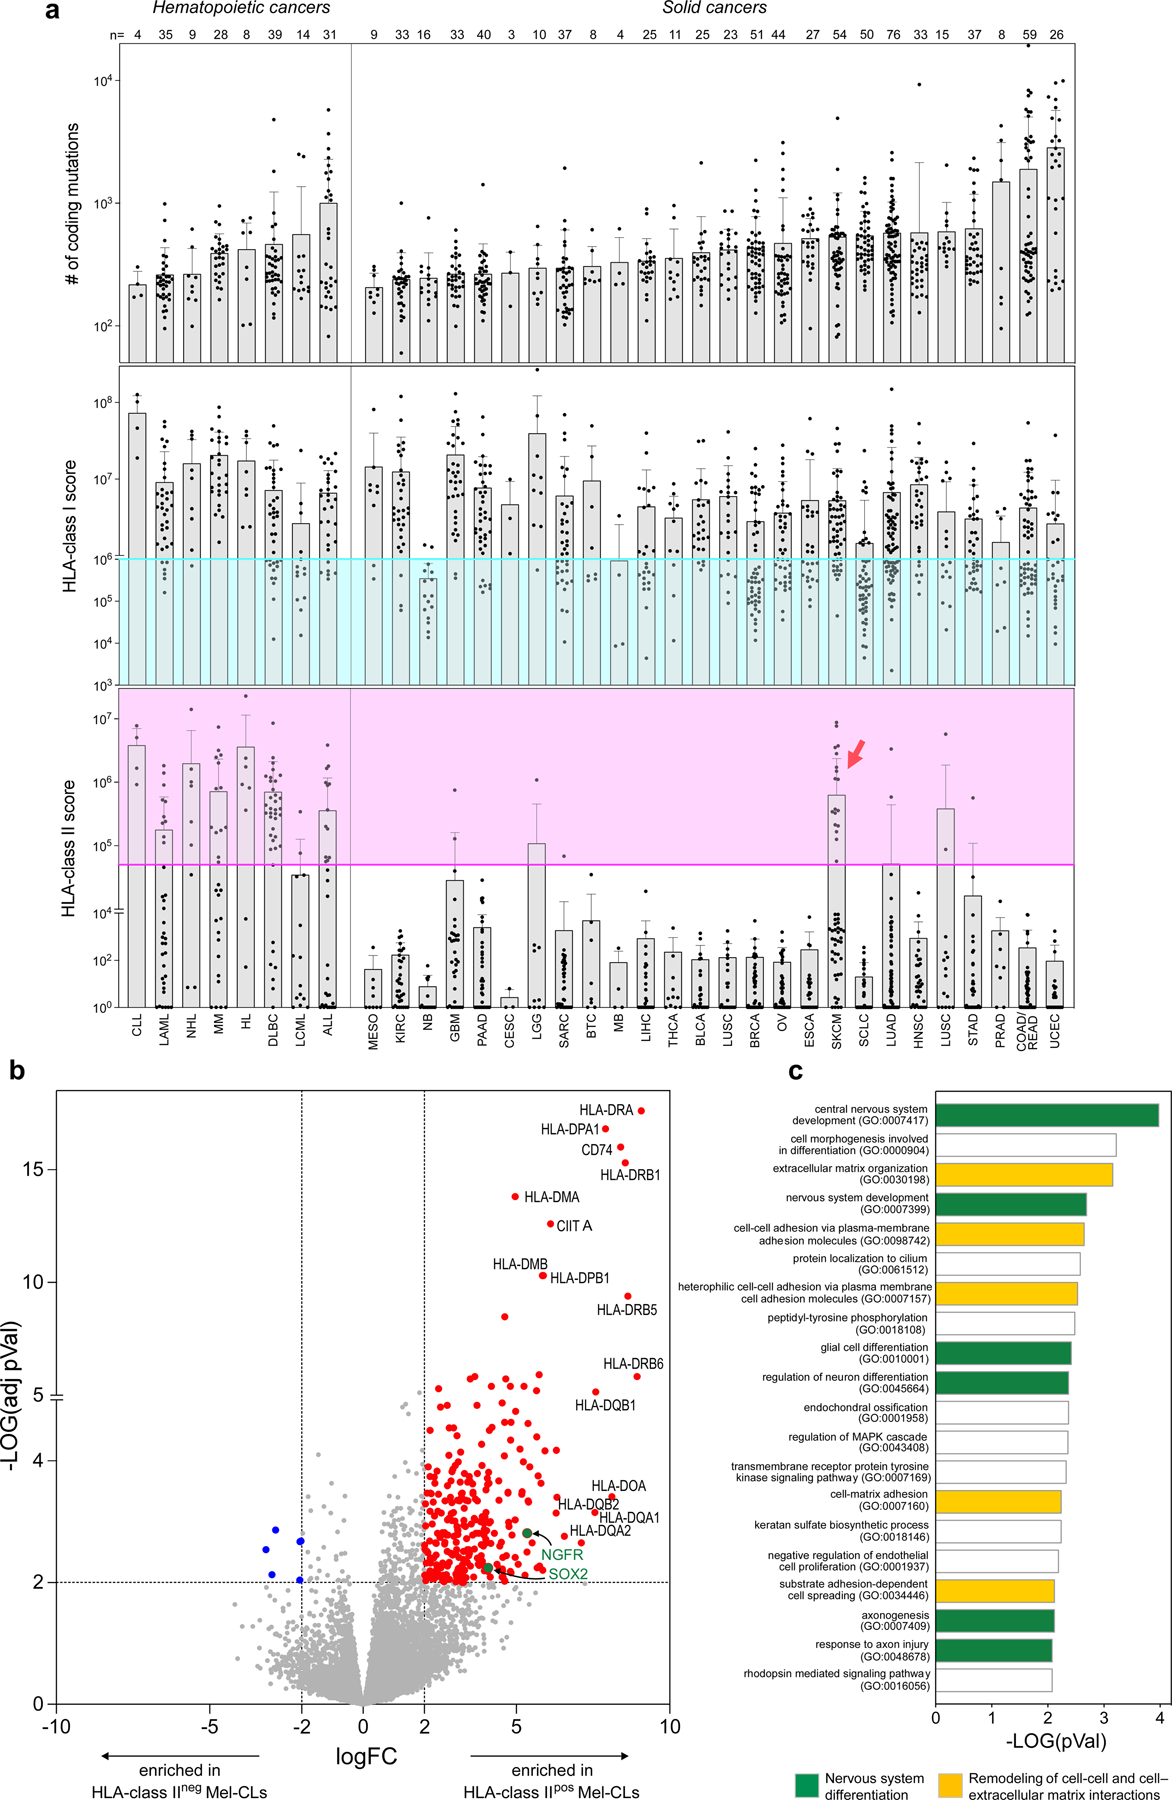
a, Tumor mutation burden (top panel) with HLA class I and HLA class II expression scores (middle and bottom panels) of 927 human cancer cell lines22. HLA class I and II scores have been calculated from RNAseq as described in the Material and Methods section. Colored areas denote downregulation of HLA class I (turquoise) and upregulation of HLA class II (pink). Each tumor type is indicated using the corresponding abbreviation from TCGA (x axis). The number of tested cancer cell lines for each tumor type is reported (top). Bars depict mean values with s.d. Compared to hematopoietic tumors, melanoma (SKCM) represents the sole solid cancer with a relevant number of HLA class IIpos cell lines (red arrow). b, Volcano plot showing RNA transcripts deregulated upon comparison of HLA class IIpos (n = 18) and HLA class IIneg (n = 36) melanoma cell lines (Mel-CLs). Significantly upregulated or downregulated genes (log2FC≥ 2 or log2FC≤ −2, adj-p.value ≤ 0.01) are colored in red or blue respectively. HLA class II related genes are labeled; Upregulated genes previously associated with de-differentiated melanoma23,24,47 are highlighted in green. c, Top 20 gene ontology processes enriched in transcripts upregulated in HLA class IIpos Mel-CLs. HLA class II related genes were excluded from this analysis. Bars depict enrichment, as calculated using two-sided Fisher’s exact test48. Processes related to differentiation of central nervous system are colored in green, while processes related to remodeling of interactions with cells or extracellular matrix are highlighted in yellow. Enrichment in such gene- ontologies, characteristic of neural-crest-like tumors23,24,47, in HLA class IIpos melanoma confirm that HLA class II expression is peculiar of de-differentiated melanoma. No significant deregulation of genes derived from HLA class II RNA- interference screens49 was observed.
Supplementary Material
Acknowledgements
We thank O. Olive, K. Shetty, S. Pollock, C. Patterson, J. L. Weirather and A. Giobbie-Hurder for expert assistance; F. S. Hodi (DFCI Department of Medical Oncology) for help in collection and management of samples and data; and D. Y. Oh, L. Fong, D. M. Pardoll, K. N. Smith, A. Dykema and all members of the Wu laboratory for productive discussions. The authors thank Bristol-Myers Squibb for supporting the work through its International Immuno-Oncology Network. This research was made possible by a generous gift from the Blavatnik Family Foundation, and was supported by grants from the National Institutes of Health (NCI-1R01CA155010; NCI-U24CA224331 (to C.J.W.); NIH/NCI R21 CA216772-01A1 and NCI-SPORE-2P50CA101942-11A1 (to D.B.K); NCI-1R01CA229261 (to P.A.O.); NIH/NCI P01CA229092, NIH/NIAID U19 AI082630 (to K.J.L.); NCI R50CA251956 (to S.L.), R01 CA208756 (to N.H.); NCI K12CA090354 (J.B.I.)), a Conquer Cancer Foundation/Sontag Foundation grant (to J.B.I.), and a Team Science Award from the Melanoma Research Alliance (to C.J.W. and P.A.O.). G.O. was supported by the American Italian Cancer Foundation fellowship. D.A.B. is supported by the DF/HCC Kidney Cancer SPORE (NCI P50CA101942-15) and the DOD CDMRP Academy of Kidney Cancer Investigators (KC190128). This work was further supported by The G. Harold and Leila Y. Mathers Foundation, and the Bridge Project, a partnership between the Koch Institute for Integrative Cancer Research at MIT and the Dana-Farber/Harvard Cancer Center.
Competing interests
E.F.F. is an equity holder and consultant for BioNTech, and equity holder and scientific advisory board member of BioEntre. N.H. and C.J.W. are equity holders of BioNTech. N.H. is an advisor and equity holder for Related Sciences, and receives research funding from Bristol-Myers Squibb. P.A.O. has received research funding from and has advised Neon Therapeutics, Bristol-Myers Squibb, Merck, CytomX, Pfizer, Novartis, Celldex, Amgen, Array, AstraZeneca/MedImmune, Armo BioSciences, Xencor, Oncorus, Phio Pharmaceuticals, Evaxion and Roche/Genentech. C.J.W. is subject to a conflict-of-interest management plan for the reported studies because of her former competing financial interests in Neon Therapeutics, which was acquired by BioNTech. Under this plan, C.J.W. may not access identifiable data for human subjects or otherwise participate directly in the Institutional Review Board-approved protocol reported herein. C.J.W.’s contributions to the overall strategy and data analyses occurred on a de-identified basis. Patent applications have been filed on aspects of the described work entitled as follows: ‘Compositions and methods for personalized neoplasia vaccines’ (N.H., E.F.F. and C.J.W.), ‘Methods for identifying tumour specific neo-antigens’ (N.H. and C.J.W.), ‘Formulations for neoplasia vaccines’ (E.F.F.) and ‘Combination therapy for neoantigen vaccine’ (N.H., C.J.W. and E.F.F.). The Dana-Farber Cancer Institute has a proprietary and financial interest in the personalized neoantigen vaccine. S.J.R. has research funding from Bristol-Myers-Squibb and KITE/Gilead. S.J.R. is a member of the scientific advisory board of Immunitas Therapeutics. D.A.B. reports personal fees from LM Education and Exchange, Adnovate Strategies, MDedge, Cancer Network, Cancer Expert Now, OncLive, Catenion, AVEO, and grants and personal fees from Exelixis, outside the submitted work. M.S.-F. receives research funding from Bristol-Myers Squibb. M.W.-R. was an employee of Bristol-Myers Squibb and holds equity in Bristol-Myers Squibb. D.B.K. has previously advised Neon Therapeutics and has received consulting fees from Neon Therapeutics. D.B.K. owns equity in Affimed N.V., Armata Pharmaceuticals, Breakbio, BioMarin Pharmaceutical, Bristol-Myers Squibb, Celldex Therapeutics, Editas Medicine, Exelixis, Gilead Sciences, Immunitybio, ImmunoGen, IMV, Lexicon Pharmaceuticals, Moderna, Neoleukin Therapeutics, Regeneron Pharmaceuticals. BeiGene, a Chinese biotech company, supports unrelated research at the DFCI Translational Immunogenomics Laboratory (TIGL). S.A.C. is a member of the scientific advisory boards of Kymera, PTM BioLabs and Seer and a scientific advisor to Pfizer and Biogen. The remaining authors declare no competing interests.
Footnotes
Online content
Any methods, additional references, Nature Research reporting summaries, source data, extended data, supplementary information, acknowledgements, peer review information; details of author contributions and competing interests; and statements of data and code availability are available at https://doi.org/10.1038/s41586-022-04682-5.
Supplementary information The online version contains supplementary material available at https://doi.org/10.1038/s41586-022-04682-5.
Data availability
The scRNA-seq, TCR-seq and CITE-seq sequencing results are available through the dbGaP portal (study ID 26121, accession number phs001451.v3.p1). All other data and codes are presented in the main text or in the supplementary materials and are available from the corresponding authors upon reasonable request.
Code availability
Code used for data analysis included the Broad Institute Picard Pipeline (WES and RNA-seq), GATK4 v4.0, Mutect2 v2.7.0 (single nucleotide variants (SNV) and indel identification), NetMHCpan 4.0 and NetMHCIIpan 4.0 (neoantigen binding prediction), ContEst v1 (contamination estimation), ABSOLUTE v1.1 (purity/ploidy estimation), STAR v2.6.1c (sequencing alignment), RSEM v1.3.1 (gene expression quantification), Seurat v3.2.0 (single-cell sequencing analysis), Harmony v1.0 (single-cell data normalization), SingleR v3.22 (scater package), Scanpy v1.5.1, Python v3.7.4 (for comparison with other single-cell datasets), EdgeR (to compare bulk RNA-seq expression), EnrichR (to analyse enrichment of gene ontologies) that are each publicly available. Custom computer code used to generate the analyses is available at https://github.com/kstromhaug/oliveira-stromhaug-cd4-code.
References
- 1.Sallusto F & Lanzavecchia A Heterogeneity of CD4+ memory T cells: functional modules for tailored immunity. Eur. J. Immunol 39, 2076–2082 (2009). [DOI] [PubMed] [Google Scholar]
- 2.Swain SL, McKinstry KK & Strutt TM Expanding roles for CD4+ T cells in immunity to viruses. Nat. Rev. Immunol 12, 136–148 (2012). [DOI] [PMC free article] [PubMed] [Google Scholar]
- 3.Sade-Feldman M et al. Defining T cell states associated with response to checkpoint immunotherapy in melanoma. Cell 175, 998–1013.e20 (2018). [DOI] [PMC free article] [PubMed] [Google Scholar]
- 4.Yost KE et al. Clonal replacement of tumor-specific T cells following PD-1 blockade. Nat. Med 25, 1251–1259 (2019). [DOI] [PMC free article] [PubMed] [Google Scholar]
- 5.Wu TD et al. Peripheral T cell expansion predicts tumour infiltration and clinical response. Nature 579, 274–278 (2020). [DOI] [PubMed] [Google Scholar]
- 6.Oh DY et al. Intratumoral CD4+ T cells mediate anti-tumor cytotoxicity in human bladder cancer. Cell 181, 1612–1625.e13 (2020). [DOI] [PMC free article] [PubMed] [Google Scholar]
- 7.Cachot A et al. Tumor-specific cytolytic CD4 T cells mediate immunity against human cancer. Sci. Adv 7, eabe3348 (2021). [DOI] [PMC free article] [PubMed] [Google Scholar]
- 8.Quezada SA et al. Tumor-reactive CD4+ T cells develop cytotoxic activity and eradicate large established melanoma after transfer into lymphopenic hosts. J. Exp. Med 207, 637–650 (2010). [DOI] [PMC free article] [PubMed] [Google Scholar]
- 9.Tanaka A & Sakaguchi S Regulatory T cells in cancer immunotherapy. Cell Res. 27, 109–118 (2017). [DOI] [PMC free article] [PubMed] [Google Scholar]
- 10.Borst J, Ahrends T, Bąbała N, Melief CJM & Kastenmü W CD4+ T cell help in cancer immunology and immunotherapy. Nat. Rev. Immunol 18, 635–647 (2018). [DOI] [PubMed] [Google Scholar]
- 11.Rodig SJ et al. MHC proteins confer differential sensitivity to CTLA-4 and PD-1 blockade in untreated metastatic melanoma. Sci. Transl. Med 10, eaar3342 (2018). [DOI] [PubMed] [Google Scholar]
- 12.Johnson DB et al. Melanoma-specific MHC-II expression represents a tumour-autonomous phenotype and predicts response to anti-PD-1/PD-L1 therapy. Nat. Commun 7, 10582 (2016). [DOI] [PMC free article] [PubMed] [Google Scholar]
- 13.Oliveira G et al. Phenotype, specificity and avidity of antitumour CD8+ T cells in melanoma. Nature 596, 119–125 (2021). [DOI] [PMC free article] [PubMed] [Google Scholar]
- 14.Stoeckius M et al. Simultaneous epitope and transcriptome measurement in single cells. Nat. Methods 14, 865–868 (2017). [DOI] [PMC free article] [PubMed] [Google Scholar]
- 15.Miller BC et al. Subsets of exhausted CD8+ T cells differentially mediate tumor control and respond to checkpoint blockade. Nat. Immunol 20, 326–336 (2019). [DOI] [PMC free article] [PubMed] [Google Scholar]
- 16.Wolfl M et al. Activation-induced expression of CD137 permits detection, isolation, and expansion of the full repertoire of CD8+ T cells responding to antigen without requiring knowledge of epitope specificities. Blood 110, 201–210 (2007). [DOI] [PMC free article] [PubMed] [Google Scholar]
- 17.Kawakami Y et al. Identification of a human melanoma antigen recognized by tumor-infiltrating lymphocytes associated with in vivo tumor rejection. Proc. Natl Acad. Sci. USA 91, 6458–6462 (1994). [DOI] [PMC free article] [PubMed] [Google Scholar]
- 18.Hu Z et al. Personal neoantigen vaccines induce persistent memory T cell responses and epitope spreading in patients with melanoma. Nat. Med 27, 515–525 (2021). [DOI] [PMC free article] [PubMed] [Google Scholar]
- 19.Anagnostou V et al. Integrative tumor and immune cell multi-omic analyses predict response to immune checkpoint blockade in melanoma. Cell Rep. Med 1, 100139 (2020). [DOI] [PMC free article] [PubMed] [Google Scholar]
- 20.Sade-Feldman M et al. Resistance to checkpoint blockade therapy through inactivation of antigen presentation. Nat. Commun 8, 1136 (2017). [DOI] [PMC free article] [PubMed] [Google Scholar]
- 21.Garrido F MHC/HLA class I loss in cancer cells. Adv. Exp. Med. Biol 1151, 15–78 (2019). [DOI] [PubMed] [Google Scholar]
- 22.Ghandi M et al. Next-generation characterization of the Cancer Cell Line Encyclopedia. Nature 569, 503–508 (2019). [DOI] [PMC free article] [PubMed] [Google Scholar]
- 23.Landsberg J et al. Melanomas resist T-cell therapy through inflammation-induced reversible dedifferentiation. Nature 490, 412–416 (2012). [DOI] [PubMed] [Google Scholar]
- 24.Boshuizen J et al. Reversal of pre-existing NGFR-driven tumor and immune therapy resistance. Nat. Commun 11, 3946 (2020). [DOI] [PMC free article] [PubMed] [Google Scholar]
- 25.Guo X et al. Global characterization of T cells in non-small-cell lung cancer by single-cell sequencing. Nat. Med 24, 978–985 (2018). [DOI] [PubMed] [Google Scholar]
- 26.Ahmadzadeh M et al. FOXP3 expression accurately defines the population of intratumoral regulatory T cells that selectively accumulate in metastatic melanoma lesions. Blood 112, 4953–4960 (2008). [DOI] [PMC free article] [PubMed] [Google Scholar]
- 27.De Simone M et al. Transcriptional landscape of human tissue lymphocytes unveils uniqueness of tumor-infiltrating T regulatory cells. Immunity 45, 1135–1147 (2016). [DOI] [PMC free article] [PubMed] [Google Scholar]
- 28.Marangoni F et al. Expansion of tumor-associated Treg cells upon disruption of a CTLA- 4-dependent feedback loop. Cell 184, 3998–4015.e19 (2021). [DOI] [PMC free article] [PubMed] [Google Scholar]
- 29.Li H et al. Dysfunctional CD8 T cells form a proliferative, dynamically regulated compartment within human melanoma. Cell 176, 775–789.e18 (2019). [DOI] [PMC free article] [PubMed] [Google Scholar]
- 30.Tirosh I et al. Dissecting the multicellular ecosystem of metastatic melanoma by single-cell RNA-seq. Science 352, 189–196 (2016). [DOI] [PMC free article] [PubMed] [Google Scholar]
- 31.Jerby-Arnon L et al. A cancer cell program promotes T cell exclusion and resistance to checkpoint blockade. Cell 175, 984–997.e24 (2018). [DOI] [PMC free article] [PubMed] [Google Scholar]
- 32.Jhunjhunwala S, Hammer C & Delamarre L Antigen presentation in cancer: insights into tumour immunogenicity and immune evasion. Nat. Rev. Cancer 21, 298–312 (2021). [DOI] [PubMed] [Google Scholar]
- 33.Vagaska B et al. MHC-class-II are expressed in a subpopulation of human neural stem cells in vitro in an IFNγ-independent fashion and during development. Sci Rep. 6, 24251 (2016). [DOI] [PMC free article] [PubMed] [Google Scholar]
- 34.Diener J & Sommer L Reemergence of neural crest stem cell-like states in melanoma during disease progression and treatment. Stem Cells Transl. Med 10, 522–533 (2021). [DOI] [PMC free article] [PubMed] [Google Scholar]
- 35.Ott PA et al. An immunogenic personal neoantigen vaccine for patients with melanoma. Nature 547, 217–221 (2017). [DOI] [PMC free article] [PubMed] [Google Scholar]
- 36.Stuart T et al. Comprehensive integration of single-cell data. Cell 177, 1888–1902.e21 (2019). [DOI] [PMC free article] [PubMed] [Google Scholar]
- 37.Korsunsky I et al. Fast, sensitive and accurate integration of single-cell data with Harmony. Nat. Methods 16, 1289–1296 (2019). [DOI] [PMC free article] [PubMed] [Google Scholar]
- 38.Solé-Boldo L, et al. Single-cell transcriptomes of the human skin reveal age-related loss of fibroblast priming. Commun. Biol 3, 188 (2020). [DOI] [PMC free article] [PubMed] [Google Scholar]
- 39.Cohen CJ, Zhao Y, Zheng Z, Rosenberg SA & Morgan RA Enhanced antitumor activity of murine-human hybrid T-cell receptor (TCR) in human lymphocytes is associated with improved pairing and TCR/CD3 stability. Cancer Res. 66, 8878–8886 (2006). [DOI] [PMC free article] [PubMed] [Google Scholar]
- 40.Haga-Friedman A, Horovitz-Fried M & Cohen CJ Incorporation of transmembrane hydrophobic mutations in the TCR enhance its surface expression and T cell functional avidity. J. Immunol 188, 5538–5546 (2012). [DOI] [PubMed] [Google Scholar]
- 41.Bialer G, Horovitz-Fried M, Ya’acobi S, Morgan RA & Cohen CJ Selected murine residues endow human TCR with enhanced tumor recognition. J. Immunol 184, 6232–6241 (2010). [DOI] [PubMed] [Google Scholar]
- 42.Hu Z et al. A cloning and expression system to probe T-cell receptor specificity and assess functional avidity to neoantigens. Blood 132, 1911–1921 (2018). [DOI] [PMC free article] [PubMed] [Google Scholar]
- 43.Reynisson B et al. Improved prediction of MHC II antigen presentation through integration and motif deconvolution of mass spectrometry MHC eluted ligand data. J. Proteome Res 19, 2304–2315 (2020). [DOI] [PubMed] [Google Scholar]
- 44.Sarkizova S et al. A large peptidome dataset improves HLA class I epitope prediction across most of the human population. Nat. Biotechnol 38, 199–209 (2020). [DOI] [PMC free article] [PubMed] [Google Scholar]
- 45.Abelin JG et al. Mass spectrometry profiling of HLA-associated peptidomes in mono-allelic cells enables more accurate epitope prediction. Immunity 46, 315–326 (2017). [DOI] [PMC free article] [PubMed] [Google Scholar]
- 46.Roemer MGM et al. Classical Hodgkin lymphoma with reduced β2M/MHC class I expression is associated with inferior outcome independent of 9p24.1 status. Cancer Immunol. Res 4, 910–916 (2016). [DOI] [PMC free article] [PubMed] [Google Scholar]
- 47.Restivo G et al. low neurotrophin receptor CD271 regulates phenotype switching in melanoma. Nat. Commun 8, 1988 (2017). [DOI] [PMC free article] [PubMed] [Google Scholar]
- 48.Kuleshov MV et al. Enrichr: a comprehensive gene set enrichment analysis web server 2016 update. Nucleic Acids Res 44, W90–W97 (2016). [DOI] [PMC free article] [PubMed] [Google Scholar]
- 49.Paul P et al. A Genome-wide multidimensional RNAi screen reveals pathways controlling MHC class II antigen presentation. Cell 145, 268–283 (2011). [DOI] [PubMed] [Google Scholar]
Associated Data
This section collects any data citations, data availability statements, or supplementary materials included in this article.
Supplementary Materials
Data Availability Statement
The scRNA-seq, TCR-seq and CITE-seq sequencing results are available through the dbGaP portal (study ID 26121, accession number phs001451.v3.p1). All other data and codes are presented in the main text or in the supplementary materials and are available from the corresponding authors upon reasonable request.
Code used for data analysis included the Broad Institute Picard Pipeline (WES and RNA-seq), GATK4 v4.0, Mutect2 v2.7.0 (single nucleotide variants (SNV) and indel identification), NetMHCpan 4.0 and NetMHCIIpan 4.0 (neoantigen binding prediction), ContEst v1 (contamination estimation), ABSOLUTE v1.1 (purity/ploidy estimation), STAR v2.6.1c (sequencing alignment), RSEM v1.3.1 (gene expression quantification), Seurat v3.2.0 (single-cell sequencing analysis), Harmony v1.0 (single-cell data normalization), SingleR v3.22 (scater package), Scanpy v1.5.1, Python v3.7.4 (for comparison with other single-cell datasets), EdgeR (to compare bulk RNA-seq expression), EnrichR (to analyse enrichment of gene ontologies) that are each publicly available. Custom computer code used to generate the analyses is available at https://github.com/kstromhaug/oliveira-stromhaug-cd4-code.


