

Abstract
Autism spectrum disorder (ASD) is a highly prevalent, heterogenous neurodevelopmental disorder. Neuroimaging methods such as functional, structural, and diffusion MRI have been used to identify candidate imaging biomarkers for ASD, but current findings remain non-specific and likely arise from the heterogeneity present in ASD. To account for this, efforts to subtype ASD have emerged as a potential strategy for both the study of ASD and advancement of tailored behavioral therapies and therapeutics. Towards these ends, to improve upon current neuroimaging methods, we propose combining biologically sensitive neurite orientation dispersion and density index (NODDI) diffusion MR imaging with radiomics image processing to create a new methodological approach that, we hypothesize, can sensitively and specifically capture neurobiology. We demonstrate this method can sensitively distinguish differences between four genetically distinct rat models of ASD (Fmr1, Pten, Nrxn1, Disc1). Further, we demonstrate diffusion radiomic analyses hold promise for subtyping in ASD as we show unsupervised clustering of NODDI radiomic data generates clusters specific to the underlying genetic differences between the animal models. Taken together, our findings suggest the unique application of radiomic analysis on NODDI diffusion MRI may have the capacity to sensitively and specifically disambiguate the neurobiological heterogeneity present in the ASD population.
Keywords: diffusion MRI, radiomics, NODDI, autism spectrum disorder, subtyping
1. Introduction
Autism spectrum disorder (ASD) is a complex, sexually-dimorphic, and biologically heterogenous neurodevelopmental disorder affecting nearly 1 in 44 children [1–3]. Despite this high prevalence, the availability of precise, effective, and targeted treatments has been frustratingly limited. Precluding the development of effective therapeutics is the absence of objective, quantifiable diagnostic instruments to aid in both the diagnosis and treatment monitoring of ASD patients. To bridge this gap, recent attention has turned to using structural and functional MRI to identify quantitative biomarkers [4–6]; however, while these studies have identified brain alterations and affected cognition networks in patient populations, a bona fide diagnostic biomarker remains elusive[7] and potentially arises from an inability of these approaches to account for the sheer breadth of biological permutations underlying ASD [8,9]. Without accounting for the underlying neurobiological mechanisms of disease, these methods fail to identify meaningful ASD subgroups or subtypes, which are vital for studying and targeting well-defined patient populations in ASD [10,11].
Diffusion-weighted MR imaging (DWI) techniques enable non-invasive characterization of neuronal cytoarchitecture at the mesoscale (1 – 100 μm) by measuring the water diffusion signal and provides a novel technical approach towards characterizing ASD. As water diffuses in the complex cellular microenvironment, its movement is hindered or restricted by biophysical components such as cell membranes and extracellular structures [12–14] (Fig. 1a). Therefore, the measured diffusion signal more directly relates to underlying cellular and molecular phenomenon than traditional structural (T1, T2) or functional (BOLD) neuroimaging techniques. More recently, mathematical and technical advances have improved upon standard DWI techniques (such as diffusion tensor imaging) to enable higher sensitivity and specificity of microstructural properties through multicompartment diffusion-weighted imaging (MC-DWI). MC-DWI produces greater tissue specificity than standard DWI techniques by employing biophysical model-based strategies designed to measure water diffusion in distinct tissue compartments. With this technique, the water diffusion signal specific to the intra-neurite, extra-neurite, and cerebral spinal fluid (CSF) compartments can be calculated [15–18] (Fig. 1b, c). In doing so, MC-DWI data, fitted to biophysical models like neurite orientation dispersion and density index (NODDI), have demonstrated increased sensitivity and specificity to neurological changes associated with neurodevelopmental and neurodegenerative diseases [19–25]. Two recent human studies have used the NODDI model to detect microstructural changes in ASD patients which have been correlated with abnormal sensory processing [26,27]. A third study demonstrated the ability to distinguish control adults from ASD adults using intra-neurite and CSF signal from the NODDI model [24]. In line with these results, recent work from our own laboratory has demonstrated the ability of the NODDI model’s signal to sensitively capture neuroimaging differences in genetic and small animal models of neuropsychiatric illness [28–33]. However, despite the exquisite sensitivity of the NODDI model to microstructural changes, these identified differences remain non-specific as similar changes can be identified in other neurological conditions [25]. Thus, this non-specificity from the analyzed diffusion signal makes these differences unsuitable as putative neuroimaging biomarkers of ASD.
Figure 1:

a) Multicompartment diffusion MRI data is collected and fitted to b) biophysical models, which are comprised of c) discrete signals assignable to specific biophysical compartments. These compartment signals capture microstructural information in biophysical locations such as the extraneurite, intraneurite, and cerebrospinal fluid spaces. These signals can then be d) highly parameterized (beyond conventional voxel-wise comparisons and mean signal measures [grey box]) with radiomics processing [yellow box], enabling access to more complex biological information encoded in these signals which thereby increases sensitivity and specificity of diffusion signal analyses.
Conventional methods for analysis of diffusion data rely primarily on voxel-wise comparisons to identify differences in diffusion across the whole brain (e.g., tract based- and gray matter based- spatial statistics) or rely on the mean signal to perform region of interest (ROI)-based investigations (Fig. 1d; grey box). These conventional analyses likely contribute to the observed non-specificity in imaging findings that limit effective interpretation. Voxel-wise comparisons are often hypothesis-free and usually reveal disparate differences across the brain; interpretability, however, is limited as the relationship to functional neuroanatomical structures is not apparent [34–36]. ROI-based investigations provide the advantage of targeting an area of interest, though these analyses have only used one measurement (mean signal values) for describing an ROI. While more interpretable, this one measurement alone cannot provide enough information to specifically parse the complex biology underlying identified differences in the diffusion signal.
To improve the specificity of imaging data, new image analysis techniques such as radiomics have been recently employed [37]. Radiomics is the quantification of highly parameterized texture features from medical images [38–40]. Texture features (radiomic features) capture the spatial relationship between signal in an image. The use of these features for biomarker development is predicated on the hypothesis that radiomic features capture specific information about the underlying pathophysiology of the imaged region (Fig. 1d; yellow box) and importantly, vastly expand the available measurements that can be calculated and subsequently associated to underlying neurobiology. To date, radiomic analyses have been primarily applied to CT images in oncologic imaging. Analyses of these multi-dimensional, quantitative texture features have been shown to lead to significant insights of the underlying oncologic processes and features, such as tumor grade and histologic subtype, beyond insights gleaned just from conventional measures of tissue density [41–44]. Given these promising findings, radiomics is now beginning to be applied to neuropsychiatric [45–48] and neurodegenerative [49–52] imaging to improve imaging specificity and to assist in the development of novel imaging biomarkers.
To advance this new field of neurodevelopmental radiomic studies and work directly toward the goal of autism subtyping, we present herein, to the best of our knowledge, the first example of radiomic analyses applied to MC-DWI neuroimaging data comparing four different monogenetic rat models of ASD using radiomics. Previous reported work from our group demonstrated an inability to effectively distinguish between the models when using conventional metrics of analysis (e.g., voxel-wise comparisons, ROI mean signal intensity) on the intra-neurite signals of FA and NDI from the DTI and NODDI models, respectively [53,54]. However, we demonstrate that the coupling of a neurobiologically sensitive neuroimaging technique (NODDI diffusion weighted imaging) to radiomic analyses enhances our collective ability to discriminate neurobiologically dissimilar models of ASD and even begin to subtype these models in an unsupervised fashion.
2. Materials and Methods
2.1. Animals
Male Sprague Dawley rats (300–325 g, Charles River) were pair housed in clear cages (lights on for 12 h at 7:00 A.M.) with ad libitum access to food and water; experiments were performed between 10:00 A.M. and 3:00 P.M. Facilities and procedures followed the National Institutes of Health Guide for the Care and Use of Laboratory Animals and were approved by the Institutional Animal Care and Use Committee at our institution. Fmr1−/y, Nrxn1−/−, and Pten−/+ genetic rat models of ASD were commercially obtained (Horizon Discovery, St. Louis, MO, USA). These models were generated via zinc finger nuclease (ZFN) genome editing yielding a hemizygous, homozygous, and heterozygous genotype on the outbred Sprague Dawley background, respectively. Endonuclease hemizygous deletion of the Fmr1 gene mirrors the gene silencing observed with expansion of the CGG trinucleotide. Monoallelic deletion of the Pten gene recapitulates the clinically encountered heterozygous genotype as the homozygous deletion is embryonic lethal. The Disc1−/− male rats were generated as described previously [31]. These animals used in our data analyses were born, weaned, and matured to adulthood in the same housing facility.
2.2. MRI Acquisition
Animals (Nrxn1−/−, Pten−/+, Fmr1−/y [n=4 each]; Disc1−/− [n=6] and their controls [n=5]) at postnatal 45 days were brought to a surgical plane of anesthesia with isoflurane, then transcardially perfused with ice-cold phosphate-buffered solution (PBS) followed by 4% paraformaldehyde (PFA). The animals were decapitated, and the skin, muscle and fascia were removed from the dorsal and posterior parts of the skull. Rongeurs were used to remove the skull and scissors were used to cut the meninges and cranial nerves at the base of the brain. Extracted brains were post-fixed in 4% PFA for 24 hours and then immersed in Fluorinert and placed in a custom-built holder. Brains were imaged with a 4.7T Agilent MRI system with a 3.5 cm diameter quadrature volume RF coil. Multi-slice, diffusion-weighted, spin echo images were used to acquire 10 non-diffusion-weighted images (b=0 s•mm−2) and 75 diffusion-weighted images (25: b=800 s•mm−2, 50: b=2,000 s•mm−2), using non-colinear diffusion-weighting directions. Other imaging parameters: TE/TR=24.17/2000 ms, FOV=30×30 mm2, matrix=192×192 reconstructed to 256×256 for an isotropic voxel size of 0.25 mm over two signal averages; d= 6 ms; D = 12.20 ms. All imaging was performed in a temperature-controlled room with imaging performed between 20–21°C. Raw data files were converted to NIfTI (Neuroimaging Informatics Technology Initiative) format for use with the DTI-TK software package. Following correction for eddy currents and standard preprocessing, tensors are reconstructed, registered, and normalized to a study-specific template[55]. Multi-shell diffusion data were then fitted to the NODDI model with the microstructure diffusion toolbox (MDT) and the quantitative indices were calculated [56]. Following spatial normalization, ROIs were masked and segmented using a standard DTI-based rat brain atlas. Regions of interest (ROI) are defined via automated atlas-based anatomic segmentation using a diffusion tensor-based reference label set as previously described [55]. Analytical pipelines were specifically designed for imaging data collected from fixed samples (e.g., using recommended diffusivity assumptions d∥=0.6×10⁻³mm2/s and the diso=2×10– 3mm2/s and using the ‘WatsonSHStickTortIsoVIsoDot_B0’ fitting model as recommended [15]).
2.3. Region of Interest (ROI) mean signal analysis
The amygdala, hippocampus, and corpus striatum were a priori selected for analysis due to their biological relevance in autism spectrum disorder [57]. For each of the three NODDI signals (ODI, NDI, CSF), a 5 × 1 ANOVA regressing mean signal intensity on genotype for each region of interest was performed, while controlling the false discovery rate to 0.05 using the Benjamini-Hochberg FDR correction to identify significant differences in mean signal intensity. The Tukey HSD test was performed for post-hoc pairwise comparisons for a significant model (as defined with FDR corrected p-value<0.05). Significant pairwise differences were those with Tukey HSD corrected p-value<0.05. All p-values reported are Tukey HSD corrected p-values unless otherwise indicated. All analyses were performed with GraphPad Prism 9 and Python 3.
2.4. Image texture feature extraction and radiomic analysis
Following masking and segmentation, each ROI was then processed using the open-source Pyradiomics package [58] to extract image texture features. A fixed bin-width of 0.1 was used for gray-level discretization for all the images [59,60] and feature extraction was performed for 18 first-order statistic, 24 gray-level cooccurrence matrix (GLCM), 14 gray- level dependence matrix (GLDM), 16 gray-level run length matrix (GLRLM), and 16 gray-level size zone matrix (GLSZM) radiomic features. A Pearson correlation cutoff of 0.9 is used to select non-redundant features and 5×1 ANOVA models were fit for each selected feature within a region of interest for a given imaging signal to determine the main effect of genotype on these features. The Benjamini-Hochberg procedure was used to control the FDR of a significant model to 0.05. The Tukey HSD test was performed for post-hoc pairwise comparisons for a significant model. Significant pairwise differences were those with Tukey HSD corrected p-value<0.05. All p-values reported are Tukey HSD corrected p-values unless otherwise indicated. All analyses were performed with GraphPad Prism 9 and Python 3.
2.5. Clustering analyses
Hierarchical clustering was performed using the Python library sci-kit learn. All features used for clustering were standardized across samples to have a mean of 0 and standard deviation of 1 before using the Ward’s Minimum Variance clustering method with Euclidean distance metric.
3. Results
3.1. Mean differences between ROIs are only present in the ODI signal
Recapitulating our prior work, no significant mean differences were identified between any of the preselected ROIs in the NDI or vISO diffusion signals[54]. However, significant ODI mean signal ROI differences were identified in the right hippocampus (R HC) (Fig. 2a), left hippocampus (L HC) (Fig. 2b), and right corpus striatum (Fig. 2c) (F-statistics for each ROI respectively, F(4,18) = 5.450, FDR-adjusted p-value = 0.0260; F(4,18) = 3.776, FDR-adjusted p-value = 0.0424; F(4,18) = 3.848, FDR-adjusted p-value = 0.0424). Specifically, pairwise testing demonstrates a significant increase in mean ODI of the right and left hippocampus of the Nrxn1 KO compared to control animals (R HC: mean diff. = 0.0455, 95% CI = [0.0128, 0.0782], p-value = 0.0043; L HC: mean diff. = 0.0319, 95% CI = [0.00250, 0.0613], p-value = 0.0298). Nrxn1 KO animals also had significantly higher mean signal in the right hippocampus when compared to the Pten KO animals (mean diff. = 0.0347, 95% CI = [0.0002, 0.0682], p-value = 0.0478) and in the right corpus striatum when compared to the Disc1 KO animals (mean diff. = 0.0649, 95% CI = [0.0103, 0.120], p-value = 0.0156). The Fmr1 KO animals had significantly higher mean signal in the right hippocampus when compared to control (mean diff. = 0.0346, 95% CI = [0.00190, 0.0673], p-value = 0.0352).
Figure 2:
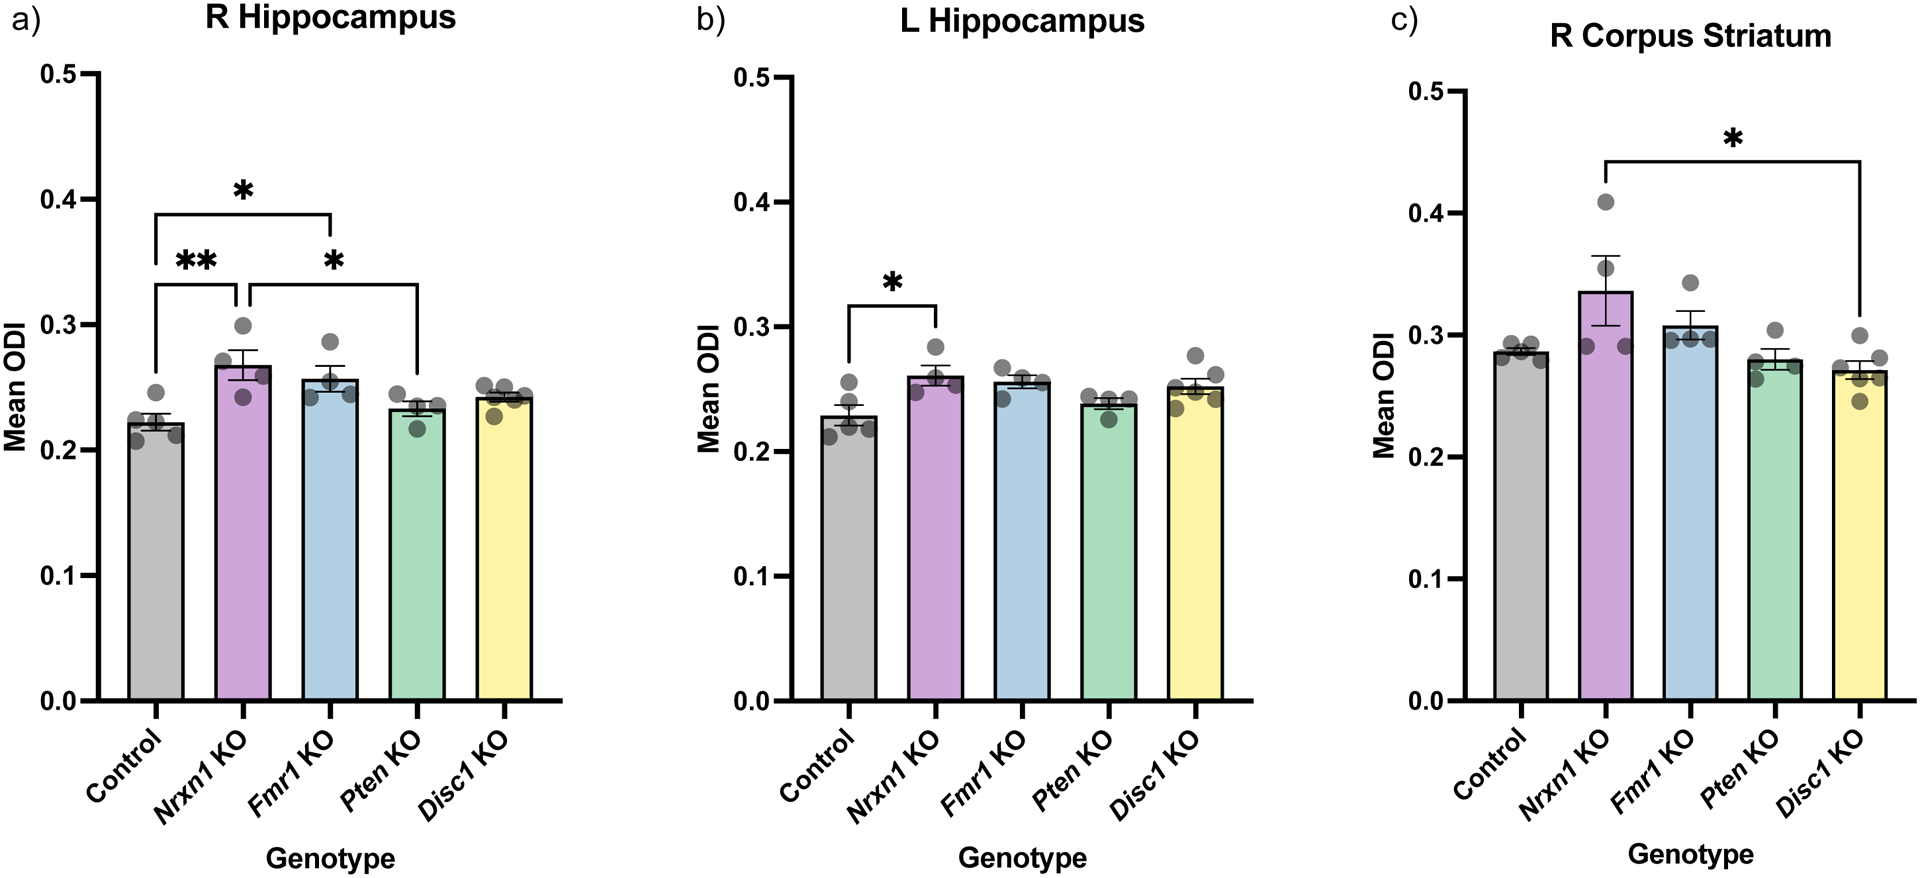
Significant mean ODI signal differences identified between animal models. Mean ODI signals for all five genotypes for a) right hippocampus, b) left hippocampus, and c) right corpus striatum are represented as bar graphs with mean +/− SEM. Individual datapoints for each subject are overlayed. Annotations indicate significant pairwise differences between animal models. * = < 0.05; ** = < 0.01. All p-values represented are adjusted for Tukey’s multiple pairwise comparison.
3.2. ODI mean signal cannot generate discrete genetic subtype clustering with hierarchical clustering
In our previously reported work[54], k-means clustering on principal components generated from the mean signal from FA and NDI from 12 ROIs failed to separate the data into genetic subtypes. However, with the presence of mean ODI signal intensity differences between ROIs, unsupervised hierarchical clustering was next performed with the three mean ODI signals with significant differences amongst the animal models. By using the mean signal from these ROIs identified through the ANOVA, we aimed to maximize the amount of relevant information provided to the clustering algorithm as the mean ODI signal from all ROIs did not produce meaningful clustering (Fig. A.1). The clustering generates three clusters (Fig. 3a, 3b, 3c). The Pten KO animals are all located within cluster 3c. However, we observed that all clusters contain a mix of several genotypes each, indicating poor clustering and subtyping of genetic models based on mean ODI signal intensity information alone.
Figure 3:

Hierarchical clustering of mean ODI signal provides minimally interpretive clustering. 3 distinct clusters are generated (a, b, c) though the clusters created do not effectively subtype the models as no cluster is clearly distinct to a given genotype.
3.3. Differences in radiomic features identified for bilateral hippocampus in ODI signal
To test our hypothesis that radiomic features encode greater discriminatory information than mean ROI signal intensity alone, all three NODDI signals (NDI, ODI, and vISO) for each region of interest underwent radiomics processing. 88 texture features, consisting of the first order (histogram) and second order (texture) features, per signal per region of interest were extracted. No transformations, such as wavelet decomposition, were applied to the images to maintain the highest degree of interpretability for each radiomic feature. These extracted features underwent unsupervised correlation cutoff feature selection (i.e., filtering features that had > 0.9 Pearson correlation with each other). Each of the remaining features were individually fit to a 5 × 1 ANOVA and the Benjamini-Hochberg FDR correction was used to identify significant ANOVA results. These significant models then underwent post-hoc Tukey pairwise significance testing. From all the signals, ROIs, and radiomic features tested, 7 total features were identified as significantly different following FDR correction. 5 were identified in the ODI signal from the right hippocampus (Figure 4: 4a, GLRLM Long Run Low Gray Level Emphasis: F(4,18) = 11.470, FDR-adjusted p-value =0.009; 4b, GLRLM Run Variance: F(4, 18) = 7.838, FDR-adjusted p-value = 0.0261; 4c, GLSZM High Gray Level Zone Emphasis: F(4,18) = 7.960, FDR-adjusted p-value = 0.0435; 4d, First Order Uniformity: F(4,18) = 5.488, FDR-adjusted p-value = 0.0209; 4e, GLCM Difference Variance: F(4,18) = 7.310, FDR-adjusted p-value = 0.0472) and 2 were identified in the ODI signal from the left hippocampus (Figure 5: 5a, GLRLM Long Run Low Gray Level Emphasis: F(4,18) = 8.158, FDR-adjusted p-value = 0.0120; 5b, GLSZM Small Area High Gray Level Emphasis: F(4,18) = 8.656, FDR-adjusted p-value = 0.0481).
Figure 4:

Significant radiomic ODI signal differences identified between animal models in the right hippocampus. a) GLRLM Long Run Low Gray Level Emphasis, b) GLRLM Run Variance, c) GLSZM High Gray Level Zone Emphasis, d) First Order Uniformity, and e) GLCM Difference Variance for all five genotypes are represented as bar graphs with mean +/− SEM. Individual datapoints for each subject are overlayed. Annotations indicate significant pairwise differences between animal models. * = <0.05; ** = <0.01. *** = <0.001. All p-values represented are adjusted for Tukey’s multiple pairwise comparison.
Figure 5:

Significant radiomic ODI signal differences identified between animal models in the left hippocampus. a) GLRLM Long Run Low Gray Level Emphasis and b) GLSZM Small Area High Gray Level Emphasis for all five genotypes are represented as bar graphs with mean +/− SEM. Individual datapoints for each subject are overlayed. Annotations indicate significant pairwise differences between animal models. * = <0.05; ** = <0.01. *** = <0.001 All p-values represented are adjusted for Tukey’s multiple pairwise comparison.
As for the significant pairwise differences, for the right hippocampus, Nrxn1 KO animals were significantly lower in First Order Uniformity when compared to control and Pten KO animals (Nrxn1 KO vs. control: mean diff. = −0.0315, 95% CI = [−0.0616, −0.00164], p-value = 0.0359; Nrxn1 KO vs. Pten KO: mean diff. = −0.0439, 95% CI = [−0.07548, −0.0123], p-value = 0.0043). Nrxn1 KO animals were significantly lower in Long Run Low Gray Level Emphasis and Run Variance compared to control (Long Run Low Gray Level Emphasis, Nrxn1 KO vs. control: mean diff. = −0.751, 95% CI = [−1.162, −0.3398], p-value = 0.0003; Run Variance, Nrxn1 KO vs. control: mean diff. = −0.5310, 95% CI = [−0.9072, −0.1549], p-value = 0.0037). Nrxn1 KO animals were significantly higher in High Gray Level Zone Emphasis compared to control and Pten KO animals (Nrxn1 KO vs. control: mean diff. = 4.510, 95% CI = [1.284, 7.730], p-value = 0.0040; Nrxn1 KO vs. Pten KO: mean diff. = 4.745, 95% CI = [1.348, 8.143], p-value = 0.0041) Fmr1 KO animals were significantly lower in Long Run Gray Level Emphasis and Run Variance compared to control (Long Run Low Gray Level Emphasis, Fmr1 KO vs. control: mean diff. = −0.771, 95% CI = [−1.182, 0.3597], p-value = 0.0002; Run Variance, Fmr1 KO vs. control: mean diff. = −0.521, 95% CI = [−0.897, −0.145], p-value = 0.0044). Disc1 KO animals were significantly higher in High Gray Level Zone Emphasis and Difference Variance compared to control and Pten KO animals (High Gray Level Zone Emphasis, Disc1 KO vs. control: mean diff. = 3.544, 95% CI = [0.634, 6.453], p-value = 0.0129; Disc1 KO vs. Pten KO: mean diff. = 3.782, 95% CI = [0.6802, 6.883], p-value = 0.0128; Difference Variance, Disc1 KO vs. control: mean diff. = 0.163, 95% CI = [0.055, 0.268], p-value = 0.002; Disc1 KO vs. Pten KO: mean diff. = 0.156, 95% CI = [0.042, 0.270], p-value = 0.0049). Disc1 KO animals were significantly lower in in Long Run Low Gray Level Emphasis and Run Variance compared to control animals (Long Run Low Gray Level Emphasis, Disc1 KO vs. control: mean diff. = −0.5954, 95% CI = [−0.9667, −0.2241], p-value = 0.0011; Run Variance, Disc1 KO vs. control: mean diff. = −0.5567, 95% CI = [−0.8962, −0.2172], p-value = 0.0009). Disc1 KO animals were significantly lower in Uniformity compared to Pten KO animals (Disc1 KO vs. Pten KO: mean diff. = −0.0300, 95% CI = [−0.0589, −0.00117], p-value = 0.392). Pten KO animals were significantly lower in Long Run Low Gray Level Emphasis compared to control animals (Pten KO vs. control: mean diff. = −0.6155, 95% CI = [−1.027, −0.204], p-value = 0.0021).
For the left hippocampus, Nrxn1, Fmr1, and Disc1 KO animals were significantly lower in Long Run Low Gray Level Emphasis when compared to control animals (Nrxn1 KO vs. control: mean diff. = −0.4177, 95% CI = [−0.683, −0.153], p-value = 0.0013; Fmr1 KO vs. control: mean diff. = −0.4185, 95% CI = [−0.684, −0.153], p-value = 0.0013; Disc1 KO vs. control: mean diff. = −0.313, 95% CI = [−0.552, −0.074], p-value = 0.0072). Nrxn1, Fmr1, and Disc1 KO animals were significantly higher in Small Area High Gray Level Emphasis than Pten KO animals (Nrxn1 KO vs. Pten KO: mean diff. = 4.642, 95% CI = [0.944, 8.340], p-value = 0.0102; Fmr1 KO vs. Pten KO: mean diff. = 4.537, 95% CI = [0.839, 8.234], p-value = 0.0122; Disc1 KO vs. Pten KO: mean diff = 6.061, 95% CI = [2.685, 9.437], p-value = 0.0003). Disc1 KO animals were also significantly higher than controls for this this feature (Disc1 KO vs. control: mean diff = 3.705, 95% CI = [0.538, 6.872], p-value =0.0175). No significant features were identified in either the NDI or CSF signals across all regions of interest tested.
3.4. Hierarchical clustering of radiomic features derived from the ODI signal improves performance of genetic subtyping
Using all radiomic features from the bilateral hippocampus after correlation filtration, unsupervised hierarchical clustering was again performed as previously described with the mean ODI signal. Three distinct clusters are generated (Fig. 6a, 6b, 6c). Cluster 6a contains only Pten KO animals. Cluster 6c contains all Disc1 KO animals. Clusters 6b and 6c contain a mix of Fmr1 KO and Nrxn1 KO animals. When compared to the hierarchical clustering performed on mean ODI signal intensity only, we find improved discrimination, clustering, and subtyping of our genetic models using radiomic data. However, when performing hierarchical clustering using only the significant features from the ANOVA, the clustering performs more poorly, suggesting that features that did not survive the strict FDR cutoff still contain relevant discriminatory information (Fig. A.2).
Figure 6:

Hierarchical clustering of hippocampal ODI radiomic features results in genetically distinct clustering. 3 distinct clusters are generated (a, b, c) specifically producing clusters: a) Pten KO only, b) mixed Nrxn1 KO and Fmr1 KO, c) all Disc1 KO with mixed Nrxn1 KO and Fmr1 KO. These clusters are interpretable as dominant genotypes exist for each cluster. Every fourth feature is annotated. L HC = left hippocampus, R HC = right hippocampus.
4. Discussion
Improved autism diagnostics is paramount for advancing the development of new, precise therapeutics for this patient population. Herein, we describe, to our knowledge, the first radiomics analysis of NODDI diffusion data and its use for identifying genetic subtypes of autism. We employed this analysis on four monogenetic rat models of autism spectrum disorder and demonstrate improved sensitivity and specificity of a combined NODDI-radiomics approach over more conventional and traditional ROI mean signal analyses.
The radiomics analysis identified the ODI signal from the bilateral hippocampus as being different between the different genetic models and their control. While this result ostensibly matches the conventional mean signal analysis, our radiomics analysis provides greater granular insight into the nature of these differences in the ODI signal as multiple texture differences are identified per region of interest. In the conventional mean signal analysis, both the Fmr1 and Nrxn1 models demonstrated an increase in mean ODI signal compared to control. While this distinguishes them from the Disc1 and Pten models, this conventional ROI-based neuroimaging analysis lacks enough specificity to provide further distinctions between the models despite the fact these data suggest significant neurobiological changes are occurring in the extra-neurite space. However, when comparing radiomic data of the ODI signal from the four ASD models and their control, a unique set of differences is established for all four models, illuminating underlying information in the signal that was not previously apparent with conventional mean intensity analysis. Further, our radiomics analysis of the right hippocampus (when comparing to control animals) identified unique features able to discriminate Fmr1 from Nrxn1 KO, suggesting that the extra-neurite microstructural information encoded in the ODI signal for these genetically different animals is not the same (Fig. 7). Interestingly, common features exist between all four models, which demonstrates aspects of convergence as previously reported by our group and further highlights and emphasizes the additional gene-specific information that is extracted via our NODDI-radiomics approach. This suggests the increased parametrization of the ODI signal enables higher discrimination of the data, thus improving the specificity of the information provided by the ODI signal.
Figure 7:

Venn diagram of model differences in the right hippocampus ODI signal from control demonstrate unique subsets of radiomic features that specifically define each genetic subtype.
This work builds upon previous neuroimaging work performed on small animal models of autism spectrum disorder. Previous studies from both our laboratory and others have demonstrated convergence of microstructural alterations across autism models and have characterized the macrostructural relationships between the brains of different models of autism [53,54,61]. Our results demonstrate the possibility of individual genetic subtyping of autism models, a task that has not been directly addressed with genetic models of autism. Ellegood et al performed a large clustering analysis of genetic autism mouse models using volumetric measurements of neuroanatomy [61]. This work established group-based differences and similarities between various models of autism through hierarchical clustering but did not explore individual animal subtyping with their volumetric measurements. Using our hippocampal ODI radiomic data, we produced three distinct clusters in which genetic information is contained: one cluster comprised solely of Pten animals, another cluster containing all Disc1 animals, and a mixed cluster of Fmr1 and Nrxn1 animals. While two of the clusters contain all animals of a particular genetic subtype, the mixed cluster of Fmr1 and Nrxn1 suggests that these animals are more difficult to discriminate. This combined clustering of Fmr1 and Nrxn1 based upon neuroimaging has been previously reported by Ellegood et al, suggesting there is shared underlying neurobiology captured at both the gross structural scale and the microstructural scale in this analysis for these disease models [61]. Interestingly, performing clustering of the 7 significant radiomic features as identified through ANOVA did not disambiguate Fmr1 from Nrxn1 and overall produced less distinct genetic clustering. This difference in clustering performance may suggest that the stringent statistical selection of radiomic features reduced the amount of biological information truly captured in the imaging signal.
Overall, our analytical approach suggests that unsupervised hierarchical clustering of NODDI radiomic data can meaningfully categorize a mixed genetic population, which proves to be a highly salient advance as we move towards the clinical translation of advanced neuroimaging methods. Although genetic subtyping of monogenetic ASD is important, the polygenetic and sporadic nature of de novo mutations commonly found in ASD [62] suggests the methods that are able to capture, quantify, and discriminate biologically-related subtypes of ASD will be critical for understanding how genetic alterations associated with ASD are related to brain microstructure. As highlighted with our Fmr1 and Nxrn1 example above, our NODDI-radiomics approach mirrors a likely clinical vignette where most patients with autism are unlikely to have monogenetic disease but rather novel sporadic mutations. With a more neurobiologically sensitive neuroimaging-based approach like NODDI radiomics, we would be able to better subgroup and cluster patients based on neural microstructure rather than more subjective clinical evaluations or broad genetic categories. Doing so, we would create neuro-microstructurally (and thus neurobiologically) relevant and related subgroups of ASD patients for further study and tailored treatment beyond what is possible with current neuroimaging analyses.
Strikingly, the ODI signal provided all the significant differences identified in this study. Our previous analyses focused on the axonal (FA) and intraneuritic (NDI) signals of DTI and NODDI, respectively, which were unable to disambiguate these animal models from each other [53,54]. On the other hand, the ODI signal captures the extra-neurite compartment of NODDI. Recent research suggests that non-neuronal cells and extracellular components in the brain contribute meaningfully to neuropsychiatric disease [63–68]. Our group has found that changes in the ODI signal can correspond to changes in microglia number, morphology, and activation state in various disease models [32,33]. For this study, the observed changes in the ODI signal of the NODDI model may suggest potential differences in microglia or other cellular and molecular components of the extra-neurite space across these models of autism [22,23,69]. The Disc1 KO model has been characterized to have altered microglial number and morphology in the dentate gyrus and recent studies have implicated perineuronal nets (a specific component of the extracellular matrix) and altered hippocampal stem cell niche in in the pathogenesis of autism behaviors in genetic mouse models such as Fmr1 [33,63,68,70]. Our new findings in conjunction with our previous results highlight how MC-DWI models such as NODDI can capture more complete, sensitive neurobiological signals that are beyond conventional imaging approaches used today.
Our study has limitations. A common critique of radiomic studies is the lack of standardization and reproducibility. It has been demonstrated repeatedly that a common source of discrepancy arises from non-standardized region of interest segmentation [37,71,72]. Small alterations in brain alignment and ROI segmentation can have drastic effects on the radiomic features calculated and thus affect the reproducibility of downstream analyses and generalizability of predictive models. This is of particular of concern in calculating radiomic features of neuroglial tumors in which the shape and borders of the tumors can be heterogenous and non-distinct [41,44] To account for this known limitation, we aligned all brains to a common subject space and performed automated ROI segmentation of annotated neuroanatomical regions. Similarly, radiomic feature extraction and calculation requires gray-level discretization which is determined by a user-set parameter. Studies have demonstrated that varying discretization level in MRI and CT radiomic analyses can also drastically affect the calculated features [60,73,74] and thus the method for discretization must be reported and standardized within a study. Though no formal guidelines exist for discretizing NODDI diffusion MRI images, previous MRI radiomics papers have suggested using a fixed bin-width rather than a fixed bin-number to improve reproducibility across processed images [60]. To this recommendation, we performed gray-level discretization with a fixed bin-width of 0.1 for all images and signals analyzed. By following these methods of standardization, our radiomics analysis pipeline ensures higher reproducibility than many radiomics studies that have been published. Our multi-shell neuroimaging was also performed ex vivo. Ex vivo brains can have subtly altered tissue microstructure and diffusion MR measurements when compared to in vivo [75]. Despite this limitation, ex vivo imaging is pursued as higher signal-to-noise ratios and greater spatial resolution are made possible by longer scan times leading to increased imaging sensitivity; to further account for the effects of ex vivo imaging, appropriate model fitting parameters were used to account for the presence of fixative in the final model. Other multi-shell neuroimaging techniques were not tested including diffusion spectrum imaging (DSI) or ActiveAx [76,77] and it remains an open question whether these or other MC-DWI models offer improved performance. However, with clinical translational neuroimaging motivating our efforts, attention was largely paid to NODDI given its known ability to be performed on clinical timescales versus other MC-DWI techniques, which require longer scan times and other hardware requirements that are not as widely available and preclude easy dissemination of our methods. Lastly, our sample size is small for a neuroimaging study. However, by using animal models, this study is highly controlled. As each model differs solely by known genetic alterations, differences identified after controlling for the FDR can be attributed to the underlying differences in genetics.
5. Conclusion
Our work presented here demonstrates the possibility of employing radiomic analyses of NODDI diffusion data to facilitate meaningful categorization and neuroimaging-based subtyping in rat genetic models of ASD. This approach builds and improves upon conventional methods of analysis by enabling improved specificity without reducing sensitivity to underlying microstructural differences. Further, we identified differences in the extra-neurite compartment of the hippocampus between these models of autism, which is a previously unreported finding. Using these radiomics data, we also demonstrated the potential to perform hierarchical clustering that could potentially cluster monogenetic subtypes of autism in an unsupervised manner. Developing this ability to subtype based on underlying microstructural difference represents an important first step toward improved, biologically informed subgrouping that maybe helpful as we seek to advance our understanding of ASD and the development of novel therapies for this underserved group of patients.
Supplementary Material
Acknowledgments
The authors would like to thank the University of Wisconsin Biotechnology Center Gene and the Genome Editing and Animals Core for outstanding support; Beth Rauch for imaging support through the Small Animal Imaging Facility at the University of Wisconsin Carbone Cancer Center; and bioinformatics support from the Institute for Clinical and Translational Research (ICTR) at the University of Wisconsin-Madison and the National Center for Advancing Translational Sciences (NCATS).
Funding:
Medical Scientist Training Program, National Institutes of Health grant T32 GM140935 (APS); University of Wisconsin Department of Radiology, Radiology MD-PhD Graduate Student Fellowship (APS); University of Wisconsin School of Medicine and Public Health, Shapiro Summer Research Fellowship (VSJ); National Cancer Institute grant P30 CA014520 (JPY); National Institutes of Health grant, P30 HD003352-45 (JPY)
Footnotes
SUPPLEMENTARY FIGURE LEGEND
Figure A.1: Hierarchical clustering of mean ODI signal from all ROIs provides minimally interpretive clustering with heterogenous clusters (a, b, c).
Figure A.2: Hierarchical clustering of ANOVA-identified significant radiomic features does not improve interpretability of clustering. Four distinct clusters are generated (a, b, c, d), however a-c are heterogenous clusters. Cluster d successfully separates out Pten KO animals.
REFERENCES
- [1].Posserud MB, Skretting Solberg B, Engeland A, Haavik J, Klungsøyr K. Male to female ratios in autism spectrum disorders by age, intellectual disability and attention-deficit/hyperactivity disorder. Acta Psychiatr Scand 2021;144:635–46. 10.1111/ACPS.13368. [DOI] [PubMed] [Google Scholar]
- [2].Masi A, DeMayo MM, Glozier N, Guastella AJ. An overview of autism spectrum disorder, heterogeneity and treatment options. Neurosci Bull 2017;33:183–93. [DOI] [PMC free article] [PubMed] [Google Scholar]
- [3].Werling DM. The role of sex-differential biology in risk for autism spectrum disorder. Biology of Sex Differences 2016. 7:1 2016;7:1–18. 10.1186/S13293-016-0112-8. [DOI] [PMC free article] [PubMed] [Google Scholar]
- [4].Weng SJ, Carrasco M, Swartz JR, Wiggins JL, Kurapati N, Liberzon I, et al. Neural activation to emotional faces in adolescents with autism spectrum disorders. J Child Psychol Psychiatry 2011;52:296–305. 10.1111/J.1469-7610.2010.02317.X. [DOI] [PMC free article] [PubMed] [Google Scholar]
- [5].Dekhil O, Ali M, Haweel R, Elnakib Y, Ghazal M, Hajjdiab H, et al. A Comprehensive Framework for Differentiating Autism Spectrum Disorder From Neurotypicals by Fusing Structural MRI and Resting State Functional MRI. Semin Pediatr Neurol 2020;34. 10.1016/J.SPEN.2020.100805. [DOI] [PubMed] [Google Scholar]
- [6].Kleinhans NM, Reiter MA, Neuhaus E, Pauley G, Martin N, Dager S, et al. Subregional differences in intrinsic amygdala hyperconnectivity and hypoconnectivity in autism spectrum disorder. Autism Res 2016;9:760–72. 10.1002/AUR.1589. [DOI] [PMC free article] [PubMed] [Google Scholar]
- [7].Chen R, Jiao Y, Herskovits EH. Structural MRI in Autism Spectrum Disorder. Pediatr Res 2011;69:63R. 10.1203/PDR.0B013E318212C2B3. [DOI] [PMC free article] [PubMed] [Google Scholar]
- [8].Patel J, Lukkes JL, Shekhar A. Overview of genetic models of autism spectrum disorders. Prog Brain Res 2018;241:1–36. 10.1016/BS.PBR.2018.10.002. [DOI] [PubMed] [Google Scholar]
- [9].Rylaarsdam L, Guemez-Gamboa A. Genetic Causes and Modifiers of Autism Spectrum Disorder. Front Cell Neurosci 2019;13:385. 10.3389/FNCEL.2019.00385/BIBTEX. [DOI] [PMC free article] [PubMed] [Google Scholar]
- [10].Wolfers T, Floris DL, Dinga R, van Rooij D, Isakoglou C, Kia SM, et al. From pattern classification to stratification: towards conceptualizing the heterogeneity of Autism Spectrum Disorder. Neurosci Biobehav Rev 2019;104:240–54. 10.1016/J.NEUBIOREV.2019.07.010. [DOI] [PubMed] [Google Scholar]
- [11].Hong S-J, Vogelstein JT, Gozzi A, Bernhardt BC, Yeo BTT, Milham MP, et al. Toward Neurosubtypes in Autism. Biol Psychiatry 2020;88:111–28. 10.1016/j.biopsych.2020.03.022. [DOI] [PubMed] [Google Scholar]
- [12].Martinez-Heras E, Grussu F, Prados F, Solana E, Llufriu S. Diffusion-Weighted Imaging: Recent Advances and Applications. Seminars in Ultrasound, CT and MRI 2021;42:490–506. 10.1053/J.SULT.2021.07.006. [DOI] [PubMed] [Google Scholar]
- [13].Alexander DC, Dyrby TB, Nilsson M, Zhang H. Imaging brain microstructure with diffusion MRI: practicality and applications. NMR Biomed 2019;32:e3841. 10.1002/NBM.3841. [DOI] [PubMed] [Google Scholar]
- [14].Afzali M, Pieciak T, Newman S, Garyfallidis E, Özarslan E, Cheng H, et al. The sensitivity of diffusion MRI to microstructural properties and experimental factors. J Neurosci Methods 2021;347:108951. 10.1016/J.JNEUMETH.2020.108951. [DOI] [PMC free article] [PubMed] [Google Scholar]
- [15].Zhang H, Schneider T, Wheeler-Kingshott CA, Alexander DC. NODDI: Practical in vivo neurite orientation dispersion and density imaging of the human brain. Neuroimage 2012;61:1000–16. 10.1016/j.neuroimage.2012.03.072. [DOI] [PubMed] [Google Scholar]
- [16].Santis S de, Assaf Y, Jones DK. Using the biophysical CHARMED model to elucidate the underpinnings of contrast in diffusional kurtosis analysis of diffusion-weighted MRI. Magnetic Resonance Materials in Physics, Biology and Medicine 2012;25:267–76. 10.1007/S10334-011-0292-5/FIGURES/5. [DOI] [PubMed] [Google Scholar]
- [17].Li CX, Patel S, Zhang X. Evaluation of multi-shell diffusion MRI acquisition strategy on quantitative analysis using multi-compartment models. Quant Imaging Med Surg 2020;10:82434–834. 10.21037/QIMS.2020.03.11. [DOI] [PMC free article] [PubMed] [Google Scholar]
- [18].Jelescu IO, Palombo M, Bagnato F, Schilling KG. Challenges for biophysical modeling of microstructure. J Neurosci Methods 2020;344:108861. 10.1016/J.JNEUMETH.2020.108861. [DOI] [PMC free article] [PubMed] [Google Scholar]
- [19].K K, M H, S A.. NODDI in clinical research. J Neurosci Methods 2020;346. 10.1016/J.JNEUMETH.2020.108908. [DOI] [PubMed] [Google Scholar]
- [20].Prescott JW, Doraiswamy PM, Gamberger D, Benzinger T, Petrella JR, Network for the DIA. Diffusion Tensor MRI Structural Connectivity and PET Amyloid Burden in Preclinical Autosomal Dominant Alzheimer Disease: The DIAN Cohort. Https://DoiOrg/101148/Radiol2021210383 2021. 10.1148/RADIOL.2021210383. [DOI] [PMC free article] [PubMed]
- [21].Vogt NM, Hunt JF, Adluru N, Dean DC, Johnson SC, Asthana S, et al. Cortical Microstructural Alterations in Mild Cognitive Impairment and Alzheimer’s Disease Dementia. Cerebral Cortex (New York, NY) 2020;30:2948. 10.1093/CERCOR/BHZ286. [DOI] [PMC free article] [PubMed] [Google Scholar]
- [22].Colgan N, Siow B, O’Callaghan JM, Harrison IF, Wells JA, Holmes HE, et al. Application of neurite orientation dispersion and density imaging (NODDI) to a tau pathology model of Alzheimer’s disease. Neuroimage 2016;125:739. 10.1016/J.NEUROIMAGE.2015.10.043. [DOI] [PMC free article] [PubMed] [Google Scholar]
- [23].Vogt NM, Hunt JFV, Adluru N, Ma Y, van Hulle CA, Iii DCD, et al. Interaction of amyloid and tau on cortical microstructure in cognitively unimpaired adults. Alzheimer’s & Dementia 2021. 10.1002/ALZ.12364. [DOI] [PMC free article] [PubMed] [Google Scholar]
- [24].Andica C, Kamagata K, Kirino E, Uchida W, Irie R, Murata S, et al. Neurite orientation dispersion and density imaging reveals white matter microstructural alterations in adults with autism. Molecular Autism 2021. 12:1 2021;12:1–14. 10.1186/S13229-021-00456-4. [DOI] [PMC free article] [PubMed] [Google Scholar]
- [25].Kraguljac NV, Guerreri M, Strickland MJ, Zhang H. Neurite Orientation Dispersion and Density Imaging in Psychiatric Disorders: A Systematic Literature Review and a Technical Note. Biological Psychiatry Global Open Science 2022. 10.1016/J.BPSGOS.2021.12.012. [DOI] [PMC free article] [PubMed] [Google Scholar]
- [26].Matsuoka K, Makinodan M, Kitamura S, Takahashi M, Yoshikawa H, Yasuno F, et al. Increased Dendritic Orientation Dispersion in the Left Occipital Gyrus is Associated with Atypical Visual Processing in Adults with Autism Spectrum Disorder. Cerebral Cortex 2020;30:5617–25. 10.1093/CERCOR/BHAA121. [DOI] [PubMed] [Google Scholar]
- [27].Yasuno F, Makinodan M, Takahashi M, Matsuoka K, Yoshikawa H, Kitamura S, et al. Microstructural Anomalies Evaluated by Neurite Orientation Dispersion and Density Imaging Are Related to Deficits in Facial Emotional Recognition via Perceptual-Binding Difficulties in Autism Spectrum Disorder. Autism Research 2020;13:729–40. 10.1002/AUR.2280. [DOI] [PubMed] [Google Scholar]
- [28].Yi SY, Stowe NA, Barnett BR, Dodd K, Yu JPJ. Microglial Density Alters Measures of Axonal Integrity and Structural Connectivity. Biol Psychiatry Cogn Neurosci Neuroimaging 2020;5:1061–8. 10.1016/j.bpsc.2020.04.008. [DOI] [PMC free article] [PubMed] [Google Scholar]
- [29].Barnett BR, Yi SY, Poetzel MJ, Dodd K, Stowe NA, Yu JPJ. Mapping Sex-Specific Neurodevelopmental Alterations in Neurite Density and Morphology in a Rat Genetic Model of Psychiatric Illness. ENeuro 2021;8:1–12. 10.1523/ENEURO.0426-20.2020. [DOI] [PMC free article] [PubMed] [Google Scholar]
- [30].Barnett BR, Anderson JM, Torres-Velázquez M, Yi SY, Rowley PA, Yu JPJ. Exercise ameliorates deficits in neural microstructure in a Disc1 model of psychiatric illness. Magn Reson Imaging 2019;61:90. 10.1016/J.MRI.2019.05.021. [DOI] [PMC free article] [PubMed] [Google Scholar]
- [31].Barnett BR, Torres-Velázquez M, Yi SY, Rowley PA, Sawin EA, Rubinstein CD, et al. Sex-specific deficits in neurite density and white matter integrity are associated with targeted disruption of exon 2 of the Disc1 gene in the rat. Transl Psychiatry 2019;9. 10.1038/S41398-019-0429-2. [DOI] [PMC free article] [PubMed] [Google Scholar]
- [32].Yi SY, Barnett BR, Torres-Velazquez M, Zhang Y, Rowley PA, Hernando D, et al. Detecting Microglial Density with Quantitative Multi-Compartment Diffusion MRI. Front Neurosci 2019;19:81. 10.3389/fnins.2019.00081. [DOI] [PMC free article] [PubMed] [Google Scholar]
- [33].Yi SY, Barnett BR, Poetzel MJ, Stowe NA, Yu JPJ. Clinical translational neuroimaging of the antioxidant effect of N-acetylcysteine on neural microstructure. Magn Reson Med 2022;87:820–36. 10.1002/MRM.29035. [DOI] [PMC free article] [PubMed] [Google Scholar]
- [34].Smith SM, Jenkinson M, Johansen-Berg H, Rueckert D, Nichols TE, Mackay CE, et al. Tract-based spatial statistics: Voxelwise analysis of multi-subject diffusion data. Neuroimage 2006;31:1487–505. 10.1016/J.NEUROIMAGE.2006.02.024. [DOI] [PubMed] [Google Scholar]
- [35].Parvathaneni P, Rogers BP, Huo Y, Schilling KG, Hainline AE, Anderson AW, et al. Gray Matter Surface based Spatial Statistics (GS-BSS) in Diffusion Microstructure. Med Image Comput Comput Assist Interv 2017;10433:638. 10.1007/978-3-319-66182-7_73. [DOI] [PMC free article] [PubMed] [Google Scholar]
- [36].Bach M, Laun FB, Leemans A, Tax CMW, Biessels GJ, Stieltjes B, et al. Methodological considerations on tract-based spatial statistics (TBSS). Neuroimage 2014;100:358–69. 10.1016/J.NEUROIMAGE.2014.06.021. [DOI] [PubMed] [Google Scholar]
- [37].Rizzo S, Botta F, Raimondi S, Origgi D, Fanciullo C, Morganti AG, et al. Radiomics: the facts and the challenges of image analysis. Eur Radiol Exp 2018;2. 10.1186/S41747-018-0068-Z. [DOI] [PMC free article] [PubMed] [Google Scholar]
- [38].Gillies RJ, Kinahan PE, Hricak H. Radiomics: Images are more than pictures, they are data. Radiology 2016;278:563–77. 10.1148/radiol.2015151169. [DOI] [PMC free article] [PubMed] [Google Scholar]
- [39].Lambin P, Leijenaar RTH, Deist TM, Peerlings J, de Jong EEC, van Timmeren J, et al. Radiomics: The bridge between medical imaging and personalized medicine. Nat Rev Clin Oncol 2017;14:749–62. 10.1038/nrclinonc.2017.141. [DOI] [PubMed] [Google Scholar]
- [40].Mayerhoefer ME, Materka A, Langs G, Häggström I, Szczypiński P, Gibbs P, et al. Introduction to radiomics. Journal of Nuclear Medicine 2020;61:488–95. 10.2967/JNUMED.118.222893. [DOI] [PMC free article] [PubMed] [Google Scholar]
- [41].Yip SSF, Aerts HJWL. Applications and limitations of radiomics. Phys Med Biol 2016;61:R150–66. 10.1088/0031-9155/61/13/R150. [DOI] [PMC free article] [PubMed] [Google Scholar]
- [42].Vallières M, Kay-Rivest E, Perrin LJ, Liem X, Furstoss C, Aerts HJWL, et al. Radiomics strategies for risk assessment of tumour failure in head-and-neck cancer. Sci Rep 2017;7:1–14. 10.1038/s41598-017-10371-5. [DOI] [PMC free article] [PubMed] [Google Scholar]
- [43].Papadimitroulas P, Brocki L, Christopher Chung N, Marchadour W, Vermet F, Gaubert L, et al. Artificial intelligence: Deep learning in oncological radiomics and challenges of interpretability and data harmonization. Physica Medica 2021;83:108–21. 10.1016/j.ejmp.2021.03.009. [DOI] [PubMed] [Google Scholar]
- [44].Zhao B, Tan Y, Tsai WY, Qi J, Xie C, Lu L, et al. Reproducibility of radiomics for deciphering tumor phenotype with imaging. Sci Rep 2016;6. 10.1038/srep23428. [DOI] [PMC free article] [PubMed] [Google Scholar]
- [45].Chaddad A, Desrosiers C, Toews M. Multi-scale radiomic analysis of sub-cortical regions in MRI related to autism, gender and age OPEN. Nature Publishing Group; 2017. 10.1038/srep45639. [DOI] [PMC free article] [PubMed] [Google Scholar]
- [46].Chaddad A, Desrosiers C, Hassan L, Tanougast C. Hippocampus and amygdala radiomic biomarkers for the study of autism spectrum disorder. BMC Neurosci 2017;18. 10.1186/S12868-017-0373-0. [DOI] [PMC free article] [PubMed] [Google Scholar]
- [47].Cui L-B, Liu L, Wang H-N, Wang L-X, Guo F, Xi Y-B, et al. Disease Definition for Schizophrenia by Functional Connectivity Using Radiomics Strategy. Schizophr Bull 2018;44:1053–9. 10.1093/schbul/sby007. [DOI] [PMC free article] [PubMed] [Google Scholar]
- [48].Park YW, Choi D, Lee J, Ahn SS, Lee SK, Lee SH, et al. Differentiating patients with schizophrenia from healthy controls by hippocampal subfields using radiomics. Schizophr Res 2020;223:337–44. 10.1016/j.schres.2020.09.009. [DOI] [PubMed] [Google Scholar]
- [49].Sikiö M, Holli KK, Harrison LCV, Ruottinen H, Rossi M, Helminen MT, et al. Parkinson’s disease: interhemispheric textural differences in MR images. Acad Radiol 2011;18:1217–24. 10.1016/J.ACRA.2011.06.007. [DOI] [PubMed] [Google Scholar]
- [50].Salvatore C, Castiglioni I, Cerasa A. Radiomics approach in the neurodegenerative brain. Aging Clin Exp Res 2019. 10.1007/s40520-019-01299-z. [DOI] [PubMed] [Google Scholar]
- [51].Ranjbar S, Velgos SN, Dueck AC, Geda YE, Mitchell JR. Brain MR radiomics to differentiate cognitive disorders. J Neuropsychiatry Clin Neurosci 2019;31:210. 10.1176/APPI.NEUROPSYCH.17120366. [DOI] [PMC free article] [PubMed] [Google Scholar]
- [52].Fan Y, Feng M, Wang R. Application of Radiomics in Central Nervous System Diseases: a Systematic literature review. Clin Neurol Neurosurg 2019;187. 10.1016/j.clineuro.2019.105565. [DOI] [PubMed] [Google Scholar]
- [53].Rowley PA, Guerrero-Gonzalez J, Alexander AL, Yu JPJ. Convergent Microstructural Brain Changes Across Genetic Models of Autism Spectrum Disorder – A Pilot Study. Psychiatry Res Neuroimaging 2019;283:83. 10.1016/J.PSCYCHRESNS.2018.12.007. [DOI] [PMC free article] [PubMed] [Google Scholar]
- [54].Barnett BR, Casey CP, Torres-Velázquez M, Rowley PA, Yu JPJ. Convergent brain microstructure across multiple genetic models of schizophrenia and autism spectrum disorder: A feasibility study. Magn Reson Imaging 2020;70:36–42. 10.1016/J.MRI.2020.04.002. [DOI] [PMC free article] [PubMed] [Google Scholar]
- [55].Jiang Y, Johnson GA. Microscopic diffusion tensor atlas of the mouse brain. Neuroimage 2011;56:1235–43. 10.1016/J.NEUROIMAGE.2011.03.031. [DOI] [PMC free article] [PubMed] [Google Scholar]
- [56].Harms RL, Fritz FJ, Tobisch A, Goebel R, Roebroeck A. Robust and fast nonlinear optimization of diffusion MRI microstructure models. Neuroimage 2017;155:82–96. 10.1016/J.NEUROIMAGE.2017.04.064. [DOI] [PMC free article] [PubMed] [Google Scholar]
- [57].Fuccillo M v. Striatal Circuits as a Common Node for Autism Pathophysiology. Front Neurosci 2016;10. 10.3389/FNINS.2016.00027. [DOI] [PMC free article] [PubMed] [Google Scholar]
- [58].van Griethuysen JJM, Fedorov A, Parmar C, Hosny A, Aucoin N, Narayan V, et al. Computational radiomics system to decode the radiographic phenotype. Cancer Res 2017;77:e104–7. 10.1158/0008-5472.CAN-17-0339. [DOI] [PMC free article] [PubMed] [Google Scholar]
- [59].Zwanenburg A, Vallières M, Abdalah MA, Aerts HJWL, Andrearczyk V, Apte A, et al. The image biomarker standardization initiative: Standardized quantitative radiomics for high-throughput image-based phenotyping. Radiology 2020;295:328–38. 10.1148/radiol.2020191145. [DOI] [PMC free article] [PubMed] [Google Scholar]
- [60].Duron L, Balvay D, Perre S vande, Bouchouicha A, Savatovsky J, Sadik JC, et al. Gray-level discretization impacts reproducible MRI radiomics texture features. PLoS One 2019;14. 10.1371/journal.pone.0213459. [DOI] [PMC free article] [PubMed] [Google Scholar]
- [61].Ellegood J, Anagnostou E, Babineau BA, Crawley JN, Lin L, Genestine M, et al. Clustering autism: using neuroanatomical differences in 26 mouse models to gain insight into the heterogeneity. Mol Psychiatry 2015;20:118–25. 10.1038/MP.2014.98. [DOI] [PMC free article] [PubMed] [Google Scholar]
- [62].Zhao X, Leotta A, Kustanovich V, Lajonchere C, Geschwind DH, Law K, et al. A unified genetic theory for sporadic and inherited autism. Proc Natl Acad Sci U S A 2007;104:12831–6. 10.1073/PNAS.0705803104/SUPPL_FILE/05803SUPPTEXT.PDF. [DOI] [PMC free article] [PubMed] [Google Scholar]
- [63].Briones BA, Pitcher MN, Fleming WT, Libby A, Diethorn EJ, Haye AE, et al. Perineuronal Nets in the Dorsomedial Striatum Contribute to Behavioral Dysfunction in Mouse Models of Excessive Repetitive Behavior. Biological Psychiatry Global Open Science 2021. 10.1016/J.BPSGOS.2021.11.005. [DOI] [PMC free article] [PubMed] [Google Scholar]
- [64].Rodriguez JI, Kern JK. Evidence of microglial activation in autism and its possible role in brain underconnectivity. Neuron Glia Biol 2011;7:205. 10.1017/S1740925X12000142. [DOI] [PMC free article] [PubMed] [Google Scholar]
- [65].Andoh M, Ikegaya Y, Koyama R. Microglia in animal models of autism spectrum disorders. Prog Mol Biol Transl Sci 2020;173:239–73. 10.1016/BS.PMBTS.2020.04.012. [DOI] [PubMed] [Google Scholar]
- [66].Berretta S. Extracellular Matrix Abnormalities in Schizophrenia. Neuropharmacology 2012;62:1584. 10.1016/J.NEUROPHARM.2011.08.010. [DOI] [PMC free article] [PubMed] [Google Scholar]
- [67].Petrelli F, Pucci L, Bezzi P. Astrocytes and microglia and their potential link with autism spectrum disorders. Front Cell Neurosci 2016;10:21. 10.3389/FNCEL.2016.00021/BIBTEX. [DOI] [PMC free article] [PubMed] [Google Scholar]
- [68].Pantazopoulos H, Berretta S. In Sickness and in Health: Perineuronal Nets and Synaptic Plasticity in Psychiatric Disorders. Neural Plast 2016;2016. 10.1155/2016/9847696. [DOI] [PMC free article] [PubMed] [Google Scholar]
- [69].Sone D, Shigemoto Y, Ogawa M, Maikusa N, Okita K, Takano H, et al. Association between neurite metrics and tau/inflammatory pathology in Alzheimer’s disease. Alzheimer’s and Dementia: Diagnosis, Assessment and Disease Monitoring 2020;12:e12125. 10.1002/dad2.12125. [DOI] [PMC free article] [PubMed] [Google Scholar]
- [70].Javadi S, Li Y, Sheng J, Zhao L, Fu Y, Wang D, et al. Sustained correction of hippocampal neurogenic and cognitive deficits after a brief treatment by Nutlin-3 in a mouse model of fragile X syndrome. BMC Med 2022;20. 10.1186/S12916-022-02370-9. [DOI] [PMC free article] [PubMed] [Google Scholar]
- [71].Haga A, Takahashi W, Aoki S, Nawa K, Yamashita H, Abe O, et al. Standardization of imaging features for radiomics analysis. Journal of Medical Investigation 2019;66:35–7. 10.2152/jmi.66.35. [DOI] [PubMed] [Google Scholar]
- [72].Vallières M, Zwanenburg A, Badic B, le Rest CC, Visvikis D, Hatt M. Responsible radiomics research for faster clinical translation. Journal of Nuclear Medicine 2018;59:189–93. 10.2967/jnumed.117.200501. [DOI] [PMC free article] [PubMed] [Google Scholar]
- [73].Veres G, Vas NF, Lyngby Lassen M, Béresová M, K Krizsan A, Forgács A, et al. Effect of grey-level discretization on texture feature on different weighted MRI images of diverse disease groups. PLoS One 2021;16:e0253419. 10.1371/journal.pone.0253419. [DOI] [PMC free article] [PubMed] [Google Scholar]
- [74].Larue RTHM, van Timmeren JE, de Jong EEC, Feliciani G, Leijenaar RTH, Schreurs WMJ, et al. Influence of gray level discretization on radiomic feature stability for different CT scanners, tube currents and slice thicknesses: a comprehensive phantom study. Acta Oncol (Madr) 2017;56:1544–53. 10.1080/0284186X.2017.1351624. [DOI] [PubMed] [Google Scholar]
- [75].Zhang J, Jones M v., McMahon MT, Mori S, Calabresi PA. In vivo and ex vivo Diffusion Tensor Imaging of Cuprizone Induced Demyelination in the Mouse Corpus Callosum. Magn Reson Med 2012;67:750. 10.1002/MRM.23032. [DOI] [PMC free article] [PubMed] [Google Scholar]
- [76].Alexander DC, Hubbard PL, Hall MG, Moore EA, Ptito M, Parker GJM, et al. Orientationally invariant indices of axon diameter and density from diffusion MRI. Neuroimage 2010;52:1374–89. 10.1016/J.NEUROIMAGE.2010.05.043. [DOI] [PubMed] [Google Scholar]
- [77].Dyrby TB, Baaré WFC, Alexander DC, Jelsing J, Garde E, Søgaard L v. An ex vivo imaging pipeline for producing high-quality and high-resolution diffusion-weighted imaging datasets. Hum Brain Mapp 2011;32:544–63. 10.1002/HBM.21043. [DOI] [PMC free article] [PubMed] [Google Scholar]
Associated Data
This section collects any data citations, data availability statements, or supplementary materials included in this article.