Abstract
In vivo testing of glucocorticoid steroids in dystrophic mice offers important insights in benefits and risks of those drugs in the pathological context of muscular dystrophy. Frequency of dosing changes the spectrum of glucocorticoid effects on muscle and metabolic homeostasis. Here we describe a combination of non-invasive and invasive methods to quantitatively discriminate the specific effects of intermittent (once-weekly) versus mainstay (once-daily) regimens on muscle fibrosis, muscle function and metabolic homeostasis in murine models of Duchenne and Limb-Girdle muscular dystrophies.
Keywords: Glucocorticoid steroids, mdx mice, Sgcg mice, intermittent dosing, hydroxyproline, grip strength, treadmill assay, in situ force analysis, glycemia
Introduction
Muscular dystrophies are genetically inherited diseases inducing chronic degeneration and functional impairment of muscle [1]. Duchenne muscular dystrophy is caused by mutations in the gene encoding dystrophin, and is genetically modeled in mice by the mdx mutation [2]. Limb-girdle muscular dystrophies encompass an heterogenous group of subtypes based on the mutated gene. The subtype R5 (previously known as type 2C) is caused by mutations in the gene encoding γ-sarcoglycan (Sgcg) and is genetically modeled in mice by Sgcg knockout [3]. For both mdx and Sgcg strains, the DBA/2J genetic background augments the dystrophic pathophysiology progression in muscle as compared to the traditional C57BL/10 background [4]. Glucocorticoid steroids like prednisone are standard of care for Duchenne muscular dystrophy. Glucocorticoids help manage the chronic inflammation of degenerating muscles, prolonging the ambulatory age in these patients [5]. However, chronic daily intake of these drugs induces untoward side effects, including metabolic syndrome [6]. Moreover, the present glucocorticoid regimens used for Duchenne are not indicated for other muscular dystrophies [7]. Several approaches are being pursued to minimize and possibly revert the side effects of once-daily glucocorticoid dosing. We have recently shown that intermittent once-weekly dosing of glucocorticoids improved repair, fibrosis and function in both mdx and Sgcg models of muscular dystrophy [8,9]. Importantly, opposite to the mainstay once-daily dosing, the intermittent regimen did not induce the typical metabolic side effects associated with chronic glucocorticoid dosing in mice, including hyperglycemia, wasting and weakness [10]. Here we review methods and examples of assessments of glucocorticoid dosing in mdx and Sgcg mice from the same DBA/2J genetic background.
2. Materials
2.1. Injectable glucocorticoid solution
Prednisone stock: weigh and dilute prednisone powder in DMSO in sterile conditions to a final concentration of 5mg/ml. Prepare aliquots for single use (avoid freeze-thaw) and store at −20°C. See Note 1 for other glucocorticoids.
Vehicle stock: 100% DMSO aliquoted and stored as prednisone stock.
Sterile physiological solution: this will be used to dilute drug or vehicle solutions prior to injection.
Insulin syringes.
2.2. Hydroxyproline dosing solutions
Mortar-pestle or cryomill to cryo-pulverize flash-frozen muscle tissue.
Glass pyrex tubes with anti-evaporation screwcap.
6M HCl
1M Hydroxyproline standard: dissolve powder to 1M concentration in 6M HCl, prepare aliquots for single use (avoid freeze-thaw) and store at −20°C.
7% Chloramine T solution: dissolve 700 mg chloramine T in 10 ml ultrapure water. Store at 4°C in the dark for no longer than ~3 weeks.
Acetate citrate buffer: combine 57 g anhydrous sodium acetate, 33.4 g citric acid monohydrate, 435 ml of 1M NaOH, 385 ml of 100% 2-propanol and ultrapure water up to 1L. Store at 4°C in the dark.
Ehrlich’s reagent: resuspend 3 g 4-dimethylaminobenzaldehyde in 10 ml 100% ethanol, add 675 μl sulfuric acid in a fume hood with careful drop-by-drop pipetting (highly exergonic reaction). Prepare right prior to use.
Solution A: 20 % chloramine T solution, 80 % acetate citrate buffer. Prepare right prior to use. Prepare at least 100μl per sample, including all standards.
Solution B: 18.75 % Ehrlich’s reagent, 81.25 % 2-propanol. Prepare right prior to use. Prepare at least 1.5ml per sample, including all standards.
Oven, thermal bath, plate reader.
2.3. Grip and treadmill assays
Grip strength meter with single sensor for mice (max 1 kg capacity) with standard pull bars.
Open Treadmill with stimulus assembly, ~10% up-hill incline, individual mouse lanes, drive motor to adjust speed (3-100 m/min range), exercising belt with grip-prone texture.
2.4. Force-frequency analysis in tibialis anterior muscles
In situ force analysis equipment and sensor.
4-0 U.S.P silk braided surgical suture.
Isoflurane-based inhalation anesthesia system.
Precision scale, digital caliper.
2.5. Measurement of body weight and glycemia
Scale.
Glucometer with test strips.
3. Methods
All analyses should be performed blinded to treatment cohorts.
Here we report protocols and example data from parallel analyses in two background-matched genetic models of muscular dystrophy, DBA/2J-mdx mice and DBA/2J-Sgcg mice.
Four-months-old DBA/2J-mdx males were obtained from the JAX colony #013141. For this strain, it is appropriate to use only males as the X-linked Duchenne muscular dystrophy primarily affects boys. Use at least 5 mice per cohort.
Four-months-old DBA/2J-Sgcg mice (homozygous null) were obtained from the original mutant strain [3] after at least 10 back-crossing generations in the DBA/2J background. For this strain, randomize equal numbers of males and females across treatment cohorts. Use at least 5 mice per cohort.
See Note 2 for considerations regarding age of test mice.
3.1. Glucocorticoid regimens
Record mouse weight immediately before injection.
Prepare the injectable dose in a final volume of 50 μl sterile physiological solution. Add the appropriate volume of prednisone stock to a final dose of 1 mg/kg, e.g. 4μl (5 μg/μl, total of 20 μg) for a 20 g mouse.
Prepare a vehicle dose with the corresponding volumes of vehicle stock and sterile physiological solution.
Load one sterile, single-use insulin syringe per dose, making sure no air is introduced.
Restrain mice to expose abdomen and inject dose intra-peritoneally.
Frequency of dosing: once-daily regimen consists of 1x prednisone dose/day and is controlled by once-daily vehicle injection. Once-weekly regimen consists of 1x prednisone dose (day 1) followed by 6x vehicle doses (day 2-6) per week. It is controlled by once-daily vehicle injection.
Time of dosing: inject mice at the start of their subjective day-time, i.e. within the first two hours of lights-on in their housing space. This circadian time presents a critical window to maximize the effects induced by exogenous glucocorticoids through the glucocorticoid receptor [11,12].
Conduct regimens for a total of 12 weeks (see Note 3). Collect tissues at 24 hours after last prednisone dose.
3.2. Quantitation of anti-fibrotic effects through hydroxyproline dosing
Cryo-pulverize flash-frozen muscle and collect 50 mg cryo-powder in a glass pyrex tube.
Add 500 μl of 6 M HCl per sample, cap tightly.
Prepare the hydroxyproline standards into glass pyrex tubes with the following amounts of 1 M hydroxyproline stock: 0 μl (0 μmol), 5 μl (5 μmol), 10 μl (10 μmol), 20 μl (20 μmol). Adjust volume for each standard to 500 μl with 6 M HCl, cap tightly.
Incubate overnight at 110°C in oven (or thermal block) in fume hood to perform acid hydrolysis. An oven is recommended to ensure thermal homogeneity and allow the tubes to be incubated while standing into a Pyrex glass container.
After overnight incubation, bring samples to room temperature, set thermal block or water bath at 58°C.
Transfer 10 μl of sample supernatant, paying attention to avoiding small tissue particles, into new labeled tubes.
Keeping tubes at room temperature, add 150 μl of 100% 2-propanol per sample, vortex and leave cap open.
Add 75 μl Solution A, vortex, leave cap open and incubate at room temperature for 10 min.
Add 1 ml Solution B, vortex, close caps and incubate at 58°C for 45 min.
Transfer all tubes on ice until ready for plate reader analysis.
Spin at 5000 g for 5 min at 4°C.
Transfer 100μl per replicate (≥3 replicates for each standard and sample are recommended) into wells of a transparent 96w plate suitable for absorbance analyses at plate reader. Alternatively, use spectrophotometer with appropriate amounts for the dedicated cuvettes.
Measure absorbance at 558 nm.
Normalize hydroxyproline amount to initial cryopowder weight (e.g. nmol/mg).
Fig. 1 shows example data of glucocorticoid regimen effects on hydroxyproline content, used as quantitative measure of fibrotic collagen deposition, in skeletal muscle of DBA/2J-mdx mice and DBA/2J-Sgcg mice after a 12-week-long treatment.
Figure 1.
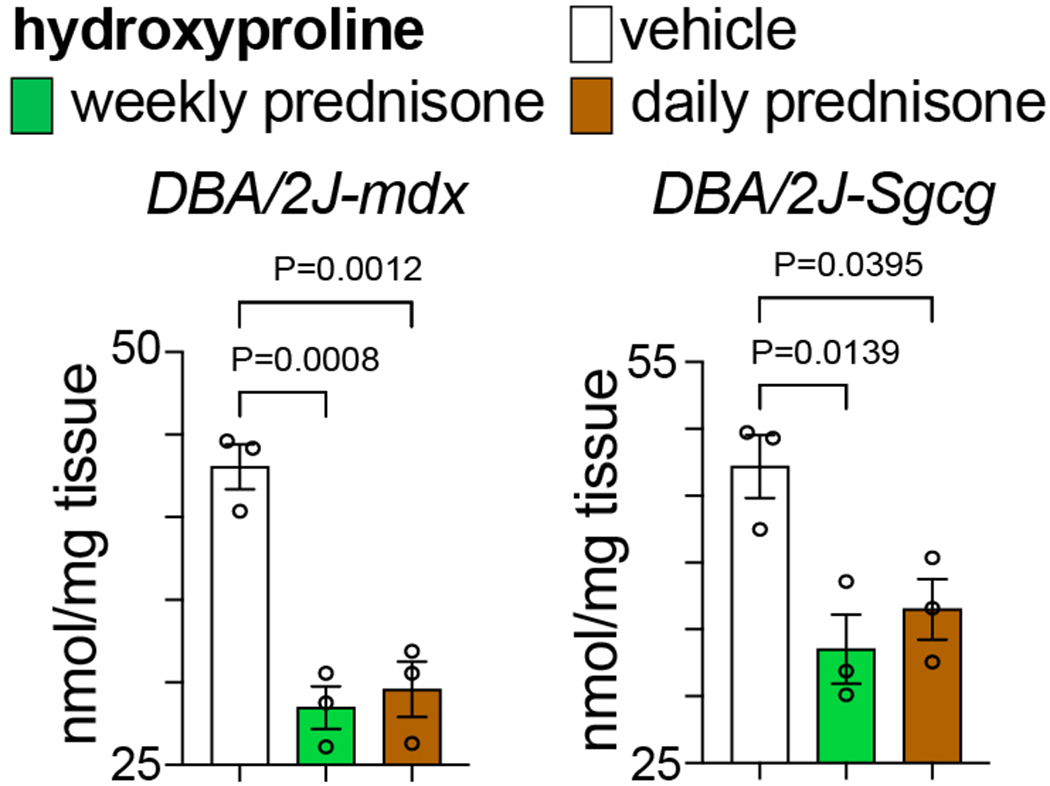
Compared to vehicle, both weekly and daily prednisone treatments improved fibrosis (decreased hydroxyproline content) in quadriceps muscle of dystrophic mice, as quantitated here through hydroxyproline dosing. N=3♂/group (mdx), (1♂+2♀)/group (Sgcg). 1-way ANOVA with Sidak’s multi-comparison test.
3.3. Quantitation of regimen-specific effects on grip strength and treadmill performance
For grip strength: record force developed by each mouse through bilateral grasp of forelimbs while pulling the mouse away from the metal grid.
Hold the tail and pull the animal away with a constant, gentle movement, keeping the mouse parallel to the work surface.
Repeat the grip force measurements three times per mouse, resting the mouse for one minute between pulls, and record the highest number.
Normalize grip strength to body weight, recorded immediately before grip assay.
Fig. 2 shows example data of glucocorticoid regimen effects on grip strength. In both mdx and Sgcg mice, grip strength declined with disease progression. Once-weekly prednisone counteracted the strength decline, while this was exacerbated by once-daily prednisone.
For treadmill assay: place mice in individual treadmill lanes, start the conveyor belt at 3 m/min and increase speed by 1 m/min every minute (1m/min2 acceleration).
Induce mice to continue running by a shock grid at the end of the conveyor until they display evident signs of exhaustion, e.g. 30 sec on the shock grid without successful efforts to start running again.
Record distance (m) and total time (sec) until exhaustion.
Analyze treadmill assay performance as either time-to-exhaustion, or distance-to-exhaustion, or weight-normalized work (kg*m2*sec(−2), Joule units).
Fig. 3 shows example data of glucocorticoid regimen effects on treadmill performance. In both mdx and Sgcg mice, treadmill performance declined with disease progression. Once-weekly prednisone partially counteracted the decline in running performance, while this was exacerbated by once-daily prednisone.
It is recommended to measure grip strength and treadmill performance at baseline (e.g. one day before first injection) and at treatment endpoint (e.g. 24 hours after last prednisone dose) to quantitate relative trends compared to baseline.
If assaying both grip strength and treadmill in the same day, perform grip assay before treadmill assay to avoid possible effects of fatigue. Allow mice to walk freely in the cage for 30min between grip and treadmill assays.
Keep operator-dependent variables (e.g. operator, instruments, room conditions, time-of-day) for both assays constant across cohorts and time points.
Avoid collecting tissues immediately after a treadmill assay. It is recommended to collect tissues at least 24 hours after the last treadmill assay.
Figure 2.
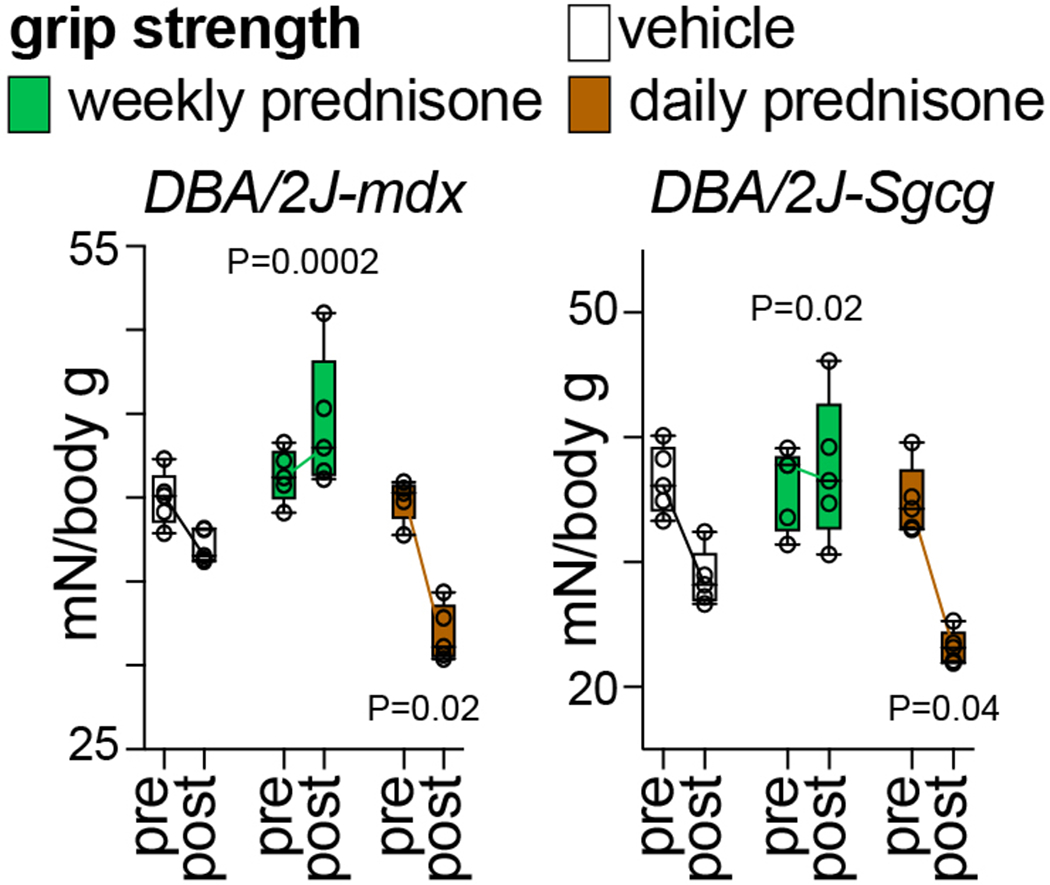
Compared to vehicle, weekly prednisone improved the decline in weight-normalized grip strength in both mdx and Sgcg mice. Daily prednisone exacerbated the loss of strength. N=5♂/group (mdx), (3♂+2♀)/group (Sgcg). 2-way ANOVA with Dunnet’s multi-comparison test versus vehicle.
Figure 3.
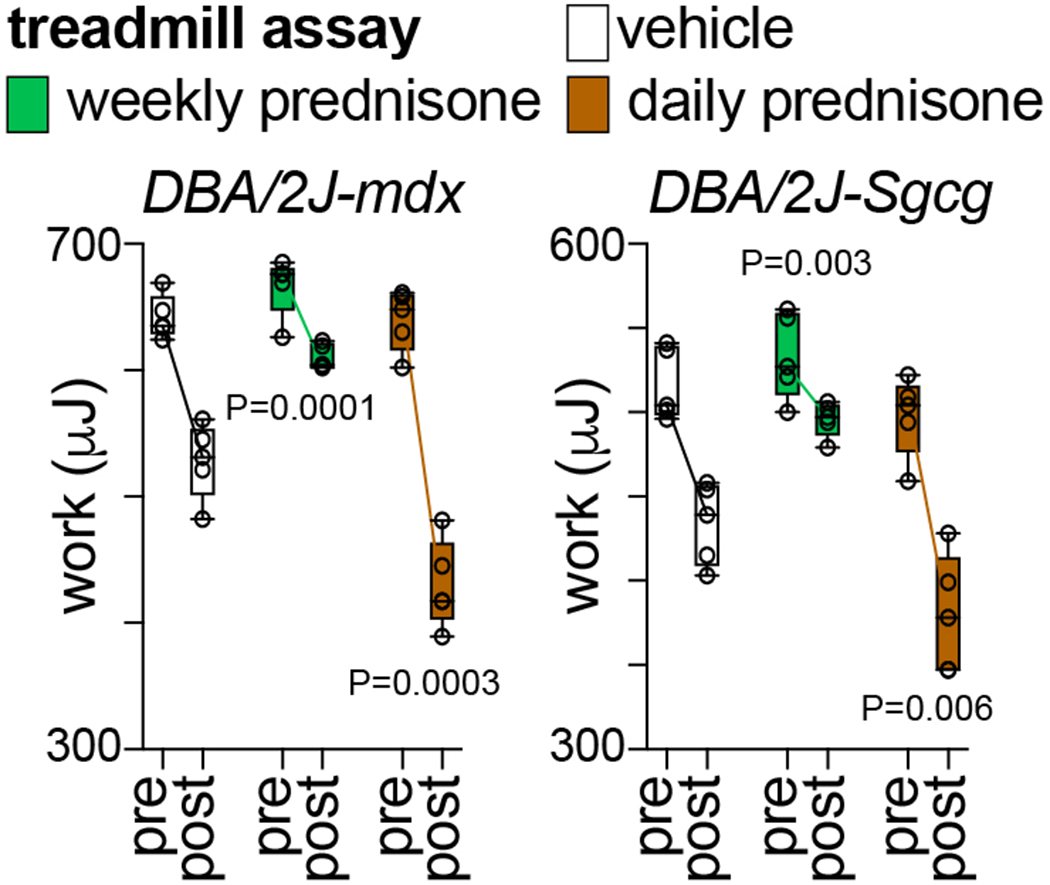
Compared to vehicle, weekly prednisone improved the decline in treadmill performance until exhaustion in dystrophic mice. Daily prednisone exacerbated the loss of running performance. N=5♂/group (mdx), (3♂+2♀)/group (Sgcg). 2-way ANOVA with Dunnet’s multi-comparison test versus vehicle.
3.4. Quantitation of regimen-specific effects on muscle force
Anesthetize mouse with 1.5 % isoflurane, lay the mouse supine on the assay platform of the Aurora In Situ system, block the knee with the dedicated clamp.
Ensuring tendons and muscles are not damaged, remove the hindlimb skin to uncover the tibialis anterior muscle.
Detach the tibialis anterior muscle from the tibia by sliding and expanding a forceps between muscle and bone.
Secure the distal tendon to the force probe through surgical suture, gently sever the tendon and separate the muscle from the tibia. The tibialis anterior muscle should be linked to the force probe on the distal side and to the knee region on the proximal side.
Adjust platform and probe to ensure that the probe is in line with the knee.
Place two electrical probes into the leg, one at the distal end of the tibialis anterior and one under the knee cap near the sciatic nerve.
Run test pulses to adjust muscle tension to the equilibrium point. The equilibrium point is the muscle tension at the initial resting point to which the muscle returns to after test pulses of electricity are administered. Record the muscle length in mm at equilibrium with a digital caliper (L0).
Run the force-frequency test through tetanus stimulations at increasing frequency, i.e. from 25 Hz to 200 Hz with intervals of 25 Hz. Pause 1 minute between tetani. Record force in N for each isometric contraction (P0).
Repeat procedure and test on contralateral tibialis anterior muscle.
Proceed to euthanasia, collect and record each tibialis anterior muscle with a precision scale.
Calculate specific force (N/mm2) for each tetanus frequency as (P0 N)/[(muscle mass mg/1.06 mg/mm3)/Lf mm]. 1.06 mg/mm3 is the mammalian muscle density. Lf=L0*0.6, where 0.6 is the muscle to fiber length ratio in tibialis anterior muscle [13]. The specific force is often converted to and reported as N/cm2 units.
Fig. 4 shows example data of glucocorticoid regimen effects on muscle force at end of treatments. Compared to vehicle in both mdx and Sgcg mice, once-weekly prednisone improved force generation while once-daily prednisone decreased it.
Figure 4.
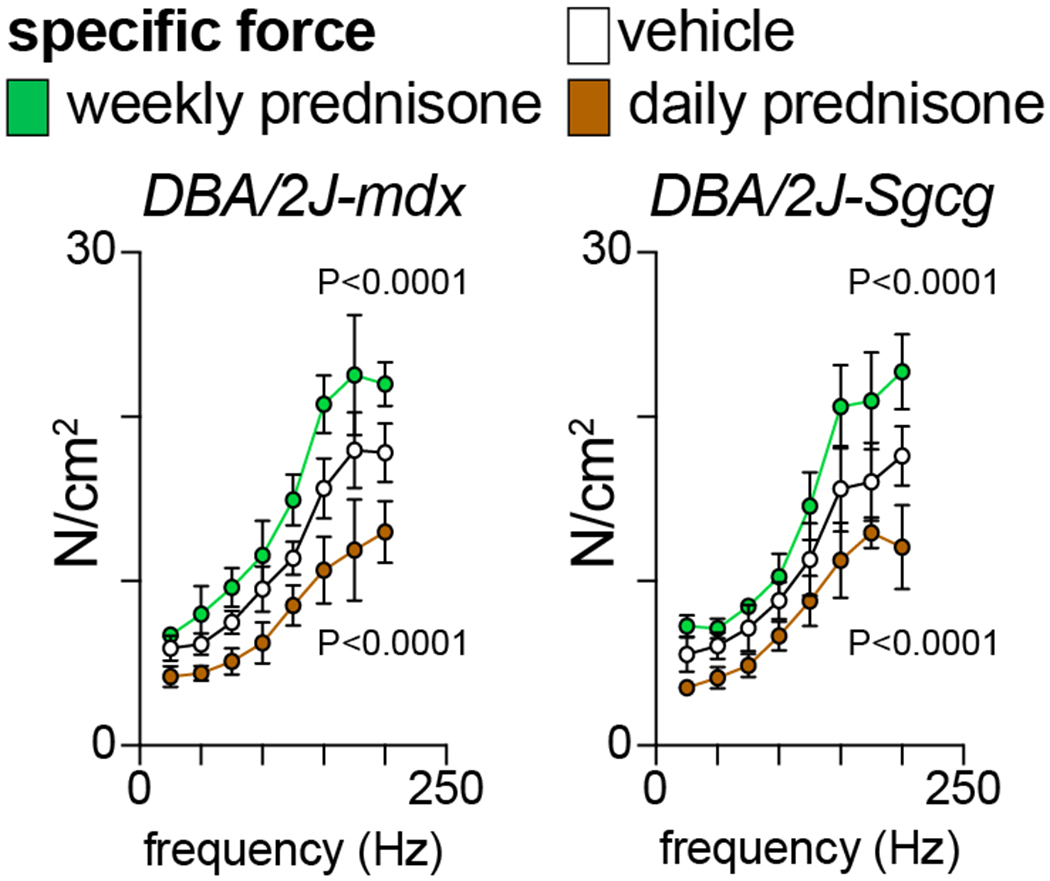
At endpoint, in situ force-frequency analysis with tibialis anterior muscles showed gain of force with weekly prednisone and loss of force with daily prednisone compared to vehicle. N=3♂/group (mdx), (2♂+1♀)/group (Sgcg). 2-way ANOVA with Dunnet’s multi-comparison test versus vehicle.
3.5. Quantitation of regimen-specific effects on glycemia and weight
To record weights, place mouse on a scale in a suitable container to avoid escaping or jumping. Record weight to the nearest tenth of a gram when the mouse is not moving.
To record glycemia, fast mice for 2 hours [14], clip the tail end and measure the blood drop with a glucometer.
Record glycemia and weights at baseline (e.g. one day before first injection) and at treatment endpoint (e.g. 24 hours after last prednisone dose) to quantitate relative trends compared to baseline.
Record glycemia and weights at the same time of day throughout treatment.
Analyze glycemia and body weight trends as absolute values or relative trends to baseline.
Fig. 5 shows example data of glucocorticoid regimen effects on glycemia. Compared to vehicle in both mdx and Sgcg mice, once-daily prednisone (dysmetabolic regimen) increased glycemia while once-weekly prednisone did not induce significant changes.
Fig. 6 shows example data of glucocorticoid regimen effects on body weight. Compared to vehicle in both mdx and Sgcg mice, once-daily prednisone (pro-wasting regimen) decreased body weight while once-weekly prednisone did not induce significant changes. See Note 4.
Figure 5.
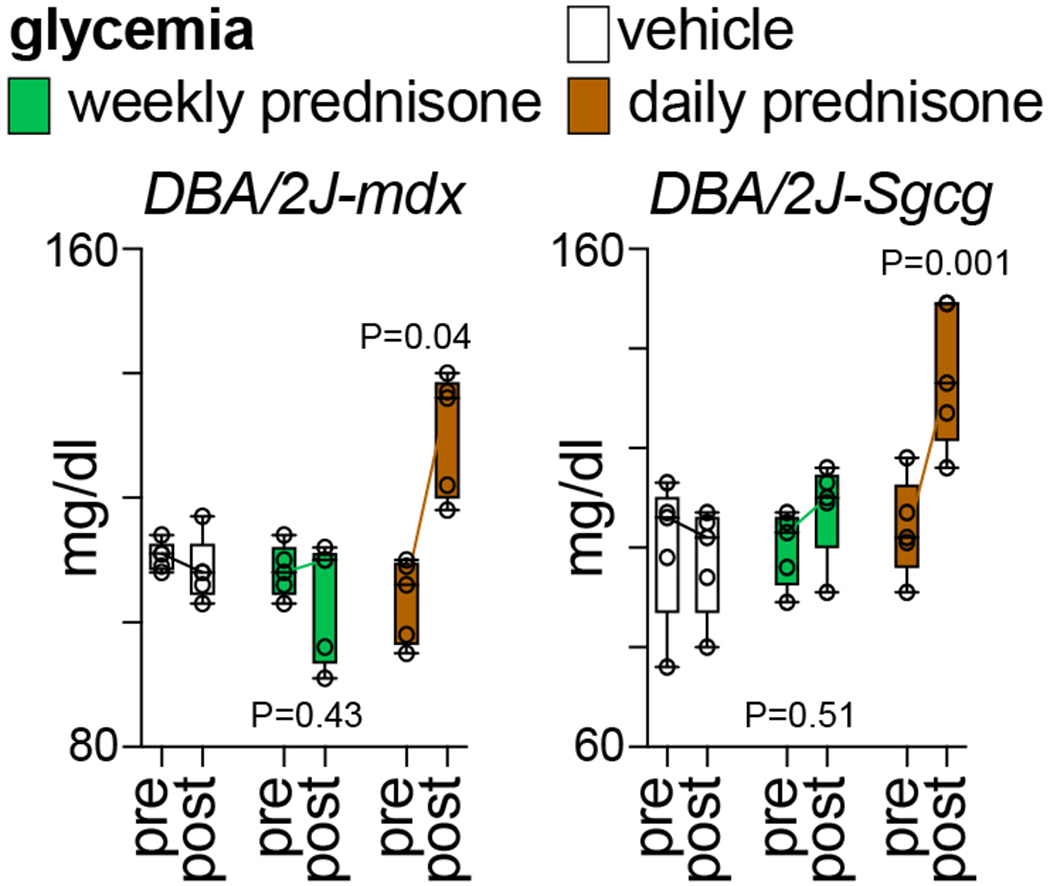
Compared to vehicle, weekly prednisone did not induce changes in glycemia. Daily prednisone induced hyperglycemia in dystrophic mice, correlating with the known pro-hyperglycemic effects of this regimen. N=5♂/group (mdx), (3♂+2♀)/group (Sgcg). 2-way ANOVA with Dunnet’s multi-comparison test versus vehicle.
Figure 6.
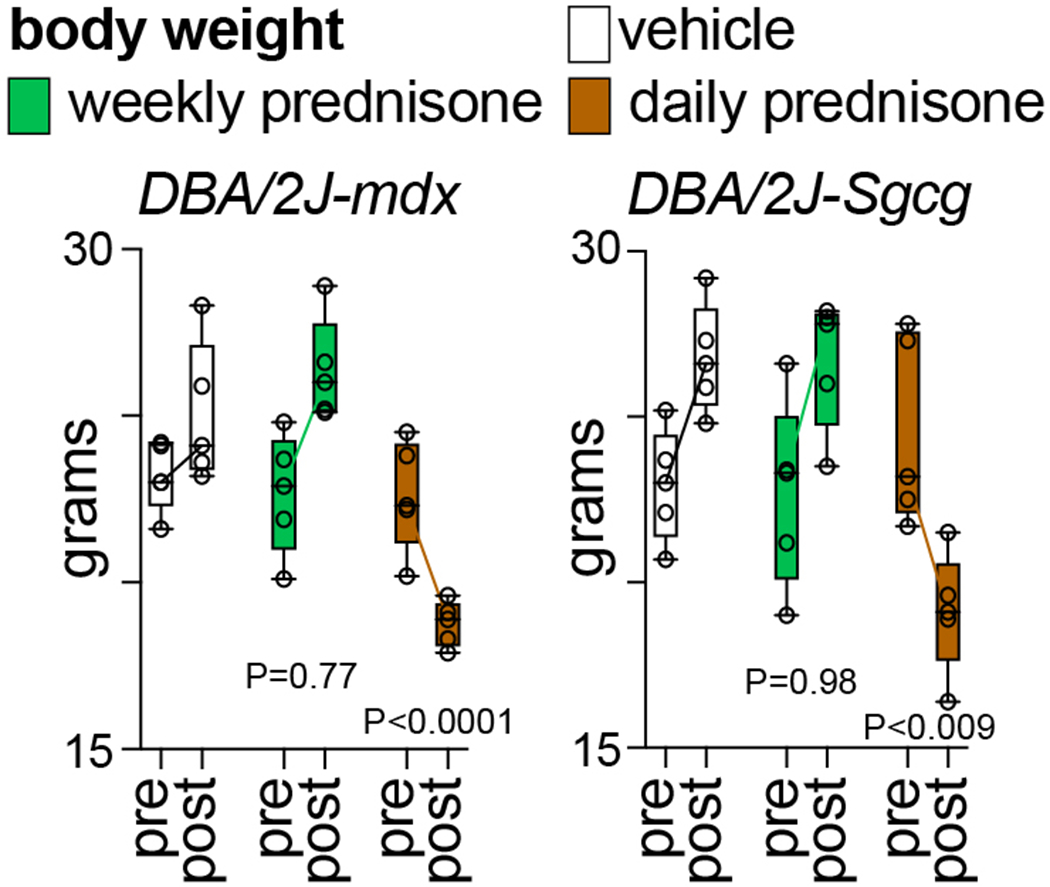
Compared to vehicle, weekly prednisone did not induce changes in body weight curves, while daily prednisone induced loss of body weight, correlating with the known pro-wasting effects of this glucocorticoid regimen. N=5♂/group (mdx), (3♂+2♀)/group (Sgcg). 2-way ANOVA with Dunnet’s multi-comparison test versus vehicle.
Acknowledgments
The DBA/2J-Sgcg mice were donated by Dr. Elizabeth McNally (Northwestern University). This work was supported by DK121875 (NIH), Start-up funds (CCHMC), Trustee Award (CCHMC) and Heart Institute Translational Funds (CCHMC).
4 Notes
Here we use prednisone as 1mg/kg, as this dose successfully discriminated the effects diverging the once-weekly from the once-daily regimens in both dystrophic mouse lines [8–10]. Other glucocorticoids, dosages and intermittence intervals should be tested to evaluate differences/similarities with analyses and trends discussed here.
Here we are reporting methods and data related to glucocorticoid treatments in mice of 4 months of age at start. This age-at-start is convenient for 12-week-long regimens. Indeed, treated mice will be 4-months-old at start and ~7-months-old at endpoint. This age window encompasses onset and progression of pathophysiology in both DBA/2J-mdx and DBA/2J-Sgcg mouse lines [15], without the overt muscle degeneration seen at later stages. If treatments are conducted at an earlier or later age, analyses should take into account the pre-symptomatic and advanced stages of disease progression in these mice.
A 12-week-long treatment enables for stabilization of the divergent regimen-specific changes, with the additional consideration of ages at start and endpoint. Especially for once-daily glucocorticoid regimens, special attention should be paid when protracting these regimens longer than 12 weeks or if conducting them in mice older than ~7 months of age. Indeed, the wasting effects of this regimen tend to be of particular burden to dystrophic mice at advanced stages of disease, when dystrophic muscle degeneration is already prominent per se.
Mice are more susceptible to glucocorticoid-driven atrophy than humans, likely because of the higher preponderance of type-II myofibers in their muscles [16]. Weight curves offer an immediate albeit imperfect proxy estimate of overall wasting. If MRI-based systems to estimate lean and fat masses are available, these provide a better estimation of the dysmetabolic burden of once-daily versus once-weekly prednisone. Using MRI-based systems, it is indeed possible to simultaneously quantitate changes in adiposity versus lean mass (absolute or relative) over time.
References
- 1.Emery AE (2002) The muscular dystrophies. Lancet 359 (9307):687–695. doi: 10.1016/S0140-6736 [DOI] [PubMed] [Google Scholar]
- 2.Bulfield G, Siller WG, Wight PA et al. (1984) X chromosome-linked muscular dystrophy (mdx) in the mouse. Proc Natl Acad Sci U S A 81 (4):1189–1192 [DOI] [PMC free article] [PubMed] [Google Scholar]
- 3.Hack AA, Ly CT, Jiang F et al. (1998) Gamma-sarcoglycan deficiency leads to muscle membrane defects and apoptosis independent of dystrophin. J Cell Biol 142 (5):1279–1287 [DOI] [PMC free article] [PubMed] [Google Scholar]
- 4.Hammers DW, Hart CC, Matheny MK et al. (2020) The D2.mdx mouse as a preclinical model of the skeletal muscle pathology associated with Duchenne muscular dystrophy. Sci Rep 10 (1):14070. doi: 10.1038/s41598-020-70987-y [DOI] [PMC free article] [PubMed] [Google Scholar]
- 5.McDonald CM, Henricson EK, Abresch RT et al. (2018) Long-term effects of glucocorticoids on function, quality of life, and survival in patients with Duchenne muscular dystrophy: a prospective cohort study. Lancet 391 (10119):451–461. doi: 10.1016/S0140-6736(17)32160-8 [DOI] [PubMed] [Google Scholar]
- 6.Quattrocelli M, Zelikovich AS, Salamone IM et al. (2020) Mechanisms and Clinical Applications of Glucocorticoid Steroids in Muscular Dystrophy. J Neuromuscul Dis. doi: 10.3233/JND-200556 [DOI] [PMC free article] [PubMed] [Google Scholar]
- 7.Walter MC, Reilich P, Thiele S et al. (2013) Treatment of dysferlinopathy with deflazacort: a double-blind, placebo-controlled clinical trial. Orphanet J Rare Dis 8:26. doi: 10.1186/1750-1172-8-26 [DOI] [PMC free article] [PubMed] [Google Scholar]
- 8.Quattrocelli M, Salamone IM, Page PG et al. (2017) Intermittent Glucocorticoid Dosing Improves Muscle Repair and Function in Mice with Limb-Girdle Muscular Dystrophy. Am J Pathol 187 (11):2520–2535. doi: 10.1016/j.ajpath.2017.07.017 [DOI] [PMC free article] [PubMed] [Google Scholar]
- 9.Quattrocelli M, Barefield DY, Warner JL et al. (2017) Intermittent glucocorticoid steroid dosing enhances muscle repair without eliciting muscle atrophy. J Clin Invest 127 (6):2418–2432. doi: 10.1172/JCI91445 [DOI] [PMC free article] [PubMed] [Google Scholar]
- 10.Quattrocelli M, Zelikovich AS, Jiang Z et al. (2019) Pulsed glucocorticoids enhance dystrophic muscle performance through epigenetic-metabolic reprogramming. JCI Insight 4 (24). doi: 10.1172/jci.insight.132402 [DOI] [PMC free article] [PubMed] [Google Scholar]
- 11.Lamia KA, Papp SJ, Yu RT et al. (2011) Cryptochromes mediate rhythmic repression of the glucocorticoid receptor. Nature 480 (7378):552–556. doi: 10.1038/nature10700 [DOI] [PMC free article] [PubMed] [Google Scholar]
- 12.Rizzini L, Levine DC, Perelis M et al. (2019) Cryptochromes-Mediated Inhibition of the CRL4(Cop1)-Complex Assembly Defines an Evolutionary Conserved Signaling Mechanism. Curr Biol 29 (12):1954–1962 e1954. doi: 10.1016/j.cub.2019.04.073 [DOI] [PMC free article] [PubMed] [Google Scholar]
- 13.Burkholder TJ, Fingado B, Baron S et al. (1994) Relationship between muscle fiber types and sizes and muscle architectural properties in the mouse hindlimb. J Morphol 221 (2):177–190. doi: 10.1002/jmor.1052210207 [DOI] [PubMed] [Google Scholar]
- 14.Carper D, Coue M, Laurens C et al. (2020) Reappraisal of the optimal fasting time for insulin tolerance tests in mice. Mol Metab:101058. doi: 10.1016/j.molmet.2020.101058 [DOI] [PMC free article] [PubMed] [Google Scholar]
- 15.Roberts NW, Holley-Cuthrell J, Gonzalez-Vega M et al. (2015) Biochemical and Functional Comparisons of mdx and Sgcg(−/−) Muscular Dystrophy Mouse Models. Biomed Res Int 2015:131436. doi: 10.1155/2015/131436 [DOI] [PMC free article] [PubMed] [Google Scholar]
- 16.Sali A, Guerron AD, Gordish-Dressman H et al. (2012) Glucocorticoid-treated mice are an inappropriate positive control for long-term preclinical studies in the mdx mouse. PloS one 7 (4):e34204. doi: 10.1371/journal.pone.0034204 [DOI] [PMC free article] [PubMed] [Google Scholar]


