

SUMMARY
Individuals can exhibit differences in metabolism caused by the interplay of genetic background, nutritional input, microbiota, and other environmental factors1–4. It is difficult to connect differences in metabolism to genomic variation and derive underlying molecular mechanisms in humans due to differences in diet and lifestyle, among others. Here, we introduce the nematode Caenorhabditis elegans as a model to study inter-individual variation in metabolism. By comparing three wild strains and the commonly used N2 laboratory strain, we find differences in the abundances of both known and previously undescribed metabolites. Novel metabolites include conjugates between 3-hydroxypropionate (3HP) and several amino acids (3HP-AAs) that are much higher in abundance in one of the wild strains. 3HP is an intermediate in the propionate shunt pathway, which is activated when flux through the canonical, vitamin B12-dependent propionate breakdown pathway is perturbed5. We demonstrate that increased 3HP-AA accumulation is caused by genetic variation in HPHD-1, for which 3HP is a substrate. Our results suggest that 3HP-AA production represents a ‘shunt-within-a-shunt’ pathway to accommodate a reduction-of-function allele in hphd-1. This study provides a first step to developing metabolic network models that capture individual-specific differences of metabolism and more closely represent the diversity found in entire species.
Inborn errors in metabolism are characterized by the accumulation or depletion of metabolites caused by mutations in genes encoding metabolic enzymes6. For instance, people suffering from propionic acidemia harbor mutations in either subunit of propionyl-CoA carboxylase and are diagnosed in newborn screening by the accumulation of 3-hydroxypropionate (3HP)7. Altered metabolism is also associated with a wide variety of complex diseases, including obesity, type 2 diabetes, and cancer, which often have a genetic basis as well8,9. Connecting genomic and gene expression variation to differences in metabolism is a daunting task in humans because, in addition to obtaining an individual’s genome sequence, it requires replicate measurements of the metabolome and transcriptome in age- and gender-matched individuals that, ideally, would consume exactly the same diet and experience identical environments.
Here, we introduce the nematode C. elegans as a model to study individual differences in metabolism. A key advantage of using C. elegans is that it is a self-fertilizing hermaphrodite that can be fed single bacterial diets10. Therefore, isogenic C. elegans strains can be grown to large numbers of animals under standardized conditions, almost as easily as bacteria, allowing dual-use of the same samples for both metabolomics and transcriptomics. These measurements can be integrated with genome-scale metabolic network models that cover annotated biochemical reactions in C. elegans, such as iCEL1314, to obtain functional predictions about the impacts of genetic variation11,12. Numerous wild C. elegans strains that represent genetically unique individuals have been collected and used to connect genomic variation to a plethora of traits13. Finally, CRISPR-Cas9 genome editing facilitates the validation of mechanistic predictions in intact animals14.
Variation in metabolite abundance
To connect differences in metabolite abundance to genomic variation, we selected four C. elegans strains based on high-quality genome sequencing data, including the N2 reference strain and three wild strains: BRC20067, CB4856, and DL238 (Fig. 1a). The N2 (Bristol, England) and BRC20067 (Taiwan) strains are closely related despite the physical distance between the locations where they were found15, whereas the CB4856 and DL238 strains, isolated from different islands of Hawaii, USA, are divergent from the first two strains and from each other (Extended Data Fig. 1). Briefly, synchronized animals at the first larval stage (L1) were grown in chemically defined K medium16 with lysed and lyophilized Escherichia coli HB101 (referred to as E. coli powder) as a diet to avoid potentially confounding effects of active bacterial metabolism (Extended Data Fig. 1). We harvested animals as young adults and used 90% and 10% of animals for metabolomic and gene expression analysis, respectively (Extended Data Fig. 1). For metabolomic analyses, we separately extracted animals and supernatants for analysis of the endo- and exo-metabolomes, i.e., cellular and secreted metabolites, respectively. To maximize metabolite coverage, we analyzed metabolome samples with multiple liquid and gas chromatography mass spectrometry (LC-MS and GC-MS) approaches (Extended Data Fig. 1).
Figure 1: Inter-individual variation in metabolism.

a, Study outline. b, Volcano plots for subset of features detected by HPLC-MS (negative ion) in the exo-metabolomes for each wild strain versus the N2 reference strain, see Methods for more details. Arrows highlight iglu#93, a metabolite observed in the three wild strains but not in N2 (see also Extended Data Fig. 2). Dashed lines represent Benjamini-Hochberg adjusted significance thresholds at false discovery rates of 15% and 5%. c, Number of manually curated strain-specific metabolites, conservatively defined as any metabolite more than five-fold enriched or depleted in a given strain relative to the average of the other three strains at significance threshold p < 0.01 (unpaired, two-sided t-test). d, HPLC-MS (negative ion) extracted ion chromatograms (EICs) representing a homologous series of singly unsaturated hydroxy-fatty acids enriched in the wild strains (marked by arrows) relative to N2. A later-eluting isobaric series does not significantly vary between the four strains (marked by *, see also Extended Data Fig. 3). e, Quantification of 3HP in the endo- and exo-metabolome extracts of the four strains. Data represent six biologically independent experiments and bars indicate mean ± s.d., p-value calculated by unpaired, two-sided t-test with Welch correction. Source data are provided as a Source Data file.
Detected iCEL1314 metabolites include amino acids, a variety of fatty acids and other lipids, as well as carbohydrates and nucleosides (Supplementary Table 1). iCEL1314 metabolites that could not be measured include reactive molecules, such as acyl-CoA derivatives and nucleoside triphosphates, as well as biomass components such as bulk carbohydrates and triacyl glycerides. Most features detected by LC-MS (>500,000) could not be linked to known compounds using existing databases and likely represent more than 20,000 metabolites (Supplementary Tables 2–8).
To characterize metabolome differences among the four strains, we employed comparative metabolomics using the XCMS and Metaboseek analysis platforms17,18. Pairwise comparisons with the N2 reference strain revealed several hundred metabolites whose abundances differed significantly in the three natural strains (Fig. 1b). In addition, approximately 200 metabolites (representing ~1% of the detected metabolites) were highly strain-specific, defined as greater than five-fold enrichment or depletion in one strain relative to the average of the other three strains (unadjusted p < 0.01) (Fig. 1c, Supplementary Table 9). For example, the three natural strains produced iglu#93, an indole glycoside that was absent from the metabolome of the N2 strain and especially abundant in DL238 (Fig. 1b, arrows, see also Extended Data Fig. 2). Similarly, several oxidized fatty acid derivatives were more abundant in the three wild strains than in N2 (Fig. 1d), although levels of the corresponding free fatty acids were only slightly or not increased in the wild strains (Extended Data Fig. 3). Among detected iCEL1314 metabolites, the most significant strain-specific compound was 3HP, which was more than seven-fold enriched in the exo-metabolome of DL238 compared to the average of the other three strains (Fig. 1e, Supplementary Table 10). 3HP is produced by the propionate shunt, which is transcriptionally activated when flux through the canonical, vitamin B12-dependent propionate breakdown pathway is perturbed, for instance on bacterial diets low in vitamin B12 (e.g., E. coli)5. The increased excretion of 3HP suggests that flux through the propionate shunt is impaired in the DL238 strain.
Most of the compounds that differ greatly in abundance between strains represent previously undescribed metabolites. These were analyzed by MS/MS molecular networking, in which MS/MS spectra of different compounds are compared and ranked by similarity of fragmentation patterns19,20. The metabolites (represented by nodes) are connected by edges indicating structural similarity, and therefore metabolites that are connected in the network may share common biogenic pathways. A set of structurally related compounds whose abundances are five- to eight-fold increased in DL238 relative to the N2 strain and the other wild strains were among the most abundant significantly differential metabolites detected (Fig. 2a, Fig. 2b, full network in Extended Data Fig. 4). These metabolites were 10- to 100-fold more abundant in the exo- relative to the endo-metabolome extracts, indicating that they are primarily excreted (Extended Data Fig. 5). Analysis of their molecular formulae and MS/MS fragmentation patterns suggested that these compounds consist of 2-hydroxy propionate (lactate) or 3HP conjugated to different amino acids (Extended Data Fig. 5). Given that 3HP abundance was strongly increased in DL238 (Fig. 1e), we hypothesized that these metabolites represent 3HP-amino acid (3HP-AA) conjugates, analogous to the formation of N-lactoyl amino acids in response to increased lactic acid concentrations in humans21. Given that propionate metabolism is largely conserved from C. elegans to humans5, the hypothesis that 3HP is metabolized differently in DL238 relative to the other three strains seemed particularly interesting. Therefore, we selected the putative 3HP-derived metabolites for detailed follow-up studies.
Figure 2: A shunt-within-a-shunt for propionate degradation.
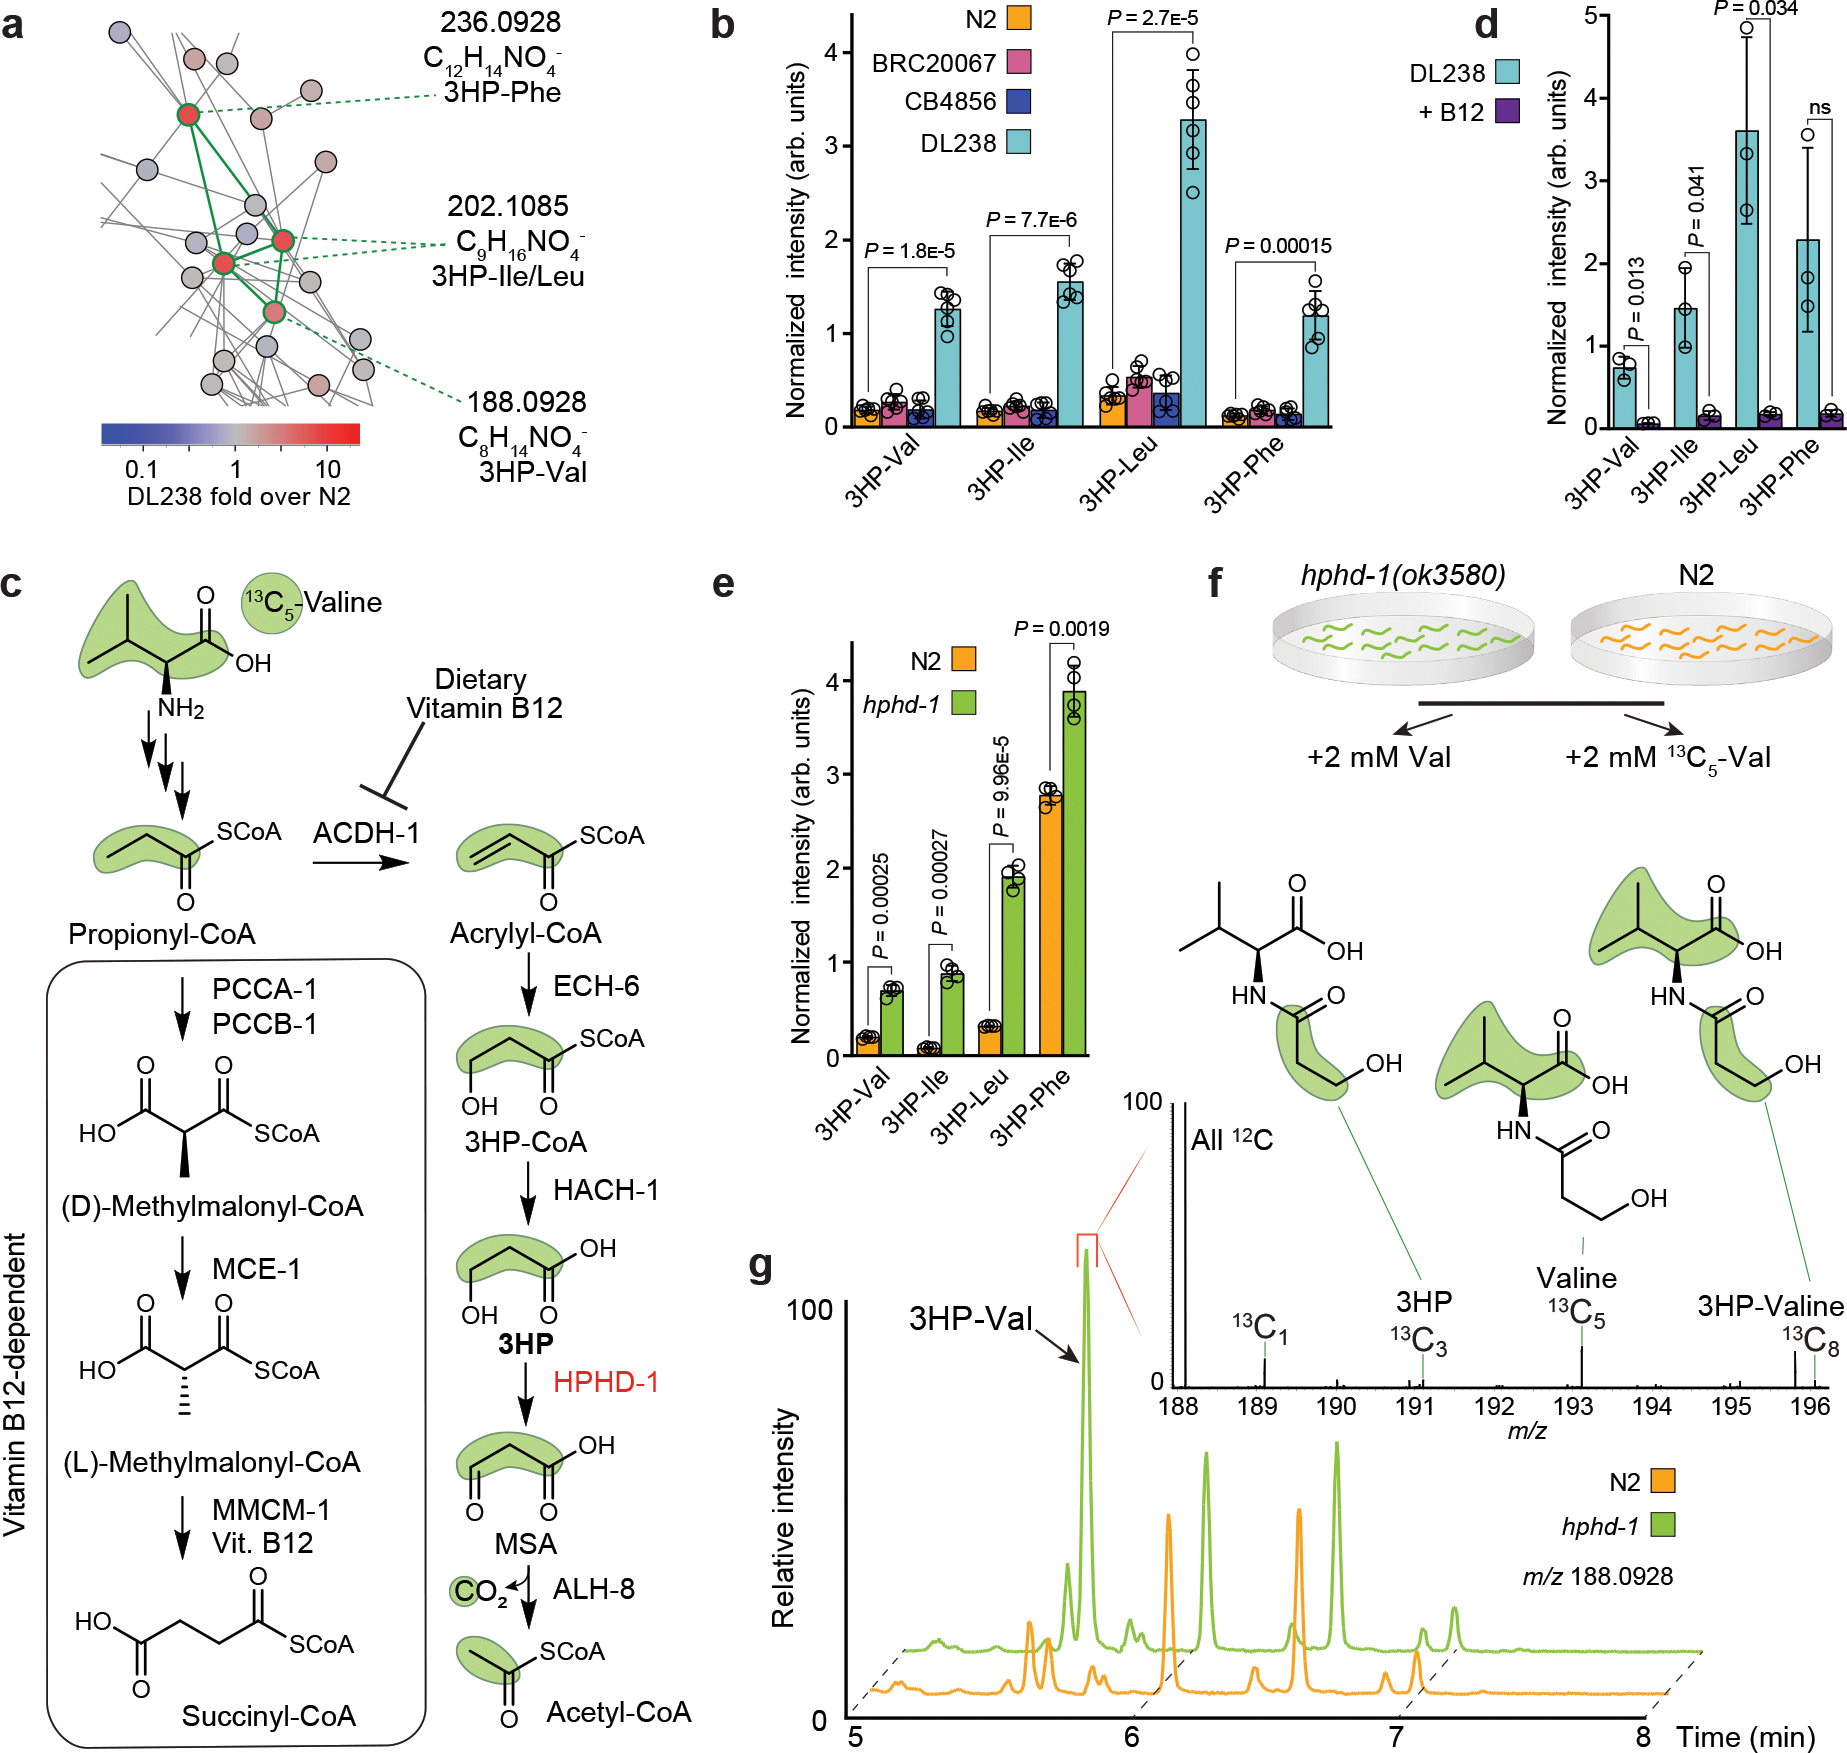
a, MS/MS networking revealed four structurally related metabolites (highlighted with green edges) that are enriched in DL238. MS/MS fragmentation and molecular formulae suggested that these compounds are 3HP-AA conjugates. b, Quantification of 3HP-AAs from exo-metabolome extracts of the four strains. Data represent six biologically independent experiments and bars indicate mean ± s.d. c, Canonical (boxed) and shunt metabolic pathways for propionyl-CoA degradation. Under B12-replete conditions, propionate shunt genes are transcriptionally repressed, and propionyl-CoA is metabolized to succinyl-CoA. Under B12-deficient conditions, propionyl-CoA is degraded by the propionate shunt pathway. 3HP is an intermediate in the propionate shunt and accumulates in hphd-1(ok3580) mutant animals. d, Quantification of 3HP-AAs from exo-metabolome extracts of the DL238 strain fed the standard E. coli OP50 diet without (light blue) or with supplementation of 64 nM vitamin B12 (purple). Data represent three biologically independent experiments and bars indicate mean ± s.d. e, Quantification of 3HP-AAs from exo-metabolome extracts of N2 and hphd-1(ok3580) animals. Data represent four biologically independent experiments and bars indicate mean ± s.d. f, 13C5-Val isotope tracing experiment. N2 and hphd-1(ok3580) animals were supplemented with Val or 13C5-Val and analyzed for isotopic enrichment. g, EICs (negative ion) for m/z 188.0928 in N2 and hphd-1(ok3580) mutants supplemented with 13C5-Val. 3HP-Val (arrow) is more abundant in the hphd-1(ok3580) mutant. Inset: averaged mass spectra from the region-of-interest (denoted by red bracket) reveal 13C3, 13C5, and 13C8 enrichment in 3HP-Val (13C1 natural abundance shown for scale). Distribution of 13C enrichment in 3HP-Val resulting from 13C5-Val supplement are highlighted with green shading. Source data are provided as a Source Data file. For b, d, and e, p-values calculated by unpaired, two-sided t-test with Welch correction. ns, not significant
A shunt-within-a-shunt
We reasoned that production of the putative 3HP-AA conjugates should be abolished when propionate is degraded via the canonical, vitamin B12-dependent pathway (Fig. 2c). Consistent with this reasoning, supplementation with vitamin B12 strongly reduced production of the putative 3HP-AA conjugates in DL238 animals (Fig. 2d). 3HP is oxidized to malonic semialdehyde by HPHD-1 (Fig. 2c), a conserved hydroxyacid-oxoacid transhydrogenase5, and hphd-1 disruption in the N2 background causes dramatically increased 3HP levels5. Correspondingly, we found that abundance of the putative 3HP-AA conjugates is also greatly increased in hphd-1(ok3580) mutant animals (Fig. 2e). To confirm the conjugation between 3HP and AAs, we performed isotope tracing experiments with 13C5-Val in hphd-1(ok3580) mutants and the N2 strain (Fig. 2f). Valine catabolism produces propionyl-CoA, which feeds into the propionate shunt22,23. Supplementation with 13C5-Val resulted in 13C3-, 13C5-, and a small amount of 13C8-labeling in 3HP-valine in the hphd-1(ok3580) mutant (Fig. 2g), consistent with generation of propionyl-CoA from valine catabolism (Fig. 2c). Correspondingly, 13C3-enrichment was also observed for the other putative 3HP-AA conjugates (Extended Data Fig. 5).
Parallel 13C6-Leu tracing experiments demonstrated 13C6-labeling of the 3HP-Leu conjugate, as well as two additional isobaric metabolites that were not enriched in the DL238 strain relative to the other strains, likely diastereomers of N-lactoyl-Leu (Extended Data Fig. 6). These 13C6-labeled metabolites eluted as the later peak of an isobaric pair of features with identical MS/MS spectra, suggesting that the earlier eluting peaks represented the corresponding isoleucine conjugates (Extended Data Fig. 6). Isotope tracing experiments further revealed a series of predominantly excreted N-propionyl-AA conjugates that were two- to five-fold enriched in DL238 relative to N2 (Extended Data Fig. 7). Notably, N-propionyl-AAs were not enriched in hphd-1(ok3580) mutants nor suppressed by vitamin B12 supplementation (Extended Data Fig. 7).
Finally, we synthesized authentic samples of representative members of the identified series of AA conjugates, including 3HP-Leu, 3HP-Phe, and N-propionyl-Leu, which showed chromatographic retention times and MS/MS spectra matching the natural compounds (Extended Data Fig. 8). Collectively, our analyses revealed accumulation of 3HP as well as 3HP- and N-propionyl-AA conjugates in the DL238 strain. These observations indicate that DL238 rewires propionate metabolism by conjugating both 3HP and propionate to AAs.
Coding variation in hphd-1
Since disruption of hphd-1 in the N2 strain results in accumulation of both 3HP and 3HP-AAs, we asked whether the high abundance of these metabolites in the DL238 strain may be due to variation in this gene. Compared to N2, DL238 has two variants in HPHD-1: K172M and L268P (Fig. 3a). The K172M variant resides in a region of the enzyme that is not highly conserved, but the L268P variant is embedded in a highly conserved region and abuts a Pro-rich motif, PxPxxPxxRP(L/P)YQGS24. The L to P variant likely causes a conformationally restricted Pro-Pro dipeptide in the DL238 version of HPHD-1 (Fig. 3a)25,26. To test whether the DL238 HPHD-1 variants contribute to the observed differences in abundance of 3HP and 3HP-AA conjugates, we used CRISPR-Cas9 genome editing to individually introduce the N2 hphd-1 variants into the DL238 background and vice versa.
Figure 3: Genomic variation in hphd-1 causes 3HP and 3HP-AA accumulation in DL238.

a, DL238 harbors two single nucleotide variants in hphd-1, resulting in amino acid substitutions K172M and L268P. Sequence logos of amino acid conservation proximal to the missense mutations shown for nematode HPHD-1 and its vertebrate ortholog, ADHFE1. Logo colors: acidic (red), basic (blue), hydrophobic (black), neutral (purple), and polar (green). b, Quantification of 3HP from exo- and endo-metabolome extracts of N2, DL238, and CRISPR-Cas9-edited HPHD-1 strains. Data represent four biologically independent experiments and bars indicate mean ± s.d. c, Quantification of 3HP-AAs from exo-metabolome extracts of indicated strains. Data represent four biologically independent experiments and bars indicate mean ± s.d. d, Relative abundance of N-propionyl-AAs in endo-metabolomes of indicated strains. Data represent four biologically independent experiments and bars indicate mean ± s.d. e, Conceptual model of flux through the propionate shunt in N2, DL238, and CRISPR-Cas9-edited HPHD-1 strains. Thickness of arrows represents relative flux through enzymatic reactions, with green and red arrows representing higher and lower flux relative to N2, respectively. f, Representative images and g, body length quantification of N2, DL238, and CRISPR-Cas9-edited HPHD-1 strains after 72 hours on normal medium (vehicle) or on medium containing 100 mM ethyl-3HP (see Methods). Scale bar, 2 mm. Data represent two biologically independent experiments of 50–150 animals per experiment; the total number of animals measured is indicated above the x-axis. Horizontal line indicates mean ± s.d. **** p < .0001, as calculated by Welch’s ANOVA with post hoc comparison using Games-Howell’s multiple comparisons test. ns, not significant. Source data are provided as a Source Data file. For b, c, and d: p-values calculated by unpaired, two-sided t-test with Welch correction in which edited strains were compared against the corresponding parental strains (b, c) or against the N2 strain (d). ns, not significant
Targeted analysis of the metabolomes of N2, DL238, and two independent strains for each edit (except for N2L268P) revealed that 3HP and 3HP-AAs were sharply reduced in both the exo- and endo-metabolome of DL238P268L animals relative to DL238 (Fig. 3b, 3c, 3d, Extended Data Fig. 9). Furthermore, 3HP and 3HP-AAs were strongly increased in N2L268P animals, similar to levels observed in DL238 (Fig. 3b, 3c, Extended Data Fig. 9). 3HP and 3HP-AAs in N2K172M strains were unchanged relative to N2 but were approximately two-fold reduced in DL238M172K as compared to DL238, suggesting that this variant may contribute to the observed phenotype in DL238 but is latent in the N2 genetic context (Fig. 3b, 3c, and Extended Data Fig. 9). These results indicate that the HPHD-1 L268P variant in DL238 is a reduction-of-function allele primarily responsible for the increased abundance of 3HP and 3HP-AAs in this strain. In contrast, abundances of N-propionyl-AAs in DL238 and edited DL238 animals were above levels observed for N2 or edited N2 animals (Fig. 3d, Extended Data Fig. 10). The finding that propionate is directed to N-propionyl-AAs in DL238 animals independent of the HPHD-1 edits indicates that propionate metabolism in DL238 exhibits additional differences compared to N2 (Fig. 3e). In fact, diversion of propionate via increased formation of N-propionyl-AAs could explain that levels of 3HP and 3HP-AAs in DL238P268L exo-metabolome are reduced even below those in N2 animals (Fig. 3b, 3c, Extended Data Fig. 9).
The conjugation of 3HP to AAs and the excretion of both 3HP and 3HP-AAs suggested that 3HP may be toxic at high levels. Indeed, we found that exposure to exogenous 3HP strongly delayed development of DL238 animals, whereas N2 animals were less affected (Fig. 3f, 3g). Notably, introducing the L268P variant into HPHD-1 in N2 animals delayed development to a similar extent as in DL238, whereas reverting this amino acid from P to L in DL238 mitigated the developmental delay caused by 3HP exposure (Fig. 3g). These results demonstrate that a single amino acid substitution underlies the physiological response to excess 3HP.
Finally, we asked if other wild strains harbor the L268P variant in HPHD-1 and whether such animals also exhibit elevated levels of 3HP and 3HP-AAs. In addition to DL238, nine strains harbor both the K172M and L268P variants, representing ~2% of the 540 curated wild strains currently in the CeNDR database27. All of these strains, including DL238, were collected from the Big Island of Hawaii, USA, near the Manuka State Wayside Park (Fig. 4a). Analysis of genetic similarity among the Manuka cohort revealed that these strains are more genetically related to DL238 than DL238 is to N2, but that they do not share as many common SNVs as N2 and BRC20067 (Fig. 4a). Despite their geographical proximity and shared hphd-1 alleles, these strains harbor many independent SNVs, including a missense variant in ECH-6 (A12S) unique to DL238. There are no other known missense variants in any genes in the propionate shunt or canonical propionate metabolic pathway in the Manuka cohort (Supplementary Table 11).
Figure 4: Natural variation in hphd-1 and propionate shunt gene expression.

a, Similarity matrix depicting genetic relatedness of C. elegans strains in this study. Pairwise similarities were calculated based on 2,604,844 bi-allelic single nucleotide variants (SNVs), see Methods for details. All strains that harbor the HPHD-1 variant were isolated near Manuka State Wayside Park, Hawaii, USA (red dot). b, Quantification of 3HP and c, 3HP-Val, -Ile, and -Leu from endo-metabolome extracts of N2, DL238, and eight additional wild strains harboring the DL238 HPHD-1 variant. Bars indicate mean ± s.d. d, Relative abundance of N-propionyl-Val, -Ile, and -Leu in endo-metabolome extracts, bars indicate mean ± s.d. e, Propionate shunt gene expression. Data represent six biologically independent experiments and bars indicate mean ± s.d. **** adjusted p < .0001, as calculated using the Wald test and corrected for multiple comparisons using the Benjamini-Hochberg method. f, The iCEL1314 metabolic network model is based on enzymes and metabolites identified in the N2 strain. Expansion of the model to accommodate strain-specific differences will better represent the species (pan-iCELv1.0). Source data are provided as a Source Data file. For b, c, and d: p-values calculated by unpaired, two-sided t-test with Welch correction in which all strains were compared to the N2 strain. Exact n for each strain is presented in Supplementary Table 12. ns, not significant
We grew additional cultures of eight wild strains harboring the HPHD-1 variant in parallel with N2 and DL238 and found that both 3HP and 3HP-AAs were enriched in the exo- and endo-metabolomes of all tested natural strains that harbor the DL238 HPHD-1 variant (Figure 4b, 4c, Extended Data Fig. 11). These findings reinforce the notion that DL238 and other natural strains harboring the HPHD-1 variant are adapted to low flux through the reaction catalyzed by HPHD-1 by increasing biosynthesis of 3HP-AAs. In addition, N-propionyl-AAs were enriched in six of the eight tested wild strains relative to N2 (Figure 4d, Extended Data Fig. 12), supporting a model in which AA conjugation serves to divert propionate and illustrating different mechanisms of propionate metabolism in wild strains.
Towards a pan-species metabolic model
Using the exact same samples that were used for the initial metabolomic analyses, we found that three propionate shunt genes, hach-1, hphd-1 and alh-8 are significantly upregulated in DL238 (Fig. 4e). This result suggests that this strain responds to reduced flux in the reaction catalyzed by HPHD-1 in two ways: first, it converts 3HP into 3HP-AAs, and second, it increases expression of hphd-1 and the two adjacent enzymes (hach-1 and alh-8) in the pathway. The latter has important implications about the interpretation of gene expression data from different strains. Increased expression of hach-1, hphd-1, and alh-8 would normally indicate higher degradation flux capacity for 3HP, for example when different tissues are compared within the same strain12. However, when comparing different strains, higher expression levels may actually reflect compensation for reduction-of-function variants, thus challenging conventional assumptions about the relationship between flux modeling and gene expression28.
The iCEL1314 model is based on the N2 reference strain11,12, and the work presented here affirms that large numbers of novel metabolites can be discovered in wild strains29–31. We postulate that 3HP- and N-propionyl-AAs result from conjugation between 3HP or propionate (or their corresponding coenzyme A (CoA) derivatives) and the relevant AAs, similar to the conjugation between lactate and AAs21. We added reactions to the iCEL1314 model that combine 3HP or propionate (or their CoA derivatives) with AAs to form conjugates, including transport and exchange reactions (Fig. 4f). These additions represent a first step toward a pan-iCEL model that captures metabolism of the entire species; we envision the model to grow as metabolomes for more strains become available and metabolites are identified and characterized.
Discussion
We introduce the nematode C. elegans as a tractable model to connect inter-individual variation in metabolism to genomic variation. Our analysis, despite initially being limited to four ‘individuals,’ revealed a large number of compounds specifically enriched or depleted in one strain relative to the others. Combining comparative metabolomics with genomics, we connected increased production of a novel class of compounds to a single amino acid change in a central metabolism enzyme, HPHD-1. Moreover, the HPHD-1 L268P edit in the N2 strain confers sensitivity to exogenous 3HP, whereas the converse P268L edit confers increased resistance in the DL238 strain. These findings expand our understanding of the metabolism of propionate, a ubiquitous short chain fatty acid abundantly produced in both eukaryotes and bacteria, including species found in the human gut32. Because Val and Ile produce propionyl-CoA when metabolized, production of 3HP-Val and 3HP-Ile may represent a mechanism to simultaneously prevent accumulation of shunt intermediates and reduce catabolic production of propionate. The biosynthesis of N-propionyl-AAs, although not linked to variation in hphd-1, likewise reduces flux through the propionate shunt. It seems plausible that the latter contributes to the detoxification of excess propionate, in addition to genetic variation in glct-333.
3HP-AAs are derived from 3HP (or 3HP-CoA), which accumulates under conditions of low flux through the vitamin B12-dependent propionate degradation pathway. Given that vitamin B12 is produced by only a small subset of bacteria and archaea34, our findings suggest that 3HP-AA production may represent a metabolic adaptation to changing nutrient conditions. Notably, a substantial portion of abnormal metabolic profiles observed in newborn screening can be attributed to maternal vitamin B12 deficiency, rather than inborn genetic mutations35. Further studies with different diets and an increased cohort of C. elegans strains will help to contextualize strain-specific metabolites, expand the pan-iCEL metabolic network, and develop individualized metabolic network models.
METHODS
C. elegans strains
N2 (Bristol) and wild strains BRC20067, CB4856, DL238, ECA1269, ECA1288, ECA1807, ECA1937, ECA1939, ECA2377, ECA732, and ECA733 were maintained at 20 °C using E. coli HB101 and grown on modified nematode growth medium containing 1% agar and 0.7% agarose (NGMA) to prevent animals from burrowing37. Strains were obtained from the C. elegans Natural Diversity Resource (CeNDR) and are available upon request. hphd-1(ok3580) was obtained from the C. elegans Gene Knockout Consortium and was backcrossed as described38. The CRISPR-Cas9 HPHD-1-edited strain ECA2545 hphd-1(ean779) N2L268P was generated by standard protocol39. The CRISPR-Cas9 HPHD-1-edited strains PHX2627 hphd-1(syb2627) N2K172M, PHX2628 hphd-1(syb2628) N2K172M, PHX2640 hphd-1(syb2640) DL238M172K, PHX2666 hphd-1(syb2666) DL238P268L, PHX2667 hphd-1(syb2667) DL238P268L, and PHX2757 hphd-1(syb2757) DL238M172K were purchased from SunyBiotech.
Genetic variants
Genotype data for the wild C. elegans strains along with the laboratory-adapted strain N2 were acquired from the variant call format (VCF) file (Release 20200815) from CeNDR40. Pairwise dissimilarity analysis was performed among the C. elegans strains, using 2,604,844 biallelic SNVs from the VCF file and the R package SNPRelate (v1.16.0)41.
NCBI protein basic local alignment search tool (BLAST) was used to generate multiple sequence alignments for hydroxyacid-oxoacid transhydrogenase in 100 vertebrates (based on similarity to human ADHFE1) and in 56 available non-C. elegans nematodes (based on similarity to C. elegans HPHD-1) (Fig. 3A). Accession numbers for all sequences provided in Supplementary Table 13. Sequence logos were created in R (version 4.1.1) using the ggseqlogo package (version 0.1).
Growth of C. elegans strains
Synchronized animals at the first larval stage (L1) were prepared by two different methods: settling and bleaching. For bleaching, animals were synchronized at the L1 stage by starvation. L1 animals were transferred to twenty modified nematode growth media (NGMA) plates37 seeded with E. coli HB101. After incubation for 72 h at 20 °C, gravid adult animals were bleached using C. elegans bleaching solution (40 mL NaOCl (Fisher, SS290-1), 10 mL of 10 N NaOH, 300 mL H2O). For settling, starved L1 animals were cultured for 96 h at 20 °C until all food was depleted. Plates were rinsed with 2 mL M9 buffer (22 mM KH2PO4, 42 mM Na2HPO4, 86 mM NaCl, 1 mM MgSO4, 1 L H2O) per plate and transferred to 50 mL conical tubes. Tubes were left for 10 minutes at room temperature, after which all non-L1 stages settled at the bottom of the tube. The top 13 mL, containing L1 animals, was transferred to a new 15 mL conical tube and settled again for 10 minutes at room temperature to pellet all non-L1 stages. After this second settling, L1 animals were harvested by transferring 10 mL and washed two times with 12 mL M9 buffer and pelleted at 2,000 rpm in a tabletop centrifuge for one minute.
To generate the samples for metabolomics and transcriptomics, approximately 100,000 L1 animals were placed in a 125 mL Erlenmeyer flask filled with 25 mL K medium with modified salt concentrations (51 mM NaCl, 32 mM KCl, 3 mM CaCl2, 3 mM MgSO4), 1.25 μL/mL cholesterol, 50 μg/mL kanamycin, 10 mg/mL HB101 bacterial lysate (Pennsylvania State University Shared Fermentation Facility)42,43. Animals were cultured at 20 °C with 180 rpm orbital shaking in a shaking incubator (Multitron standard, INFORS HT) until they reached the young adult stage. Animals and culture medium were separated by 2,000 rpm centrifugation for one minute. Images were taken of each sample. Approximately 20 mL of culture medium was immediately frozen in liquid nitrogen and stored at −80 °C for LC-MS and GC-MS analyses. Separated animals were washed three time with M9 buffer. After the third wash, animals were pelleted by centrifugation and aspiration of M9 buffer and divided into sets of ~90,000 animals for metabolomics and 10,000 animals for RNA-seq analysis.
Due to bacterial powder supply issues, subsequent experiments were performed with live E. coli HB101, unless otherwise indicated. Live HB101 was independently extracted and analyzed in parallel for each experiment (See Extended Data Fig. 9–12). For experiments with CRISPR-edited strains, approximately 50,000 animals were grown in a 50 mL Erlenmeyer flask filled with 10 mL modified K medium and live E. coli HB101 from a 100 mL overnight culture. For experiments with additional wild strains, approximately 20,000 animals were grown in a 50 mL Erlenmeyer flask filled with 10 mL modified K medium and live E. coli HB101 from a 100 mL overnight culture. For experiments with vitamin B12 supplement, approximately 40,000 animals were grown in a 50 mL Erlenmeyer flask filled with 20 mL modified K medium and live E. coli OP50 or OP50 supplemented with 64 nM vitamin B12 (as adenosyl cobalamin, Sigma Aldrich cat#C0884). Culture medium and animals were isolated separately as described and samples were immediately frozen in liquid nitrogen and stored at −80 °C.
Targeted quantification of metabolites using GC-MS
Animal endo- and exo-metabolome extracts were dried under vacuum. Derivatization of dried samples was performed first with 20 μL of 20 mg/mL methoxyamine hydrochloride (Sigma-Aldrich) in pyridine at 37 °C for 90 min, followed by the addition of 50 μL N-methyl-N-(trimethylsilyl) trifluoroacetamide (Sigma-Aldrich) and incubation for 3 h at 37 °C. The derivatization reaction was completed by incubation for 5 h at room temperature. Measurements were performed on an Agilent 7890B single quadrupole mass spectrometry coupled to an Agilent 5977B gas chromatograph coupled (GC-MS) with an HP-5MS Ultra Inert capillary column (30 m × 0.25 mm × 0.25 μm). Helium was used as carrier gas at flow rate of 1 mL/min (constant flow). The temperatures were set as follows: inlet at 230 °C, the transfer line at 280 °C, the MS source at 230 °C and quadrupole at 150 °C. 1 μl of sample was injected in a split mode with 5 mL/min split flow. Initial oven temperature was set to 80 °C and then increased to 310 °C at a rate of 5 °C/min. MS parameters were: 3 scans/s with 30–500 m/z range, electron impact ionization energy 70 eV. Each metabolite was identified based on retention time as well as one quantifier and two qualifier ions that were manually selected using a reference compound. Peak integration and quantification of peak areas were done using MassHunter software (Agilent v10.1); blank subtraction and normalization to total quantified metabolites were done using R software.
Sample preparation for HPLC-MS
Animal bodies (endo-metabolome) and conditioned media (exo-metabolome) were frozen and processed separately. For preparation of endo-metabolome extracts, synchronized adult C. elegans were lyophilized for 18–24 h using a VirTis BenchTop 4K Freeze Dryer. Dried pellets were transferred to 1.5 mL microfuge tubes and dry pellet weight recorded. Pellets were disrupted in a Spex 1600 MiniG tissue grinder after the addition of three stainless steel grinding balls to each sample. Microfuge tubes were placed in a Cryoblock (Model 1660) cooled in liquid nitrogen, and samples were disrupted at 1100 RPM for six cycles of 30 s, with cooling in between. Pellets were transferred to 20 mL glass vials in 15 mL 100% ethanol and stirred overnight. Glass vials were centrifuged at 2750 RCF for five minutes in an Eppendorf 5702 Centrifuge using rotor F-35-30-17. The resulting supernatant was transferred to a clean 20 mL glass vial and concentrated to dryness in an SC250EXP Speedvac Concentrator coupled to an RVT5105 Refrigerated Vapor Trap (Thermo Scientific). The resulting powder was suspended in 100% ethanol and analyzed directly by HPLC-MS, see below. For preparation of exo-metabolome extracts, frozen conditioned media was lyophilized ~48 h using a VirTis BenchTop 4K Freeze Dryer. Dried material was directly extracted in 15 mL 100% ethanol after transfer to 20 mL glass vials. Subsequent steps for concentration and suspension were followed as described for preparation of the endo-metabolome samples. For CRISPR-edited samples, extractions were performed as described except that methanol was used instead of ethanol.
HPLC-MS/MS analysis
Reversed-phase chromatography was performed using a Vanquish HPLC system controlled by Chromeleon Software (ThermoFisher Scientific) and coupled to an Orbitrap Q-Exactive HF mass spectrometer controlled by Xcalibur software (ThermoFisher Scientific), or by a Dionex Ultimate 3000 HPLC system coupled to an Oribtrap Q-Exactive mass spectrometer controlled by the same software. Extracts prepared as described above were separated on an Agilent Zorbax Eclipse XDB-C18 column (150 mm × 2.1 mm, particle size 1.8 μm), or on a Thermo Scientific Hypersil Gold column (150 mm × 2.1 mm, particle size 1.9 μm) maintained at 40 °C with a flow rate of 0.5 mL/min. Solvent A: 0.1% formic acid in water; solvent B: 0.1% formic acid in acetonitrile. A/B gradient started at 1% B for 3 min after injection and increased linearly to 98% B at 20 min, followed by 5 min at 98% B, then back to 1% B over 0.1 min and finally held at 1% B for an additional 2.9 min to re-equilibrate the column.
Reversed-phase post-column ion-pairing chromatography was performed using the same system as described; extracts were separated on an Agilent Zorbax Eclipse XDB-C18 column (150 mm × 2.1 mm, particle size 1.8 μm) maintained at 40 °C with a flow rate of 0.5 mL/min. Solvent A: 0.1% ammonium acetate in water; solvent B: acetonitrile. A/B gradient started at 5% B for 3 min after injection and increased linearly to 98% B at 20 min, followed by 5 min at 98% B, then back to 5% B over 0.1 min and finally held at 5% B for an additional 2.9 min to re-equilibrate the column. A second pump (Dionex 3000) controlling a solution of 800 mM ammonia in methanol was run at a constant flow rate of 0.015 mL/min for the duration of the method and mixed via micro-splitter valve (Idex #P-460S) with the eluate line from the column.
Normal-phase chromatography was performed using the same system as described; extracts were separated on an Agilent Zorbax RRHD HILIC Plus column (150 mm × 2.1 mm, particle size 1.8 μm) maintained at 40 °C with a flow rate of 0.5 mL/min. Solvent A: 0.1% formic acid in water; solvent B: 0.1% formic acid in acetonitrile. A/B gradient started at 90% B for 3 min after injection and decreased linearly to 50% B at 15 min, followed by a linear decrease to 10% B at 16 min, held at 10% B until 19 min, followed by a linear increase to 90% B at 20 min, and finally held at 90% B for an additional 5 min to re-equilibrate the column.
Mass spectrometer parameters: spray voltage (−3.0 kV, +3.5 kV), capillary temperature 380 °C, probe heater temperature 400 °C; sheath, auxiliary, and sweep gas 60, 20, and 2 AU, respectively. S-Lens RF level: 50, resolution 240,000 at m/z 200, AGC target 3E6. Each sample was analyzed in negative and positive electrospray ionization modes with m/z ranges 70–1000 for reversed-phase, 120–800 for reversed-phase post-column ion pairing, and 70–700 for normal-phase. Parameters for MS/MS (dd-MS2): MS1 resolution: 60,000, AGC Target: 1E6. MS/MS resolution: 30,000, AGC Target: 2E5, maximum injection time: 50 ms, isolation window 1.0 m/z, stepped normalized collision energy (NCE) 10, 30; dynamic exclusion: 5 seconds, top 10 masses selected for MS/MS per scan.
LC-MS RAW data were converted to mzXML file format using MSConvert (v3.0, ProteoWizard) and were analyzed using Metaboseek software v0.9.9.1 (see below) and normalized to the abundance of ascr#3 as an approximate measure of sample size for replicates from the same strain. To account for possible variation between strains, metabolites were normalized as a ratio to ascr#3, and the resulting quotient multiplied by the strain average of ascr#3 (performed independently for endo- and exo-metabolome), thereby removing the impact of variation between strains. Quantification was performed with Metaboseek software or via integration using Xcalibur QualBrowser v4.1.31.9 (Thermo Scientific) using a 5 ppm window around the m/z of interest. For volcano plots in Fig. 1b, exo-metabolome in negative ionization mode is depicted as a representative dataset. The list of features identified by peak picking in XCMS (including degenerate features such as adducts and isotopes) was culled by retention time (180 – 1400 seconds) and further filtered by using the “Peak Shapes” functionality to calculate peak quality scores, applying a threshold of 0.96. The resulting feature list of 50,203 features was analyzed by built-in ANOVA using Metaboseek software, then adjusted for significance by the Benjamini-Hochberg method using false discovery rates of 15% or 5%, as indicated44. Each natural strain was profiled against the N2 strain, and the log2(fold-change) was plotted against the negative logarithm of the unadjusted p-value, as calculated by unpaired, two-sided t-test modeled as six independent experiments. Statistical analysis for metabolomics was performed with Metaboseek software (v0.9.9.1) and with GraphPad Prism (v9.3.0).
Metabolomics network analysis
MS/MS networking was performed using Metaboseek MS analysis software (doi: 10.5281/zenodo.3360087). Documentation and source code are available in the Metaboseek R package on GitHub: https://github.com/mjhelf/metaboseek. For additional information, installation instructions and a user guide, please visit https://metaboseek.com45. The XCMS package within Metaboseek was used with “Metaboseek_default” settings, with the exception that the RT width parameter was adjusted to 3 seconds. MS/MS matching used the following parameters: ppm window: 3, RT window: 5 seconds, unique assignments on. From roughly 200,000 features detected in negative-ion ESI HPLC-MS, approximately 10,000 features were matched to MS/MS spectra, which was further culled to 4,563 features by restricting the retention time window from 180 – 1350 s and using the “Peak Shapes” functionality to apply a peak quality threshold of 0.98. Networking was performed using the Compare MS/MS function in Metaboseek with the following parameters: m/z tolerance: 0.002, ppm tolerance: 3, minimum number of peaks in common: 3, noise level: 2%, with parent mass matching turned on. The network was modified by removing edges below similarity score (cosine) = 0.6, and further simplified by restricting the maximum number of edges per node to the top eight ranked by similarity score.
Based on our comparative analysis of relative feature abundance in wild isolates and N2 (Supplementary Table 9), we identified subnetworks of potential interest. Detailed analysis of the MS/MS spectra (see Data Availability statement) of these subnetworks revealed that they represent metabolites from diverse pathways, including a variety of fatty acid derivatives and other lipids, known and putative ascarosides, modular glucosides including the putative iglu#93 (Extended Data Fig. 2), as well as the 3HP-AAs. The latter were selected for detailed additional studies as described.
Isotopic labeling experiments
Approximately 60,000 synchronized N2 (WT) or hphd-1(ok3580) L1 larvae were seeded in 125 mL Erlenmeyer flasks containing 20 mL S-Complete medium. Worms were fed with 3 mg/mL freeze-dried OP50 powder (InVivoBiosystems, formerly NemaMetrix Inc., cat. #OP-50-31772) and supplemented with either L-leucine (Sigma-Aldrich cat. #L8000), 13C6-L-leucine (Cambridge Isotope Laboratories cat. #CLM-2262-H-PK), L-valine (Sigma-Aldrich cat. #V0500), or 13C5-L-valine (Cambridge Isotope Laboratories cat. #CLM-2249-H-PK) at a final concentration of 2 mM. Worms were incubated at 20 °C with shaking at 180 RPM for approx. 70 h, at which time the population was a mixture of young and gravid adults, determined by microscopic inspection. Liquid cultures were centrifuged (500 × g, 22 °C, 1 min), and the resulting supernatant was snap frozen. Worm pellet was washed three times with M9 before snap freezing in liquid nitrogen. Samples were prepared for HPLC-MS analysis as described.
3HP toxicity assays
Animals were maintained on modified NGM plates containing soy peptone (to limit residual vitamin B12 present in the peptone)46 and fed E. coli OP50. We employed the ethyl ester of 3HP (ethyl-3HP) to improve uptake (Combi-Blocks, cat# ST-8598). Ethyl-3HP was diluted in water to achieve a final concentration of 400 mM followed by pH adjustment to ~6.5 with sodium hydroxide to yield an ethyl-3HP stock solution, which was further diluted into molten NGM to the desired concentration. Synchronized L1 larvae obtained by alkaline bleach egg prep (see above) were grown on control plates or plates containing 100 mM ethyl-3HP at 20°C. After approximately 72 h, animals were washed off the plates and anesthetized in a 1 mM solution of levamisole (TCI cat#T1215), then photographed using an Invitrogen EVOS FL imaging system. Body length was used as a proxy for developmental stage47; animals subjected to high concentrations of 3HP did eventually reach adulthood during continued surveillance. Body length was measured using a custom script (wormFinder_v2.m) written on MATLAB (MathWorks, version R2020a)47 and available at: https://github.com/shiaway/wormFinder.
RNA-seq and data processing
Total RNA extraction and RNA-seq library construction were performed for the 24 samples simultaneously as previously described48. All 24 RNA-seq libraries were pooled and sequenced on a single lane of an Illumina NovaSeq 6000 platform, yielding 150-bp paired-end (PE150) reads. On average, we obtained 34.3 million reads per sample, with a range of 25 to 45.5 million reads. Adapter sequences and low-quality reads in raw sequencing data were removed using fastp (v0.20.0)49. Transcript expression of each sample was quantified using the SNV-substituted transcriptome of each strain and Kallisto (v0.44.0)50 with 100 bootstraps per sample. The R package tximport (v1.10.1)51 was used to summarize transcript-level abundances into gene-level abundances. We set a threshold of a minimal total count of 120 for each gene across the 12 samples in each pairwise comparison. We used the DESeq() function in the R package DESeq2 (v1.22.2)52 to normalize expression counts and perform pairwise differential expression analysis among the four strains with the default Wald test and the Benjamini-Hochberg multiple testing correction. Thresholds of DEGs were set as a fold change of >1.5 fold for biological significance and a q-value < 0.05 for statistical significance. We used the R package sleuth (v0.30.0)53 to normalize TPM across all samples.
Chemical synthesis
Nuclear Magnetic Resonance (NMR) spectra were recorded on 400 MHz Bruker AVIII HD, 500 MHz Bruker AVIII HD, and 600 MHz Varian INOVA spectrometers at Cornell University’s NMR facility. For reaction schemes, see Supplementary Information Figure 1.
N-(3-O-TBDPS-propionyl)-L-leucine tert butyl ester (2)
To a solution of 3-O-tert-butyldiphenylsilylpropionic acid (3-O-TBDPS-propionic acid, 1, 60 mg, 0.191 mmol, 1.0 equiv.) in 3 mL of dichloromethane (DCM) was added L-leucine tert-butyl ester hydrochloride (43 mg, 0.191 mmol, 1.0 equiv.), 1-ethyl-3-(3′-dimethylaminopropyl)carbodiimide (EDC) hydrochloride (88 mg, 0.461 mmol, 2.4 equiv.), and 4-dimethylaminopyridine (DMAP, 28 mg, 0.229 mmol, 1.2 equiv.). The resulting solution was stirred at room temp. overnight and concentrated in vacuo. Flash column chromatography on silica using a gradient of 0−40% methanol (MeOH) in DCM afforded 2 (85 mg, 89%) as a light yellow, viscous oil. See Supplementary Information Figure 1a for structures.
1H NMR (400 MHz, chloroform-d):
δ 7.74 – 7.60 (m, 4H), 7.47 – 7.34 (m, 6H), 6.75 (d, J = 8.5 Hz, 1H), 4.57 (td, J = 8.7, 5.4 Hz, 1H), 3.93 (t, J = 5.6 Hz, 2H), 2.45 (t, J = 5.6 Hz, 2H), 1.76 – 1.56 (m, 2H), 1.54 – 1.47 (m, 1H), 1.47 (s, 9H), 1.06 (s, 9H), 0.94 (d, J = 7.2 Hz, 3H), 0.92 (d, J = 7.5 Hz, 3H).
N-(3-Hydroxypropionyl)-L-leucine tert-butyl ester (3)
To a solution of 2 (78 mg, 0.157 mmol, 1.0 equiv.) in 2.5 mL of tetrahydrofuran (THF) was added tetra-n-butylammonium fluoride (TBAF, 1M in THF, 0.21 mL, 0.21 mmol, 1.34 equiv.). The resulting solution was stirred at room temp. for 2 h and was then concentrated in vacuo. Flash column chromatography on silica using a gradient of 0−100% MeOH in DCM afforded 3 (37.5 mg, 94%) as a colorless oil. See Supplementary Information Figure 1b for structures.
1H NMR (600 MHz, chloroform-d):
δ 6.19 (d, J = 8.4 Hz, 1H), 4.51 (td, J = 8.4, 5.4 Hz, 1H), 3.87 (t, J = 5.4 Hz, 2H), 2.51 – 2.41 (m, 2H), 1.71 – 1.58 (m, 2H), 1.52 – 1.46 (m, 1H), 1.46 (s, 9H), 0.94 (d, J = 6.5, 6H, overlapping signals).
N-(3-Hydroxypropionyl)-L-leucine (4)
To a solution of 3 (15 mg, 0.058 mmol, 1.0 equiv.) in 0.5 mL of DCM was added trifluoroacetic acid (TFA, 0.35 mL, 4.63 mmol, 80 equiv.). The resulting solution was stirred for 3 h and then concentrated to dryness in vacuo. The crude mixture (12 mg, containing a mixture of product alcohol and its corresponding trifluoroacetic acid ester) was dissolved in 1:1 MeOH:H2O (0.4 mL), K2CO3 (14 mg, 0.108 mmol, 2.7 equiv.) was added, and the resulting mixture was stirred at 40 °C for 1 h. The crude mixture was then concentrated to dryness in vacuo, resuspended in 4:1 DCM:MeOH, and the supernatant was collected. After concentration, a pure sample of 4 (10 mg, 71% over two steps) was obtained as its potassium salt. See Supplementary Information Figure 1c for structures and Supplementary Information Figures 2 and 3 for NMR spectra.
1H NMR (500 MHz, methanol-d4):
δ 4.30 (dd, J = 9.9, 4.4 Hz, 1H), 3.86 – 3.75 (m, 2H), 2.51 – 2.38 (m, 2H), 1.77 – 1.51 (m, 3H), 0.94 (d, J = 6.2 Hz, 3H), 0.93 (d, J = 6.2 Hz, 3H).
13C NMR (126 MHz, methanol-d4):
δ 180.3, 173.6, 59.6, 55.0, 43.1, 40.3, 26.2, 23.8, 22.2.
HRMS (ESI) m/z: [M – H]− calculated for C9H16NO4 [M-H]− 202.10848; found 202.10890.
The retention time and MS/MS spectrum of synthetic 4 were identical to those of one of the features at m/z 202.10848 in C. elegans metabolome.
N-(3-O-TBDPS-propionyl)-L-phenyalanine tert butyl ester (5)
To a solution of 1 (100 mg, 0.305 mmol, 1.0 equiv.) in 2 mL of DCM was added L-phenylalanine tert-butyl ester hydrochloride (78 mg, 0.304 mmol, 1.0 equiv.), EDC hydrochloride (116 mg, 0.608 mmol, 2.0 equiv.), and DMAP (126 mg, 1.04 mmol, 3.4 equiv.). The resulting solution was stirred at room temp. overnight and concentrated in vacuo. Flash column chromatography on silica using a gradient of 0−50% ethyl acetate in hexanes afforded 5 (135 mg, 82%) as a light yellow, viscous oil. See Supplementary Information Figure 1d for structures.
1H NMR (400 MHz, chloroform-d):
δ 7.66 – 7.61 (m, 4H), 7.45 – 7.34 (m, 6H), 7.23 – 7.18 (m, 3H), 7.18 – 7.10 (m, 2H), 6.71 (d, J = 7.6 Hz, 1H), 4.86 – 4.71 (m, 1H), 3.88 (td, J = 6.0, 2.0 Hz, 2H), 3.07 (dd, J = 6.0, 2.0 Hz, 2H), 2.39 (t, J = 5.8 Hz, 2H), 1.37 (s, 9H), 1.01 (s, 9H).
N-(3-Hydroxypropionyl)-L-phenylalanine tert-butyl ester (6)
To a solution of 5 (80 mg, 0.150 mmol, 1.0 equiv.) in 2.5 mL of THF was added TBAF (1M in THF, 0.21 mL, 0.21 mmol, 1.40 equiv.). The resulting solution was stirred at room temp. for 0.5 h and was then concentrated in vacuo. Flash column chromatography on silica using a gradient of 0−40% MeOH in DCM afforded 6 (38.5 mg, 80%) as a colorless oil. See Supplementary Information Figure 1e for structures.
1H NMR (400 MHz, chloroform-d):
δ 7.34 – 7.20 (m, 3H), 7.19 – 7.12 (m, 2H), 6.16 (d, J = 7.9 Hz, 1H), 4.77 (dt, J = 7.9, 6.0 Hz, 2H), 3.85 (q, J = 5.5 Hz, 2H), 3.13 (dd, J = 14.1, 6.3 Hz, 1H), 3.07 (dd, J = 14.1, 6.3 Hz, 1H), 2.86 (t, J = 6.1 Hz, 1H), 2.42 (td, J = 5.2, 2.4 Hz, 2H), 1.42 (s, 9H).
N-(3-Hydroxypropionyl)-L-phenylalanine (7)
To a solution of 6 (15 mg, 0.046 mmol, 1.0 equiv.) in 0.5 mL of DCM was added TFA (0.28 mL, 3.70 mmol, 80 equiv.). The resulting solution was stirred for 3 h and then concentrated to dryness in vacuo. The crude mixture (12 mg, containing product alcohol and its corresponding trifluoroacetic acid ester) was dissolved in 1:1 MeOH:H2O (0.4 mL), K2CO3 (14 mg, 0.108 mmol, 3.0 equiv.) was added, and the resulting mixture was stirred at 40°C for 1 h. The crude mixture was then concentrated to dryness in vacuo, resuspended in 4:1 DCM:MeOH, and a the supernatant was collected. After concentration, a pure sample of 7 (12 mg, 95%) was obtained as its potassium salt. See Supplementary Information Figure 1f for structures and Supplementary Information Figures 4 and 5 for NMR spectra.
1H NMR (500 MHz, methanol-d4):
δ 7.26 – 7.11 (m, 5H), 4.51 (dd, J = 7.8, 4.8 Hz, 1H), 3.77 – 3.66 (m, 2H), 3.22 (dd, J = 13.8, 4.8 Hz, 1H), 2.95 (dd, J = 13.8, 7.8 Hz, 1H), 2.42 – 2.30 (m, 2H).
13C NMR (126 MHz, methanol-d4):
δ 178.3, 173.3, 139.7, 130.6, 129.1, 127.2, 59.5, 57.5, 40.3, 39.3.
HRMS (ESI) m/z: [M – H]− calculated for C12H14O4N [M-H]− 236.09283; found 236.09309. The retention time and MS/MS spectrum of synthetic 8 were identical to those of a feature at m/z 236.09283 in the C. elegans metabolome.
N-Propionyl-L-leucine tert-butyl ester (9)
Propionic acid (8, 74 mg, 1.00 mmol, 1.0 equiv.), L-leucine tert-butyl ester hydrochloride (223 mg, 1.00 mmol, 1.0 equiv.), EDC hydrochloride (382 mg, 2.00 mmol, 2.0 equiv.), and DMAP (414 mg, 3.39 mmol, 3.39 equiv.) were combined in 5 mL DCM. The resulting solution was stirred at room temperature overnight and concentrated in vacuo. Flash column chromatography on silica using a gradient of 0−100% ethyl acetate in hexanes afforded 9 (220 mg, 90%) as a light yellow, viscous oil. See Supplementary Information Figure 1g for structures.
1H NMR (400 MHz, chloroform-d):
δ 5.92 (d, J = 8.2 Hz, 1H), 4.51 (td, J = 8.5, 5.4 Hz, 1H), 2.22 (q, J = 7.6 Hz, 2H), 1.71 – 1.54 (m, 2H), 1.50 – 1.41 (m, 1H), 1.44 (s, 9H), 1.14 (t, J = 7.6 Hz, 3H), 0.92 (d, J = 6.3 Hz, 3H), 0.92 (d, J = 6.5 Hz, 3H).
N-Propionyl-L-leucine (10)
To a solution of 9 (90 mg, 0.37 mmol, 1.0 equiv.) in 4 mL of DCM was added TFA (2.29 mL, 30.0 mmol, 81 equiv.). The resulting solution was stirred for 2 h and then concentrated to dryness in vacuo, affording (10, 69 mg, quantitative). See Supplementary Information Figure 1h for structures and Supplementary Information Figures 6 and 7 for NMR spectra.
1H NMR (500 MHz, chloroform-d):
δ 7.95 – 7.73 (br m, 1H), 6.29 – 6.21 (m, 1H), 4.64 (td, J = 8.4, 4.9 Hz, 1H), 2.36 (q, J = 7.6 Hz, 2H), 1.79 – 1.57 (m, 3H), 1.19 (t, J = 7.6 Hz, 3H), 0.97 (d, J = 6.1 Hz, 3H), 0.95 (d, J = 6.1 Hz, 3H).
13C NMR (126 MHz, chloroform-d):
δ 177.0, 176.6, 51.2, 41.1, 29.5, 25.0, 22.8, 21.9, 9.84.
HRMS (ESI) m/z: [M – H]− calculated for C9H16O3N [M-H]− 186.11357; found 186.11337.
The retention time and MS/MS spectrum of synthetic 11 were identical were identical to those of a feature at m/z 186.11357 in the C. elegans metabolome.
METHODS REFERENCES
Extended Data
Extended Data Figure 1: Genetic relatedness of the four C. elegans strains used in this study and experimental design.

a, Similarity matrix depicting the genetic relatedness of the four C. elegans strains used in this study. Pairwise similarities for strains were calculated based on 2,604,844 biallelic single nucleotide variants (SNVs). See Methods for more details. b, C. elegans populations were synchronized either by bleaching or by settling in three biological replicates each, yielding six independent samples. Freeze-dried E. coli HB101 lysate powder was used as a food source to culture C. elegans. Animals and supernatant were harvested as day 1 adults at the stage of the first egg laid and used for transcriptomic and metabolomic analyses. Created with BioRender.com. c, Photographs of all strains at the time of harvest from each experiment. Scale bar, 250 μM.
Extended Data Figure 2: iglu#93 is an indole glycoside produced by wild strains but not by the N2 reference strain.

a, Quantification of indole glycoside iglu#93 in exo-metabolome extracts of the four strains. Data represent six biologically independent experiments and bars indicate mean ± s.d. p-values calculated by unpaired, two-sided t-test with Welch correction. b, Major fragmentation reactions of m/z 498.1983 (negative ion mode) and resulting fragment ions representing free indole and indole glycoside. Fragmentation is consistent with a deoxy-dimethyl sugar moiety, such as di-O-methylfucose36. c, Proposed structure of iglu#93. Stereochemistry and exact substitution patterns are unknown. Source data are provided as a Source Data file.
Extended Data Figure 3: Homologous series of hydroxy-fatty acids reduced in the N2 strain compared to wild strains.

a,b, Representative HPLC-MS (negative ion) EICs for m/z 213.1496 (a) and m/z 227.1653 (b) in the exo- and endo-metabolomes of the four strains, as indicated. Features highly differential between strains are highlighted with red arrows. Several additional isobaric species detected primarily in the exo-metabolomes do not vary significantly among the four strains. c, Quantification of singly unsaturated (N:1), mono-oxygenated (mN:1) fatty acids ranging from 11 to 15 carbons (m11:1 – m15:1) in exo- and endo-metabolome extracts, as indicated. Data represent six (exo) or five (endo) biologically independent experiments and bars indicate mean ± s.d., p-values calculated by unpaired, two-sided t-test with Welch correction. ns, not significant. Y-axis scaling is maintained across graphs, which are separated for clarity. d, Quantification of singly unsaturated fatty acids (11:1 – 15:1) in endo-metabolome extracts, as indicated. Data represent five biologically independent experiments and bars indicate mean ± s.d., p-values calculated by unpaired, two-sided t-test with Welch correction. ns, not significant. Source data are provided as a Source Data file.
Extended Data Figure 4: Full MS/MS network.

MS/MS network generated from exo-metabolome extracts in negative ionization mode. A simplified version of the boxed region containing 3HP-AA is shown in Fig. 2a. An estimated 70% of nodes represent unique metabolites in this network, culled by standard filtering methods and some additional manual curation, see Methods for more details.
Extended Data Figure 5: 3HP-AAs are more abundant in the exo-metabolome and are 13C3-enriched from 13C5-Val supplementation in hphd-1(ok3580) animals.

a, Quantification of 3HP-AAs in endo- and exo-metabolome extracts of the four strains. Data represent five or six biologically independent experiments for endo- or exo-metabolome quantification, respectively, and bars indicate mean ± s.d., p-values calculated by two-sided, unpaired t-test with Welch correction. ns, not significant. b, Major MS/MS fragmentation (negative ion mode) of 3HP-AAs and resulting fragment ions representing neutral loss of CH2O and free amino acids. Source data are provided as a Source Data file. c, EICs for 202.1085 and 205.1191, corresponding to C9H16NO4− and 13C3-C9H16NO4−, from exo-metabolome extracts of N2 and hphd-1(ok3580). Red dashed lines highlight metabolites with 13C3-enrichment that are also more abundant in hphd-1(ok3580), corresponding to 3HP-Ile and 3HP-Leu. Y-axis for 205.1191 EIC is scaled 40-fold to more clearly show traces for labeled features. Isotopic labeling is highlighted with green shading in the shown compound structures. d, EICs for 236.0928 and 239.1028, corresponding to C12H14NO4− and 13C3-C12H14NO4−, from exo-metabolome extracts of N2 and hphd-1(ok3580), as indicated. Red dashed line on the x-axis highlights metabolite with 13C3-enrichment that is also more abundant in hphd-1(ok3580), corresponding to 3HP-Phe. Y-axis for 239.1028 EIC is scaled 50-fold to more clearly show traces for labeled features. Isotopic labeling is highlighted with green shading in the shown compound structures.
Extended Data Figure 6: 13C6-Leu tracing distinguishes Leu- and Ile-conjugates that share identical MS/MS fragmentation.

a, Schematic of 13C6-Leu isotope tracing experiment. Synchronized N2 and hphd-1(ok3580) animals were supplemented with Leu or 13C6-Leu and analyzed for isotopic enrichment of metabolites of interest. b, EICs (negative ion mode) for m/z 202.1085 and 208.1291, corresponding to C9H16NO4− and 13C6-C9H16NO4−, from exo-metabolome extracts of N2 and hphd-1(ok3580). Red dashed lines highlight metabolites with 13C6-enrichment, corresponding to 3HP- and N-lactoyl Leu conjugates. Y-axis for m/z 208.1291 EIC is scaled 10-fold to more clearly show traces for labeled features. Isotopic labeling is highlighted with green shading in the shown compound structures. c, EIC for m/z 202.1085 (negative ion mode), corresponding to C9H16NO4−, from exo-metabolome extracts of N2 and the three wild strains. d, MS/MS fragmentation for metabolites A-F in (c). Metabolites A and B have near-identical MS/MS spectra, that differ significantly from the near-identical MS/MS spectra of metabolites C, D, E, and F. Based on isotopic labeling and MS/MS fragmentation data, A and B were assigned as 3HP-Ile and 3HP-Leu, respectively. The remaining four metabolites represent diastereomers of N-lactoyl-Ile and -Leu, with the later eluting metabolite of each pair assigned as N-lactoyl-Leu based on isotopic enrichment (see panel b).
Extended Data Figure 7: Isotope tracing experiments aid the identification of N-propionyl-AAs.

a, EICs for m/z 172.0979 and 177.1147, corresponding to C8H14NO3− and 13C5-C8H14NO3−, from exo-metabolome extracts of N2 supplemented with Val or 13C5-Val. Red dashed line highlights metabolite with 13C5-enrichment, corresponding to N-propionyl-Val. EIC Y-axis for m/z 177.1147 is scaled 20-fold to more clearly show traces for labeled features. Isotopic labeling is highlighted by green shading in the structure of N-propionyl-Val. b, EICs for m/z 186.1136 and 192.1337, corresponding to C9H16NO3− and 13C6-C9H16NO3−, from exo-metabolome extracts of N2, supplemented with Leu or 13C6-Leu. Red dashed line highlights metabolite with 13C6-enrichment, corresponding to N-propionyl-Leu. Isotopic labeling is highlighted by green shading in the structure of N-propionyl-Leu. c, Major MS/MS fragmentation (negative ion mode) of N-propionyl-AAs and resulting fragment ions representing different amino acids. d, Quantification of N-propionyl-AAs from endo- and exo-metabolome extracts of the four strains. Data represent five or six biologically independent experiments for the endo- or exo-metabolomes, respectively, and bars indicate mean ± s.d. Y-axis scaling is maintained across graphs. e, Quantification of N-propionyl-AAs in exo-metabolome extracts of N2 and hphd-1(ok3580) animals. Data represent four biologically independent experiments and bars indicate mean ± s.d. f, Quantification of N-propionyl-AAs in exo-metabolome extracts of the DL238 strain fed the standard E. coli OP50 diet without or with supplementation of 64 nM vitamin B12, as indicated. Data represent three biologically independent experiments and bars means ± s.d. For d, e, and f, p-values calculated by two-sided, unpaired t-test with Welch correction. ns, not significant. Source data are provided as a Source Data file.
Extended Data Figure 8: Validation of metabolite assignments by synthesis of 3HP-Leu, 3HP-Phe, and N-propionyl-Leu authentic standards.

a, EIC for m/z 202.1085 (negative ion mode), corresponding to C9H16NO4−, from exo-metabolome extracts of DL238 fed OP50 or DL238 fed OP50 supplemented with 64 nM vitamin B12, as indicated. To extracts of DL238 fed OP50 supplemented with vitamin B12, synthetic 3HP-Leu was added to achieve final concentrations of 25 nM and 75 nM. b, MS/MS spectra (negative ion mode) of natural and synthetic 3HP-Leu with major fragmentation reactions and fragment ions. c, EIC for m/z 236.0928, corresponding to C12H14NO4−, from exo-metabolome extracts of N2, N2 HPHD-1L268P, and synthetic 3HP-Phe. d, MS/MS spectra (negative ion mode) of natural and synthetic 3HP-Phe and major fragmentation reactions. e, EIC for m/z 186.1134, corresponding to C9H16NO3−, from exo-metabolome extracts of N2, N2 HPHD-1L268P, or synthetic N-propionyl-Leu. f, MS/MS spectra (negative ion mode) of natural and synthetic N-propionyl-Leu and major fragmentation reactions.
Extended Data Figure 9: Abundance of 3HP-AAs in hphd-1 edited strains.

Quantification of 3HP-AA conjugates in exo- and endo-metabolome extracts of CRISPR-Cas9 HPHD-1-edited strains, parental strains, and HB101 bacteria only, as indicated. Data represent four biologically independent experiments and bars indicate mean ± s.d. p-values calculated by unpaired, two-sided t-test with Welch correction in which edited strains were compared to the corresponding parental strains. ns, not significant. Source data are provided as a Source Data file.
Extended Data Figure 10: Abundance of N-propionyl-AAs in hphd-1 edited strains.

Quantification of N-propionyl-AA conjugates in exo- and endo-metabolome extracts of CRISPR-Cas9 HPHD-1-edited strains, parental strains, and HB101 bacteria only, as indicated. Data represent four biologically independent experiments and bars indicate mean ± s.d. p-values calculated by unpaired, two-sided t-test with Welch correction in which edited strains were compared to the corresponding parental strains. ns, not significant. N-propionyl-Tyr could not be reliably quantified in the endo-metabolome due to interference from a co-eluting metabolite. Source data are provided as a Source Data file.
Extended Data Figure 11: Abundance of 3HP and 3HP-AAs in wild strains.

a, Quantification of 3HP and b, 3HP-AAs in exo- and endo-metabolome extracts of N2, DL238, additional wild strains and HB101 bacteria only, as indicated. Exact n for each strain is presented in Supplementary Table 12. Bars indicate mean ± s.d. p-values calculated by unpaired, two-sided t-test with Welch correction in which wild strains were compared to N2. ns, not significant. Source data are provided as a Source Data file.
Extended Data Figure 12: Abundance of N-propionyl-AAs in wild strains.

Quantification of N-propionyl-AAs in exo- and endo-metabolome extracts of N2, DL238, additional wild strains and HB101 bacteria only, as indicated. Exact n for each strain is presented in Supplementary Table 12. Bars indicate mean ± s.d. p-values calculated by unpaired, two-sided t-test with Welch correction in which wild strains were compared to N2. ns, not significant. Source data are provided as a Source Data file.
Supplementary Material
ACKNOWLEDGEMENTS
We thank members of the Walhout, Andersen and Schroeder labs, and Dr. Tom Fazzio for discussion and critical reading of the manuscript. This work was supported by a grant from the National Institutes of Health DK115690 to E.C.A., F.C.S., and A.J.M.W.
Footnotes
COMPETING INTEREST DECLARATION
The authors declare no competing interests.
ADDITIONAL INFORMATION
Correspondence and requests for materials should be addressed to A.J.M.W., F.C.S., or E.C.A. Supplementary Information is available for this paper.
DATA AVAILABILITY
The HPLC-MS/MS data generated during this study have been deposited in the MassIVE database under accession code MSV000087810 (https://doi.org/doi:10.25345/C5C244). The raw sequencing reads for these samples are available from the NCBI Sequence Read Archive (Project PRJNA669127). Metabolic network model with the added short chain fatty acid - amino acid conjugation reactions (pan-iCELv1.0) is available for download in SBML and JSON formats at wormflux website (http://wormflux.umassmed.edu/download.php). Genotype data for C. elegans strains were acquired from the variant call format (VCF) file (Release 20200815) available from CeNDR (http://elegansvariation.org). Source data are provided with this paper.
REFERENCES
- 1.Montgomery MK et al. Mouse strain-dependent variation in obesity and glucose homeostasis in response to high-fat feeding. Diabetologia 56, 1129–1139, doi: 10.1007/s00125-013-2846-8 (2013). [DOI] [PubMed] [Google Scholar]
- 2.Braun JM Early-life exposure to EDCs: role in childhood obesity and neurodevelopment. Nat Rev Endocrinol 13, 161–173, doi: 10.1038/nrendo.2016.186 (2017). [DOI] [PMC free article] [PubMed] [Google Scholar]
- 3.Visconti A et al. Interplay between the human gut microbiome and host metabolism. Nat Commun 10, 4505, doi: 10.1038/s41467-019-12476-z (2019). [DOI] [PMC free article] [PubMed] [Google Scholar]
- 4.Loos RJF & Yeo GSH The genetics of obesity: from discovery to biology. Nat Rev Genet 23, 120–133, doi: 10.1038/s41576-021-00414-z (2022). [DOI] [PMC free article] [PubMed] [Google Scholar]
- 5.Watson E et al. Metabolic network rewiring of propionate flux compensates vitamin B12 deficiency in C. elegans. Elife 5, pii: e17670 (2016). [DOI] [PMC free article] [PubMed] [Google Scholar]
- 6.Wilcken B, Wiley V, Hammond J & Carpenter K Screening newborns for inborn errors of metabolism by tandem mass spectrometry. N Engl J Med 348, 2304–2312, doi: 10.1056/NEJMoa025225 (2003). [DOI] [PubMed] [Google Scholar]
- 7.Deodato F, Boenzi S, Santorelli FM & Dionisi-Vici C Methylmalonic and propionic aciduria. Am J Med Genet C Semin Med Genet 142C, 104–112, doi: 10.1002/ajmg.c.30090 (2006). [DOI] [PubMed] [Google Scholar]
- 8.Pillon NJ, Loos RJF, Marshall SM & Zierath JR Metabolic consequences of obesity and type 2 diabetes: Balancing genes and environment for personalized care. Cell 184, 1530–1544, doi: 10.1016/j.cell.2021.02.012 (2021). [DOI] [PMC free article] [PubMed] [Google Scholar]
- 9.Min HY & Lee HY Oncogene-Driven Metabolic Alterations in Cancer. Biomol Ther (Seoul) 26, 45–56, doi: 10.4062/biomolther.2017.211 (2018). [DOI] [PMC free article] [PubMed] [Google Scholar]
- 10.Zhang J, Holdorf AD & Walhout AJ C. elegans and its bacterial diet as a model for systems-level understanding of host-microbiota interactions. Curr Opin Biotechnol 46, 74–80, doi: 10.1016/j.copbio.2017.01.008 (2017). [DOI] [PMC free article] [PubMed] [Google Scholar]
- 11.Yilmaz LS & Walhout AJ A Caenorhabditis elegans genome-scale metabolic network model. Cell Syst 2, 297–311, doi: 10.1016/j.cels.2016.04.012 (2016). [DOI] [PMC free article] [PubMed] [Google Scholar]
- 12.Yilmaz LS et al. Modeling tissue-relevant Caenorhabditis elegans metabolism at network, pathway, reaction, and metabolite levels. Mol Syst Biol 16, e9649, doi: 10.15252/msb.20209649 (2020). [DOI] [PMC free article] [PubMed] [Google Scholar]
- 13.Evans KS, van Wijk MH, McGrath PT, Andersen EC & Sterken MG From QTL to gene: C. elegans facilitates discoveries of the genetic mechanisms underlying natural variation. Trends Genet, doi: 10.1016/j.tig.2021.06.005 (2021). [DOI] [PMC free article] [PubMed] [Google Scholar]
- 14.Nance J & Frokjaer-Jensen C The Caenorhabditis elegans Transgenic Toolbox. Genetics 212, 959–990, doi: 10.1534/genetics.119.301506 (2019). [DOI] [PMC free article] [PubMed] [Google Scholar]
- 15.Lee D et al. Balancing selection maintains hyper-divergent haplotypes in Caenorhabditis elegans. Nat Ecol Evol 5, 794–807, doi: 10.1038/s41559-021-01435-x (2021). [DOI] [PMC free article] [PubMed] [Google Scholar]
- 16.Boyd WA, McBride SJ, Rice JR, Snyder DW & Freedman JH A high-throughput method for assessing chemical toxicity using a Caenorhabditis elegans reproduction assay. Toxicol Appl Pharmacol 245, 153–159, doi: 10.1016/j.taap.2010.02.014 (2010). [DOI] [PMC free article] [PubMed] [Google Scholar]
- 17.Domingo-Almenara X & Siuzdak G Metabolomics Data Processing Using XCMS. Methods Mol Biol 2104, 11–24, doi: 10.1007/978-1-0716-0239-3_2 (2020). [DOI] [PubMed] [Google Scholar]
- 18.Helf MJ, Fox BW, Artyukhin AB, Zhang YK & Schroeder FC Comparative metabolomics with Metaboseek reveals functions of a conserved fat metabolism pathway in C. elegans. Nat Commun 13, 782, doi: 10.1038/s41467-022-28391-9 (2022). [DOI] [PMC free article] [PubMed] [Google Scholar]
- 19.Nguyen DD et al. MS/MS networking guided analysis of molecule and gene cluster families. Proc Natl Acad Sci U S A 110, E2611–2620, doi: 10.1073/pnas.1303471110 (2013). [DOI] [PMC free article] [PubMed] [Google Scholar]
- 20.Nothias LF et al. Feature-based molecular networking in the GNPS analysis environment. Nat Methods 17, 905–908, doi: 10.1038/s41592-020-0933-6 (2020). [DOI] [PMC free article] [PubMed] [Google Scholar]
- 21.Jansen RS et al. N-lactoyl-amino acids are ubiquitous metabolites that originate from CNDP2-mediated reverse proteolysis of lactate and amino acids. Proc Natl Acad Sci U S A 112, 6601–6606, doi: 10.1073/pnas.1424638112 (2015). [DOI] [PMC free article] [PubMed] [Google Scholar]
- 22.Ando T, Rasmussen K, Nyhan WL & Hull D 3-hydroxypropionate: significance of -oxidation of propionate in patients with propionic acidemia and methylmalonic acidemia. Proc Natl Acad Sci U S A 69, 2807–2811 (1972). [DOI] [PMC free article] [PubMed] [Google Scholar]
- 23.Walker MD et al. WormPaths: Caenorhabditis elegans metabolic pathway annotation and visualization. Genetics 219, doi: 10.1093/genetics/iyab089 (2021). [DOI] [PMC free article] [PubMed] [Google Scholar]
- 24.Kay BK, Williamson MP & Sudol M The importance of being proline: the interaction of proline-rich motifs in signaling proteins with their cognate domains. FASEB J 14, 231–241 (2000). [PubMed] [Google Scholar]
- 25.Hinderaker MP & Raines RT An electronic effect on protein structure. Protein Sci 12, 1188–1194, doi: 10.1110/ps.0241903 (2003). [DOI] [PMC free article] [PubMed] [Google Scholar]
- 26.Vanhoof G, Goossens F, De Meester I, Hendriks D & Scharpe S Proline motifs in peptides and their biological processing. FASEB J 9, 736–744 (1995). [PubMed] [Google Scholar]
- 27.Cook DE, Zdraljevic S, Roberts JP & Andersen EC CeNDR, the Caenorhabditis elegans natural diversity resource. Nucleic Acids Res 45, D650–D657, doi: 10.1093/nar/gkw893 (2017). [DOI] [PMC free article] [PubMed] [Google Scholar]
- 28.Machado D & Herrgard M Systematic evaluation of methods for integration of transcriptomic data into constraint-based models of metabolism. PLoS Comput Biol 10, e1003580, doi: 10.1371/journal.pcbi.1003580 (2014). [DOI] [PMC free article] [PubMed] [Google Scholar]
- 29.Falcke JM et al. Linking Genomic and Metabolomic Natural Variation Uncovers Nematode Pheromone Biosynthesis. Cell Chem Biol 25, 787–796 e712, doi: 10.1016/j.chembiol.2018.04.004 (2018). [DOI] [PMC free article] [PubMed] [Google Scholar]
- 30.Keurentjes JJ et al. The genetics of plant metabolism. Nat Genet 38, 842–849, doi: 10.1038/ng1815 (2006). [DOI] [PubMed] [Google Scholar]
- 31.Wen W et al. Metabolome-based genome-wide association study of maize kernel leads to novel biochemical insights. Nat Commun 5, 3438, doi: 10.1038/ncomms4438 (2014). [DOI] [PMC free article] [PubMed] [Google Scholar]
- 32.Reichardt N et al. Phylogenetic distribution of three pathways for propionate production within the human gut microbiota. ISME J 8, 1323–1335, doi: 10.1038/ismej.2014.14 (2014). [DOI] [PMC free article] [PubMed] [Google Scholar]
- 33.Na H, Zdraljevic S, Tanny RE, Walhout AJM & Andersen EC Natural variation in a glucuronosyltransferase modulates propionate sensitivity in a C. elegans propionic acidemia model. PLoS Genet 16, e1008984, doi: 10.1371/journal.pgen.1008984 (2020). [DOI] [PMC free article] [PubMed] [Google Scholar]
- 34.Fang H, Kang J & Zhang D Microbial production of vitamin B12: a review and future perspectives. Microb Cell Fact 16, 15, doi: 10.1186/s12934-017-0631-y (2017). [DOI] [PMC free article] [PubMed] [Google Scholar]
- 35.Scolamiero E et al. Targeted metabolomics in the expanded newborn screening for inborn errors of metabolism. Mol Biosyst 11, 1525–1535, doi: 10.1039/c4mb00729h (2015). [DOI] [PubMed] [Google Scholar]
- 36.Hoki JS et al. Deep Interrogation of Metabolism Using a Pathway-Targeted Click-Chemistry Approach. J Am Chem Soc 142, 18449–18459, doi: 10.1021/jacs.0c06877 (2020). [DOI] [PMC free article] [PubMed] [Google Scholar]
METHODS REFERENCES
- 37.Andersen EC, Bloom JS, Gerke JP & Kruglyak L A variant in the neuropeptide receptor npr-1 is a major determinant of Caenorhabditis elegans growth and physiology. PLoS Genet 10, e1004156, doi: 10.1371/journal.pgen.1004156 (2014). [DOI] [PMC free article] [PubMed] [Google Scholar]
- 38.Watson E et al. Metabolic network rewiring of propionate flux compensates vitamin B12 deficiency in C. elegans. Elife 5, pii: e17670 (2016). [DOI] [PMC free article] [PubMed] [Google Scholar]
- 39.Hahnel SR et al. Extreme allelic heterogeneity at a Caenorhabditis elegans beta-tubulin locus explains natural resistance to benzimidazoles. PLoS Pathog 14, e1007226, doi: 10.1371/journal.ppat.1007226 (2018). [DOI] [PMC free article] [PubMed] [Google Scholar]
- 40.Cook DE, Zdraljevic S, Roberts JP & Andersen EC CeNDR, the Caenorhabditis elegans natural diversity resource. Nucleic Acids Res 45, D650–D657, doi: 10.1093/nar/gkw893 (2017). [DOI] [PMC free article] [PubMed] [Google Scholar]
- 41.Zheng X et al. A high-performance computing toolset for relatedness and principal component analysis of SNP data. Bioinformatics 28, 3326–3328, doi: 10.1093/bioinformatics/bts606 (2012). [DOI] [PMC free article] [PubMed] [Google Scholar]
- 42.Boyd WA, Smith MV & Freedman JH Caenorhabditis elegans as a model in developmental toxicology. Methods Mol Biol 889, 15–24, doi: 10.1007/978-1-61779-867-2_3 (2012). [DOI] [PMC free article] [PubMed] [Google Scholar]
- 43.Lee D et al. Selection and gene flow shape niche-associated variation in pheromone response. Nat Ecol Evol 3, 1455–1463, doi: 10.1038/s41559-019-0982-3 (2019). [DOI] [PMC free article] [PubMed] [Google Scholar]
- 44.Benjamini Y & Hochberg Y Controlling the false discovery rate: a practical and powerful approach to multiple testing. Journal of the Royal Statistical Society Series B 57, 289–300 (1995). [Google Scholar]
- 45.Helf MJ, Fox BW, Artyukhin AB, Zhang YK & Schroeder FC Comparative metabolomics with Metaboseek reveals functions of a conserved fat metabolism pathway in C. elegans. Nat Commun 13, 782, doi: 10.1038/s41467-022-28391-9 (2022). [DOI] [PMC free article] [PubMed] [Google Scholar]
- 46.Giese GE et al. Caenorhabditis elegans methionine/S-adenosylmethionine cycle activity is sensed and adjusted by a nuclear hormone receptor. Elife 9, doi: 10.7554/eLife.60259 (2020). [DOI] [PMC free article] [PubMed] [Google Scholar]
- 47.Zhang J et al. A delicate balance between bacterial iron and reactive oxygen species supports optimal C. elegans development. Cell Host Microbe 26, 400–411 e403, doi: 10.1016/j.chom.2019.07.010 (2019). [DOI] [PMC free article] [PubMed] [Google Scholar]
- 48.Noble LM et al. Selfing is the safest sex for Caenorhabditis tropicalis. Elife 10, doi: 10.7554/eLife.62587 (2021). [DOI] [PMC free article] [PubMed] [Google Scholar]
- 49.Chen S, Zhou Y, Chen Y & Gu J fastp: an ultra-fast all-in-one FASTQ preprocessor. Bioinformatics 34, i884–i890, doi: 10.1093/bioinformatics/bty560 (2018). [DOI] [PMC free article] [PubMed] [Google Scholar]
- 50.Bray NL, Pimentel H, Melsted P & Pachter L Near-optimal probabilistic RNA-seq quantification. Nat Biotechnol 34, 525–527, doi: 10.1038/nbt.3519 (2016). [DOI] [PubMed] [Google Scholar]
- 51.Soneson C, Love MI & Robinson MD Differential analyses for RNA-seq: transcript-level estimates improve gene-level inferences. F1000Res 4, 1521, doi: 10.12688/f1000research.7563.2 (2015). [DOI] [PMC free article] [PubMed] [Google Scholar]
- 52.Love MI, Huber W & Anders S Moderated estimation of fold change and dispersion for RNA-seq data with DESeq2. Genome Biol 15, 550, doi: 10.1186/s13059-014-0550-8 (2014). [DOI] [PMC free article] [PubMed] [Google Scholar]
- 53.Pimentel H, Bray NL, Puente S, Melsted P & Pachter L Differential analysis of RNA-seq incorporating quantification uncertainty. Nat Methods 14, 687–690, doi: 10.1038/nmeth.4324 (2017). [DOI] [PubMed] [Google Scholar]
Associated Data
This section collects any data citations, data availability statements, or supplementary materials included in this article.
Supplementary Materials
Data Availability Statement
The HPLC-MS/MS data generated during this study have been deposited in the MassIVE database under accession code MSV000087810 (https://doi.org/doi:10.25345/C5C244). The raw sequencing reads for these samples are available from the NCBI Sequence Read Archive (Project PRJNA669127). Metabolic network model with the added short chain fatty acid - amino acid conjugation reactions (pan-iCELv1.0) is available for download in SBML and JSON formats at wormflux website (http://wormflux.umassmed.edu/download.php). Genotype data for C. elegans strains were acquired from the variant call format (VCF) file (Release 20200815) available from CeNDR (http://elegansvariation.org). Source data are provided with this paper.