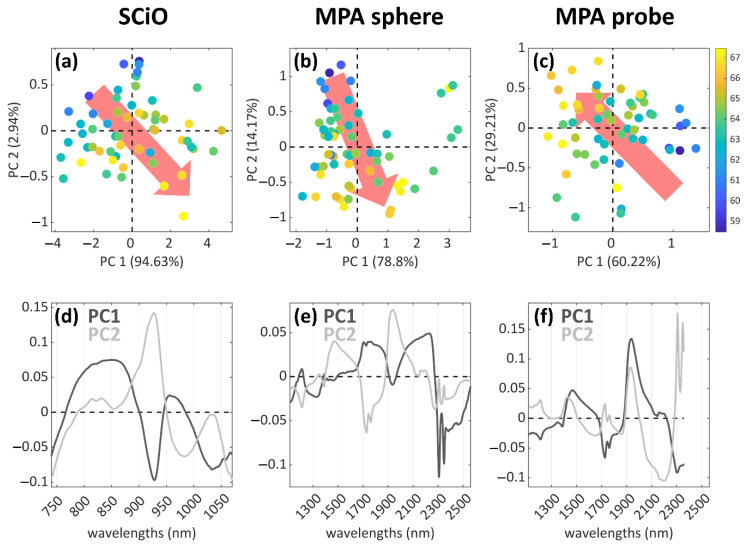
Figure 2.
PCA results for the three analytical techniques of the study. The score plots are shown in the first row (a–c), with the samples coloured according to the lipid content and the content trends highlighted by the red arrows (from low to high). In the second row (d–f) the corresponding loadings plot are reported, showing the variables that are important for each PC reported in (a–c).

