

SUMMARY
While the distant organ environment is known to support metastasis of primary tumors, its metabolic roles in this process remain underdetermined. Here, in breast cancer models, we found lung-resident mesenchymal cells (MCs) accumulating neutral lipids at the pre-metastatic stage. This was partially mediated by interleukin-1β (IL-1β)-induced hypoxia-inducible lipid droplet-associated (HILPDA) that subsequently represses adipose triglyceride lipase (ATGL) activity in lung MCs. MC-specific ablation of the ATGL or HILPDA genes in mice reinforced and reduced lung metastasis of breast cancer, respectively, suggesting a metastasis-promoting effect of lipid-laden MCs. Mechanistically, lipid-laden MCs transported their lipids to tumor cells and natural killer (NK) cells via exosome-like vesicles, leading to heightened tumor cell survival and proliferation, and NK cell dysfunction. Blockage of IL-1β, which was effective singly, improved the efficacy of adoptive NK-cell immunotherapy in mitigating lung metastasis. Collectively, lung MCs metabolically regulate tumor cells and anti-tumor immunity to facilitate breast cancer lung metastasis.
Graphical Abstract

eTOC BLURB
Although distant organ environment is known to support tumor metastasis, its metabolic roles remain underdetermined. Gong et al. identified that inflammation-elicited lipid-laden lung MCs metabolically reprogram tumor cells and NK cells to facilitate breast cancer lung metastasis. Targeting lipid-laden MCs reduced lung metastasis and improved efficacy of NK cell-based immunotherapy.
INTRODUCTION
Approximately 90% of solid cancer-related deaths are due to the metastatic relapse of tumors in distant vital organs 1. Among the multiple steps of metastasis, organ colonization of disseminated tumor cells (DTCs) is an inefficient and rate-limiting step. Only a very low percentage of DTCs evading robust immune surveillance and surviving in a new challenging environment ultimately colonize the distant organs 2. Significant advances in metastasis research have revealed intricate interactions between DTCs and organ niches, which are essential for the development of metastatic lesions. However, such DTC-organ interactions have mainly been studied at the cellular, transcriptional, and protein levels 3, 4. It remains poorly understood whether the organ microenvironment can metabolically regulate DTCs.
Limited evidence supports the concept of metabolic regulation of colonization by organ niches in preclinical cancer models 5, 6, 7, 8. In breast cancer lung metastasis models, pyruvate, which is enriched in the lung interstitial fluid, is taken up by DTCs initiating a metabolic cascade to remodel the extracellular matrix that supports formation of a permissive lung metastatic niche 7, 8. In ovarian cancer models, omental adipocytes provide energy to DTCs via fatty acid oxidation (FAO) or activate survival and proliferation-associated signaling pathways in DTCs to facilitate ovarian cancer metastasis to the omentum 5, 6. These results highlight the emerging roles of the organ environment to metabolically support DTC colonization.
Among the vital organs to which solid tumors tend to metastasize, the lung is one of the most common sites. Within the lung microenvironment, it has been previously shown that neutral lipid accumulation in infiltrated innate immune cells endows them with metastasis-promoting capacities contributing to formation of the pre-metastatic and metastatic niches 9, 10. Here, we identified that lung mesenchymal cells (MCs) exhibited a high level of intracellular triglyceride (TG) content at both naïve and tumor-bearing states. TGs have been studied in a type of lung MCs (lipofibroblasts) which protect alveoli against oxidant injury and supply substrate for lung surfactant synthesis during alveolar development 11, 12. However, the role of lung MC-derived neutral lipids in pathological processes remains largely unknown. Using mouse models of breast cancer, we characterized mechanisms by which lung MCs can, via neutral lipids, metabolically regulate lung metastasis of breast cancer.
RESULTS
Lung MCs accumulate neutral lipids at the pre-metastatic stage
Acquisition of a neutral lipid-laden, metastasis-promoting phenotype has been characterized in lung-infiltrating neutrophils in our previous work 10. To further understand the role of lung microenvironment-derived neutral lipids in modulating metastatic colonization, we compared the intracellular TGs among the major types of cells in the lung. Interestingly, CD140a+ MCs showed higher levels of TGs than other lung cells, at both steady and AT3 tumor-bearing states in mice (Figure 1A). Similarly, human lung MCs also contained abundant TGs, particularly shorter-chained, saturated or monounsaturated TGs (Figure S1A), as analyzed from a published lipidomic dataset 13. In different mouse breast cancer models, an increased level of neutral lipids was detected in lung MCs at their pre-metastatic stage (Figures 1B-1D). Thus, lung MCs start to accumulate neutral lipids before cancer cells colonize the lung.
Figure 1. Lung MCs accumulate neutral lipids at the pre-metastatic stage.

(A) TG content was measured in the indicated lung stromal cells (n=5).
(B) Immunostaining of lung sections showing in situ lipids in CD140a+ MCs. Scale bars, 5 μm.
(C-D) Lipid content in lung MCs from the 4T1 (C) or MMTV-PyMT (D) model was measured (n=6–7). MFI, mean fluorescence intensity.
(E) Workflow depicts isolation of lung CD140a+ MCs for scRNA-seq (left). t-SNE plots show three CD140a+ MC populations (middle), and the percentage of them is shown in pie charts (right).
(F-G) The frequencies (F) and lipid content (G) of three lung MC clusters were measured (n=6).
(H-K) The lipid content was measured in CD140a+ cells from indicated tissues by immunofluorescence (H, J) and flow cytometry (I, K) (n=5). Scale bars, 25 μm. MFP, mammary fat pad.
n represents the number of biological replicates. The results (A-D, F-K) are representative of three independent experiments and shown as mean ± SEM. Statistical significance was determined by two-way ANOVA (A) or unpaired Student’s t-test (C-D, F-G, I, K). *p< 0.05, **p< 0.01, ***p< 0.001, ****p< 0.0001; NS, not significant. See also Figure S1.
To determine whether the primary tumor-elicited lipid profile changes may occur in specific MC subsets, we performed single-cell RNA-sequencing (scRNA-seq) on CD140a+ MCs (Figure 1E, left). Unbiased clustering 14, 15 identified three major MC clusters (Figure 1E, right). According to their signature markers and recently published lung MC scRNA-seq datasets 16, 17, 18, these three clusters resembled adventitial fibroblasts (cluster 0), alveolar fibroblasts (cluster 1), and peribronchial fibroblasts (cluster 2) (Figures S1B and S1C). We further separated these three cell populations (Figure 1F), based on their distinct expression of the surface markers Ly6a and Cd82 (Figure S1D). While primary tumor growth caused a shift of these clusters (Figures 1E and 1F), the neutral lipid elevation (Figure 1G) and enrichment of lipid metabolic pathways (Figure S1E) were comparably detected among the three lung MC subsets. This was further supported by the spatially indistinguishable distribution of lipid-laden MCs across the adventitial, alveolar, and peribronchial spaces, the microanatomical locations where the three identified subsets of MCs reside (Figure S1F). In addition, the tumor-induced neutral lipid accumulation was found in both CD90+ lung MCs, previously characterized as lipofibroblast-enriched cells in mice 19, and in CD90− lung MCs (Figure S1G).
Distinct from lung MCs, CD140a+ MCs present in other examined tissues and organs, including heart, brain, bone, liver and kidney (Figures 1H, 1I and S1H), as well as primary mammary tumors (Figures 1J, 1K and S1I), did not show a prominent elevation of neutral lipids with primary tumor progress in either AT3 or 4T1 model. Altogether, at the pre-metastatic stage, tumor-bearing conditions elicit CD140a+ MCs to accumulate neutral lipids in the lung, which is likely not specific to particular MC subpopulations.
IL-1β induces neutral lipid accumulation in lung MCs
Formation of a lung pre-metastatic niche, triggered by primary tumor- or host-derived factors, is an essential preparation step in solid cancer metastasis 3, 20. We then performed an ex vivo screen of previously reported pre-metastatic niche-regulating factors 3, 10, 20, and found IL-1β to be the most effective one to stimulate neutral lipid accumulation in lung MCs (Figure 2A). In both the AT3 (Figure 2B) and the MMTV-PyMT (Figure S2A) models, IL-1β was indeed detected in the circulation and lung tissues at the pre-metastatic stage.
Figure 2. IL-1β induces neutral lipid accumulation in lung MCs.

(A) Lipid content was measured in ex vivo cultured lung MCs upon stimulation by indicated regulators (n=3).
(B) IL-1β level was measured in indicated samples (n=5). ND, not detected. BALF, bronchoalveolar lavage fluid.
(C) The frequencies (left) and IL-1β production (right) of lung myeloid cells were measured (n=5–6).
(D) Lipid content was measured in ex vivo cultured lung MCs upon IL-1β stimulation (n=3).
(E) Immunofluorescence results showing lipid content in ex vivo cultured lung MCs upon IL-1β stimulation. Scale bars, 8 μm.
(F) As depicted in the schematic (left), the lipid content in lung CD140a+ MCs was determined (n=5). IP, intraperitoneally.
(G) Lipid content was measured in lung CD140a+ MCs from WT or Il1r1−/− mice under naïve or AT3 tumor-bearing condition (n=7).
(H) As depicted in the schematic (left), the lipid content in lung CD140a+ MCs was measured (n=7).
(I-J) Lipid content was measured in human lung MCs upon stimulation by hu IL-1β without or with hu IL-1 receptor antagonist (IL-1RA) by flow cytometry (I) (n=3–4 technical replicates) or immunofluorescence (J). Scale bars, 5 μm.
n represents the number of biological replicates except (I). The results (A-J) are representative of three independent experiments and shown as mean ± SEM. Statistical significance was determined by one-way ANOVA (A, D, G-I) or unpaired Student’s t-test (B-C, F). *p< 0.05, **p< 0.01, ***p< 0.001, ****p< 0.0001; NS, not significant. See also Figure S2.
IL-1β is mainly produced by myeloid cells during an inflammatory process 21, and consistently we identified an increased infiltration of CD11b+ myeloid cells in the lungs of tumor-bearing mice, as well as their elevated production of IL-1β (Figure 2C). Such a tumor-driven myeloid cell infiltration was likely lung tissue-specific (Figure S2B), and the myeloid cell distribution within the lung was not specific to certain microanatomical locations (Figure S2C), which corresponded closely to the tissue-specific and intrapulmonary spatial distribution of lipid-laden MCs (Figures 1H and S1F), suggesting a myeloid cell–IL-1β–lipid-laden MC axis. This notion was further supported by a close proximity of in situ myeloid cells to lung MCs (Figure S2D). Apart from myeloid cells, tumor cells were another source of IL-1β in stimulating lipid storage in lung MCs (Figures S2E-S2G), and furthermore, tumor cell-derived C-C motif chemokine ligand 2 (CCL-2) induced Il1b expression in myeloid cells (Figures S2H-S2J). In response to the burst of IL-1β, a series of genes encoding the downstream signaling molecules of IL-1β were induced in lung MCs in tumor-bearing mice (Figure S2K). Therefore, myeloid cell- and tumor cell-derived IL-1β likely contributes to the lipid profile changes in lung MCs.
We further characterized the role of IL-1β in endowing lung MCs with a lipid-laden phenotype. In vitro, IL-1β stimulated lung MCs to accumulate neutral lipids (Figure 2D), while deficiency of Il1r1 in lung MCs abolished this effect (Figures 2E and S2L). In vivo, direct injection of IL-1β effectively induced neutral lipid elevation in lung MCs (Figure 2F). In the AT3 model, either host Il1r1 deficiency or IL-1β neutralization diminished the lipid-laden phenotype of lung MCs (Figures 2G and 2H), which similarly occurred in the 4T1 model (Figure S2M). Lastly, the IL-1β-elicited lipid accumulation in lung MCs was likely independent of mouse genetic background (Figure S2N), and similarly detected in human lung MCs (Figures 2I and 2J). Collectively, IL-1β was a critical factor associated with breast tumor progression that evoked neutral lipid storage in lung MCs.
A cascade of HIF1A-HILPDA-ATGL in IL-1β-induced lipid accumulation in lung MCs
Among the driving mechanisms of neutral lipid accumulation in mammalian cells, dysregulation of TG lipolysis plays a pivotal role 22, 23, 24, 25, 26. Under tumor-bearing conditions, we indeed found the TG lipolysis in lung MCs was dampened at the pre-metastatic stage (Figures 3A and S3A). Similarly, IL-1β repressed TG lipolysis leading to TG accumulation in lung MCs, which was completely abrogated by deficiency of IL-1R1 (Figure 3B). Thus, failure in TG lipolysis is likely a leading cause of the neutral lipid accumulation in lung MCs driven by IL-1β-IL-1R1 signaling.
Figure 3. A cascade of HIF1A-HILPDA-ATGL in IL-1β-induced lipid accumulation in lung MCs.
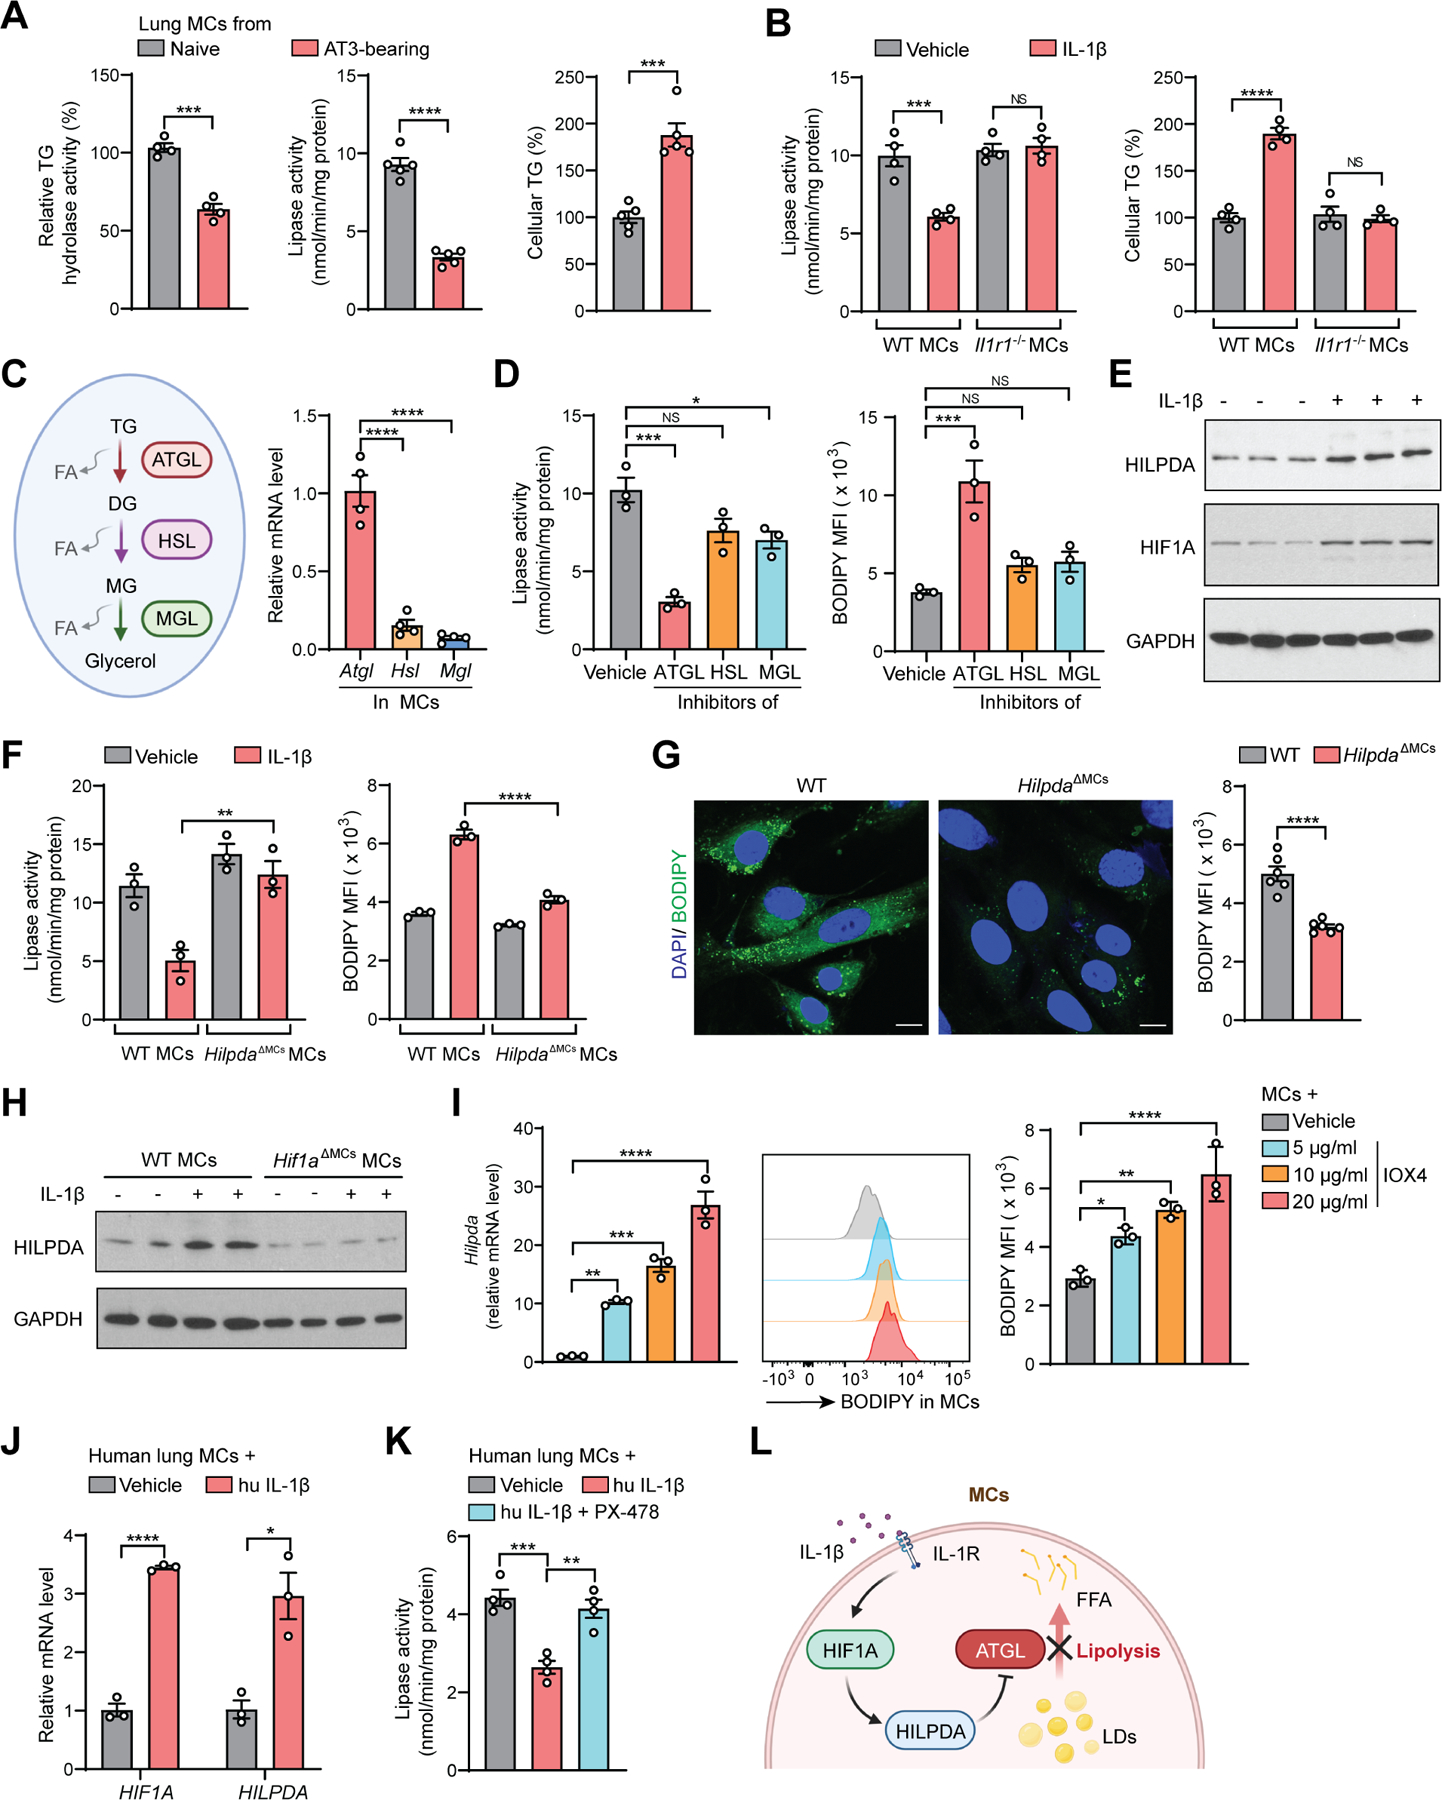
(A) Relative TG hydrolase activity (left), lipase activity (right) and cellular TG content (left) were measured in lung CD140a+ MCs (n=4–5).
(B) Lipase activity (left) and cellular TG content (right) were measured in ex vivo cultured lung MCs upon IL-1β stimulation (n=4).
(C) A schematic description of intracellular lipolysis (left), and the expression of Atgl, Hsl and Mgl was measured in lung CD140a+ MCs (right) (n=4). DG, diglyceride; MG, monoglyceride; FA, fatty acid.
(D) Lipase activity (left) and lipid content (right) were measured in ex vivo cultured lung MCs upon stimulation by indicated inhibitors (n=3).
(E) Western blot showing HILPDA and HIF1A level in ex vivo cultured lung MCs upon IL-1β stimulation (n=3).
(F) Lipase activity (left) and lipid content (right) were measured in ex vivo cultured WT or HilpdaΔMCs lung MCs upon IL-1β stimulation (n=3).
(G) Lipid content in lung CD140a+ MCs from AT3 tumor-bearing WT or HilpdaΔMCs mice was detected by immunofluorescence (left; scale bars, 10 μm) or flow cytometry (right) (n=6).
(H) Western blot showing HILPDA levels in ex vivo cultured WT or HilpdaΔMCs lung MCs upon IL-1β stimulation (n=2).
(I) The Hilpda expression (left) and lipid content (middle and right) were determined in ex vivo cultured lung MCs upon IOX4 stimulation (n=3).
(J) The HIF1A and HILPDA expression was measured in human lung MCs upon hu IL-1β stimulation (n=3 technical replicates).
(K) Lipase activity was measured in human lung MCs upon hu IL-1β stimulation without or with HIF1A inhibitor PX-478 (n=4 technical replicates).
(L) A schematic diagram showing the cascade of HIF1A-HILPDA-ATGL underlying IL-1β-induced lipid storage in lung MCs.
n represents the number of biological replicates except (J-K). The results (A-K) are representative of three independent experiments and shown as mean ± SEM. Statistical significance was determined by unpaired Student’s t-test (A, G, J) or one-way ANOVA (B-D, F, I, K). *p< 0.05, **p< 0.01, ***p< 0.001, ****p< 0.0001; NS, not significant. See also Figure S3.
There are three major enzymes that catalyze TG lipolysis: adipose triglyceride lipase (ATGL), hormone-sensitive lipase (HSL), and monoglyceride lipase (MGL). ATGL is the first and rate limiting step and is closely associated with lipid droplet dynamics 27 (Figure 3C, left). Notably, the gene encoding ATGL (Pnpla2, referred as Atgl herein) was more abundantly expressed (Figure 3C, right) and played a more important role than the other two enzymes in TG lipolysis in lung MCs (Figure 3D). Next, we characterized whether IL-1β and the tumor-bearing conditions could modulate the expression of ATGL or its three known inhibitory molecules–hypoxia-inducible lipid droplet-associated (HILPDA), G0/G1 switch gene 2 (G0S2) and cell death inducing DFFA like effector c (CIDEC) 25, 28. Through RNA-seq screening followed by further validations, we found that IL-1β did not change the Atgl expression (Figure S3B), but upregulated HILPDA at both gene and protein levels (Figures 3E, S3B and S3C). In contrast, the other two ATGL inhibitory factors G0s2 and Cidec were either downregulated by IL-1β or undetected in lung MCs (Figure S3B). To determine whether HILPDA could be a key factor connecting IL-1β to TG accumulation in lung MCs, we generated CD140a+ MC-specific Hilpda-knockout (KO) mice (HilpdaΔMCs). Hilpda KO largely abrogated IL-1β-induced cellular lipolysis inhibition and neutral lipid accumulation in lung MCs (Figure 3F), reduced the level of released TGs from lung MCs upon IL-1β treatment (Figure S3D), and decreased the primary tumor-driven neutral lipid storage in lung MCs (Figure 3G). Together, HILPDA is functionally critical for formation of the lipid-laden lung MCs elicited by IL-1β or tumor progression.
HILPDA is a hypoxia-induced protein to regulate cellular lipid storage 23, 29, 30. Upon IL-1β treatment, there was indeed an induction of hypoxia-inducible factor 1-alpha (HIF1A) in lung MCs (Figures 3E, S3B, and S3C), which was likely not caused by NFκB activation or increased HIF1A protein stability (Figures S3E and S3F), the known mechanisms of HIF1A regulation 31, 32. Deficiency of Hif1a in lung MCs reduced HILPDA expression (Figure 3H), and direct activation of HIF1A by IOX4 33, induced Hilpda expression and lipid accumulation in lung MCs ex vivo (Figure 3I). In human MCs, the HIF1A-HILPDA signaling similarly governed the neutral lipid accumulation in response to IL-1β (Figures 3J, 3K, and S3G).
Besides Hilpda, certain genes associated with lipid absorption and lipid droplet formation 10, 34, were also induced by IL-1β (Figure S3H), suggesting that IL-1β-stimulated other lipid metabolic pathways may also contribute to lipid-laden MC formation. On the other hand, IL-1β repressed a subset of genes associated with β-oxidation 35 in lung MCs (Figure S3I). Consequently, IL-1β-educated lung MCs had a lower level of oxidative phosphorylation than control MCs (Figure S3J), indicating a metabolic shift of MCs towards lipid storage upon IL-1β treatment. Collectively, tumor-associated inflammation endows lung MCs with a lipid-laden phenotype via an axis of IL-1β-HIF1A-HILPDA, which in turn represses TG lipolysis leading to TG accumulation (Figure 3L).
Lipid-laden MCs function to promote metastatic colonization
To determine the functional contribution of lipid-laden MCs to lung metastasis, we generated AtglΔMCs mice. After confirming the cell specificity of the Atgl KO (Figure S4A), we identified that loss of Atgl in naïve lung MCs resembled the tumor-bearing or IL-1β-treated conditions in terms of abrogation of TG lipolysis, intracellular TG elevation (Figure 4A), and neutral lipid accumulation (Figures 4B and 4C). In addition, AtglΔMCs lung MCs released more TGs than the WT MCs when cultured ex vivo (Figure S4B). Therefore, this AtglΔMCs model and the above-mentioned HilpdaΔMCs model, which represent reinforced and attenuated lipid-laden MC phenotypes, respectively, set up the next functional analyses.
Figure 4. Lipid-laden MCs function to promote metastatic colonization.

(A-B) Lipase activity (A, left), cellular TG content (A, right) and lipid levels (B) were measured in lung CD140a+ MCs from naïve WT and AtglΔMCs mice (n=6).
(C) Immunofluorescence results showing lipid content in lung CD140a+ MCs from naïve WT and AtglΔMCs mice. Scale bars, 8 μm.
(D-G) As depicted in the schematic (D, left), lung metastatic colonization and primary tumor weight were compared between WT and AtglΔMCs mice (D, F) or between WT and HilpdaΔMCs mice (E, G) (n=10–12). IV, intravenously; BLI, bioluminescence imaging.
(H) As depicted in the schematic (left), spontaneous lung metastasis was compared between WT and AtglΔMCs mice (n=9).
(I) Comparison of the spontaneous lung metastasis developed in MMTV-PyMT; AtglΔMCs mice and their WT littermates. H&E staining of lung sections are shown, and arrowheads indicate metastatic lesions (n=10). Scale bars, 1mm. The Pymt expression in lung tissues was quantified (n=8).
n represents the number of biological replicates. The results are representative of three (A-C) or two (D-I) independent experiments and shown as mean ± SEM. Statistical significance was determined by unpaired Student’s t-test (A-B) or Mann-Whitney test (D-I). *p< 0.05, **p< 0.01, ***p< 0.001, ****p< 0.0001; NS, not significant. See also Figure S4.
In a modified metastatic colonization model through which the role of a pre-metastatic niche can be evaluated (Figure 4D, left) 10, 36, 37, AtglΔMCs mice developed a higher level of lung colonization by AT3 tumor cells than their WT littermates did (Figure 4D, middle and right), while metastatic colonization was reduced in the HilpdaΔMCs mice (Figure 4E). Interestingly, neither Atgl cKO nor Hilpda cKO affected the primary AT3 tumor growth (Figures 4F and 4G), suggesting a specific role for lipid-laden MCs in the lung microenvironment. Similar results (Figure S4C) were obtained using the E0771 cells 38. Furthermore, we probed the functional role of lipid-laden MCs in a spontaneous lung metastasis model (Figure 4H, left) that better mimics a clinical setting in which the primary tumors are surgically dissected while the metastatic foci remain intact 39. Consistently, spontaneous lung metastasis was elevated in the Atgl cKO mice (Figure 4H, middle and right). Finally, in a more physiological context, host Atgl cKO led to increased spontaneous lung metastasis in the genetically engineered MMTV-PyMT model (Figure 4I). Hence, lipid-laden lung MCs serve to facilitate metastasis of breast cancer to the lung.
HILPDA-triggered lipid droplet formation through suppression of ATGL has been previously reported to sustain cancer cell survival in hypoxia 30, 40, and we therefore evaluated whether the Hilpda or Atgl cKO may impact MC cell survival as a mechanism of their regulation of metastasis. Under naïve, in vitro IL-1β treatment, and in vivo tumor-bearing conditions, loss of either Hilpda or Atgl did not cause changes in MC cell survival or apoptosis (Figures S4D-S4F), suggesting that intercellular interactions between lipid-laden MCs and lung environmental cells play direct roles in regulating metastasis. Therefore, we next characterized how lipid-laden MCs modulate tumor cells and host cells within the lung metastatic niche.
Lipid-laden lung MCs transport lipids to support tumor growth and survival
At the late stage of gestation in rats, fetal lung fibroblasts have been shown to release the stored TGs in response to elevated level of prostaglandin E2 (PGE2) in the lung. The released TGs can in turn be mobilized to lung epithelial cells as substrates for surfactant synthesis 12, 41, 42. In the AT3 model, we found that the lung resident PGE2 level underwent an evident increase at the metastatic stage (after day 15) 37 (Figure S5A), and PGE2 effectively induced TG release from IL-1β-pretreated lung MCs (Figure S5B). We therefore speculated that neutral lipids accumulated in lung MCs in the pre-metastatic phase could be released into lung environment to modulate metastatic tumor cells. In the lung sections, we detected a close spatial interaction between lung MCs and early colonized tumor cells (Figure 5A), which supported the above notion. To precisely investigate the possible neutral lipid transport from lipid-laden MCs to tumor cells and its subsequent impact on tumor cell behaviors, we exploited lung MCs isolated from AtglΔMCs mice to represent the lipid-laden MC state. This approach aimed to avoid any confounding effects of non-lipid substances if using tumor-bearing mice-derived lung MCs.
Figure 5. Lipid-laden lung MCs transport lipids to support tumor growth and survival.

(A) Immunofluorescence result showing adjacent localization of AT3-mCherry cells and lung CD140aEGFP MCs. Scale bar, 10 μm.
(B) The lipid content in AT3 cells was measured after co-cultured with WT or AtglΔMCs lung CD140a+ MCs (n=3).
(C) As depicted in the schematic (left), lipid content was measured in implanted AT3-mCherry cells (n=6).
(D) Real-time analysis of oxygen consumption rate (OCR) in AT3 cells after incubated with CM from WT or AtglΔMCs lung MCs. Basal ΔOCR and maximal (Max) ΔOCR were quantified (n=3).
(E) The proliferation of AT3 cells was measured after incubated with CM from WT or AtglΔMCs lung MCs (n=3).
(F) As depicted in the schematic (left), metastasis colonization potentials of AT3-Luc cells were measured after incubated with CM from WT or AtglΔMCs lung MCs (n=8).
(G) Comparison of the chemoresistant capacities of AT3 cells after incubated with CM from WT or AtglΔMCs lung MCs (n=3). DOX, doxorubicin; PTX, paclitaxel.
(H) As depicted in the schematic (left), lung metastasis in WT or AtglΔMCs mice was determined before and after treatment with DOX (n=10).
n represents the number of biological replicates. The results are representative of three independent experiments (A-H) and shown as mean ± SEM. Statistical significance was determined by one-way ANOVA (B, D), unpaired Student’s t-test (C), two-way ANOVA (E, G), Mann-Whitney test (F) or Paired t test (H). *p< 0.05, **p< 0.01, ***p< 0.001, ****p< 0.0001; NS, not significant. See also Figure S5.
As expected, in vitro, AT3 tumor cells acquired a higher level of neutral lipids when cultured with AtglΔMCs lung MCs than with WT cells (Figure 5B). Such a lipid transport from lipid-laden lung MCs to tumor cells was independent of cell-cell contact (Figures S5C and S5D). In vivo, implanted AT3 cells gained a heightened level of neutral lipids in the lung environment of the AtglΔMCs mice compared to those in WT mice (Figure 5C). Upon acquiring neutral lipids from lipid-laden MCs, tumor cells showed increased expression of a series of genes associated with the FAO pathway (Figure S5E), and elevated oxidative phosphorylation (Figures 5D and S5F). Together, acquisition of lipid-laden MC-derived lipids induced tumor cells to undergo a metabolic shift towards lipid utilization.
We next identified the functional consequences of lipid metabolic reprogramming in tumor cells. Consistent with their augmented lipid utilization, tumor cells gained a higher proliferation rate in vitro (Figure 5E) and a faster metastatic growth in vivo (Figure 5F), when they were pre-educated by lipid-laden (AtglΔMCs) MCs. Tumor cells implanted in the AtglΔMCs mice accordingly had a higher level of proliferation, while it was lower in the HilpdaΔMCs recipient mice, compared to that in WT mice (Figure S5G). Further, pre-incubation with lipid-laden (AtglΔMCs) MC conditioned medium (CM) rendered tumor cells more resistant to chemotherapeutic agents commonly used in solid cancer treatment 43, 44 in vitro (Figure 5G). In vivo, the therapeutic effect of doxorubicin in treatment of established lung metastasis in WT mice was abolished by host Atgl cKO (Figure 5H). Therefore, uptake of lipid-laden MC-derived lipids reprogram mammary tumor cells with heightened proliferative and chemoresistant capacities.
To determine whether active metabolic processes also occur in human, we analyzed a published dataset (GEO: GSE110590) 45 comprising the transcriptional profiles of lung metastases and matched primary tumors from the same patients with breast cancer. Compared to their matched mammary tumors, lung metastases were enriched in pathways associated with lipid metabolism and lipid utilization, and pathways related to inflammation (Figure S5H). Similar conclusions were drawn when we compared lung metastases to other organ metastases from another human breast cancer dataset (GEO: GSE14018) 46 (Figure S5I). Thus, an active lipid metabolism is a feature of lung metastases of breast cancer in both mouse and human.
Lipid-laden MCs metabolically reprogram NK cells leading to NK cell dysfunction
In addition to the above MC-tumor cell crosstalk, we next asked whether the lipid-laden MCs can metabolically remodel the lung immune microenvironment. We then focused on natural killer (NK) cells, the major metastasis-inhibitory immune cells during cancer cell colonization of the lung 36, 47, 48. We again exploited AtglΔMCs as a model for lipid-laden MCs. In AtglΔMCs mice, although the lung-resident NK cell number remained unchanged (Figures S6A), neutral lipids in NK cells were found elevated compared to NK cells in WT mice (Figures 6A and S6B). We first precluded the possibility of the leakage of Atgl KO in NK cells (Figure S6C), and then detected that NK cells co-cultured with AtglΔMCs lung MCs had a heightened level of lipids compared with those with WT MCs ex vivo (Figure S6D). In vivo, implanted NK cells acquired a higher amount of lipids in AtglΔMCs recipient mouse lungs than those in WT mouse lungs (Figure S6E). Along with the in situ observation of a close lung MC-NK cell interaction (Figure S6F), above data supported that lipid-laden MCs transport their stored neutral lipids to NK cells.
Figure 6. Lipid-laden MCs metabolically reprogram NK cells leading to NK cell dysfunction.

(A-C) Lipid content (A), OCR (B) and extracellular acidification rate (ECAR) (C) was measured in lung NK cells from WT and AtglΔMCs mice (n=5–6).
(D-E) The frequencies of lung interferon-gamma (IFNγ)+, granzyme B (GZMB)+ and perforin-1 (PRF1)+ NK cells (D) and the expression of Ifng, Gzmb and Prf1 in lung NK cells (E) were determined in WT and AtglΔMC mice (n=5–6).
(F) Comparison of the tumoricidal activities of lung NK cells (n=3) from WT and AtglΔMC mice against indicated tumor cells.
(G) As depicted in the schematic (left), lung metastasis colonization of AT3-Luc cells was measured after the recipient NSG mice were treated with lung NK cells derived from WT or AtglΔMC mice (n=8).
(H-J) As depicted in the schematic (H), the lipids incorporated into the AT3 cells (I; scale bars, 10 μm) or NK cells (J; scale bars, 5 μm) were detected with confocal microscopy and flow cytometry (n=4).
(K) Western blot showing the expression of exosomal markers in the CM portions from AtglΔMCs lung MCs.
(L) As depicted in the schematic (left), the PKH26 signal in AT3 cells (middle) and lung NK cells (right) was measured (n=5).
(M-N) The lipids incorporated into AT3 cells (M) or NK cells (N) were detected with confocal microscopy (scale bars, 10 μm) or flow cytometry after incubated with indicated endocytosis inhibitors and CM from AtglΔMCs lung MCs (n=4).
(O) As depicted in the schematic (left), the effect of LY294002 in controlling lung metastasis was determined (n=8).
n represents the number of biological replicates. The results are representative of three (A-F, I-N) or two (G, O) independent experiments and shown as mean ± SEM. Statistical significance was determined by unpaired Student’s t-test (A-E, L), two-way ANOVA (F), Mann-Whitney test (G) or one-way ANOVA (I-J, M-O). *p< 0.05, **p< 0.01, ***p< 0.001, ****p< 0.0001; NS, not significant. See also Figure S6.
In sharp contrast to tumor cells that tended to utilize the lipids (Figure 5D), NK cells isolated from AtglΔMCs mice had a lower level of oxidative phosphorylation than those from WT mice, suggesting a metabolic shift towards lipid storage (Figure 6B). Besides that, reduced basal glycolysis and glycolytic capacity were also observed in lung NK cells derived from AtglΔMCs mice compared to those from WT mice (Figure 6C). Ex vivo, these metabolic alterations were similarly detected in healthy NK cells upon their co-culture with CM from AtglΔMCs lung MCs (Figures S6G and S6H). Although lipid peroxidation has been reported as a mechanism of the derailed metabolism and dysfunction of anti-tumor immune cells 49, 50, the levels of lipid peroxidation and lipid peroxidation-associated gene expression 50, 51 were comparable in NK cells derived from AtglΔMCs and WT mice (Figures S6I and S6J). Thus, lipid-laden lung MCs caused a broad impairment in both glucose metabolism and oxidative phosphorylation of lung-resident NK cells.
Glucose metabolism in NK cells is required for synthesis of effector molecules and for exerting anti-tumor immunity 50, 52. In addition, lipid accumulation in NK cells in obese hosts has been shown to cause impaired NK cell cytotoxicity via inhibiting the mechanistic target of rapamycin complex 1 (mTORC1), an essential pathway controlling NK cell activation and function 53, 54. Consistent with their metabolic defects, AtglΔMCs mice-derived lung NK cells showed decreased expression of anti-tumor cytokines and cytotoxic molecules (Figures 6D and 6E), as well as the suppressed mTORC1 activation as indicated by reduced phosphorylation of S6 (p-S6), a downstream target of mTORC1 (Figure S6K). As anticipated, AtglΔMCs mice-derived lung NK cells showed a significantly reduced cytotoxicity ex vivo (Figure 6F) and decreased ability to restrain lung metastatic colonization in vivo (Figure 6G), compared to NK cells from WT mice. Taken together, lipid-laden MCs metabolically reprogram lung-resident NK cells leading to NK cell dysfunction.
Lipid-laden MCs transport lipids to tumor cells and NK cells via exosome-like vesicles
Lipid-enriched cells transfer their lipids to surrounding cells through two main forms–free fatty acids and large-sized extracellular vesicles 10, 55, 56, 57. In an ex vivo assay, we determined the large-sized (>100 kDa) extracellular vesicle-containing CM portion, derived from lipid-laden MCs, to be the primary lipid provider for both tumor cells and NK cells (Figures 6H-6J). Under electron microscopy, extracellular vesicular particles ranging in diameter from 30 to 100 nm were detected in the large-sized CM portion (Figure S6L), sizes similar to those reported for exosomes 55, 58. Indeed, canonical exosomal markers, including CD9, CD63 and CD81 58, were identified in the large-sized CM portion (Figure 6K), and the exosomes isolated from lipid-laden (AtglΔMCs) lung MCs had a higher level of TGs than those from WT MCs (Figure S6M). Furthermore, tumor cells and NK cells were both capable of taking up lipid-laden MC-derived exosomes in vitro and in vivo (Figures 6L and S6N). Therefore, lipid transport from lipid-laden MCs to tumor cells and NK cells occurs mainly through exosome-like vesicles.
Uptake of extracellular vesicles by recipient cells was primarily through various endocytic pathways 59. Using selective inhibitors for different types of endocytosis 55, 60, we determined macropinocytosis to be the main pathway for tumor cells and NK cells to take up lipids derived from lipid-laden MCs (Figures 6M and 6N). The engulfed lipids were localized within the lysosomes of tumor cells (Figure S6O), suggesting a lysosomal pathway for tumor cells to utilize nutrients supporting their growth and survival 61, 62. In vivo, blockage of macropinocytosis with LY294002 55, 63 efficiently reduced lipid accumulation in implanted tumor cells and resident NK cells (Figure S6P), and accordingly reversed the increased proliferation of implanted tumor cells (Figure S6Q) and the dampened NK cell effector molecule expression (Figure S6R) in AtglΔMCs mice. In the modified metastatic colonization model, administration of LY294002 was effective in alleviating tumor cell colonization in AtglΔMCs mice (Figure 6O). Thus, inhibition of lipid transport from lipid-laden MCs abrogates their metabolic reprogramming of both tumor cells and NK cells, leading to reduced metastatic colonization.
Blockade of IL-1β mitigates lung metastasis and improves the therapeutic effect of NK cell-based immunotherapy
Inspired by the effectiveness of disrupting lipid transport in reducing lung metastasis, we speculated whether abrogation of lipid-laden MC formation through IL-1β neutralization (Figure 2H), could be another feasible means by which to remodel the lung metabolic microenvironment, thereby blunting metastatic colonization. Indeed, in the AT3 model, anti-IL-1β reactivated lung-resident NK cells as reflected by their reduced lipid storage (Figure 7A), increased expression of the effector molecules (Figures 7B, S7A and S7B), and elevated tumoricidal activities (Figure S7C). Consequently, anti-IL-1β showed potent metastasis-inhibiting effects in different mouse breast tumor models (Figures 7C, S7D, and S7E). Therefore, targeting IL-1β, an upstream “switch” inducing lipid-laden MC formation, was an effective measure to alleviate lung metastasis of breast cancer.
Figure 7. Blockage of IL-1β mitigates lung metastasis and improves the efficacy of NK cell-based immunotherapy.
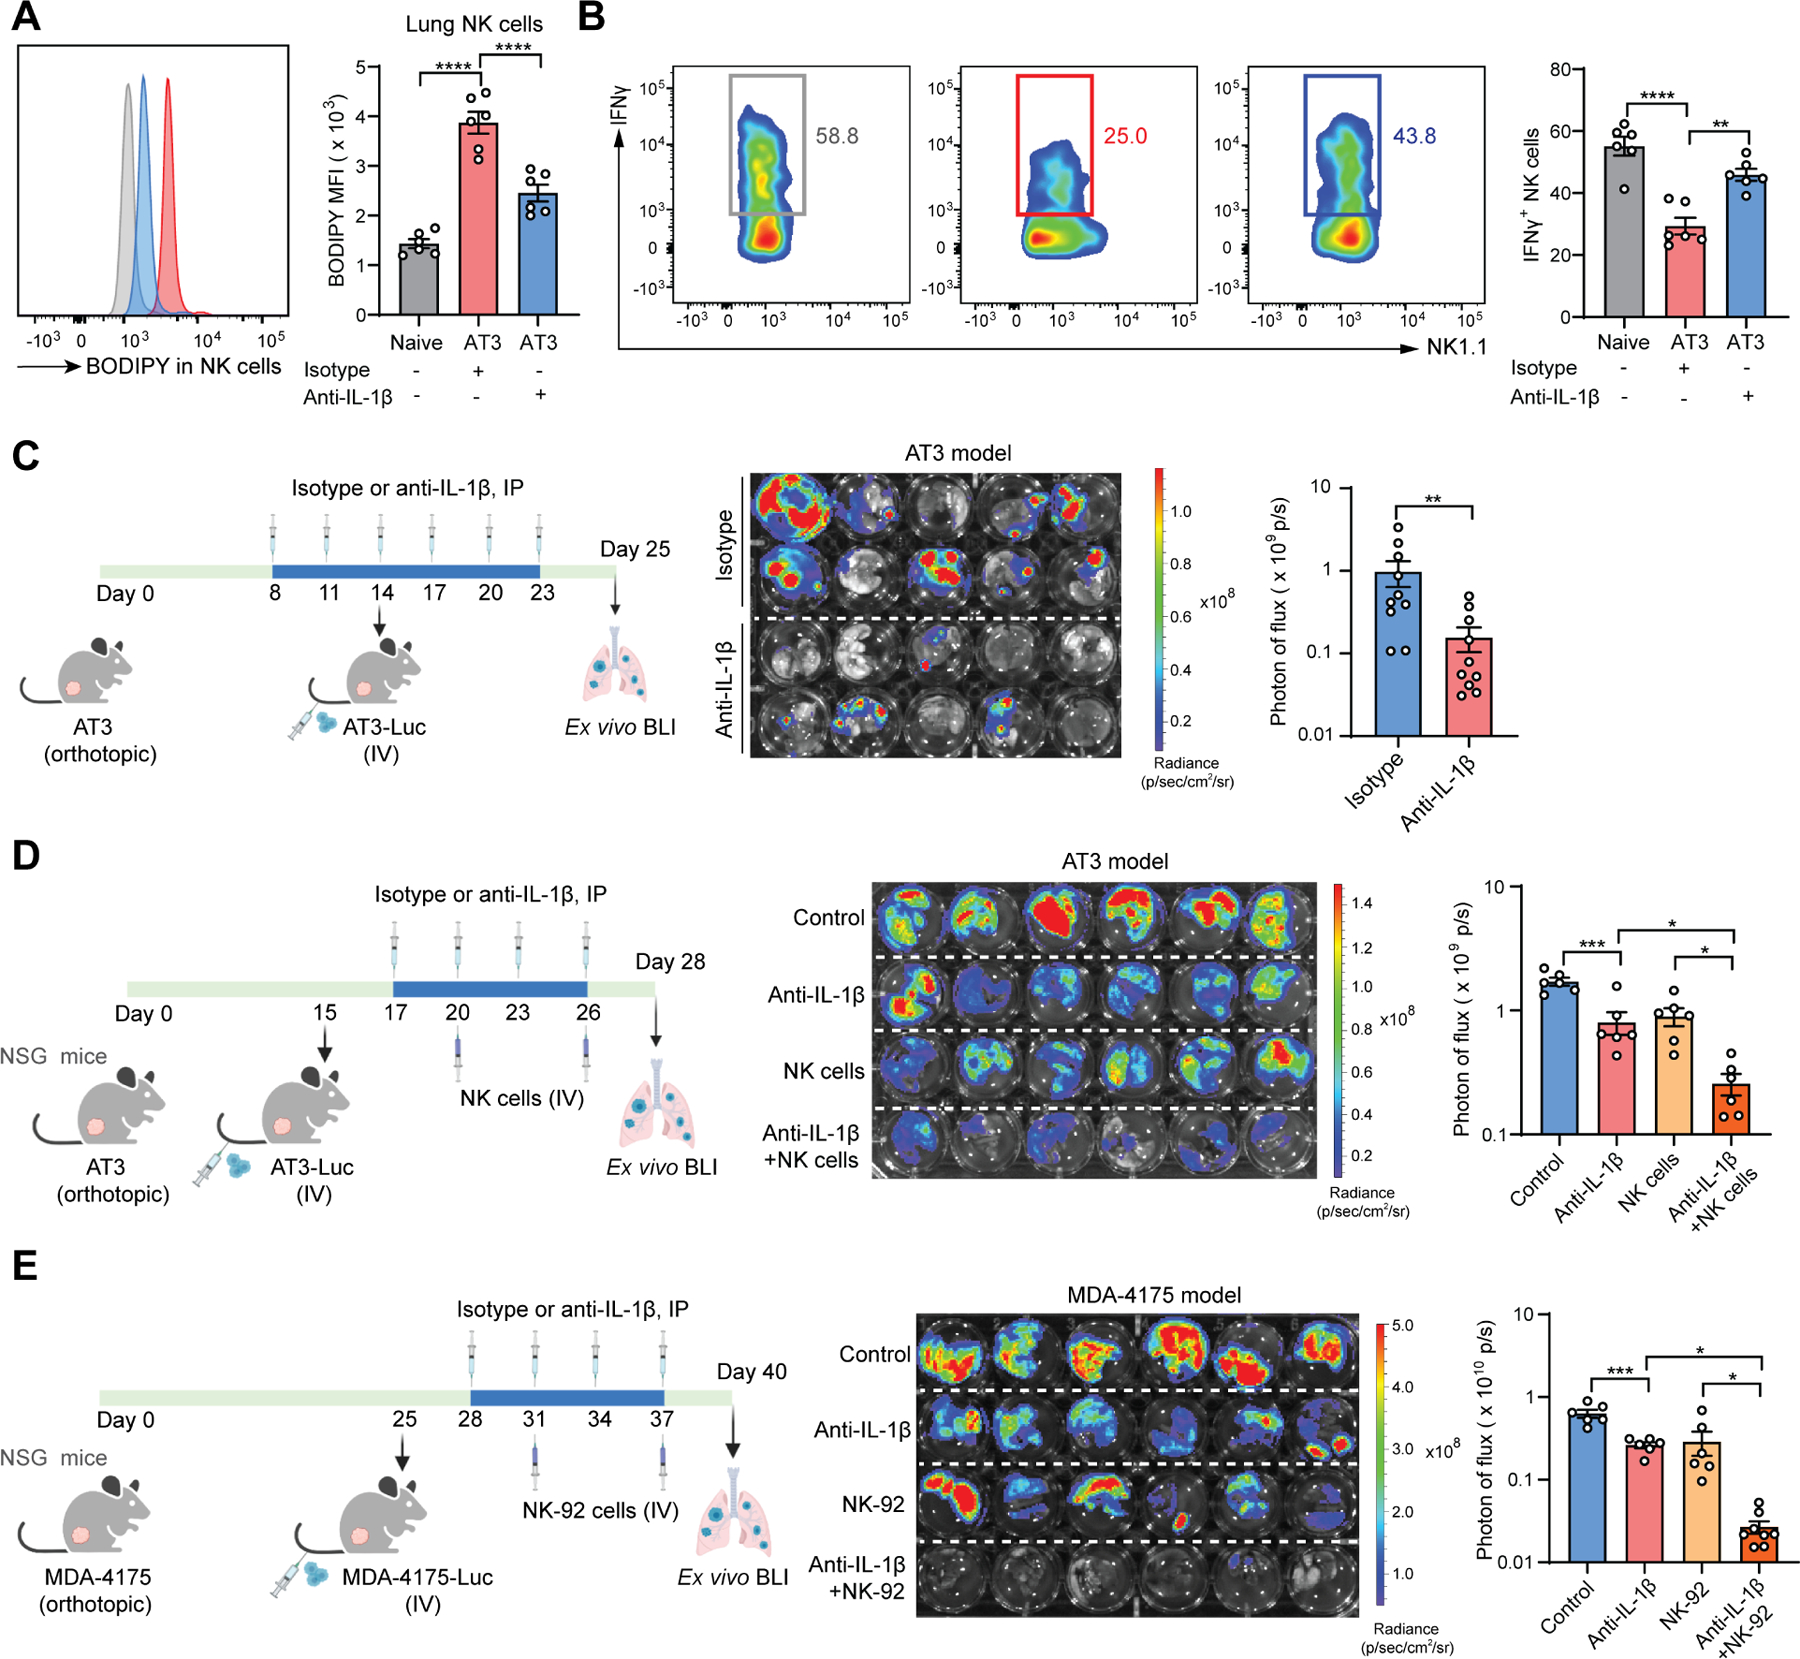
(A-B) As depicted in the schematic (Figure 2H, left), the lipid content in lung NK cells (A) and the frequencies of lung IFNγ+ NK cells (B) were determined at the endpoint (n=6).
(C) As depicted in the schematic, the effect of anti-IL-1β in controlling lung metastasis was determined (n=10).
(D-E) As depicted in the schematic, the combined effect of anti-IL-1β and adoptive transfer of mouse NK cells (D) or human NK-92 cells (E) in controlling lung metastasis was determined (n=6–8).
n represents the number of biological replicates. The results are representative of two (A-E) independent experiments and shown as mean ± SEM. Statistical significance was determined by one-way ANOVA (A-B, D-E) or Mann-Whitney test (C). *p< 0.05, **p< 0.01, ***p< 0.001, ****p< 0.0001. See also Figure S7.
We have revealed two mechanisms downstream of IL-1β-elicited lipid-laden MCs in promoting lung metastasis: metabolic modulation of NK cells and tumor cells. To distinguish these two mechanisms in metastasis, we tested anti-IL-1β treatment in the AT3 model when host NK cells were depleted. With an efficient NK cell depletion (Figure S7F), the colonization-inhibitory effect of anti-IL-1β was indeed reduced, but not completely abolished (Figure S7G), suggesting that those two mechanisms both contribute to metastasis regulation. Furthermore, considering the multifaceted roles of IL-1β in tumor and tissue microenvironments 21, 64, we wondered whether the detected effect of anti-IL-1β could also be due to lipid-laden MC-independent mechanisms. As expected, although MC-targeted deletion of either Hilpda or Atgl reduced the effectiveness of anti-IL-1β, it still significantly suppressed metastatic colonization in these cKO recipient mice (Figures S7H and S7I). Hence, IL-1β exerts lipid-laden MC-dependent and -independent effects in regulation of breast cancer lung metastasis.
NK cell-based cancer therapy has made great strides in the past decade owing to their innate immune nature with no restriction to specific tumor antigens 65, 66. We next asked whether blockage of IL-1β, which was able to reactivate the endogenous NK cell functions, may also enhance NK cell adoptive transfer therapy in treatment of metastasis. To exclude effects from endogenous NK cells, we utilized immunodeficient NOD-scid IL2rγnull (NSG) mice, which lack endogenous NK cells, as the host. While each monotherapy of anti-IL-1β and NK cell adoptive transfer showed significant but mild therapeutic benefit, the combination of them demonstrated a synergistic and potent efficacy, reducing the metastatic burden by approximately seven-fold compared to untreated controls (Figure 7D). Similar to the mouse system, a metabolic axis of IL-1β–lipid-laden lung MC–NK cell dysfunction was found in human cells (Figures S7J and S7K), and in vivo, anti-IL-1β potently improved the therapeutic efficacy of human NK-92 cells in treatment of lung metastasis of human breast cancer cells (Figure 7E). Thus, targeting IL-1β is promising for development of combination immunotherapy in treating metastatic disease.
DISCUSSION
Although the lung is not usually considered as a major lipid metabolic organ, lipid metabolism is known to be critical for pulmonary alveoli development during the prenatal and neonatal stages, and is implicated in various pulmonary diseases at the adult stage 12, 69, 70. Among lung tissue cells, alveolar type 2 (AT2) cells and lipofibroblasts are the most studied cells involved in the synthesis and recycling of pulmonary surfactant–a mixture of phospholipids and surfactant proteins essential for respiration by reducing surface tension at the air–liquid interface in the alveoli 11, 71, 72. Results from lung development studies in the 1990s showed that lipofibroblasts transfer their stored TGs to AT2 cells as substrates for surfactant synthesis, because lipofibroblasts have a higher potential to take up TGs than AT2 cells 12, 42. Later on, pulmonary inflammation was reported to impair AT2 cell functions, leading to a disrupted pulmonary surfactant system 73, 74, 75, 76. Our current study, in the context of cancer-associated inflammation, demonstrated that inflammation induced TG accumulation in lung MCs. Although we have not explored whether lipid-laden MCs may support AT2 cells in reconstructing inflammation-disrupted pulmonary surfactant, lipid-laden MCs indeed helped another type of epithelial cells–metastatic breast tumor cells–in survival and proliferation. We hypothesized that lipid-laden MC formation might represent a mechanism to repair inflammation-impaired lung surfactant via a swift transport of interstitial TGs into alveoli. However, such a repair mechanism could be employed by metastatic tumor cells to facilitate their successful colonization. Our future work aims to further explore the possible link between lipid-laden MCs and AT2 cells in maintaining surfactant homeostasis, and how this link may benefit DTC colonization.
Neutral lipids have recently attracted much attention for their roles in cancer biology 77, but remain less characterized in metastasis. Limited evidence showed that a lipid-rich organ environment helps foster the successful colonization of DTCs, primarily through lipid uptake by tumor cells to heighten their proliferation 6, 10, 78. Based on our previous work 10 and the present study, we speculate that different types of tissue environmental cells may act as main providers for specific metabolites depending on the host conditions. Using recently developed spatial technologies 79, 80, it will be intriguing to spatially delineate the distribution of different TG species in the lung under steady-state and distinct cancer-associated host conditions. Aside from a deeper understanding of neutral lipid biology in cancer, our results suggest that greater caution and safety evaluation during preclinical tests should be considered when using solid lipid particle-based drug delivery for cancer treatment 81, 82, as the particles comprise neutral lipids such as TGs may compromise the beneficial effects of the encapsulated drugs.
Adoptive cell therapy has emerged as a new generation of immunotherapy and has shown robust therapeutic potential in the treatment of hematological malignancies 83, 84. However, a major challenge in extending cell-based immunotherapies to treat solid cancers and metastatic disease is the presence of an immunosuppressive microenvironment 85, 86, 87. Depending on the tumor and tissue type, and the stage of solid tumor progression, the immunosuppressive mechanisms vary vastly and can occur at the transcriptional, proteomic, and metabolic levels, thereby making it difficult to develop a universal targeting strategy to eradicate immunosuppression 88, 89, 90. In the present study, we uncovered a lipid-laden MC-mediated metabolic mechanism causing NK cell dysfunction and targeting IL-1β was effective in improving adoptive NK cell-based therapy in treating lung metastasis. IL-1β has been reported to exert either supportive or inhibitory roles in solid tumor metastases depending on the tumor models or experimental conditions used 64, 91, 92, and therefore it is necessary to dissect the precise multifaceted mechanisms downstream of IL-1β in specific tumor or tissue microenvironments. This information will facilitate the combination of IL-1β blockage with cell-based immunotherapy into clinical application to treat metastatic disease.
Limitations of the study
In this work, we identified that neutral lipids, upon being transported from lipid-laden MCs, undergo distinct fates in tumor cells (utilization) and NK cells (storage), however, the underlying molecular mechanisms remain to be determined. Further, the in situ identification of the lipid sources, stimulators of lipid release from MCs, and intercellular lipid transport among different lung environmental cells need to be explored. Although we knew that exosome-like vesicles released from lipid-laden MCs mediate the functional reprogramming of tumor cells and NK cells, the exact metabolites derived from the extracellular vesicles remain to be characterized. Lastly, the lipid-laden MCs were only studied in the context of lung metastasis models; future work is required to understand this metabolic phenotype in other contexts such as homeostasis, inflammation, lung cancer, and other lung diseases.
STAR★METHODS
RESOURCE AVAILABILITY
Lead Contact
Further information and requests for resources and reagents should be directed to and will be fulfilled by the Lead Contact, Guangwen Ren (Gary.Ren@jax.org).
Materials Availability
The MDA-4175-Luc cell line was newly generated in this study and will be available from the Lead Contact under a Materials Transfer Agreement.
Data and Code Availability
The human lung lipidomic data used here are from LMEX0000001622 in LungMAP (https://www.lungmap.net/). The human RNA-seq data are from GSE110590 and GSE14018. The bulk RNA-seq data from ex vivo cultured lung MCs are from E-MTAB-11887. The scRNA-seq data generated from this study were deposited in public data repositories (E-MTAB-11902). All accession numbers are listed in the KEY RESOURCES TABLE. Original data for creating all graphs in the paper are provided in Data S1.
The current study does not report original code.
Any additional information required to reanalyze the data reported in this paper is available from the lead contact upon reasonable request.
Key resources table
| REAGENT or RESOURCE | SOURCE | IDENTIFIER |
|---|---|---|
| Antibodies | ||
| Alexa Fluor® 700 anti-mouse CD45 (Clone 30-F11) | BioLegend | Cat# 103128; RRID: AB_493715 |
| PE/Cyanine7 anti-mouse CD31 (Clone 390) | BioLegend | Cat# 102418; RRID: AB_830757 |
| APC/Fire™ 750 anti-mouse CD326 (Clone G8.8) | BioLegend | Cat# 118229; RRID: AB_2629757 |
| Brilliant Violet 421™ anti-mouse CD140a (Clone APA5) | BioLegend | Cat# 135923; RRID: AB_2814036 |
| PE/Cyanine5 anti-mouse Ly-6A/E (Clone D7) | BioLegend | Cat# 108109; RRID: AB_313346 |
| Brilliant Violet 650™ anti-mouse/human CD11b (Clone M1/70) | BioLegend | Cat# 101259; RRID: AB_2566568 |
| PerCP/Cyanine5.5 anti-mouse CD3ε (Clone 145–2C11) | BioLegend | Cat# 100328; RRID: AB_893318 |
| PE/Cyanine5 anti-mouse CD4 (Clone RM4–5) | BioLegend | Cat# 100514; RRID: AB_312717 |
| Brilliant Violet 650™ anti-mouse CD8a (Clone 53–6.7) | BioLegend | Cat# 100742; RRID: AB_2563056 |
| Alexa Fluor® 647 anti-mouse NK-1.1 (Clone PK136) | BioLegend | Cat# 108720; RRID: AB_2132713 |
| Brilliant Violet 711™ anti-mouse IFN-γ (Clone: XMG1.2) | BioLegend | Cat# 505836; RRID: AB_2650928 |
| PE/Cyanine7 anti-human/mouse Granzyme B (Clone QA16A02) | BioLegend | Cat# 372214; RRID: AB_2728381 |
| PE anti-mouse Perforin (Clone S16009A) | BioLegend | Cat# 154306; RRID: AB_2721639 |
| PE/Cyanine7 anti-mouse Ki-67 (Clone: 16A8) | BioLegend | Cat# 652425; RRID: AB_2632693 |
| CD9 (Clone: KMC8) | Thermo Fisher Scientific | Cat# 14–0091-82; RRID: AB_823138 |
| CD63 (Clone: 446703) | R&D Systems | Cat# MAB5417-SP; RRID: AB_2076610 |
| CD81 (Clone: 431301) | R&D Systems | Cat# MAB4865-SP; RRID: AB_2275889 |
| α-Smooth Muscle-FITC (Clone: 1A4) | Sigma-Aldrich | Cat# F3777; RRID: AB_476977 |
| Cleaved Caspase-3 (Asp175) | Cell Signaling Technology | Cat# 9661S; RRID: AB_2341188 |
| PE anti-mouse/human CD11b (Clone: M1/70) | BioLegend | Cat# 101207; RRID: AB_312790 |
| Alexa Fluor® 647 anti-mouse Ly-6G (Clone: 1A8) | BioLegend | Cat# 127610; RRID: AB_1134159 |
| CCL2 (MCP-1) | Thermo Fisher Scientific | Cat# PA5–115555; RRID: AB_2893318 |
| Phospho-S6 (Ser235/236) (Rabbit) | Cell Signaling Technology | Cat# 5316S; RRID: AB_10694989 |
| CD82 | Thermo Fisher Scientific | Cat# PA5–13228; RRID: AB_2244577 |
| HIF-1 alpha (Clone: ESEE122) | Thermo Fisher Scientific | Cat# 14–9100-82; RRID: AB_11217480 |
| HILPDA | Biorbyt | Cat# orb389656 |
| GAPDH | Cell Signaling Technology | Cat# 5174S; RRID: AB_10622025 |
| CD161c/NK1.1 | Thermo Fisher Scientific | Cat# BS-4682R; RRID: AB_11092712 |
| PE anti-mouse CD45 (Clone QA17A26) | BioLegend | Cat# 157603; RRID: AB_2876536 |
| eFluor™ 660 anti-mouse CD11b (Clone M1/70) | Thermo Fisher Scientific | Cat# 50–0112-82; RRID: AB_11218507 |
| Goat anti-Rabbit IgG (H+L) Secondary Antibody, HRP | Thermo Fisher Scientific | Cat# 31460; RRID: AB_228341 |
| Goat anti-Mouse IgG (H+L) Secondary Antibody, HRP | Thermo Fisher Scientific | Cat# 31430; RRID: AB_228307 |
| Goat anti-Rat IgG (H+L) Secondary Antibody, HRP | Thermo Fisher Scientific | Cat# 31470; RRID: AB_228356 |
| Goat anti Rabbit IgG (H+L) Secondary Antibody, Alexa Fluor 594 | Thermo Fisher Scientific | Cat# A11037; RRID: AB_2534095 |
| Anti-mouse NK1.1 (Clone: PK136) | Bio X Cell | Cat# BE0036; RRID: AB_1107737 |
| Mouse IgG2a isotype control (Clone: C1.18.4) | Bio X Cell | Cat# BE0085; RRID: AB_1107771 |
| Polyclonal Armenian hamster IgG | Bio X Cell | Cat# BE0091; RRID: AB_1107773 |
| Anti-mouse IL-1β (Clone B122) | Bio X Cell | Cat# BE0246; RRID: AB_2687727 |
| Bacterial and virus strains | ||
| Biological samples | ||
| Chemicals, peptides, and recombinant proteins | ||
| Collagenase, Type IV, powder | Worthington Biochemical | Cat# LS004188 |
| Dnase I | MilliporeSigma | Cat# DN25 |
| LIVE/DEAD™ Fixable Aqua Dead Cell Stain | Thermo Fisher Scientific | Cat# L34966 |
| BODIPY 493/503 | Thermo Fisher Scientific | Cat# D3922 |
| BODIPY FL C16 | Thermo Fisher Scientific | Cat# D3821 |
| LipidTOX Red | Thermo Fisher Scientific | Cat# H34476 |
| LysoTracker™ Red DND-99 | Thermo Fisher Scientific | Cat # L7528 |
| Recombinant Murine IL-1β | PeproTech | Cat# 211–11B |
| Human IL-1β | Invivogen | Cat# rcyec-hil1b |
| Recombinant Human IL-1RA | BioLegend | Cat# 553902 |
| Recombinant Murine IL-12 p70 | PeproTech | Cat# 210–12 |
| Recombinant Murine IL-15 | PeproTech | Cat# 210–15 |
| Recombinant Mouse IL-18 | BioLegend | Cat# 767002 |
| Recombinant Murine CCL2 | PeproTech | Cat# 250–10 |
| D-Luciferin Firefly, potassium salt | Gold Biotechnology | Cat# LUCK |
| Doxorubicin hydrochloride | MilliporeSigma | Cat# PHR1789 |
| Cisplatin | MilliporeSigma | Cat# PHR1624 |
| Paclitaxel | MilliporeSigma | Cat# PHR1803 |
| Prostaglandin E2 | Cayman Chemical | Cat# 14010 |
| Etomoxir | Cayman Chemical | Cat# 11969 |
| IOX4 | Cayman Chemical | Cat# 18181 |
| PX-478 | Cayman Chemical | Cat# 10005189 |
| Atglistatin | Cayman Chemical | Cat# 15284 |
| BAY 59–9435 | MedChem Express | Cat# HY-102056 |
| JZL184 | Cayman Chemical | Cat# 13158 |
| SN50 Peptide | Cayman Chemical | Cat# 17493 |
| MLN120B | Cayman Chemical | Cat# 32819 |
| BAY 11–7082 | Cayman Chemical | Cat# 10010266 |
| Cycloheximide | Cayman Chemical | Cat# 14126 |
| LY294002 | Cayman Chemical | Cat# 70920 |
| Genistein | Millipore Sigma | Cat# G6649 |
| Chlorpromazine | Cayman Chemical | Cat# 16129 |
| Critical commercial assays | ||
| Mouse IL-1 beta/IL-1F2 Quantikine ELISA Kit, 2 Plate | R&D Systems | Cat# MLB00C |
| Mouse CCL2/JE/MCP-1 Quantikine ELISA Kit | R&D Systems | Cat# MJE00B |
| Proteome Profiler Mouse XL Cytokine Array | R&D Systems | Cat# ARY028 |
| Prostaglandin E2 Parameter Assay Kit | R&D Systems | Cat# KGE004B |
| Triglyceride Colorimetric Assay Kit | Cayman Chemical | Cat# 10010303 |
| Lipase Activity Assay Kit | Cayman Chemical | Cat# 700640 |
| Free Fatty Acid Fluorometric Assay Kit | Cayman Chemical | Cat# 700310 |
| Glucose Colorimetric Detection Kit | Thermo Fisher Scientific | Cat# EIAGLUC |
| L-Amino Acid Quantitation Kit | Millipore Sigma | Cat# MAK002–1KT |
| Diacylglycerol Assay Kit | Abcam | Cat# ab242293 |
| Phosphatidylcholine Assay Kit | Abcam | Cat# ab83377 |
| Phosphatidylethanolamine Assay Kit | Abcam | Cat# ab241005 |
| Phosphatidylglycerol Assay Kit | Abcam | Cat# ab273288 |
| Phosphatidylinositol Assay Kit | Abcam | Cat# ab252900 |
| Sphingomyelin Quantification Colorimetric Assay Kit | Abcam | Cat# ab287856 |
| Lipid Hydroperoxide (LPO) Assay Kit | Cayman Chemical | Cat# 705002 |
| PKH26 Red Fluorescent Cell Linker Mini Kit | MilliporeSigma | Cat# MINI26–1KT |
| Invitrogen™ Total Exosome Isolation Reagent | Thermo Fisher Scientific | Cat# 44–783-59 |
| Direct-zol RNA Miniprep Plus w/ TRI Reagent | Zymo | Cat# R2073 |
| High-Capacity cDNA Reverse Transcription Kit | Thermo Fisher Scientific | Cat# 4368814 |
| PowerUp SYBR™ Green PCR Master Mix | Thermo Fisher Scientific | Cat# A25778 |
| Deposited data | ||
| RNA-seq data of ex vivo cultured lung MCs | Reference 37 | ArrayExpress: E-MTAB-11887 |
| scRNA-seq data of lung CD140a+ MCs | This paper | ArrayExpress: E-MTAB-11902 |
| RNA-seq data of lung metastases and matched primary tumors | Reference 45 | GEO: GSE110590 |
| RNA-seq data of lung metastases and other organ metastases | Reference 46 | GEO: GSE14018 |
| Data S1 – Source Data | This study | N/A |
| Experimental models: Cell lines | ||
| 4T1 | ATCC | Cat# CRL2539 |
| AT3 | Gift from S.I. Abrams | N/A |
| E0771 | CH3 Biosystems | Cat# 940001 |
| YAC-1 | ATCC | Cat# TIB-160 |
| NK-92MI | ATCC | Cat# CRL2408 |
| K562 | ATCC | Cat# CCL243 |
| MDA-4175 | Gift from Y. Kang | N/A |
| 4T1-Luc | Reference 10 | N/A |
| AT3-Luc | Reference 10 | N/A |
| E0771-Luc | Reference 10 | N/A |
| MDA-4175-Luc | This paper | N/A |
| AT3-mCherry | Reference 10 | N/A |
| Human lung mesenchymal cells | Sciencell | Cat# 7540 |
| Experimental models: Organisms/strains | ||
| C57BL/6J | The Jackson Laboratory | JAX: 000664 |
| BALB/cJ | The Jackson Laboratory | JAX: 000651 |
| NSG: NOD.Cg-Prkdcscid Il2rgtm1Wjl/SzJ | The Jackson Laboratory | JAX: 005557 |
| CD140aEGFP: B6.129S4-Pdgfratm11(EGFP)Sor/J | The Jackson Laboratory | JAX: 007669 |
| Atglflox/flox (B6N.129S-Pnpla2tm1Eek/J) | The Jackson Laboratory | JAX: 024278 |
| Hilpdaflox/flox (Hilpdatm1.1Nat/J) | The Jackson Laboratory | JAX: 017360 |
| Hif1aflox/flox (B6.129-Hif1atm3Rsjo/J) | The Jackson Laboratory | JAX: 007561 |
| PdgfraCre: C57BL/6-Tg(Pdgfra-cre)1Clc/J | The Jackson Laboratory | JAX: 013148 |
| PdgfraCre; Atglflox/flox | This paper | N/A |
| PdgfraCre; Hilpdaflox/flox | This paper | N/A |
| PdgfraCre; Hif1aflox/flox | This paper | N/A |
| PdgfaCre; Atglflox/flox; MMTV | This paper | N/A |
| MMTV-PyMT: B6.FVB-Tg(MMTV-PyVT)634Mul/LellJ | The Jackson Laboratory | JAX: 022974 |
| FVB/N-Tg(MMTV-PyVT)634Mul/J | The Jackson Laboratory | JAX: 002374 |
| Il1r1−/−: B6.129S7-Il1r1tm1Imx/J | The Jackson Laboratory | JAX: 003245 |
| Oligonucleotides | ||
| See Table S1 for primer sequences | ||
| Recombinant DNA | ||
| pLenti CMV Puro LUC (w168–1) | Reference 93 | Addgene# 17477 |
| pLV-mCherry | Tsoulfas lab | Addgene# 36084 |
| Software and algorithms | ||
| BD FACSDiva software | BD Biosciences | https://www.bdbiosciences.com/ |
| FlowJo (version 10.8.0) | BD Biosciences | https://flowjo.com |
| R (version 4.0.2) | The R Foundation | https://www.r-project.org/ |
| Seurat (version 3.2.2) | Satija Lab | https://satijalab.org/seurat/ |
| Metascape | Reference 96 | https://metascape.org/ |
| LungMAP | LungMAP | https://www.lungmap.net/ |
| GraphPad Prism (version 8.2.1) | GraphPad Software | https://www.graphpad.com/ |
| Biorender | Biorender | https://biorender.com/ |
| ImageJ (1.53c) | ImageJ | https://imagej.nih.gov/ij/ |
| Other | ||
EXPERIMENTAL MODEL AND SUBJECT DETAILS
Animals
C57BL/6J, BALB/cJ, NOD.Cg-PrkdcscidIl2rgtm1Wjl/SzJ (NSG), B6.129S4-Pdgfratm11(EGFP)Sor/J (CD140aEGFP), B6N.129S-Pnpla2tm1Eek/J (Atglflox/flox), Hilpdatm1.1Nat/J (Hilpdaflox/flox), B6.129-Hif1atm3Rsjo/J (Hif1aflox/flox), C57BL/6-Tg(Pdgfra-cre)1Clc/J (PdgfraCre), B6.FVB-Tg(MMTV-PyVT)634Mul/LellJ), FVB/N-Tg(MMTV-PyVT)634Mul/J and B6.129S7-Il1r1tm1Imx/J (Il1r1−/−) mice were all obtained from The Jackson Laboratory. Atglflox/flox, Hilpdaflox/flox or Hif1aflox/flox mice were crossed with PdgfraCre mice to generate Atgl cKO (AtglΔMCs) mice, Hilpda cKO (Hilpda ΔMCs) mice or Hif1a cKO (Hif1a ΔMCs) mice. MMTV-PyMT (B6.FVB-Tg (MMTV-PyVT)634Mul/LellJ) mice were crossed with AtglΔMCs mice to generate MMTV-PyMT; AtglΔMCs mice. Female mice aged between 10 to 12 weeks were used for experiments unless indicated otherwise. The mice were fed on a chow diet ad libitum and housed in a specific pathogen-free facility in plastic cages at 22 °C and 40–50% humidity, with a daylight cycle from 06:00 to 18:00. All animal experiments and related protocols were approved by and conducted in accordance with guidelines from the Institutional Animal Care and Use Committee of The Jackson Laboratory.
Cell lines
4T1, YAC-1, NK-92MI and K562 cell lines were all purchased from the American Type Culture Collection (ATCC). AT3 cell line was kindly provided by S.I. Abrams (Roswell Park Comprehensive Cancer Center). E0771 cell line was obtained from CH3 Biosystems. Human lung mesenchymal cells were purchased from ScienCell Research Laboratories. MDA-4175 cells, originally generated from J. Massagué’s laboratory (Memorial Sloan-Kettering Cancer Center), was kindly provided by Y. Kang (Princeton University). 4T1 and AT3 cell lines were cultured in DMEM medium supplemented with 10% fetal bovine serum (FBS) and 1% penicillin/streptomycin YAC-1, K562 and E0771 cell lines were cultured in RPMI 1640 medium supplemented with 10% FBS and 1% penicillin/streptomycin NK-92MI cell lines was cultured in the Alpha Minimum Essential medium supplemented with 0.2 mM inositol, 0.1 mM 2-mercaptoethanol, 0.02 mM folic acid, 12.5% horse serum and 12.5% FBS. AT3 cells were infected with mCherry-expressing lentivirus (Addgene, plasmid #36084) to generate AT3-mCherry cells. For luciferase labeling, 4T1, AT3, E0771 and MDA-4175 cells were infected with luciferase-expressing lentivirus (Addgene, plasmid #17477) 93. All cell lines used in this study were tested and confirmed to be negative for mycoplasma.
METHOD DETAILS
Experimental design
Unless otherwise indicated, age-matched (10–12 weeks) female littermates of mice were used for control and experimental groups. The mice were randomized prior to tumor inoculation. Before further treatments, the tumor-bearing mice were randomized based on their tumor sizes to ensure all treatment groups have equivalent tumor burden.
Investigators were blinded to group allocation when counting the lung metastatic nodules (Figures 4I and S7E). All other experiments were unblinded as these analyses were performed using quantifiable parameters and therefore no bias was involved.
No statistical method was used to predetermine the sample size. The sample size in each experiment was determined based on the level of expected heterogeneity of the samples, the significance threshold (chosen at 0.05), the expected or observed difference, and previous publications and our pilot studies. The chosen sample size in each experiment is sufficient to generate statistically significant results.
Lung tissue dissociation and primary culture of lung MCs
Lung tissue dissociation was performed as described previously 37, 94. The euthanized mice were first perfused with 1× PBS through right ventricle of heart to remove erythrocytes and circulating leukocytes. Then the lung tissue was carefully inflated with 2 ml enzyme solution containing 2 mg/ml Collagenase Type IV (Worthington Biochemical) and 0.1 mg/ml DNase I (MilliporeSigma), removed and cut into small pieces. Minced lung pieces were dissociated with enzyme solution in 37°C for 1 hour. Cell suspension was filtered through 100-μm cell strainer to remove the undigested fragments, and red blood cells were lysed by using ammonium-chloride-potassium (ACK) lysis buffer. The cells were centrifuged, resuspended in RPMI1640 medium and filtered through 40-μm cell strainer to get the single cell suspensions.
For primary culture of lung MCs, above prepared lung single cell suspensions were stained with specific surface markers and CD45−CD31−CD326−CD140a+ MCs were sorted through fluorescence activated cell sorting and cultured with MesenCult™ Expansion kit (STEMCELL Technologies). After expansion for 3–5 days, the cultured primary lung MCs were used for ex vivo experiments.
Flow cytometry and cell sorting
To determine the lung MCs subtypes through Ly6A and CD82, the lung tissues from naïve control and tumor-bearing mice were collected and the single cell suspensions were prepared as described above. Lung cells were firstly stained with CD82 primary antibody for 2 hours at 4°C, then cells were washed and stained with conjugated secondary antibody for 1 hour at room temperature. Surface antibodies against CD45, CD31, CD326, CD140a and Ly6A were stained at 4°C for 30 minutes. Dead cells were indicated with 4,6-diamidino-2-phenylindole (DAPI).
To measure the lipid level of lung MCs, lung single cell suspensions or ex vivo cultured MCs were stained with specific surface antibodies to identify the CD140a+ MCs. BODIPY 493/503 was used to stain the lipid levels of MCs and quantified by flow cytometry.
To screen the previously reported pre-metastatic niche-regulating factors, lung MCs were treated with the candidate regulators for 24 hours and then stained with cell type surface markers and BODIPY 493/503 to quantify the lipid level in MCs. The final concentration of each following reagent was used at 10 ng/ml unless indicated otherwise: interleukin-1α (IL-1α), interleukin-18 (IL-18), interleukin-33 (IL-33), colony stimulating factor 2 (CSF-2), hepatocyte growth factor (HGF), tumor necrosis factor superfamily member 11 (TNFSF11), CD40 ligand (CD40LG), prostaglandin E2 (PGE2), interleukin-6 (IL-6), interleukin-4 (IL-4), insulin-like growth factor 2 (IGF2), transforming growth factor beta 1 (TGFβ1), tumor necrosis factor alpha (TNFα), platelet-derived growth factor BB (PDGFBB), interferon gamma (IFNγ), fibroblast growth factor 2 (FGF2), interleukin-17 (IL-17), vascular endothelial growth factor A (VEGFA), and Wnt family member 3A (WNT3A).
To detect the lipid transfer from lung MCs to tumor cells or NK cells, lung MCs were firstly labeled with BODIPY FL C16 at 5 μM for 1 hour at 37°C. Then the cells were washed five times to completely remove the extracellular BODIPY. After washing, AT3 cells or NK cells were transwell co-cultured with the labeled lung MCs for 6 hours, and BODIPY FL C16 signal in tumor cells or NK cells were quantified by flow cytometry.
To determine the resistance ability of tumor cells to chemotherapy, AT3 tumor cells were seeded and cultured with WT or AtglΔMCs lung MCs conditioned medium for 24 hours. Then tumor cells were washed with PBS and treated with different concentrations of doxorubicin, cisplatin or paclitaxel for 24 hours. The percentage of cell viability was measured by using LIVE/DEAD Cell Stain Kit and quantified by flow cytometry.
For the intracellular cytokine staining of IFNγ, GZMB and PRF1, lung single cell suspensions were prepared from WT or AtglΔMCs mice, and then incubated with IL-12 (20 ng/ml), IL-15 (50 ng/ml) and IL-18 (5 ng/ml) for 18 hours at 37°C in NK cell culture medium. BD GolgiStop (1:1000) were added 4 hours before intracellular staining. Dead cells were excluded through staining LIVE/DEAD Fixable Stain BV510, and then the cells were incubated with indicated surface primary antibodies. Intracellular staining was performed by using the Fixation/Permeabilization Solution Kit (BD Biosciences) according to manufacturer’s instructions. The cells were then stained with anti-IFNγ, anti-GZMB and anti-PRF1 for 1 hour at 4°C and processed to flow cytometry analysis.
Flow cytometry was conducted on FACSymphony A5 cytometer (BD Biosciences) and the data were collected and analyzed through FACSDiva software or FlowJo™ v10.8.0 Software. The fluorescence activated cell sorting was conducted on the BD FCASAria II cell sorter. The detail information of antibodies used in this study can be found in KEY RESOURCES TABLE.
Single cell RNA sequencing and data analysis
Lung tissues from naïve or tumor-bearing CD140aEGFP reporter mice were dissociated and CD140+ MCs (CD45−CD31−CD326− GFP+) were sorted for single-cell RNA sequencing (scRNA-seq). Sample capture, barcoding and library preparation were conducted by the Single Cell Biology Lab core facility at The Jackson Laboratory with the 10x Genomics system. For each sample, around 12,000 cells were loaded, and the generated libraries were checked for quality. Samples were sequenced with an average depth of 50,000 reads per cell.
scRNA-Seq data was analyzed by using Seurat 95 version 3.2.2 in R version 4.0.2. After quality filtering, we obtained 4,190 cells with 19,942 genes from naïve mice and 5,972 cells with 20,687 genes from tumor-bearing mice, and then performed the comparative analyses on these two datasets. Integration ‘anchors’ were identified by using the FindIntegrationAnchors() function with default parameter. The two datasets were integrated and then the integrated data was scaled, and the first 20 principal components (PCs) were used as input to cluster cells and facilitate visualization. For CD140a+ MCs subtypes (clusters 0, 1 and 2), the FindAllMarkers function was used to identify specific marker genes of each cluster. The Seurat function DoHeatmap was used for plotting the top 20 markers of clusters 0, 1 and 2. To analyze the transcriptional difference induced by tumor-bearing conditions, we compared the average gene expression of each cluster, and analyzed the genes that exhibits increase response to tumor-bearing conditions by using Metascape 96 for the enrichment analysis of Gene Ontology terms.
Function enrichment analyses of human datasets
Functional enrichment analyses were performed using Metascape with default parameters. The top 200 up-regulated gene lists were uploaded as inputs for enrichment. We chose humans (Homo sapiens) as the target species, and enrichment analysis was performed against all genes in the genome as the background set, with the biological process (BP) of Gene Ontology (GO) as the functional test set. Only GO terms with a P value < 0.01 and annotated to ≥3 genes were considered significant.
Immunofluorescence staining and histology
To detect the lipid droplets of different tissue-derived CD140a+ cells from naïve or AT3-bearing mice, the CD140aEGFP mice were orthotopically implanted with AT3 tumor cells, and the different tissues (heart, lung, brain, bone, liver, kidney, and primary tumor) were harvested at the pre-metastatic stage (day 15) and fixed with 4% paraformaldehyde (PFA). Then the tissues were embedded in Tissue-Tek O.C.T. compound (Thermo Fisher Scientific) and sectioned. The cryosections were stained with LipidTOX™ Red (1:100 dilution) for 30 min at room temperature and the cell nuclei were stained with DAPI (1:2000 dilution) for 5 min at room temperature.
To determine the lipid levels in isolated lung MCs, the ex vivo or in vitro cultured cells were firstly fixed with 4% PFA and then stained with BODIPY 493/503 (1:1000 dilution) for 30 min at room temperature and the cell nuclei were stained with DAPI.
To determine the colocalization of lung MCs with myeloid cells or NK cells, the lung tissues from CD140aEGFP reporter mice was fixed with 4% PFA and sectioned. The cryosections were stained with anti-CD11b (for myeloid cells) or anti-NK1.1 (for NK cells) primary antibodies at a dilution of 1:100 at 4°C. On the next day, the sections were washed with PBS and stained with secondary antibodies for 1 hour at room temperature. Cell nuclei were stained with DAPI for 5 min at room temperature.
To compare lipid levels of lung NK cells from WT and AtglΔMCs mice, the isolated NK cells were firstly adhered to the glass slides by Cytospin and fixed with 4% PFA. The slides were then stained with BODIPY 493/503 (1:1000 dilution) for 30 min at room temperature and the cell nuclei were stained with DAPI for 5 min at room temperature.
For immunohistochemical analysis of lung metastasis colonization, lung tissues were harvested and fixed in 10% formalin, and then embedded in paraffin and sectioned. H&E staining was performed by Histology core facility at The Jackson Laboratory. For image analysis, the H&E staining results were captured with Hamamatsu Nanozomer 2.0 Slide Scanner.
Lipid transport assay
To detect the lipid transport form of lipid-laden lung MCs, ex vivo cultured lung MCs from AtglΔMC mice were labeled with BODIPY FL C16 (5 μM) for 1 hour at 37°C. Then the cells were washed five times to completely remove the extracellular BODIPY. Labeled lung MCs were cultured in RPMI-1640 medium (1 × 10⁶ cells per ml) at 37°C and conditioned medium (CM) was harvested and centrifuged to remove cell debris. Then the small-sized CM portion (<100 kDa) and large-sized CM portion (>100 kDa) were obtained using 100-kDa centrifuge filters. AT3 cells or NK cells were fed with the two CM portions or total CM, and BODIPY FL C16 signal in tumor cells or NK cells were detected by confocal microscopy or flow cytometry. Endocytosis inhibitors (10 μM each), including LY294002 (macropinocytosis), genistein (caveolae-mediated endocytosis), and chlorpromazine (clathrin-mediated endocytosis) were added to tumor cells or NK cells for 1 hour before incubation with CM. To label lysosomes, LysoTracker™ Red DND-99 was added to AT3 cells for the last 30 min of incubation.
Exosome isolation and detection
AtglΔMC (lipid-laden) lung MCs (1 × 10⁶ cells per ml) were cultured in RPMI-1640 medium without serum for 12 hours at 37°C. CM was then harvested and centrifuged to remove cell debris. Exosomes were isolated from the CM by using Total Exosome Isolation Reagent (Thermo Fisher Scientific). For electron microscopy, the CMs were fixed with 2% PFA and then processed by the Electron Microscopy core facility at The Jackson Laboratory. Images were captured by JEOL 1230 transmission electron microscope with an AMT 2K digital camera. For the western blot, the small-sized CM portion (<100 kDa) and large-sized CM portion (>100 kDa) were lysed by 1% NP40 buffer (Thermo Fisher Scientific) and then antibodies against classical exosome markers CD9, CD63, and CD81 were used for detection.
RNA extraction and quantitative real-time PCR
Total mRNA was extracted from sorted primary cells, ex vivo or in vitro cultured cells using the Direct-zol RNA Miniprep Plus kit (Zymo Research), dissolved in DNase/RNase free water, and then reverse-transcribed to cDNA using the High-Capacity cDNA Reverse Transcription kit (Thermo Fisher Scientific). Quantitative real-time PCR assays were performed using PowerUp SYBR™ Green PCR Master Mix (Thermo Fisher Scientific) in a 384-well plate on the ViiA 7 Real-Time PCR Instrument (Applied Biosystems). 2−ΔΔCt method was used to calculate the relative expression level. Primer sequences used in this study are listed in Table S1.
RNA sequencing
For the RNA sequencing (RNA-seq) of lung MCs, ex vivo cultured lung MCs were stimulated with vehicle or IL-1β (10 ng/ml) for 24 hours, and then cells were washed with PBS and lysed in Trizol reagent. RNA extraction, samples quality assesses, and the libraries preparation were all conducted by the Genome Technologies core facility at The Jackson Laboratory. Libraries were then pooled and sequenced at 100-bp paired-end. The paired-end reads were aligned to Mus musculus reference GRCm38. The transcript per million (TPM) results of RNA-seq data were used for downstream analysis.
Measurement of TG content, cellular lipase activity, and compositions of the CM
In vivo sorted different lung stromal cells, ex vivo cultured lung MCs or cell culture supernatants were used for TG measurement through the Triglyceride Colorimetric Assay Kit (Cayman Chemical), following manufacturer’s instructions. The intracellular lipase activity of lung MCs was determined using the Lipase Activity Assay kit (Cayman Chemical) according to the manufacturer’s instructions.
To measure the compositions of lung MC-derived CM, the ex vivo cultured lung MCs were from naïve AtglΔMCs or HilpdaΔMCs mice without or with IL-1β treatment, respectively. The following metabolites and lipids were examined by using relevant kits: free fatty acid, glucose, amino acid, TG, diacylglycerol (DG), phosphatidylcholine (PC), phosphatidylethanolamine (PE), phosphatidylglycerol (PG), phosphatidylinositol (PI) and sphingomyelin (SM).
Enzyme-linked immunosorbent assay (ELISA) and cytokine array
For the ELISA sample preparation, blood was collected from naïve or tumor-bearing mice (pre-metastatic stage) using BD Microtainer blood collection tubes. For bronchoalveolar lavage fluid (BALF) isolation, HBSS solution was gently instilled into the mouse lung through trachea and then carefully retracted to maximize BALF retrieval. The BALF was centrifuged at 300g for 5 min at 4°C to remove cell pellet, and the supernatant was collected for further experiments. For lung homogenate, the lung was harvested and homogenized in cold HBSS solution containing protease inhibitor cocktail. The homogenates were centrifuged at 12,000 rpm for 20 min at 4°C, and supernatant was collected. For primary tumor-derived CM, the primary tumors from AT3 or MMTV-PyMT models were dissociated and single cell suspensions were cultured in RPMI-1640 medium at a density of 1 × 10⁶ cells per ml for 16 hours. Then the CMs were harvested and centrifuged to remove cell debris. For the CM from in vitro cultured breast tumor cells, AT3 or 4T1 cells were seeded into the DMEM medium at a density of 1 × 10⁶ cells per ml for 16 hours, and then the CM was collected for ELISA or Cytokine Arrays.
Cell culture supernatants were collected from lung myeloid cells (CD45+CD11b+) isolated from naïve or tumor-bearing mice for the quantification of IL-1β. The concentrations of IL-1β, PGE2, or CCL2 were measured by using the Mouse IL-1 beta/IL-1F2 Quantikine ELISA Kit (R&D Systems), Prostaglandin E2 Parameter Assay Kit (R&D Systems) or Mouse CCL2/JE/MCP-1 Quantikine ELISA Kit (R&D Systems) according to the manufacturer’s instructions. AT3 cell-derived CM was profiled with Proteome Profiler Mouse XL Cytokine Array Kit (R&D Systems) according to the manufacturer’s instructions.
Western blot
Total protein was extracted from lung MCs after stimulation with vehicle or IL-1β (10 ng/ml) for 24 hours. The cells were lysed with 1× RIPA lysis buffer (MilliporeSigma) supplemented with protease inhibitor cocktail (MilliporeSigma). Protein samples were then separated in the 4–20 % Tris-Glycine gels (Thermo Fisher Scientific) and transferred to nitrocellulose membranes (Bio-Rad Laboratories). After incubating with 5% blotting-grade blocker (Bio-Rad Laboratories) for 1 hour at room temperature, membranes were washed and incubated with the primary antibodies specific for HIF1A (Cell Signaling Technology), HILPDA(Biorbyt) or GAPDH (Cell Signaling Technology) overnight at 4°C. On the next day, the membranes were washed and incubated with HRP-conjugated secondary antibodies (Thermo Fisher Scientific) for 1 hour at room temperature, and the immunoblotting signal was examined though using Pierce™ ECL substrate. To measure the stability of HIF1A, ex vivo cultured lung CD140a+ MCs were pretreated with vehicle or IL-1β (10 ng/ml) for 24 hours, and then incubated with 25 μM cycloheximide (CHX) for the indicated time points. MCs were then lysed and the HIF1A protein level was quantified by Western blot to reflect the protein stability.
Measurement of TG hydrolase activity
Lung MCs were isolated from naïve or tumor-bearing mice, washed with PBS and lysed in cell extraction buffer (0.25 M sucrose, 1 mM EDTA, 1 mM DTT, pH 7.0) containing protease inhibitor cocktail (MilliporeSigma). Then cell extracts were centrifuged at 12,000 rpm for 20 minutes and supernatant was collected to determinate TG hydrolase activity as described previously 10. Briefly, 25μl cell extracts and 25μl substrate were completely mixed together, and then 0.5 μCi [9,10-3H]-triolein was added and incubated at 37 °C for 1 hour. The reaction was stopped through adding methanol/chloroform/heptane (650μl) and 0.1M potassium carbonate/0.1M boric acid (200μl). After centrifugation at 800g for 25 minutes, the radioactivity in the upper phase was measured by liquid scintillation counting.
Experimental lung metastasis models
To investigate the metastatic colonization ability of tumor cells in AtglΔMCs or HilpdaΔMCs mice, the mice were orthotopically implanted with tumor cells (2 × 10⁵ cells for each mouse). On day 10, the tumor-bearing mice were intravenously (IV) injected with luciferase-labeled tumor cells (1 × 10⁶ cells for each mouse). Lung tissues were harvested on day 24 for ex vivo bioluminescence imaging (BLI).
To investigate the metastasis-initiating potentials of lung MCs-educated tumor cells, the luciferase labelled AT3 (AT3-Luc) cells were cultured with conditioned medium from WT or AtglΔMCs lung CD140a+ MCs. Then the tumor cells were digested, washed, and IV injected into NSG mice (1 × 10⁵ cells for each mouse). On day 7, the mice were anesthetized and intraperitoneally (IP) injected with D-luciferin (150 mg/kg) for the determination of in vivo BLI signal.
To investigate chemoresistant capacities of tumor cells after implanted into WT or AtglΔMCs mice, naïve mice were first IV injected with AT3-Luc cells (1 × 10⁶ cells for each mouse) and 7 days later, the established lung metastasis was examined by in vivo BLI before treatment. Then the mice were IV injected with DOX (5 mg/kg). 2 days after treatment, the lung metastasis was examined with in vivo BLI to determine the survival of metastatic tumor cells.
To investigate the effect of lipid-laden NK cells in controlling lung metastasis, NSG mice were first IV injected with AT3-Luc cells (1 × 10⁵ cells for each mouse), and 24 hours later, the mice were IV injected with primary lung NK cells (5 × 10⁵ cells for each mouse) isolated from naïve WT or AtglΔMCs mice. On day 8, the mice were anesthetized and IP injected with D-luciferin (150 mg/kg) for the determination of in vivo BLI signal. All mice received a maintenance dose of 500 ng of IL-15 daily (IP, from day 1 to day 7) to sustain NK cell survival.
To investigate the therapeutic efficiency of anti-IL-1β in controlling lung metastasis, the mice were orthotopically implanted with AT3 cells (2 × 10⁵ cells for each mouse). On day 8, mice were IP injected with anti-IL-1β or isotype control (2.5 mg/kg) every 3 days for total 6 times. On day 14, the mice were IV injected with AT3-Luc cells (1 × 10⁶ cells for each mouse), and at the end point (day 25), the lung tissues were harvested for ex vivo BLI.
To investigate the combined therapeutic efficacy of anti-IL-1β and adoptive therapy of NK cells in controlling lung metastatic colonization by AT3-Luc cells, NSG mice were first orthotopically implanted with AT3 tumor cells (2 × 10⁵ cells for each mouse). On day 15, the AT3-Luc cells were IV injected (5 × 10⁴ cells for each mouse) into the mice. From day 17 to day 26, the mice were IP injected with anti-IL-1β or isotype control every 3 days for 4 times. On day 20 and day 26, mice were IV injected with NK cells (1 × 10⁶ cells for each mouse). At the end point (day 28), mice were euthanized, and the lung tissues were rapidly harvested for ex vivo BLI. All mice received a maintenance dose of 500 ng of IL-15 daily (IP, from day 20 to day 27) to sustain NK cell survival.
To investigate the combined therapeutic efficacy of anti-IL-1β and adoptive therapy of NK-92 cell lines in controlling lung metastatic colonization by MDA-4175-Luc cells, NSG mice were first orthotopically implanted with MDA-4175 tumor cells (2 × 10⁵ cells for each mouse). On day 25, the luciferase labelled MDA-4175-Luc cells were IV injected (5 × 10⁴ cells for each mouse) into the mice. From day 28 to day 37, the mice were IP injected with anti-IL-1β or isotype control every 3 days for 4 times. On day 31 and day 37, mice were IV injected with NK-92 cells (2 × 10⁶ cells for each mouse). At the end point (day 40), mice were euthanized, and the lung tissues were rapidly harvested for ex vivo BLI.
To investigate the effect of LY294002 in controlling lung metastasis, the mice were orthotopically implanted with AT3 cells (2 × 10⁵ cells for each mouse). On day 10, mice were IP injected with vehicle or LY294002 (10 mg/kg) every 2 days for total 8 times. On day 14, the mice were IV injected with AT3-Luc cells (1 × 10⁶ cells for each mouse), and at the end point (day 25), the lung tissues were harvested for ex vivo BLI.
To investigate the effect of anti-IL-1β in controlling lung metastasis under NK cell deficiency, the mice were orthotopically implanted with AT3 cells (2 × 10⁵ cells for each mouse). On day 8 mice were IP injected with anti-IL-1β (2.5 mg/kg), anti-NK1.1 (1.25 mg/kg) or isotype control every 3 days for total 6 times. On day 14, the mice were IV injected with AT3-Luc cells (5 × 10⁵ cells for each mouse), and at the end point (day 25), the lung tissues were harvested for ex vivo BLI.
Spontaneous lung metastasis models
WT and AtglΔMCs mice were orthotopically implanted with AT3-Luc cells on day 0. 14 days later, the primary tumors were resected. At the endpoint (day 28), mice were euthanized, and the lung tissues were rapidly excised for ex vivo BLI to determine the spontaneous metastasis of tumor cells.
For spontaneous metastasis model in WT MMTV-PyMT and MMTV-PyMT; AtglΔMCs mice, 6-month-old female mice that had spontaneously developed primary mammary tumors were euthanized and lung tissues were harvested for the determination of metastatic nodules and lung tissues were lysed to extract mRNA and the Pymt gene expression was measured.
To determine the effect of anti-IL-1β on controlling spontaneous lung metastasis in the MMTV-PyMT model, 10-week-old female mice with palpable spontaneous mammary tumors received IP injection of anti-IL-1β or isotype control every 3 days for one month. At the endpoint, the mice were euthanized, and spontaneous lung metastases were detected by histological analysis and macroscopic examination.
In vitro NK cell cytotoxicity assay
To measure NK cell cytotoxicity, mouse lung NK cells were isolated form WT or AtglΔMCs naïve mice and human NK-92 cells were pre-treated with control or hu IL-1β-stimulated human lung MCs. Then, CellTracker deep red dye (Thermo Fisher Scientific) labeled tumor target cells were added to NK cells at the indicated ratios and co-cultured for 4 hours. The cells were stained with propidium iodide (PI) and the percentage of dead target cells were measured with flow cytometry.
Extracellular flux assays
To measure the oxygen consumption rate (OCR) of tumor cells, AT3 or E0771 tumor cells were pre-incubated with the CM derived from WT or AtglΔMCs MCs. To measure the OCR of MCs, ex vivo cultured lung MCs were stimulated with vehicle or IL-1β (10 ng/ml) for 24 hours. Cells were then seeded into a 96-well Seahorse plate and maintained in Seahorse XF assay Medium supplemented with 1 mM pyruvate, 2 mM glutamine, and 10 mM glucose. OCR was assessed in response to Oligomycin (Oligo) (1 μM), fluoro-carbonyl cyanide phenylhydrazone (FCCP) (2 μM), and Rotenone/Antimycin (Rot/Ant) (0.5 μM). For the tumor cells, 15 minutes prior to plate loading, vehicle or etomoxir was added at a final concentration of 25 μM. Basal or Max ΔOCR indicates the quantification of change (Δ) in basal or maximal respiration with or without treatment of etomoxir according to the manufacturer’s instructions.
To measure the OCR of NK cells, cells were assayed in Seahorse XF assay Medium supplemented with 1 mM pyruvate, 2 mM glutamine, and 10 mM glucose response to Oligomycin (1 μM), FCCP (2 μM), and Rotenone/Antimycin (0.5 μM). For ECAR, the NK cells were assayed in Seahorse XF assay Medium supplemented with 1 mM glutamine response to glucose (12 mM), oligomycin (2 μM), and 2-deoxy-D-glucose (2-DG) (50 mM).
Illustration Tool
The schematic images are created with BioRender.com.
QUANTIFICATION AND STATISTICAL ANALYSIS
Number of biological replicates, repetitions of the experiments and statistical significance are listed in figure legends. Results are presented as mean ± SEM, and GraphPad Prism software (version 8.2.1) was used for statistical analysis and graphs. The Shapiro-Wilk test was used to evaluate the normal distribution of the data. When only two groups were compared, the unpaired Student’s t-test, paired t-test or Mann-Whitney test, as indicated in figure legends, were used to calculate the statistical significance. When comparing more than two groups with one independent factor, one-way ANOVA was used to calculate the statistical significance. When there were two factors (for example treatment and time) on a dependent variable, two-way ANOVA was used to calculate the statistical significance. Statistical significance is defined as ∗ p < 0.05, ∗∗ p < 0.01, ∗∗∗ p < 0.001, ∗∗∗∗ P < 0.0001, and NS (not significant, P > 0.05).
Supplementary Material
Data S1. Unprocessed source data underlying all blots and graphs. Related to Figures 1–7 and Supplemental Figures 1–7.
HIGHLIGHTS.
Lung mesenchymal cells (MCs) store neutral lipids during breast cancer progression
IL-1β elicits neutral lipid accumulation in lung MCs to foster metastasis
Lipid-laden MCs metabolically reprogram both tumor cells and NK cells
Targeting lipid-laden MCs improves the efficacy of NK cell-based immunotherapy
Acknowledgments
We thank Dr. Scott I. Abrams (Roswell Park Comprehensive Cancer Center) for providing AT3 cells and thank Dr. Yibin Kang (Princeton University) for providing MDA-4175 cells. This work was supported by grants from National Institutes of Health (R00-CA188093, R37-CA237307, R01-CA251433, and P30-CA034196 to G.R., and R24-OD026440 to L.D.S.). Z.G. is supported by the Brooks Scholar Award Program at The Jackson Laboratory. We appreciate Dr. Iiro Taneli Helenius for his critical editing of the manuscript and also acknowledge the contribution of The Jackson Laboratory Scientific Services (Flow cytometry, Genome technologies, Histopathology sciences, Microscopy service, PDX R&D core, and Single cell biology) for expert assistance in this manuscript.
Footnotes
Publisher's Disclaimer: This is a PDF file of an unedited manuscript that has been accepted for publication. As a service to our customers we are providing this early version of the manuscript. The manuscript will undergo copyediting, typesetting, and review of the resulting proof before it is published in its final form. Please note that during the production process errors may be discovered which could affect the content, and all legal disclaimers that apply to the journal pertain.
Declaration of interests
The authors declare no competing of interests.
REFERENCES
- 1.Chaffer CL & Weinberg RA A perspective on cancer cell metastasis. Science 331, 1559–1564 (2011). [DOI] [PubMed] [Google Scholar]
- 2.Massague J & Obenauf AC Metastatic colonization by circulating tumour cells. Nature 529, 298–306 (2016). [DOI] [PMC free article] [PubMed] [Google Scholar]
- 3.Peinado H et al. Pre-metastatic niches: organ-specific homes for metastases. Nat Rev Cancer 17, 302–317 (2017). [DOI] [PubMed] [Google Scholar]
- 4.Psaila B & Lyden D The metastatic niche: adapting the foreign soil. Nat Rev Cancer 9, 285–293 (2009). [DOI] [PMC free article] [PubMed] [Google Scholar]
- 5.Miranda F et al. Salt-Inducible Kinase 2 Couples Ovarian Cancer Cell Metabolism with Survival at the Adipocyte-Rich Metastatic Niche. Cancer Cell 30, 273–289 (2016). [DOI] [PubMed] [Google Scholar]
- 6.Nieman KM et al. Adipocytes promote ovarian cancer metastasis and provide energy for rapid tumor growth. Nat Med 17, 1498–1503 (2011). [DOI] [PMC free article] [PubMed] [Google Scholar]
- 7.Elia I et al. Breast cancer cells rely on environmental pyruvate to shape the metastatic niche. Nature 568, 117–121 (2019). [DOI] [PMC free article] [PubMed] [Google Scholar]
- 8.Christen S et al. Breast Cancer-Derived Lung Metastases Show Increased Pyruvate Carboxylase-Dependent Anaplerosis. Cell Rep 17, 837–848 (2016). [DOI] [PubMed] [Google Scholar]
- 9.Huggins DN et al. Characterizing Macrophage Diversity in Metastasis-Bearing Lungs Reveals a Lipid-Associated Macrophage Subset. Cancer Res 81, 5284–5295 (2021). [DOI] [PMC free article] [PubMed] [Google Scholar]
- 10.Li P et al. Lung mesenchymal cells elicit lipid storage in neutrophils that fuel breast cancer lung metastasis. Nat Immunol 21, 1444–1455 (2020). [DOI] [PMC free article] [PubMed] [Google Scholar]
- 11.Torday JS & Rehan VK On the evolution of the pulmonary alveolar lipofibroblast. Exp Cell Res 340, 215–219 (2016). [DOI] [PMC free article] [PubMed] [Google Scholar]
- 12.McGowan SE & Torday JS The pulmonary lipofibroblast (lipid interstitial cell) and its contributions to alveolar development. Annu Rev Physiol 59, 43–62 (1997). [DOI] [PubMed] [Google Scholar]
- 13.Kyle JE et al. Cell type-resolved human lung lipidome reveals cellular cooperation in lung function. Sci Rep 8, 13455 (2018). [DOI] [PMC free article] [PubMed] [Google Scholar]
- 14.Hao Y et al. Integrated analysis of multimodal single-cell data. Cell 184, 3573–3587 e3529 (2021). [DOI] [PMC free article] [PubMed] [Google Scholar]
- 15.Butler A, Hoffman P, Smibert P, Papalexi E & Satija R Integrating single-cell transcriptomic data across different conditions, technologies, and species. Nat Biotechnol 36, 411–420 (2018). [DOI] [PMC free article] [PubMed] [Google Scholar]
- 16.Tsukui T et al. Collagen-producing lung cell atlas identifies multiple subsets with distinct localization and relevance to fibrosis. Nat Commun 11, 1920 (2020). [DOI] [PMC free article] [PubMed] [Google Scholar]
- 17.Buechler MB et al. Cross-tissue organization of the fibroblast lineage. Nature 593, 575–579 (2021). [DOI] [PubMed] [Google Scholar]
- 18.Travaglini KJ et al. A molecular cell atlas of the human lung from single-cell RNA sequencing. Nature 587, 619–625 (2020). [DOI] [PMC free article] [PubMed] [Google Scholar]
- 19.Varisco BM, Ambalavanan N, Whitsett JA & Hagood JS Thy-1 signals through PPARgamma to promote lipofibroblast differentiation in the developing lung. Am J Respir Cell Mol Biol 46, 765–772 (2012). [DOI] [PMC free article] [PubMed] [Google Scholar]
- 20.Liu Y & Cao X Characteristics and Significance of the Pre-metastatic Niche. Cancer Cell 30, 668–681 (2016). [DOI] [PubMed] [Google Scholar]
- 21.Rebe C & Ghiringhelli F Interleukin-1beta and Cancer. Cancers (Basel) 12 (2020). [DOI] [PMC free article] [PubMed] [Google Scholar]
- 22.Grabner GF, Xie H, Schweiger M & Zechner R Lipolysis: cellular mechanisms for lipid mobilization from fat stores. Nat Metab 3, 1445–1465 (2021). [DOI] [PubMed] [Google Scholar]
- 23.Knight M, Braverman J, Asfaha K, Gronert K & Stanley S Lipid droplet formation in Mycobacterium tuberculosis infected macrophages requires IFN-gamma/HIF-1alpha signaling and supports host defense. PLoS Pathog 14, e1006874 (2018). [DOI] [PMC free article] [PubMed] [Google Scholar]
- 24.Schlager S et al. Adipose triglyceride lipase acts on neutrophil lipid droplets to regulate substrate availability for lipid mediator synthesis. J Leukoc Biol 98, 837–850 (2015). [DOI] [PMC free article] [PubMed] [Google Scholar]
- 25.Missaglia S, Coleman RA, Mordente A & Tavian D Neutral Lipid Storage Diseases as Cellular Model to Study Lipid Droplet Function. Cells 8 (2019). [DOI] [PMC free article] [PubMed] [Google Scholar]
- 26.Zechner R, Kienesberger PC, Haemmerle G, Zimmermann R & Lass A Adipose triglyceride lipase and the lipolytic catabolism of cellular fat stores. J Lipid Res 50, 3–21 (2009). [DOI] [PubMed] [Google Scholar]
- 27.Lass A, Zimmermann R, Oberer M & Zechner R Lipolysis - a highly regulated multi-enzyme complex mediates the catabolism of cellular fat stores. Prog Lipid Res 50, 14–27 (2011). [DOI] [PMC free article] [PubMed] [Google Scholar]
- 28.Cerk IK, Wechselberger L & Oberer M Adipose Triglyceride Lipase Regulation: An Overview. Curr Protein Pept Sci 19, 221–233 (2018). [DOI] [PMC free article] [PubMed] [Google Scholar]
- 29.Mattijssen F et al. Hypoxia-inducible lipid droplet-associated (HILPDA) is a novel peroxisome proliferator-activated receptor (PPAR) target involved in hepatic triglyceride secretion. J Biol Chem 289, 19279–19293 (2014). [DOI] [PMC free article] [PubMed] [Google Scholar]
- 30.Zhang X et al. Inhibition of intracellular lipolysis promotes human cancer cell adaptation to hypoxia. Elife 6 (2017). [DOI] [PMC free article] [PubMed] [Google Scholar]
- 31.Koyasu S, Kobayashi M, Goto Y, Hiraoka M & Harada H Regulatory mechanisms of hypoxia-inducible factor 1 activity: Two decades of knowledge. Cancer Sci 109, 560–571 (2018). [DOI] [PMC free article] [PubMed] [Google Scholar]
- 32.D’Ignazio L, Bandarra D & Rocha S NF-kappaB and HIF crosstalk in immune responses. FEBS J 283, 413–424 (2016). [DOI] [PMC free article] [PubMed] [Google Scholar]
- 33.Chan MC et al. Potent and Selective Triazole-Based Inhibitors of the Hypoxia-Inducible Factor Prolyl-Hydroxylases with Activity in the Murine Brain. PLoS One 10, e0132004 (2015). [DOI] [PMC free article] [PubMed] [Google Scholar]
- 34.Munir R, Lisec J, Swinnen JV & Zaidi N Lipid metabolism in cancer cells under metabolic stress. Br J Cancer 120, 1090–1098 (2019). [DOI] [PMC free article] [PubMed] [Google Scholar]
- 35.Koundouros N & Poulogiannis G Reprogramming of fatty acid metabolism in cancer. Br J Cancer 122, 4–22 (2020). [DOI] [PMC free article] [PubMed] [Google Scholar]
- 36.Li P et al. Dual roles of neutrophils in metastatic colonization are governed by the host NK cell status. Nat Commun 11, 4387 (2020). [DOI] [PMC free article] [PubMed] [Google Scholar]
- 37.Gong Z et al. Lung fibroblasts facilitate pre-metastatic niche formation by remodeling the local immune microenvironment. Immunity 55, 1483–1500 e1489 (2022). [DOI] [PMC free article] [PubMed] [Google Scholar]
- 38.Le Naour A et al. EO771, the first luminal B mammary cancer cell line from C57BL/6 mice. Cancer Cell Int 20, 328 (2020). [DOI] [PMC free article] [PubMed] [Google Scholar]
- 39.Pulaski BA & Ostrand-Rosenberg S Mouse 4T1 breast tumor model. Curr Protoc Immunol Chapter 20, Unit 20 22 (2001). [DOI] [PubMed] [Google Scholar]
- 40.VandeKopple MJ et al. HILPDA Regulates Lipid Metabolism, Lipid Droplet Abundance, and Response to Microenvironmental Stress in Solid Tumors. Mol Cancer Res 17, 2089–2101 (2019). [DOI] [PMC free article] [PubMed] [Google Scholar]
- 41.Torday JS, Sun H & Qin J Prostaglandin E2 integrates the effects of fluid distension and glucocorticoid on lung maturation. Am J Physiol 274, L106–111 (1998). [DOI] [PubMed] [Google Scholar]
- 42.Torday J, Hua J & Slavin R Metabolism and fate of neutral lipids of fetal lung fibroblast origin. Biochim Biophys Acta 1254, 198–206 (1995). [DOI] [PubMed] [Google Scholar]
- 43.Brown A, Kumar S & Tchounwou PB Cisplatin-Based Chemotherapy of Human Cancers. J Cancer Sci Ther 11 (2019). [PMC free article] [PubMed] [Google Scholar]
- 44.Anampa J, Makower D & Sparano JA Progress in adjuvant chemotherapy for breast cancer: an overview. BMC Med 13, 195 (2015). [DOI] [PMC free article] [PubMed] [Google Scholar]
- 45.Siegel MB et al. Integrated RNA and DNA sequencing reveals early drivers of metastatic breast cancer. J Clin Invest 128, 1371–1383 (2018). [DOI] [PMC free article] [PubMed] [Google Scholar]
- 46.Zhang XH et al. Latent bone metastasis in breast cancer tied to Src-dependent survival signals. Cancer Cell 16, 67–78 (2009). [DOI] [PMC free article] [PubMed] [Google Scholar]
- 47.Ohs I et al. Restoration of Natural Killer Cell Antimetastatic Activity by IL12 and Checkpoint Blockade. Cancer Res 77, 7059–7071 (2017). [DOI] [PubMed] [Google Scholar]
- 48.Paolino M et al. The E3 ligase Cbl-b and TAM receptors regulate cancer metastasis via natural killer cells. Nature 507, 508–512 (2014). [DOI] [PMC free article] [PubMed] [Google Scholar]
- 49.Xu S et al. Uptake of oxidized lipids by the scavenger receptor CD36 promotes lipid peroxidation and dysfunction in CD8(+) T cells in tumors. Immunity 54, 1561–1577 e1567 (2021). [DOI] [PMC free article] [PubMed] [Google Scholar]
- 50.Poznanski SM et al. Metabolic flexibility determines human NK cell functional fate in the tumor microenvironment. Cell Metab 33, 1205–1220 e1205 (2021). [DOI] [PubMed] [Google Scholar]
- 51.Tomita K et al. Lipid peroxidation increases hydrogen peroxide permeability leading to cell death in cancer cell lines that lack mtDNA. Cancer Sci 110, 2856–2866 (2019). [DOI] [PMC free article] [PubMed] [Google Scholar]
- 52.O’Brien KL & Finlay DK Immunometabolism and natural killer cell responses. Nat Rev Immunol 19, 282–290 (2019). [DOI] [PubMed] [Google Scholar]
- 53.Weichhart T, Hengstschlager M & Linke M Regulation of innate immune cell function by mTOR. Nat Rev Immunol 15, 599–614 (2015). [DOI] [PMC free article] [PubMed] [Google Scholar]
- 54.Michelet X et al. Metabolic reprogramming of natural killer cells in obesity limits antitumor responses. Nat Immunol 19, 1330–1340 (2018). [DOI] [PubMed] [Google Scholar]
- 55.Flaherty SE 3rd et al. A lipase-independent pathway of lipid release and immune modulation by adipocytes. Science 363, 989–993 (2019). [DOI] [PMC free article] [PubMed] [Google Scholar]
- 56.Zhang M et al. Adipocyte-Derived Lipids Mediate Melanoma Progression via FATP Proteins. Cancer Discov 8, 1006–1025 (2018). [DOI] [PMC free article] [PubMed] [Google Scholar]
- 57.Alicea GM et al. Changes in Aged Fibroblast Lipid Metabolism Induce Age-Dependent Melanoma Cell Resistance to Targeted Therapy via the Fatty Acid Transporter FATP2. Cancer Discov 10, 1282–1295 (2020). [DOI] [PMC free article] [PubMed] [Google Scholar]
- 58.Dai J et al. Exosomes: key players in cancer and potential therapeutic strategy. Signal Transduct Target Ther 5, 145 (2020). [DOI] [PMC free article] [PubMed] [Google Scholar]
- 59.Mulcahy LA, Pink RC & Carter DR Routes and mechanisms of extracellular vesicle uptake. J Extracell Vesicles 3 (2014). [DOI] [PMC free article] [PubMed] [Google Scholar]
- 60.Rejman J, Bragonzi A & Conese M Role of clathrin- and caveolae-mediated endocytosis in gene transfer mediated by lipo- and polyplexes. Mol Ther 12, 468–474 (2005). [DOI] [PubMed] [Google Scholar]
- 61.Commisso C et al. Macropinocytosis of protein is an amino acid supply route in Ras-transformed cells. Nature 497, 633–637 (2013). [DOI] [PMC free article] [PubMed] [Google Scholar]
- 62.Kim SM et al. PTEN Deficiency and AMPK Activation Promote Nutrient Scavenging and Anabolism in Prostate Cancer Cells. Cancer Discov 8, 866–883 (2018). [DOI] [PMC free article] [PubMed] [Google Scholar]
- 63.Kim N et al. BMP-dependent synaptic development requires Abi-Abl-Rac signaling of BMP receptor macropinocytosis. Nat Commun 10, 684 (2019). [DOI] [PMC free article] [PubMed] [Google Scholar]
- 64.Kaplanov I et al. Blocking IL-1beta reverses the immunosuppression in mouse breast cancer and synergizes with anti-PD-1 for tumor abrogation. Proc Natl Acad Sci U S A 116, 1361–1369 (2019). [DOI] [PMC free article] [PubMed] [Google Scholar]
- 65.Shin MH et al. NK Cell-Based Immunotherapies in Cancer. Immune Netw 20, e14 (2020). [DOI] [PMC free article] [PubMed] [Google Scholar]
- 66.Myers JA & Miller JS Exploring the NK cell platform for cancer immunotherapy. Nat Rev Clin Oncol 18, 85–100 (2021). [DOI] [PMC free article] [PubMed] [Google Scholar]
- 67.Baker KJ, Houston A & Brint E IL-1 Family Members in Cancer; Two Sides to Every Story. Front Immunol 10, 1197 (2019). [DOI] [PMC free article] [PubMed] [Google Scholar]
- 68.Gelfo V et al. Roles of IL-1 in Cancer: From Tumor Progression to Resistance to Targeted Therapies. Int J Mol Sci 21 (2020). [DOI] [PMC free article] [PubMed] [Google Scholar]
- 69.Nkadi PO, Merritt TA & Pillers DA An overview of pulmonary surfactant in the neonate: genetics, metabolism, and the role of surfactant in health and disease. Mol Genet Metab 97, 95–101 (2009). [DOI] [PMC free article] [PubMed] [Google Scholar]
- 70.Agudelo CW, Samaha G & Garcia-Arcos I Alveolar lipids in pulmonary disease. A review. Lipids Health Dis 19, 122 (2020). [DOI] [PMC free article] [PubMed] [Google Scholar]
- 71.Autilio C & Perez-Gil J Understanding the principle biophysics concepts of pulmonary surfactant in health and disease. Arch Dis Child Fetal Neonatal Ed 104, F443–F451 (2019). [DOI] [PubMed] [Google Scholar]
- 72.Whitsett JA, Wert SE & Weaver TE Diseases of pulmonary surfactant homeostasis. Annu Rev Pathol 10, 371–393 (2015). [DOI] [PMC free article] [PubMed] [Google Scholar]
- 73.Milad N & Morissette MC Revisiting the role of pulmonary surfactant in chronic inflammatory lung diseases and environmental exposure. Eur Respir Rev 30 (2021). [DOI] [PMC free article] [PubMed] [Google Scholar]
- 74.Meyer KC & Zimmerman JJ Inflammation and surfactant. Paediatr Respir Rev 3, 308–314 (2002). [DOI] [PubMed] [Google Scholar]
- 75.Wright TW, Notter RH, Wang Z, Harmsen AG & Gigliotti F Pulmonary inflammation disrupts surfactant function during Pneumocystis carinii pneumonia. Infect Immun 69, 758–764 (2001). [DOI] [PMC free article] [PubMed] [Google Scholar]
- 76.Eggers LF et al. Lipidomes of lung cancer and tumour-free lung tissues reveal distinct molecular signatures for cancer differentiation, age, inflammation, and pulmonary emphysema. Sci Rep 7, 11087 (2017). [DOI] [PMC free article] [PubMed] [Google Scholar]
- 77.Petan T, Jarc E & Jusovic M Lipid Droplets in Cancer: Guardians of Fat in a Stressful World. Molecules 23 (2018). [DOI] [PMC free article] [PubMed] [Google Scholar]
- 78.Pascual G et al. Targeting metastasis-initiating cells through the fatty acid receptor CD36. Nature 541, 41–45 (2017). [DOI] [PubMed] [Google Scholar]
- 79.Alexandrov T Spatial Metabolomics and Imaging Mass Spectrometry in the Age of Artificial Intelligence. Annu Rev Biomed Data Sci 3, 61–87 (2020). [DOI] [PMC free article] [PubMed] [Google Scholar]
- 80.Marx V Method of the Year: spatially resolved transcriptomics. Nat Methods 18, 9–14 (2021). [DOI] [PubMed] [Google Scholar]
- 81.Sheoran S, Arora S, Samsonraj R, Govindaiah P & Vuree S Lipid-based nanoparticles for treatment of cancer. Heliyon 8, e09403 (2022). [DOI] [PMC free article] [PubMed] [Google Scholar]
- 82.Garcia-Pinel B et al. Lipid-Based Nanoparticles: Application and Recent Advances in Cancer Treatment. Nanomaterials (Basel) 9 (2019). [DOI] [PMC free article] [PubMed] [Google Scholar]
- 83.Xie G et al. CAR-NK cells: A promising cellular immunotherapy for cancer. EBioMedicine 59, 102975 (2020). [DOI] [PMC free article] [PubMed] [Google Scholar]
- 84.Lu H, Zhao X, Li Z, Hu Y & Wang H From CAR-T Cells to CAR-NK Cells: A Developing Immunotherapy Method for Hematological Malignancies. Front Oncol 11, 720501 (2021). [DOI] [PMC free article] [PubMed] [Google Scholar]
- 85.Marofi F et al. CAR T cells in solid tumors: challenges and opportunities. Stem Cell Res Ther 12, 81 (2021). [DOI] [PMC free article] [PubMed] [Google Scholar]
- 86.Rodriguez-Garcia A, Palazon A, Noguera-Ortega E, Powell DJ Jr. & Guedan S CAR-T Cells Hit the Tumor Microenvironment: Strategies to Overcome Tumor Escape. Front Immunol 11, 1109 (2020). [DOI] [PMC free article] [PubMed] [Google Scholar]
- 87.Kirtane K, Elmariah H, Chung CH & Abate-Daga D Adoptive cellular therapy in solid tumor malignancies: review of the literature and challenges ahead. J Immunother Cancer 9 (2021). [DOI] [PMC free article] [PubMed] [Google Scholar]
- 88.Pitt JM et al. Targeting the tumor microenvironment: removing obstruction to anticancer immune responses and immunotherapy. Ann Oncol 27, 1482–1492 (2016). [DOI] [PubMed] [Google Scholar]
- 89.Tormoen GW, Crittenden MR & Gough MJ Role of the immunosuppressive microenvironment in immunotherapy. Adv Radiat Oncol 3, 520–526 (2018). [DOI] [PMC free article] [PubMed] [Google Scholar]
- 90.Labani-Motlagh A, Ashja-Mahdavi M & Loskog A The Tumor Microenvironment: A Milieu Hindering and Obstructing Antitumor Immune Responses. Front Immunol 11, 940 (2020). [DOI] [PMC free article] [PubMed] [Google Scholar]
- 91.Tulotta C et al. IL-1B drives opposing responses in primary tumours and bone metastases; harnessing combination therapies to improve outcome in breast cancer. NPJ Breast Cancer 7, 95 (2021). [DOI] [PMC free article] [PubMed] [Google Scholar]
- 92.Castano Z et al. IL-1beta inflammatory response driven by primary breast cancer prevents metastasis-initiating cell colonization. Nat Cell Biol 20, 1084–1097 (2018). [DOI] [PMC free article] [PubMed] [Google Scholar]
- 93.Campeau E et al. A versatile viral system for expression and depletion of proteins in mammalian cells. PLoS One 4, e6529 (2009). [DOI] [PMC free article] [PubMed] [Google Scholar]
- 94.Gong Z, Li Q, Shi J & Ren G An Artifact in Intracellular Cytokine Staining for Studying T Cell Responses and Its Alleviation. Front Immunol 13, 759188 (2022). [DOI] [PMC free article] [PubMed] [Google Scholar]
- 95.Stuart T et al. Comprehensive Integration of Single-Cell Data. Cell 177, 1888–1902 e1821 (2019). [DOI] [PMC free article] [PubMed] [Google Scholar]
- 96.Zhou Y et al. Metascape provides a biologist-oriented resource for the analysis of systems-level datasets. Nat Commun 10, 1523 (2019). [DOI] [PMC free article] [PubMed] [Google Scholar]
Associated Data
This section collects any data citations, data availability statements, or supplementary materials included in this article.
Supplementary Materials
Data S1. Unprocessed source data underlying all blots and graphs. Related to Figures 1–7 and Supplemental Figures 1–7.
Data Availability Statement
The human lung lipidomic data used here are from LMEX0000001622 in LungMAP (https://www.lungmap.net/). The human RNA-seq data are from GSE110590 and GSE14018. The bulk RNA-seq data from ex vivo cultured lung MCs are from E-MTAB-11887. The scRNA-seq data generated from this study were deposited in public data repositories (E-MTAB-11902). All accession numbers are listed in the KEY RESOURCES TABLE. Original data for creating all graphs in the paper are provided in Data S1.
The current study does not report original code.
Any additional information required to reanalyze the data reported in this paper is available from the lead contact upon reasonable request.
Key resources table
| REAGENT or RESOURCE | SOURCE | IDENTIFIER |
|---|---|---|
| Antibodies | ||
| Alexa Fluor® 700 anti-mouse CD45 (Clone 30-F11) | BioLegend | Cat# 103128; RRID: AB_493715 |
| PE/Cyanine7 anti-mouse CD31 (Clone 390) | BioLegend | Cat# 102418; RRID: AB_830757 |
| APC/Fire™ 750 anti-mouse CD326 (Clone G8.8) | BioLegend | Cat# 118229; RRID: AB_2629757 |
| Brilliant Violet 421™ anti-mouse CD140a (Clone APA5) | BioLegend | Cat# 135923; RRID: AB_2814036 |
| PE/Cyanine5 anti-mouse Ly-6A/E (Clone D7) | BioLegend | Cat# 108109; RRID: AB_313346 |
| Brilliant Violet 650™ anti-mouse/human CD11b (Clone M1/70) | BioLegend | Cat# 101259; RRID: AB_2566568 |
| PerCP/Cyanine5.5 anti-mouse CD3ε (Clone 145–2C11) | BioLegend | Cat# 100328; RRID: AB_893318 |
| PE/Cyanine5 anti-mouse CD4 (Clone RM4–5) | BioLegend | Cat# 100514; RRID: AB_312717 |
| Brilliant Violet 650™ anti-mouse CD8a (Clone 53–6.7) | BioLegend | Cat# 100742; RRID: AB_2563056 |
| Alexa Fluor® 647 anti-mouse NK-1.1 (Clone PK136) | BioLegend | Cat# 108720; RRID: AB_2132713 |
| Brilliant Violet 711™ anti-mouse IFN-γ (Clone: XMG1.2) | BioLegend | Cat# 505836; RRID: AB_2650928 |
| PE/Cyanine7 anti-human/mouse Granzyme B (Clone QA16A02) | BioLegend | Cat# 372214; RRID: AB_2728381 |
| PE anti-mouse Perforin (Clone S16009A) | BioLegend | Cat# 154306; RRID: AB_2721639 |
| PE/Cyanine7 anti-mouse Ki-67 (Clone: 16A8) | BioLegend | Cat# 652425; RRID: AB_2632693 |
| CD9 (Clone: KMC8) | Thermo Fisher Scientific | Cat# 14–0091-82; RRID: AB_823138 |
| CD63 (Clone: 446703) | R&D Systems | Cat# MAB5417-SP; RRID: AB_2076610 |
| CD81 (Clone: 431301) | R&D Systems | Cat# MAB4865-SP; RRID: AB_2275889 |
| α-Smooth Muscle-FITC (Clone: 1A4) | Sigma-Aldrich | Cat# F3777; RRID: AB_476977 |
| Cleaved Caspase-3 (Asp175) | Cell Signaling Technology | Cat# 9661S; RRID: AB_2341188 |
| PE anti-mouse/human CD11b (Clone: M1/70) | BioLegend | Cat# 101207; RRID: AB_312790 |
| Alexa Fluor® 647 anti-mouse Ly-6G (Clone: 1A8) | BioLegend | Cat# 127610; RRID: AB_1134159 |
| CCL2 (MCP-1) | Thermo Fisher Scientific | Cat# PA5–115555; RRID: AB_2893318 |
| Phospho-S6 (Ser235/236) (Rabbit) | Cell Signaling Technology | Cat# 5316S; RRID: AB_10694989 |
| CD82 | Thermo Fisher Scientific | Cat# PA5–13228; RRID: AB_2244577 |
| HIF-1 alpha (Clone: ESEE122) | Thermo Fisher Scientific | Cat# 14–9100-82; RRID: AB_11217480 |
| HILPDA | Biorbyt | Cat# orb389656 |
| GAPDH | Cell Signaling Technology | Cat# 5174S; RRID: AB_10622025 |
| CD161c/NK1.1 | Thermo Fisher Scientific | Cat# BS-4682R; RRID: AB_11092712 |
| PE anti-mouse CD45 (Clone QA17A26) | BioLegend | Cat# 157603; RRID: AB_2876536 |
| eFluor™ 660 anti-mouse CD11b (Clone M1/70) | Thermo Fisher Scientific | Cat# 50–0112-82; RRID: AB_11218507 |
| Goat anti-Rabbit IgG (H+L) Secondary Antibody, HRP | Thermo Fisher Scientific | Cat# 31460; RRID: AB_228341 |
| Goat anti-Mouse IgG (H+L) Secondary Antibody, HRP | Thermo Fisher Scientific | Cat# 31430; RRID: AB_228307 |
| Goat anti-Rat IgG (H+L) Secondary Antibody, HRP | Thermo Fisher Scientific | Cat# 31470; RRID: AB_228356 |
| Goat anti Rabbit IgG (H+L) Secondary Antibody, Alexa Fluor 594 | Thermo Fisher Scientific | Cat# A11037; RRID: AB_2534095 |
| Anti-mouse NK1.1 (Clone: PK136) | Bio X Cell | Cat# BE0036; RRID: AB_1107737 |
| Mouse IgG2a isotype control (Clone: C1.18.4) | Bio X Cell | Cat# BE0085; RRID: AB_1107771 |
| Polyclonal Armenian hamster IgG | Bio X Cell | Cat# BE0091; RRID: AB_1107773 |
| Anti-mouse IL-1β (Clone B122) | Bio X Cell | Cat# BE0246; RRID: AB_2687727 |
| Bacterial and virus strains | ||
| Biological samples | ||
| Chemicals, peptides, and recombinant proteins | ||
| Collagenase, Type IV, powder | Worthington Biochemical | Cat# LS004188 |
| Dnase I | MilliporeSigma | Cat# DN25 |
| LIVE/DEAD™ Fixable Aqua Dead Cell Stain | Thermo Fisher Scientific | Cat# L34966 |
| BODIPY 493/503 | Thermo Fisher Scientific | Cat# D3922 |
| BODIPY FL C16 | Thermo Fisher Scientific | Cat# D3821 |
| LipidTOX Red | Thermo Fisher Scientific | Cat# H34476 |
| LysoTracker™ Red DND-99 | Thermo Fisher Scientific | Cat # L7528 |
| Recombinant Murine IL-1β | PeproTech | Cat# 211–11B |
| Human IL-1β | Invivogen | Cat# rcyec-hil1b |
| Recombinant Human IL-1RA | BioLegend | Cat# 553902 |
| Recombinant Murine IL-12 p70 | PeproTech | Cat# 210–12 |
| Recombinant Murine IL-15 | PeproTech | Cat# 210–15 |
| Recombinant Mouse IL-18 | BioLegend | Cat# 767002 |
| Recombinant Murine CCL2 | PeproTech | Cat# 250–10 |
| D-Luciferin Firefly, potassium salt | Gold Biotechnology | Cat# LUCK |
| Doxorubicin hydrochloride | MilliporeSigma | Cat# PHR1789 |
| Cisplatin | MilliporeSigma | Cat# PHR1624 |
| Paclitaxel | MilliporeSigma | Cat# PHR1803 |
| Prostaglandin E2 | Cayman Chemical | Cat# 14010 |
| Etomoxir | Cayman Chemical | Cat# 11969 |
| IOX4 | Cayman Chemical | Cat# 18181 |
| PX-478 | Cayman Chemical | Cat# 10005189 |
| Atglistatin | Cayman Chemical | Cat# 15284 |
| BAY 59–9435 | MedChem Express | Cat# HY-102056 |
| JZL184 | Cayman Chemical | Cat# 13158 |
| SN50 Peptide | Cayman Chemical | Cat# 17493 |
| MLN120B | Cayman Chemical | Cat# 32819 |
| BAY 11–7082 | Cayman Chemical | Cat# 10010266 |
| Cycloheximide | Cayman Chemical | Cat# 14126 |
| LY294002 | Cayman Chemical | Cat# 70920 |
| Genistein | Millipore Sigma | Cat# G6649 |
| Chlorpromazine | Cayman Chemical | Cat# 16129 |
| Critical commercial assays | ||
| Mouse IL-1 beta/IL-1F2 Quantikine ELISA Kit, 2 Plate | R&D Systems | Cat# MLB00C |
| Mouse CCL2/JE/MCP-1 Quantikine ELISA Kit | R&D Systems | Cat# MJE00B |
| Proteome Profiler Mouse XL Cytokine Array | R&D Systems | Cat# ARY028 |
| Prostaglandin E2 Parameter Assay Kit | R&D Systems | Cat# KGE004B |
| Triglyceride Colorimetric Assay Kit | Cayman Chemical | Cat# 10010303 |
| Lipase Activity Assay Kit | Cayman Chemical | Cat# 700640 |
| Free Fatty Acid Fluorometric Assay Kit | Cayman Chemical | Cat# 700310 |
| Glucose Colorimetric Detection Kit | Thermo Fisher Scientific | Cat# EIAGLUC |
| L-Amino Acid Quantitation Kit | Millipore Sigma | Cat# MAK002–1KT |
| Diacylglycerol Assay Kit | Abcam | Cat# ab242293 |
| Phosphatidylcholine Assay Kit | Abcam | Cat# ab83377 |
| Phosphatidylethanolamine Assay Kit | Abcam | Cat# ab241005 |
| Phosphatidylglycerol Assay Kit | Abcam | Cat# ab273288 |
| Phosphatidylinositol Assay Kit | Abcam | Cat# ab252900 |
| Sphingomyelin Quantification Colorimetric Assay Kit | Abcam | Cat# ab287856 |
| Lipid Hydroperoxide (LPO) Assay Kit | Cayman Chemical | Cat# 705002 |
| PKH26 Red Fluorescent Cell Linker Mini Kit | MilliporeSigma | Cat# MINI26–1KT |
| Invitrogen™ Total Exosome Isolation Reagent | Thermo Fisher Scientific | Cat# 44–783-59 |
| Direct-zol RNA Miniprep Plus w/ TRI Reagent | Zymo | Cat# R2073 |
| High-Capacity cDNA Reverse Transcription Kit | Thermo Fisher Scientific | Cat# 4368814 |
| PowerUp SYBR™ Green PCR Master Mix | Thermo Fisher Scientific | Cat# A25778 |
| Deposited data | ||
| RNA-seq data of ex vivo cultured lung MCs | Reference 37 | ArrayExpress: E-MTAB-11887 |
| scRNA-seq data of lung CD140a+ MCs | This paper | ArrayExpress: E-MTAB-11902 |
| RNA-seq data of lung metastases and matched primary tumors | Reference 45 | GEO: GSE110590 |
| RNA-seq data of lung metastases and other organ metastases | Reference 46 | GEO: GSE14018 |
| Data S1 – Source Data | This study | N/A |
| Experimental models: Cell lines | ||
| 4T1 | ATCC | Cat# CRL2539 |
| AT3 | Gift from S.I. Abrams | N/A |
| E0771 | CH3 Biosystems | Cat# 940001 |
| YAC-1 | ATCC | Cat# TIB-160 |
| NK-92MI | ATCC | Cat# CRL2408 |
| K562 | ATCC | Cat# CCL243 |
| MDA-4175 | Gift from Y. Kang | N/A |
| 4T1-Luc | Reference 10 | N/A |
| AT3-Luc | Reference 10 | N/A |
| E0771-Luc | Reference 10 | N/A |
| MDA-4175-Luc | This paper | N/A |
| AT3-mCherry | Reference 10 | N/A |
| Human lung mesenchymal cells | Sciencell | Cat# 7540 |
| Experimental models: Organisms/strains | ||
| C57BL/6J | The Jackson Laboratory | JAX: 000664 |
| BALB/cJ | The Jackson Laboratory | JAX: 000651 |
| NSG: NOD.Cg-Prkdcscid Il2rgtm1Wjl/SzJ | The Jackson Laboratory | JAX: 005557 |
| CD140aEGFP: B6.129S4-Pdgfratm11(EGFP)Sor/J | The Jackson Laboratory | JAX: 007669 |
| Atglflox/flox (B6N.129S-Pnpla2tm1Eek/J) | The Jackson Laboratory | JAX: 024278 |
| Hilpdaflox/flox (Hilpdatm1.1Nat/J) | The Jackson Laboratory | JAX: 017360 |
| Hif1aflox/flox (B6.129-Hif1atm3Rsjo/J) | The Jackson Laboratory | JAX: 007561 |
| PdgfraCre: C57BL/6-Tg(Pdgfra-cre)1Clc/J | The Jackson Laboratory | JAX: 013148 |
| PdgfraCre; Atglflox/flox | This paper | N/A |
| PdgfraCre; Hilpdaflox/flox | This paper | N/A |
| PdgfraCre; Hif1aflox/flox | This paper | N/A |
| PdgfaCre; Atglflox/flox; MMTV | This paper | N/A |
| MMTV-PyMT: B6.FVB-Tg(MMTV-PyVT)634Mul/LellJ | The Jackson Laboratory | JAX: 022974 |
| FVB/N-Tg(MMTV-PyVT)634Mul/J | The Jackson Laboratory | JAX: 002374 |
| Il1r1−/−: B6.129S7-Il1r1tm1Imx/J | The Jackson Laboratory | JAX: 003245 |
| Oligonucleotides | ||
| See Table S1 for primer sequences | ||
| Recombinant DNA | ||
| pLenti CMV Puro LUC (w168–1) | Reference 93 | Addgene# 17477 |
| pLV-mCherry | Tsoulfas lab | Addgene# 36084 |
| Software and algorithms | ||
| BD FACSDiva software | BD Biosciences | https://www.bdbiosciences.com/ |
| FlowJo (version 10.8.0) | BD Biosciences | https://flowjo.com |
| R (version 4.0.2) | The R Foundation | https://www.r-project.org/ |
| Seurat (version 3.2.2) | Satija Lab | https://satijalab.org/seurat/ |
| Metascape | Reference 96 | https://metascape.org/ |
| LungMAP | LungMAP | https://www.lungmap.net/ |
| GraphPad Prism (version 8.2.1) | GraphPad Software | https://www.graphpad.com/ |
| Biorender | Biorender | https://biorender.com/ |
| ImageJ (1.53c) | ImageJ | https://imagej.nih.gov/ij/ |
| Other | ||